star formation and dust extinction properties of local … · · 2011-06-14star formation and...
TRANSCRIPT
A&A 514, A4 (2010)DOI: 10.1051/0004-6361/200913476c© ESO 2010
Astronomy&
AstrophysicsScience with AKARI Special feature
Star formation and dust extinction properties of local galaxiesfrom the AKARI-GALEX all-sky surveys
First results from the most secure multiband samplefrom the far-ultraviolet to the far-infrared
T. T. Takeuchi1, V. Buat2, S. Heinis3, E. Giovannoli2, F.-T. Yuan4,J. Iglesias-Páramo5, K. L. Murata4, and D. Burgarella2
1 Institute for Advanced Research, Nagoya University, Furo-cho, Chikusa-ku, Nagoya 464–8601, Japane-mail: [email protected]
2 Laboratoire d’Astrophysique de Marseille, OAMP, Université Aix-Marseille, CNRS, 38 rue Frédéric Joliot-Curie,13388 Marseille Cedex 13, Francee-mail: [veronique.buat;elodie.giovannoli;denis.burgarella]@oamp.fr
3 Department of Physics & Astronomy, The Johns Hopkins University, 3701 San Martin Drive, Baltimore, MD 21218, USAe-mail: [email protected]
4 Division of Particle and Astrophysical Science, Nagoya University, Furo-cho, Chikusa-ku, Nagoya 464–8602, Japane-mail: [yuan.fangting;murata.katsuhiro]@g.mbox.nagoya-u.ac.jp
5 Instituto de Astrofísica de Andalucía (IAA, CSIC), Camino Bajo de Huétor 50, 18008 Granada, Spaine-mail: [email protected]
Received 15 October 2009 / Accepted 21 December 2009
ABSTRACT
Aims. We explore spectral energy distributions (SEDs), star formation (SF), and dust extinction properties of galaxies in the LocalUniverse.Methods. The AKARI all-sky survey provided the first bright point source catalog detected at 90 μm. Beginning with this catalog, weselected galaxies by matching the AKARI sources with those in the IRAS point source catalog redshift survey. We measured the totalGALEX FUV and NUV flux densities with a photometry software we specifically developed for this purpose. In a further step wematched this sample with the Sloan digital sky survey (SDSS) and 2 micron all sky survey (2MASS) galaxies. With this procedure weobtained a basic sample which consists of 776 galaxies. After removing objects whose photometry was contaminated by foregroundsources (mainly in the SDSS), we defined the “secure sample” which contains 607 galaxies.Results. The sample galaxies have redshifts of <∼0.15, and their 90-μm luminosities range from 106 to 1012 L�, with a peak at 1010 L�.The SEDs display a large variety, especially more than four orders of magnitude at the mid-far-infrared (M-FIR), but if we sort thesample with respect to 90 μm, the average SED shows a coherent trend: the more luminous an SED at 90 μm, the redder the globalSED becomes. The Mr−NUV−r color−magnitude relation of our sample does not show bimodality, and the distribution is centered onthe green valley. We established formulae to convert the FIR luminosity from the AKARI bands to the total IR (TIR) luminosity LTIR.The luminosity related to the SF activity (LSF) is dominated by LTIR even if we take into account the FIR emission from dust heatedby old stars. At a high SF rate (SFR) (>20 M� yr−1), the fraction of the directly visible SFR, SFRFUV, decreases. We also estimatedthe FUV attenuation AFUV from the FUV-to-TIR luminosity ratio. We examined the LTIR/LFUV-UV slope (FUV−NUV) relation. Themajority of the sample has LTIR/LFUV ratios five to ten times lower than expected from the local starburst relation, while some luminousIR and all the ultraluminous IR galaxies of this sample have higher LTIR/LFUV ratios. We found the attenuation indicator LTIR/LFUV
correlated to the stellar mass of galaxies, M∗, but not with a specific SFR, SFR/M∗.Conclusions. Together, these results show that the AKARI survey gives a representative sample of the local SF galaxies which willbe a comprehensive local standard of their various properties to be compared with, for instance, high-z SF galaxies.
Key words. dust, extinction – infrared: galaxies – ultraviolet: galaxies – galaxies: evolution – galaxies: starburst – stars: formation
1. Introduction
Star formation history of galaxies is one of the most importantand exciting topics in extragalactic astrophysics and observa-tional cosmology. Especially exploring the “true” absolute valueof the cosmic star formation rate (SFR) has been of a centralimportance.
However, it remained difficult for a long time because of dustextinction. Even in the Local Universe, there are some problemsto overcome to estimate the absolute value of the SFR density
because of a different dependence of various SFR estimators ondust attenuation (e.g. Hopkins & Beacom 2006, and referencestherein). Active star formation (SF) always comes along withdust production because of various dust grain formation pro-cesses related to the final stage of stellar evolution (e.g. Dwek& Scalo 1980; Dwek 1998; Nozawa et al. 2003; Takeuchi et al.2005c). Observationally the SFR of galaxies is measured by theultraviolet (UV) luminosity of massive stars because of theirshort lifetime (∼108 yr) compared with the age of galaxies orthe Universe. However, the UV photons are easily scattered
Article published by EDP Sciences Page 1 of 13
A&A 514, A4 (2010)
and absorbed by dust grains. Hence the SFR of galaxies is al-ways inevitably affected by dust which is produced by theirSF activity. Since the absorbed energy is re-emitted at far-infrared (FIR) wavelengths, it is essential to observe galaxiesboth at the UV and the FIR to have an unbiased view of their SF(e.g. Buat et al. 2005; Seibert et al. 2005; Cortese et al. 2006;Takeuchi et al. 2005a).
To know the history of the SFR in the Universe, we mustknow the starting reference value, i.e. the SFR density in theLocal Universe: otherwise we cannot define how much largerthe SFR was in the past. However, since the volume of the LocalUniverse is limited by definition, an all-sky survey is the onlyviable way to refine our knowledge of local galaxies. On the“directly visible SF” side the advent of the UV surveyor-typesatellite GALEX (Martin et al. 2005) has changed the situationof UV astronomy drastically. GALEX is performing an all-skysurvey (all sky imaging survey: AIS) at FUV (1530 Å) and NUV(2300 Å) with detection limits of 19.9 and 20.8 mag (Morrisseyet al. 2007), as well as deep surveys in some selected regions.In a previous study we showed that GALEX AIS provides uswith an unprecedented opportunity to explore the visible SF inthe Local Universe (Buat et al. 2007a).
As for the “hidden” side of SF, IRAS (Neugebauer et al.1984) has brought a vast amount of statistics of dusty galaxies inthe Local Universe in the IRAS point source catalog (PSC) (seee.g. Soifer et al. 1987). Subsequently FIR facilities with muchhigher sensitivity have been launched, like ISO (e.g. Genzel &Cesarsky 2000; Verma et al. 2005) and Spitzer (e.g. Soifer et al.2008), and revealed the deep IR universe, but the latter two wereobservatories dedicated to pointed observations.
In contrast to the latter two facilities, the Japanese IR satelliteAKARI has performed various large-area surveys at IR wave-lengths (Murakami et al. 2007) after IRAS, especially includingall-sky surveys at the FIR and MIR. In particular, with the aidof the far-infrared surveyor (FIS: Kawada et al. 2007) onboard,various IR surveys were performed by AKARI. AKARI FIS hasfour FIR wavebands centered on 65, 90, 140, and 160 μm, and aFIR all-sky survey was completed by this instrument. Since thelatter two bands are longer than 100 μm, which was the longestwavelength band of IRAS, the obtained sample of dusty galax-ies is less biased than the IRAS sample, i.e. thanks to the bettersensitivity to cooler dust than IRAS, AKARI can detect galax-ies which emit dust continuum radiation with lower tempera-tures. In addition to these SF-related wavelengths, we need othervarious wavelength bands to examine the physical properties ofgalaxies, as for instance stellar mass closely related to near-IR(NIR) and intermediate stellar population related to optical. Forthe former we have a set of all-sky data from the 2-micron all-sky survey (2MASS: Skrutskie et al. 2006), and for the latter, theSDSS final data (DR7) are publicly available1, even if SDSS isnot an all-sky survey.
We constructed a multiband galaxy catalog based on theAKARI all-sky survey 90-μm selected sources associated withIRAS PSCz galaxies (Saunders et al. 2000). Then we mea-sured the GALEX FUV and NUV flux densities and associatedSDSS and 2MASS photometries. For this initial study, we haveonly selected “secure” galaxies with good photometric measure-ments for most of the bands. We present the sample constructionin Sect. 2. We describe the basic properties of galaxies in thesample in Sect. 3. Results on the SF and dust attenuation arepresented in Sect. 4. Section 5 is devoted to our summary andconclusions.
1 URL: http://www.sdss.org/dr7/
Throughout the paper we will assume ΩM0 = 0.3, ΩΛ0 =0.7 and H0 = 70 km s−1 Mpc−1. The luminosities are de-fined as νLν and are expressed in solar units assuming L� =3.83 × 1033 erg s−1.
2. Sample construction
2.1. Construction of the parent FIR sample from AKARIand IRAS PSCz
2.1.1. AKARI FIS all-sky survey
The primary purpose of the AKARI mission is to pro-vide second-generation infrared (IR) catalogs with a bet-ter spatial resolution and wider spectral coverage than theIRAS catalog. AKARI is equipped with a cryogenically cooledtelescope with an aperture diameter of 68.5 cm and twoscientific instruments, the FIS (Kawada et al. 2007) andthe infrared camera (IRC; Onaka et al. 2007). Amongvarious astronomical observations performed by AKARI, an allsky survey with the FIS has been carried out (AKARI all-skysurvey). Since the FIS is an instrument dedicated to the FIR λ =50−180 μm, all the AKARI FIS bands are in the FIR wave-lengths: N60 (65 μm), WIDE-S (90 μm), WIDE-L (140 μm), andN160 (160 μm) (Kawada et al. 2007). Hereafter we note as S 65,S 90, S 140 and S 160 the flux densities in these bands. Especiallyas the FIS has sensitivity at longer wavelengths than the detec-tor of IRAS, a new classification scheme is needed if we try toselect a certain class of objects. Such a scheme is not merely anempirical technique but will also provide us with a new under-standing of objects with cool dust which were difficult to detectby the IRAS bands.
We use the AKARI FIS bright source catalogue (BSC), thefirst primary catalog from the AKARI all-sky survey. Data fromthe β-1 version of this catalog are used in this work. AKARI BSCis supposed to have a uniform detection limit corresponding toper scan sensitivity over the entire sky, except for very bright skyparts where a different data acquisition mode had to be applied.A summary of the all-sky survey is presented in Yamamura et al.(2009). The AKARI FIS BSC provides data for 64 311 sources.For each detected source the AKARI source identifier, the equa-torial coordinates of the source position and the flux densitiesin the four FIR bands are given. Errors are not estimated foreach individual source, but instead they are estimated in total tobe 35%, 30%, 60%, and 60% at N60, WIDE-S, WIDE-L, andN160, respectively (Yamamura et al. 2008). The AKARI IRCperformed another all sky survey, but the data were not fully re-duced at the time we prepared this paper. Hence we focus on theFIS data only.
2.1.2. Matching with IRAS PSCz
The AKARI BSC contains many Galactic sources, like AGBs,Hii regions, planetary nebulae, etc. (e.g. Pollo et al. 2010). In or-der to construct a reliable catalog of galaxies, we should pickup the FIS sources confirmed as galaxies. For this purpose wehave performed a cross identification of the BSC sources withthe IRAS PSCz (Saunders et al. 2000). The PSCz is a redshiftsurvey of galaxies selected at the IRAS 60 μm with a flux den-sity limit of S 60 > 0.6 [Jy]2. The PSCz contains ∼16 000 galax-ies. We put a limit on the recession velocity v > 1000 km s−1
2 Because of this step we note that we do not make maximal use of theadvantage of the long wavelength bands of the AKARI FIS, since thesample is limited by the IRAS bands (λ < 100 μm).
Page 2 of 13
T. T. Takeuchi et al.: Star formation and dust extinction of galaxies from AKARI-GALEX
so we could avoid the effect of the peculiar velocity of galaxies.As a next step we matched the AKARI BSC sources with thePSCz galaxies with a search radius of 36 arcsec, which corre-sponds to the position uncertainty of the IRAS PSC. The num-ber of matched sources was 5890. To examine the effect of thechoice of our search radius, we changed the criterion from 20 to60 arcsec. This change of radius did not have a significant im-pact on the resulting catalog (<∼5%). Hence we used the catalogwith a search radius of 36 arcsec in the analysis below.
To broaden our analysis we even further made a cross iden-tification with the SDSS galaxies (see Sect. 2.3). Then we re-stricted our data to only the area covered by the SDSS DR7,which is 8378.015 deg2.
The restriction to this region of the sky has the advantagethat the Galactic diffuse FIR emission is strong in some areas ofthe sky, and consequently the FIR flux densities of point sourcesmeasured there are contaminated by the Galactic emission andnot very accurate. As the SDSS region is selected in a way tohave only a faint Galactic extinction, the selected area automati-cally avoids these FIR-bright regions. The resulting parent cata-log contains 1186 galaxies.
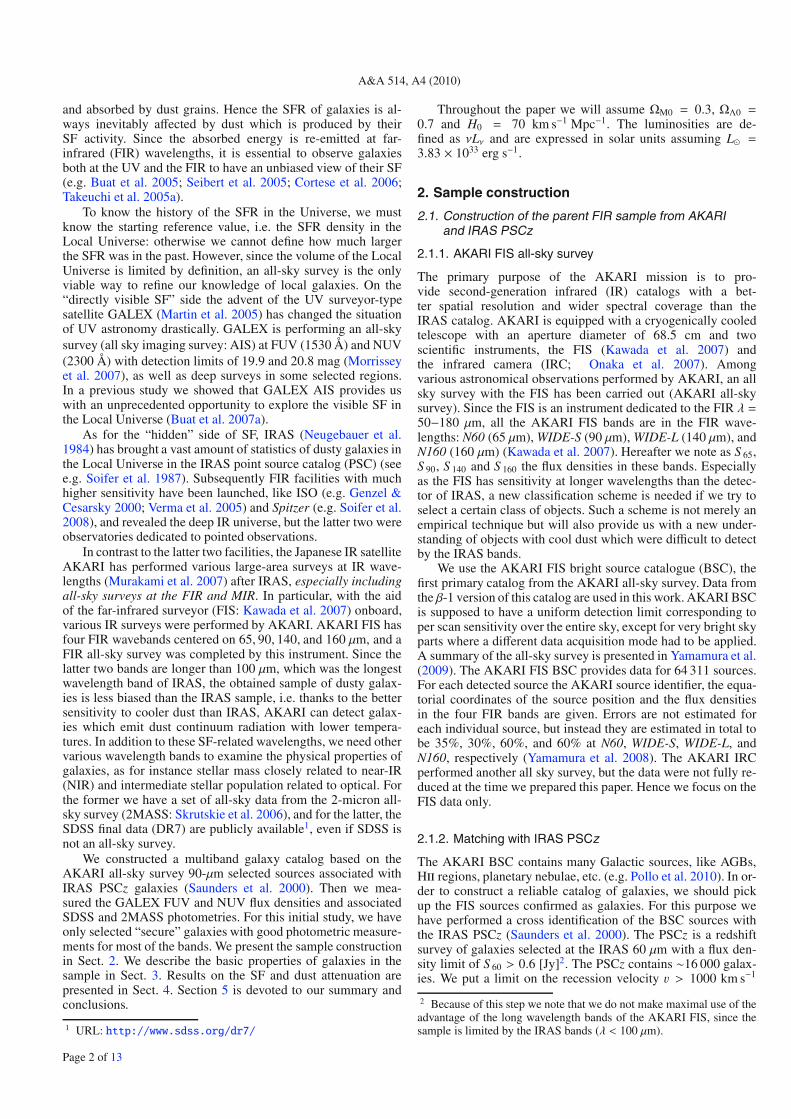
2.1.3. Flux density comparison between AKARI and IRAS
We compared the AKARI and IRAS flux densities to examineour sample selection. The correlation is shown in Fig. 1. Thehorizontal dotted lines in the upper-left, upper-right, and lower-left panels represent the flux density limit of the IRAS PSCz.The AKARI BSC sources are selected at WIDE-S, i.e. 90 μm.It is important to see which selection controls the sample selec-tion. As seen in the upper-left panel, both the IRAS PSCz andAKARI limit are well-defined, and neither of them strongly re-stricts the sample. The effective 90 μm flux density limit of ourparent sample is ∼0.8 Jy.
2.2. GALEX photometry
GALEX AIS now observed 25 000 deg2 at FUV and NUV.The latest version of the public imaging is GR4/GR53. Wehave measured the FUV and NUV photometry of the parentAKARI galaxies as follows:
1. Cut out a 30′ × 30′ square subimage from the GALEX AISimages around each AKARI galaxy.
2. Select a subimage with the largest exposure time when mul-tiple observations were available.
3. Measure the FUV and NUV flux densities. The NUV obser-vation is taken as our reference.
Since the sky coverage of GALEX AIS is not complete, we donot have a proper GALEX image for an AKARI galaxy in somecases. In this case we excluded the galaxy because we did nothave any UV information.
Almost all of the sources are resolved by GALEX. They arethus very often separated into small bright patchy regions, andthe GALEX pipeline misidentifies these fragments as individ-ual objects. This is referred to as shredding. We must deal withthe shredding to obtain sensible flux density measurements fornearby extended galaxies. For this purpose we specifically de-veloped an IDL software package. This software performs aper-ture photometry in the NUV sub-image using a set of ellipti-cal apertures. Total flux density is calculated within the aperturecorresponding to the convergence of the growth curve. The sky
3 URL: http://galex.stsci.edu/GR4/
Fig. 1. Comparison between the AKARI FIS and IRAS PSCz flux densi-ties. Upper-left, upper-right, and lower-left panels present comparisonsof the IRAS 60 μm with AKARI 90 μm, 65 μm, and 140 μm flux densi-ties of the AKARI-IRAS correlated sample. The vertical dotted lines inthese panels represent the flux density limit of the IRAS PSCz. Lower-right panel shows a comparison of the IRAS 100 μm with the AKARI90 μm flux densities. The horizontal dotted line in the upper-left panelrepresents the formally expected detection limit of the FIS 90 μm.
background is measured by combining several individual re-gions around the source. The NUV and FUV flux densitiesare corrected for Galactic extinction using the Schlegel map(Schlegel et al. 1998) and the Galactic extinction curve ofCardelli et al. (1989). A detailed description of the photometryprocess can be found in Iglesias-Páramo et al. (2006).
This software was already used for our previous IRAS-GALEX based studies (Buat et al. 2007a), and its performanceis carefully checked and established. During the procedure wealso excluded all the sources that were either contaminated bystars or too close to be disentangled by the photometry software.After this procedure the number of remaining galaxies is 776.
2.3. Matching with the SDSS and 2MASS galaxies
As a next step we matched the AKARI-IRAS PSCz-GALEXsample (776 galaxies, hereafter abbreviated as the AKARI-GALEX sample) with the SDSS and 2MASS.
The AKARI-GALEX sample was matched to the 2MASSall-sky Extended Source (XSC) catalog to obtain the NIR (J,H, and Ks) flux densities. A matching radius of 20′′ wasinitially adopted for the cross correlation. All but seven outof the 776 galaxies in the AKARI-GALEX sample showed2MASS counterparts at distances closer than the matching ra-dius. For multiple candidates we always selected the bright-est one at Ks-band as the most plausible one. A further crosscorrelation with a matching radius of 30′′ was attempted forthese seven galaxies with no 2MASS counterpart within the
Page 3 of 13
A&A 514, A4 (2010)
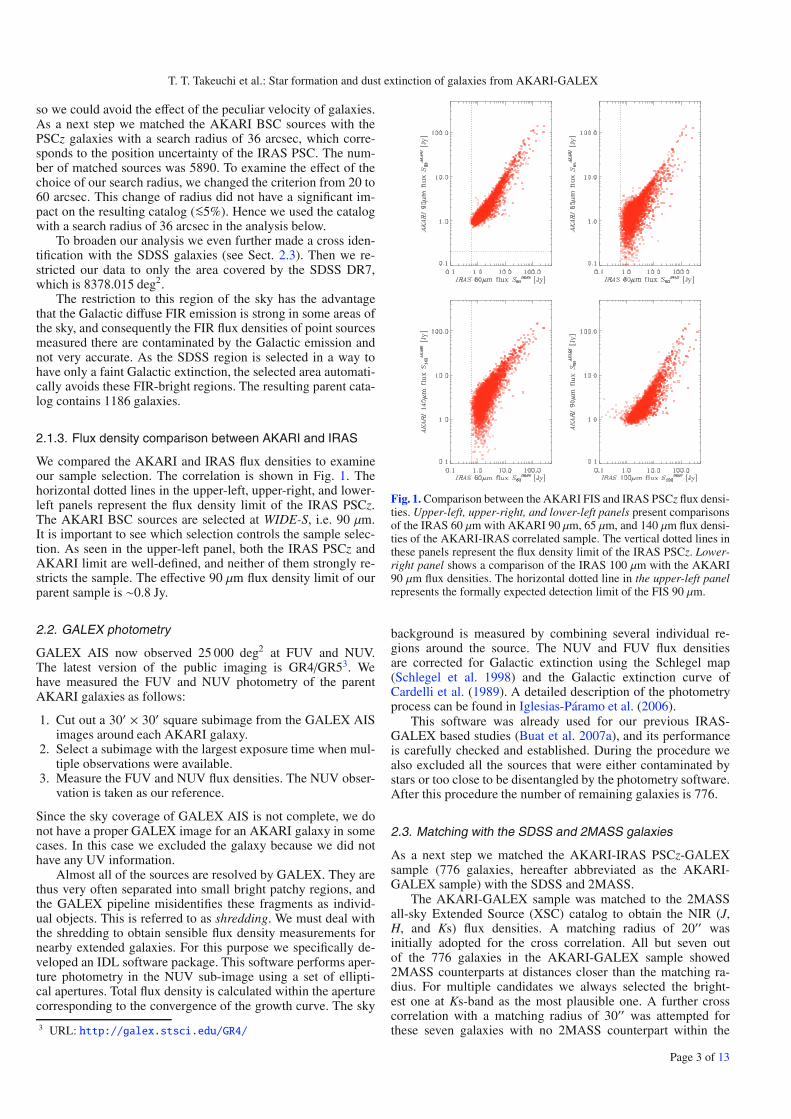
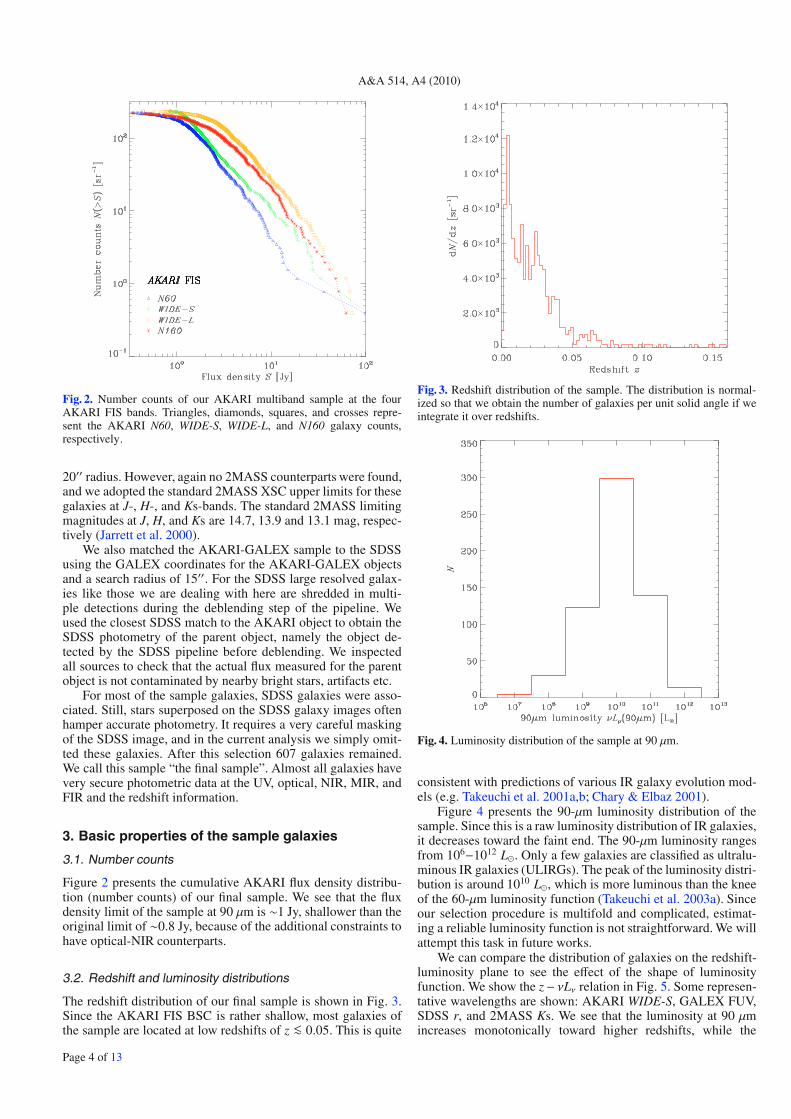
Fig. 2. Number counts of our AKARI multiband sample at the fourAKARI FIS bands. Triangles, diamonds, squares, and crosses repre-sent the AKARI N60, WIDE-S, WIDE-L, and N160 galaxy counts,respectively.
20′′ radius. However, again no 2MASS counterparts were found,and we adopted the standard 2MASS XSC upper limits for thesegalaxies at J-, H-, and Ks-bands. The standard 2MASS limitingmagnitudes at J, H, and Ks are 14.7, 13.9 and 13.1 mag, respec-tively (Jarrett et al. 2000).
We also matched the AKARI-GALEX sample to the SDSSusing the GALEX coordinates for the AKARI-GALEX objectsand a search radius of 15′′. For the SDSS large resolved galax-ies like those we are dealing with here are shredded in multi-ple detections during the deblending step of the pipeline. Weused the closest SDSS match to the AKARI object to obtain theSDSS photometry of the parent object, namely the object de-tected by the SDSS pipeline before deblending. We inspectedall sources to check that the actual flux measured for the parentobject is not contaminated by nearby bright stars, artifacts etc.
For most of the sample galaxies, SDSS galaxies were asso-ciated. Still, stars superposed on the SDSS galaxy images oftenhamper accurate photometry. It requires a very careful maskingof the SDSS image, and in the current analysis we simply omit-ted these galaxies. After this selection 607 galaxies remained.We call this sample “the final sample”. Almost all galaxies havevery secure photometric data at the UV, optical, NIR, MIR, andFIR and the redshift information.
3. Basic properties of the sample galaxies
3.1. Number counts
Figure 2 presents the cumulative AKARI flux density distribu-tion (number counts) of our final sample. We see that the fluxdensity limit of the sample at 90 μm is ∼1 Jy, shallower than theoriginal limit of ∼0.8 Jy, because of the additional constraints tohave optical-NIR counterparts.
3.2. Redshift and luminosity distributions
The redshift distribution of our final sample is shown in Fig. 3.Since the AKARI FIS BSC is rather shallow, most galaxies ofthe sample are located at low redshifts of z <∼ 0.05. This is quite
Fig. 3. Redshift distribution of the sample. The distribution is normal-ized so that we obtain the number of galaxies per unit solid angle if weintegrate it over redshifts.
Fig. 4. Luminosity distribution of the sample at 90 μm.
consistent with predictions of various IR galaxy evolution mod-els (e.g. Takeuchi et al. 2001a,b; Chary & Elbaz 2001).
Figure 4 presents the 90-μm luminosity distribution of thesample. Since this is a raw luminosity distribution of IR galaxies,it decreases toward the faint end. The 90-μm luminosity rangesfrom 106−1012 L�. Only a few galaxies are classified as ultralu-minous IR galaxies (ULIRGs). The peak of the luminosity distri-bution is around 1010 L�, which is more luminous than the kneeof the 60-μm luminosity function (Takeuchi et al. 2003a). Sinceour selection procedure is multifold and complicated, estimat-ing a reliable luminosity function is not straightforward. We willattempt this task in future works.
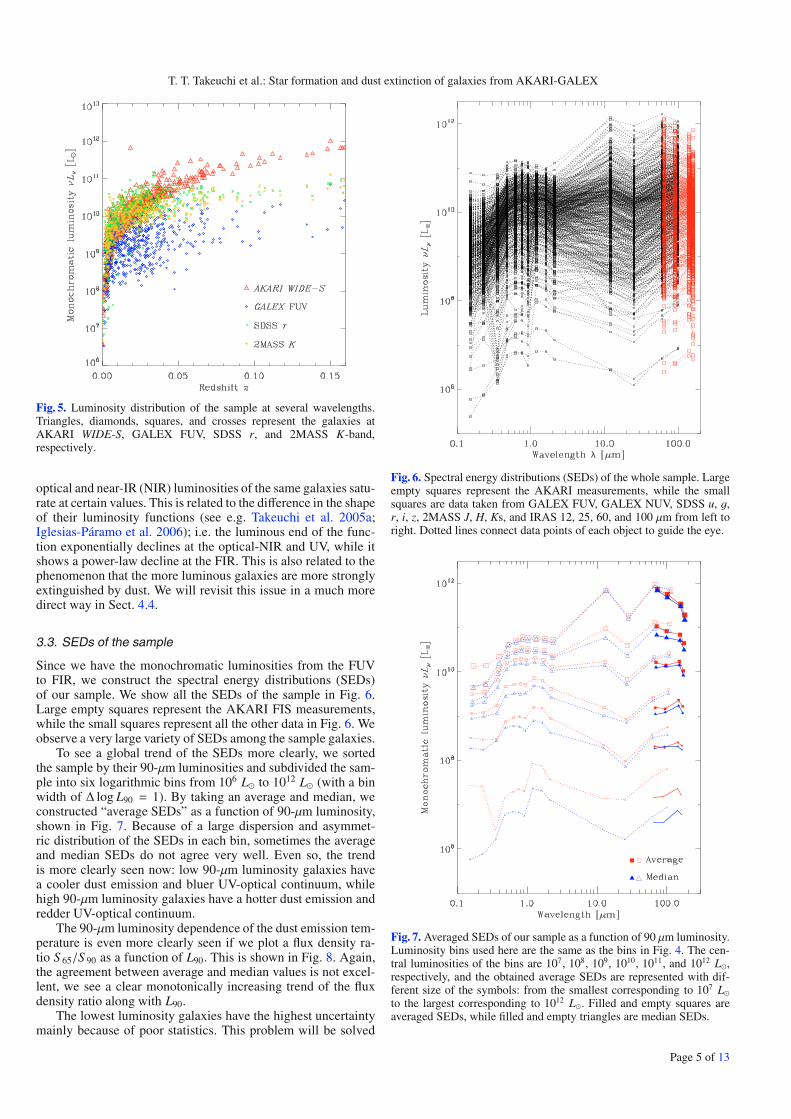
We can compare the distribution of galaxies on the redshift-luminosity plane to see the effect of the shape of luminosityfunction. We show the z− νLν relation in Fig. 5. Some represen-tative wavelengths are shown: AKARI WIDE-S, GALEX FUV,SDSS r, and 2MASS Ks. We see that the luminosity at 90 μmincreases monotonically toward higher redshifts, while the
Page 4 of 13
T. T. Takeuchi et al.: Star formation and dust extinction of galaxies from AKARI-GALEX
Fig. 5. Luminosity distribution of the sample at several wavelengths.Triangles, diamonds, squares, and crosses represent the galaxies atAKARI WIDE-S, GALEX FUV, SDSS r, and 2MASS K-band,respectively.
optical and near-IR (NIR) luminosities of the same galaxies satu-rate at certain values. This is related to the difference in the shapeof their luminosity functions (see e.g. Takeuchi et al. 2005a;Iglesias-Páramo et al. 2006); i.e. the luminous end of the func-tion exponentially declines at the optical-NIR and UV, while itshows a power-law decline at the FIR. This is also related to thephenomenon that the more luminous galaxies are more stronglyextinguished by dust. We will revisit this issue in a much moredirect way in Sect. 4.4.
3.3. SEDs of the sample
Since we have the monochromatic luminosities from the FUVto FIR, we construct the spectral energy distributions (SEDs)of our sample. We show all the SEDs of the sample in Fig. 6.Large empty squares represent the AKARI FIS measurements,while the small squares represent all the other data in Fig. 6. Weobserve a very large variety of SEDs among the sample galaxies.
To see a global trend of the SEDs more clearly, we sortedthe sample by their 90-μm luminosities and subdivided the sam-ple into six logarithmic bins from 106 L� to 1012 L� (with a binwidth of Δ log L90 = 1). By taking an average and median, weconstructed “average SEDs” as a function of 90-μm luminosity,shown in Fig. 7. Because of a large dispersion and asymmet-ric distribution of the SEDs in each bin, sometimes the averageand median SEDs do not agree very well. Even so, the trendis more clearly seen now: low 90-μm luminosity galaxies havea cooler dust emission and bluer UV-optical continuum, whilehigh 90-μm luminosity galaxies have a hotter dust emission andredder UV-optical continuum.
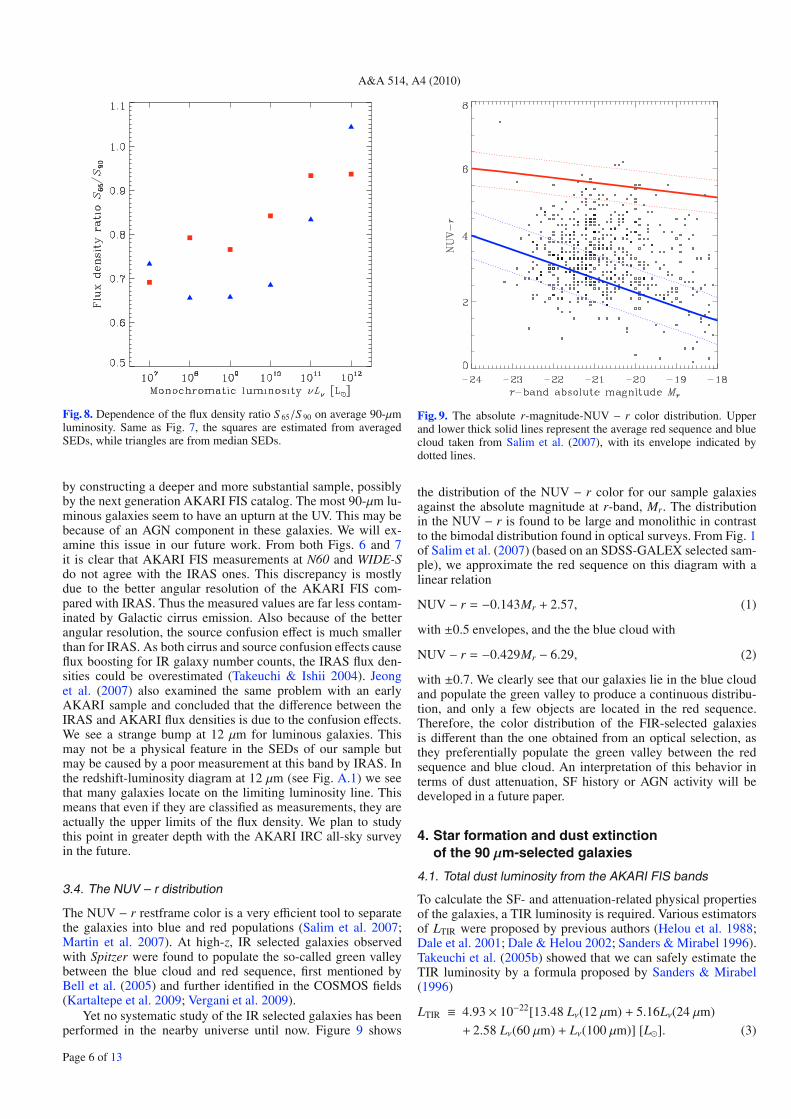
The 90-μm luminosity dependence of the dust emission tem-perature is even more clearly seen if we plot a flux density ra-tio S 65/S 90 as a function of L90. This is shown in Fig. 8. Again,the agreement between average and median values is not excel-lent, we see a clear monotonically increasing trend of the fluxdensity ratio along with L90.
The lowest luminosity galaxies have the highest uncertaintymainly because of poor statistics. This problem will be solved
Fig. 6. Spectral energy distributions (SEDs) of the whole sample. Largeempty squares represent the AKARI measurements, while the smallsquares are data taken from GALEX FUV, GALEX NUV, SDSS u, g,r, i, z, 2MASS J, H, Ks, and IRAS 12, 25, 60, and 100 μm from left toright. Dotted lines connect data points of each object to guide the eye.
Fig. 7. Averaged SEDs of our sample as a function of 90 μm luminosity.Luminosity bins used here are the same as the bins in Fig. 4. The cen-tral luminosities of the bins are 107, 108, 109, 1010, 1011, and 1012 L�,respectively, and the obtained average SEDs are represented with dif-ferent size of the symbols: from the smallest corresponding to 107 L�to the largest corresponding to 1012 L�. Filled and empty squares areaveraged SEDs, while filled and empty triangles are median SEDs.
Page 5 of 13
A&A 514, A4 (2010)
Fig. 8. Dependence of the flux density ratio S 65/S 90 on average 90-μmluminosity. Same as Fig. 7, the squares are estimated from averagedSEDs, while triangles are from median SEDs.
by constructing a deeper and more substantial sample, possiblyby the next generation AKARI FIS catalog. The most 90-μm lu-minous galaxies seem to have an upturn at the UV. This may bebecause of an AGN component in these galaxies. We will ex-amine this issue in our future work. From both Figs. 6 and 7it is clear that AKARI FIS measurements at N60 and WIDE-Sdo not agree with the IRAS ones. This discrepancy is mostlydue to the better angular resolution of the AKARI FIS com-pared with IRAS. Thus the measured values are far less contam-inated by Galactic cirrus emission. Also because of the betterangular resolution, the source confusion effect is much smallerthan for IRAS. As both cirrus and source confusion effects causeflux boosting for IR galaxy number counts, the IRAS flux den-sities could be overestimated (Takeuchi & Ishii 2004). Jeonget al. (2007) also examined the same problem with an earlyAKARI sample and concluded that the difference between theIRAS and AKARI flux densities is due to the confusion effects.We see a strange bump at 12 μm for luminous galaxies. Thismay not be a physical feature in the SEDs of our sample butmay be caused by a poor measurement at this band by IRAS. Inthe redshift-luminosity diagram at 12 μm (see Fig. A.1) we seethat many galaxies locate on the limiting luminosity line. Thismeans that even if they are classified as measurements, they areactually the upper limits of the flux density. We plan to studythis point in greater depth with the AKARI IRC all-sky surveyin the future.
3.4. The NUV – r distribution
The NUV − r restframe color is a very efficient tool to separatethe galaxies into blue and red populations (Salim et al. 2007;Martin et al. 2007). At high-z, IR selected galaxies observedwith Spitzer were found to populate the so-called green valleybetween the blue cloud and red sequence, first mentioned byBell et al. (2005) and further identified in the COSMOS fields(Kartaltepe et al. 2009; Vergani et al. 2009).
Yet no systematic study of the IR selected galaxies has beenperformed in the nearby universe until now. Figure 9 shows
Fig. 9. The absolute r-magnitude-NUV − r color distribution. Upperand lower thick solid lines represent the average red sequence and bluecloud taken from Salim et al. (2007), with its envelope indicated bydotted lines.
the distribution of the NUV − r color for our sample galaxiesagainst the absolute magnitude at r-band, Mr. The distributionin the NUV − r is found to be large and monolithic in contrastto the bimodal distribution found in optical surveys. From Fig. 1of Salim et al. (2007) (based on an SDSS-GALEX selected sam-ple), we approximate the red sequence on this diagram with alinear relation
NUV − r = −0.143Mr + 2.57, (1)
with ±0.5 envelopes, and the the blue cloud with
NUV − r = −0.429Mr − 6.29, (2)
with ±0.7. We clearly see that our galaxies lie in the blue cloudand populate the green valley to produce a continuous distribu-tion, and only a few objects are located in the red sequence.Therefore, the color distribution of the FIR-selected galaxiesis different than the one obtained from an optical selection, asthey preferentially populate the green valley between the redsequence and blue cloud. An interpretation of this behavior interms of dust attenuation, SF history or AGN activity will bedeveloped in a future paper.
4. Star formation and dust extinctionof the 90 µm-selected galaxies
4.1. Total dust luminosity from the AKARI FIS bands
To calculate the SF- and attenuation-related physical propertiesof the galaxies, a TIR luminosity is required. Various estimatorsof LTIR were proposed by previous authors (Helou et al. 1988;Dale et al. 2001; Dale & Helou 2002; Sanders & Mirabel 1996).Takeuchi et al. (2005b) showed that we can safely estimate theTIR luminosity by a formula proposed by Sanders & Mirabel(1996)
LTIR ≡ 4.93 × 10⁻²²[13.48 Lν(12 μm) + 5.16Lν(24 μm)
+ 2.58 Lν(60 μm) + Lν(100 μm)] [L�]. (3)
Page 6 of 13
T. T. Takeuchi et al.: Star formation and dust extinction of galaxies from AKARI-GALEX
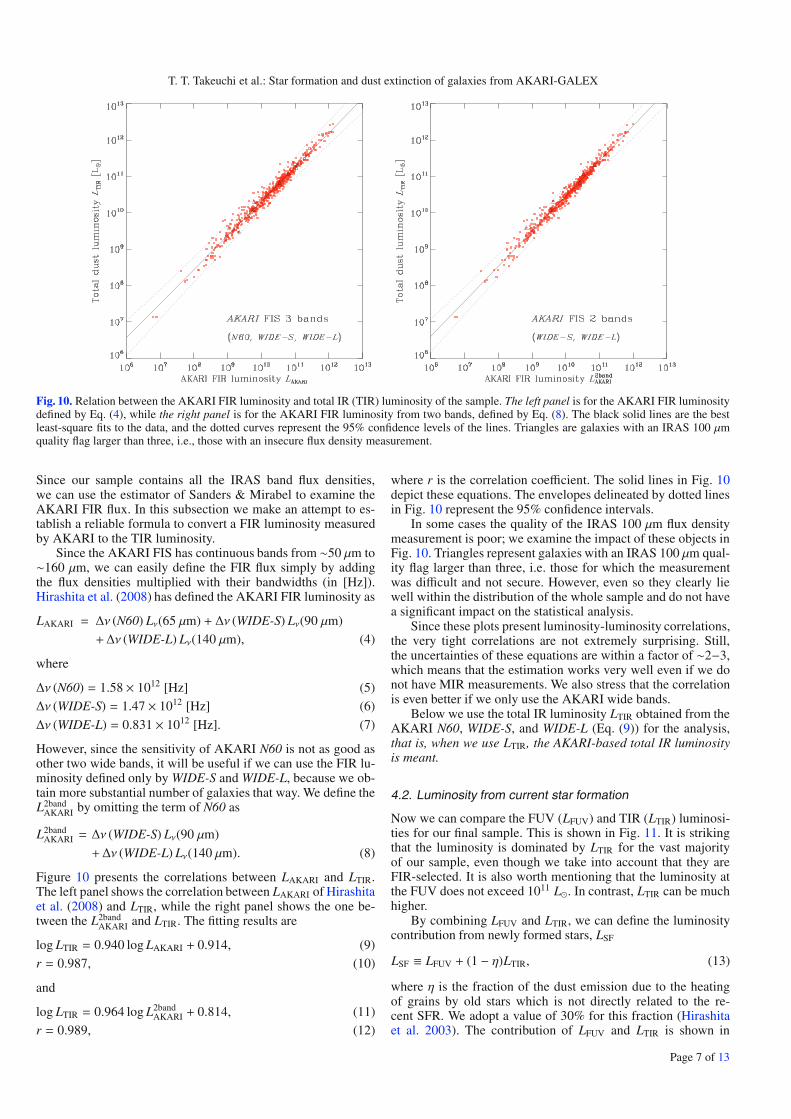
Fig. 10. Relation between the AKARI FIR luminosity and total IR (TIR) luminosity of the sample. The left panel is for the AKARI FIR luminositydefined by Eq. (4), while the right panel is for the AKARI FIR luminosity from two bands, defined by Eq. (8). The black solid lines are the bestleast-square fits to the data, and the dotted curves represent the 95% confidence levels of the lines. Triangles are galaxies with an IRAS 100 μmquality flag larger than three, i.e., those with an insecure flux density measurement.
Since our sample contains all the IRAS band flux densities,we can use the estimator of Sanders & Mirabel to examine theAKARI FIR flux. In this subsection we make an attempt to es-tablish a reliable formula to convert a FIR luminosity measuredby AKARI to the TIR luminosity.
Since the AKARI FIS has continuous bands from ∼50 μm to∼160 μm, we can easily define the FIR flux simply by addingthe flux densities multiplied with their bandwidths (in [Hz]).Hirashita et al. (2008) has defined the AKARI FIR luminosity as
LAKARI = Δν (N60) Lν(65 μm) + Δν (WIDE-S) Lν(90 μm)
+Δν (WIDE-L) Lν(140 μm), (4)
where
Δν (N60) = 1.58 × 10¹² [Hz] (5)
Δν (WIDE-S) = 1.47 × 10¹² [Hz] (6)
Δν (WIDE-L) = 0.831 × 10¹² [Hz]. (7)
However, since the sensitivity of AKARI N60 is not as good asother two wide bands, it will be useful if we can use the FIR lu-minosity defined only by WIDE-S and WIDE-L, because we ob-tain more substantial number of galaxies that way. We define theL2band
AKARI by omitting the term of N60 as
L2bandAKARI = Δν (WIDE-S) Lν(90 μm)
+Δν (WIDE-L) Lν(140 μm). (8)
Figure 10 presents the correlations between LAKARI and LTIR.The left panel shows the correlation between LAKARI of Hirashitaet al. (2008) and LTIR, while the right panel shows the one be-tween the L2band
AKARI and LTIR. The fitting results are
log LTIR = 0.940 log LAKARI + 0.914, (9)
r = 0.987, (10)
and
log LTIR = 0.964 log L2bandAKARI + 0.814, (11)
r = 0.989, (12)
where r is the correlation coefficient. The solid lines in Fig. 10depict these equations. The envelopes delineated by dotted linesin Fig. 10 represent the 95% confidence intervals.
In some cases the quality of the IRAS 100 μm flux densitymeasurement is poor; we examine the impact of these objects inFig. 10. Triangles represent galaxies with an IRAS 100 μm qual-ity flag larger than three, i.e. those for which the measurementwas difficult and not secure. However, even so they clearly liewell within the distribution of the whole sample and do not havea significant impact on the statistical analysis.
Since these plots present luminosity-luminosity correlations,the very tight correlations are not extremely surprising. Still,the uncertainties of these equations are within a factor of ∼2−3,which means that the estimation works very well even if we donot have MIR measurements. We also stress that the correlationis even better if we only use the AKARI wide bands.
Below we use the total IR luminosity LTIR obtained from theAKARI N60, WIDE-S, and WIDE-L (Eq. (9)) for the analysis,that is, when we use LTIR, the AKARI-based total IR luminosityis meant.
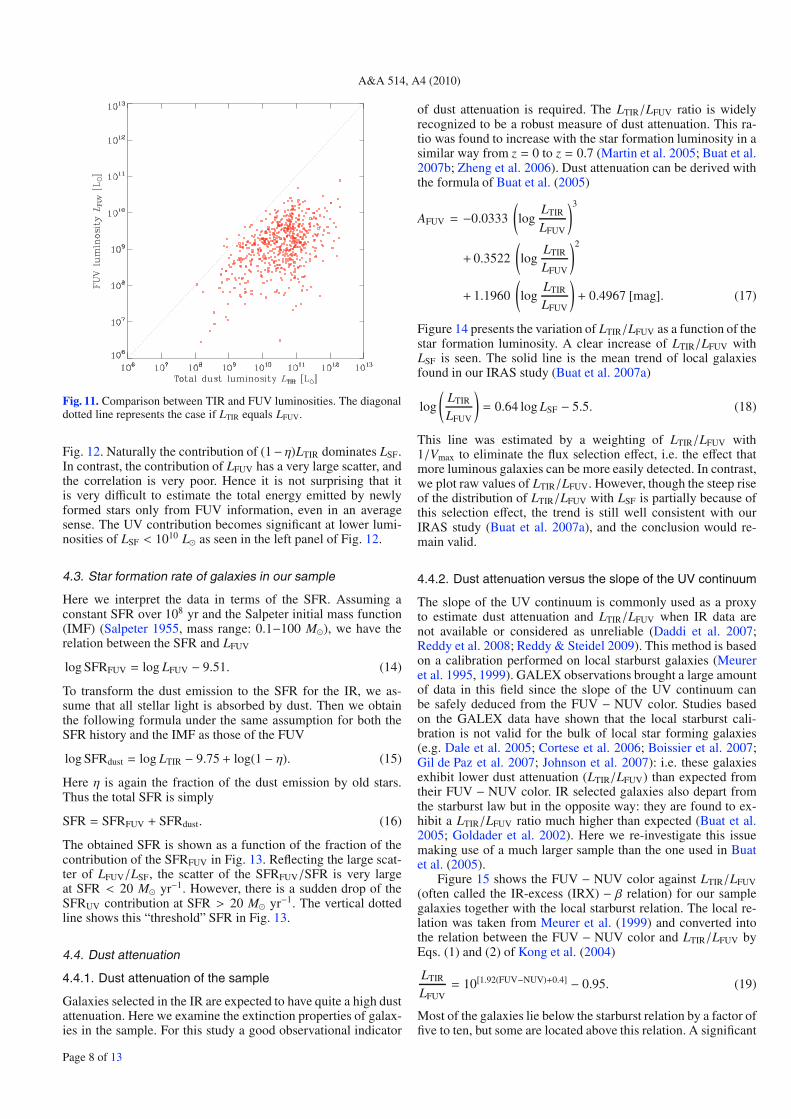
4.2. Luminosity from current star formation
Now we can compare the FUV (LFUV) and TIR (LTIR) luminosi-ties for our final sample. This is shown in Fig. 11. It is strikingthat the luminosity is dominated by LTIR for the vast majorityof our sample, even though we take into account that they areFIR-selected. It is also worth mentioning that the luminosity atthe FUV does not exceed 1011 L�. In contrast, LTIR can be muchhigher.
By combining LFUV and LTIR, we can define the luminositycontribution from newly formed stars, LSF
LSF ≡ LFUV + (1 − η)LTIR, (13)
where η is the fraction of the dust emission due to the heatingof grains by old stars which is not directly related to the re-cent SFR. We adopt a value of 30% for this fraction (Hirashitaet al. 2003). The contribution of LFUV and LTIR is shown in
Page 7 of 13
A&A 514, A4 (2010)
Fig. 11. Comparison between TIR and FUV luminosities. The diagonaldotted line represents the case if LTIR equals LFUV.
Fig. 12. Naturally the contribution of (1− η)LTIR dominates LSF.In contrast, the contribution of LFUV has a very large scatter, andthe correlation is very poor. Hence it is not surprising that itis very difficult to estimate the total energy emitted by newlyformed stars only from FUV information, even in an averagesense. The UV contribution becomes significant at lower lumi-nosities of LSF < 1010 L� as seen in the left panel of Fig. 12.
4.3. Star formation rate of galaxies in our sample
Here we interpret the data in terms of the SFR. Assuming aconstant SFR over 108 yr and the Salpeter initial mass function(IMF) (Salpeter 1955, mass range: 0.1−100 M�), we have therelation between the SFR and LFUV
log SFRFUV = log LFUV − 9.51. (14)
To transform the dust emission to the SFR for the IR, we as-sume that all stellar light is absorbed by dust. Then we obtainthe following formula under the same assumption for both theSFR history and the IMF as those of the FUV
log SFRdust = log LTIR − 9.75 + log(1 − η). (15)
Here η is again the fraction of the dust emission by old stars.Thus the total SFR is simply
SFR = SFRFUV + SFRdust. (16)
The obtained SFR is shown as a function of the fraction of thecontribution of the SFRFUV in Fig. 13. Reflecting the large scat-ter of LFUV/LSF, the scatter of the SFRFUV/SFR is very largeat SFR < 20 M� yr−1. However, there is a sudden drop of theSFRUV contribution at SFR > 20 M� yr−1. The vertical dottedline shows this “threshold” SFR in Fig. 13.
4.4. Dust attenuation
4.4.1. Dust attenuation of the sample
Galaxies selected in the IR are expected to have quite a high dustattenuation. Here we examine the extinction properties of galax-ies in the sample. For this study a good observational indicator
of dust attenuation is required. The LTIR/LFUV ratio is widelyrecognized to be a robust measure of dust attenuation. This ra-tio was found to increase with the star formation luminosity in asimilar way from z = 0 to z = 0.7 (Martin et al. 2005; Buat et al.2007b; Zheng et al. 2006). Dust attenuation can be derived withthe formula of Buat et al. (2005)
AFUV = −0.0333
(log
LTIR
LFUV
)3
+ 0.3522
(log
LTIR
LFUV
)2
+ 1.1960
(log
LTIR
LFUV
)+ 0.4967 [mag]. (17)
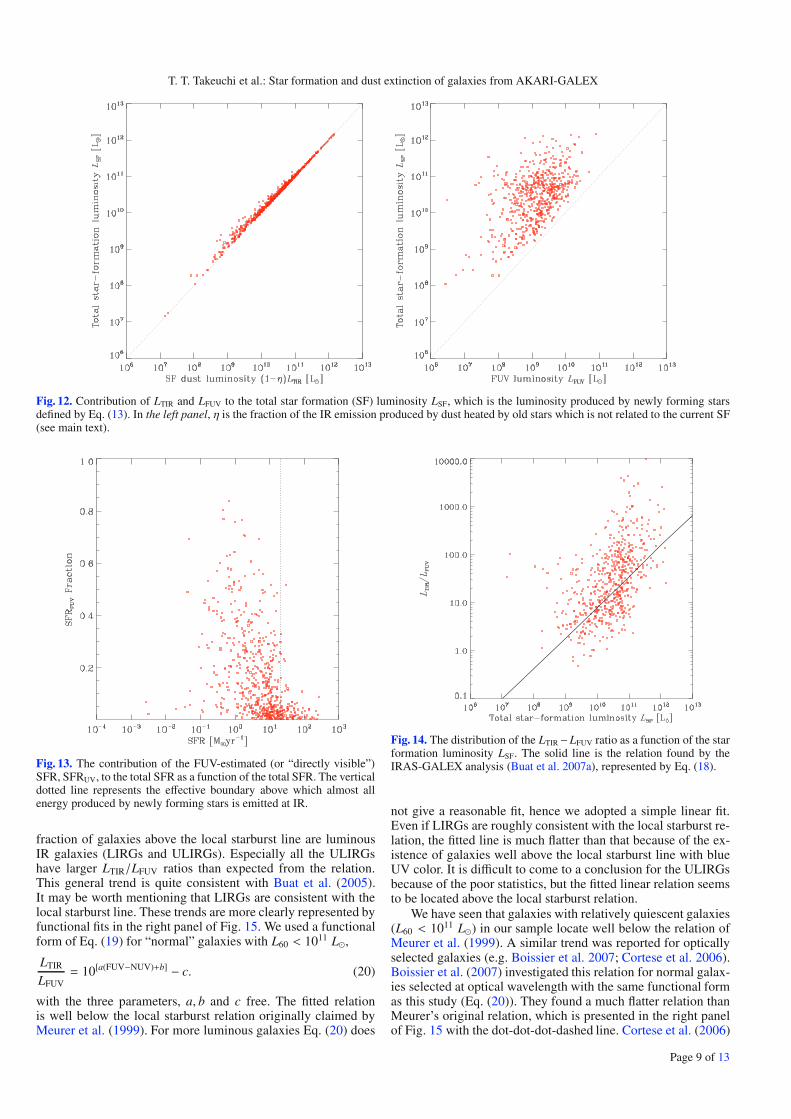
Figure 14 presents the variation of LTIR/LFUV as a function of thestar formation luminosity. A clear increase of LTIR/LFUV withLSF is seen. The solid line is the mean trend of local galaxiesfound in our IRAS study (Buat et al. 2007a)
log
(LTIR
LFUV
)= 0.64 log LSF − 5.5. (18)
This line was estimated by a weighting of LTIR/LFUV with1/Vmax to eliminate the flux selection effect, i.e. the effect thatmore luminous galaxies can be more easily detected. In contrast,we plot raw values of LTIR/LFUV. However, though the steep riseof the distribution of LTIR/LFUV with LSF is partially because ofthis selection effect, the trend is still well consistent with ourIRAS study (Buat et al. 2007a), and the conclusion would re-main valid.
4.4.2. Dust attenuation versus the slope of the UV continuum
The slope of the UV continuum is commonly used as a proxyto estimate dust attenuation and LTIR/LFUV when IR data arenot available or considered as unreliable (Daddi et al. 2007;Reddy et al. 2008; Reddy & Steidel 2009). This method is basedon a calibration performed on local starburst galaxies (Meureret al. 1995, 1999). GALEX observations brought a large amountof data in this field since the slope of the UV continuum canbe safely deduced from the FUV − NUV color. Studies basedon the GALEX data have shown that the local starburst cali-bration is not valid for the bulk of local star forming galaxies(e.g. Dale et al. 2005; Cortese et al. 2006; Boissier et al. 2007;Gil de Paz et al. 2007; Johnson et al. 2007): i.e. these galaxiesexhibit lower dust attenuation (LTIR/LFUV) than expected fromtheir FUV − NUV color. IR selected galaxies also depart fromthe starburst law but in the opposite way: they are found to ex-hibit a LTIR/LFUV ratio much higher than expected (Buat et al.2005; Goldader et al. 2002). Here we re-investigate this issuemaking use of a much larger sample than the one used in Buatet al. (2005).
Figure 15 shows the FUV − NUV color against LTIR/LFUV(often called the IR-excess (IRX) − β relation) for our samplegalaxies together with the local starburst relation. The local re-lation was taken from Meurer et al. (1999) and converted intothe relation between the FUV − NUV color and LTIR/LFUV byEqs. (1) and (2) of Kong et al. (2004)
LTIR
LFUV= 10[1.92(FUV−NUV)+0.4] − 0.95. (19)
Most of the galaxies lie below the starburst relation by a factor offive to ten, but some are located above this relation. A significant
Page 8 of 13
T. T. Takeuchi et al.: Star formation and dust extinction of galaxies from AKARI-GALEX
Fig. 12. Contribution of LTIR and LFUV to the total star formation (SF) luminosity LSF, which is the luminosity produced by newly forming starsdefined by Eq. (13). In the left panel, η is the fraction of the IR emission produced by dust heated by old stars which is not related to the current SF(see main text).
Fig. 13. The contribution of the FUV-estimated (or “directly visible”)SFR, SFRUV, to the total SFR as a function of the total SFR. The verticaldotted line represents the effective boundary above which almost allenergy produced by newly forming stars is emitted at IR.
fraction of galaxies above the local starburst line are luminousIR galaxies (LIRGs and ULIRGs). Especially all the ULIRGshave larger LTIR/LFUV ratios than expected from the relation.This general trend is quite consistent with Buat et al. (2005).It may be worth mentioning that LIRGs are consistent with thelocal starburst line. These trends are more clearly represented byfunctional fits in the right panel of Fig. 15. We used a functionalform of Eq. (19) for “normal” galaxies with L60 < 1011 L�,
LTIR
LFUV= 10[a(FUV−NUV)+b] − c. (20)
with the three parameters, a, b and c free. The fitted relationis well below the local starburst relation originally claimed byMeurer et al. (1999). For more luminous galaxies Eq. (20) does
Fig. 14. The distribution of the LTIR−LFUV ratio as a function of the starformation luminosity LSF. The solid line is the relation found by theIRAS-GALEX analysis (Buat et al. 2007a), represented by Eq. (18).
not give a reasonable fit, hence we adopted a simple linear fit.Even if LIRGs are roughly consistent with the local starburst re-lation, the fitted line is much flatter than that because of the ex-istence of galaxies well above the local starburst line with blueUV color. It is difficult to come to a conclusion for the ULIRGsbecause of the poor statistics, but the fitted linear relation seemsto be located above the local starburst relation.
We have seen that galaxies with relatively quiescent galaxies(L60 < 1011 L�) in our sample locate well below the relation ofMeurer et al. (1999). A similar trend was reported for opticallyselected galaxies (e.g. Boissier et al. 2007; Cortese et al. 2006).Boissier et al. (2007) investigated this relation for normal galax-ies selected at optical wavelength with the same functional formas this study (Eq. (20)). They found a much flatter relation thanMeurer’s original relation, which is presented in the right panelof Fig. 15 with the dot-dot-dot-dashed line. Cortese et al. (2006)
Page 9 of 13
A&A 514, A4 (2010)
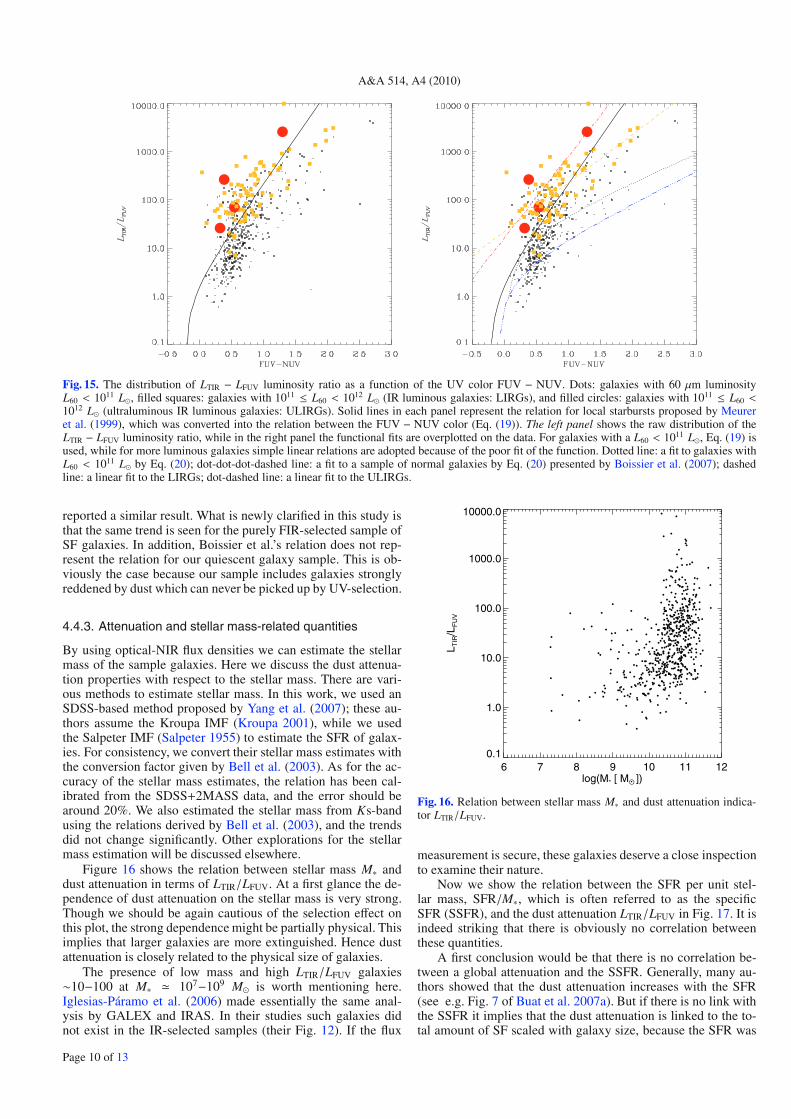
Fig. 15. The distribution of LTIR − LFUV luminosity ratio as a function of the UV color FUV − NUV. Dots: galaxies with 60 μm luminosityL60 < 1011 L�, filled squares: galaxies with 1011 ≤ L60 < 1012 L� (IR luminous galaxies: LIRGs), and filled circles: galaxies with 1011 ≤ L60 <1012 L� (ultraluminous IR luminous galaxies: ULIRGs). Solid lines in each panel represent the relation for local starbursts proposed by Meureret al. (1999), which was converted into the relation between the FUV − NUV color (Eq. (19)). The left panel shows the raw distribution of theLTIR − LFUV luminosity ratio, while in the right panel the functional fits are overplotted on the data. For galaxies with a L60 < 1011 L�, Eq. (19) isused, while for more luminous galaxies simple linear relations are adopted because of the poor fit of the function. Dotted line: a fit to galaxies withL60 < 1011 L� by Eq. (20); dot-dot-dot-dashed line: a fit to a sample of normal galaxies by Eq. (20) presented by Boissier et al. (2007); dashedline: a linear fit to the LIRGs; dot-dashed line: a linear fit to the ULIRGs.
reported a similar result. What is newly clarified in this study isthat the same trend is seen for the purely FIR-selected sample ofSF galaxies. In addition, Boissier et al.’s relation does not rep-resent the relation for our quiescent galaxy sample. This is ob-viously the case because our sample includes galaxies stronglyreddened by dust which can never be picked up by UV-selection.
4.4.3. Attenuation and stellar mass-related quantities
By using optical-NIR flux densities we can estimate the stellarmass of the sample galaxies. Here we discuss the dust attenua-tion properties with respect to the stellar mass. There are vari-ous methods to estimate stellar mass. In this work, we used anSDSS-based method proposed by Yang et al. (2007); these au-thors assume the Kroupa IMF (Kroupa 2001), while we usedthe Salpeter IMF (Salpeter 1955) to estimate the SFR of galax-ies. For consistency, we convert their stellar mass estimates withthe conversion factor given by Bell et al. (2003). As for the ac-curacy of the stellar mass estimates, the relation has been cal-ibrated from the SDSS+2MASS data, and the error should bearound 20%. We also estimated the stellar mass from Ks-bandusing the relations derived by Bell et al. (2003), and the trendsdid not change significantly. Other explorations for the stellarmass estimation will be discussed elsewhere.
Figure 16 shows the relation between stellar mass M∗ anddust attenuation in terms of LTIR/LFUV. At a first glance the de-pendence of dust attenuation on the stellar mass is very strong.Though we should be again cautious of the selection effect onthis plot, the strong dependence might be partially physical. Thisimplies that larger galaxies are more extinguished. Hence dustattenuation is closely related to the physical size of galaxies.
The presence of low mass and high LTIR/LFUV galaxies∼10−100 at M∗ 107−109 M� is worth mentioning here.Iglesias-Páramo et al. (2006) made essentially the same anal-ysis by GALEX and IRAS. In their studies such galaxies didnot exist in the IR-selected samples (their Fig. 12). If the flux
Fig. 16. Relation between stellar mass M∗ and dust attenuation indica-tor LTIR/LFUV.
measurement is secure, these galaxies deserve a close inspectionto examine their nature.
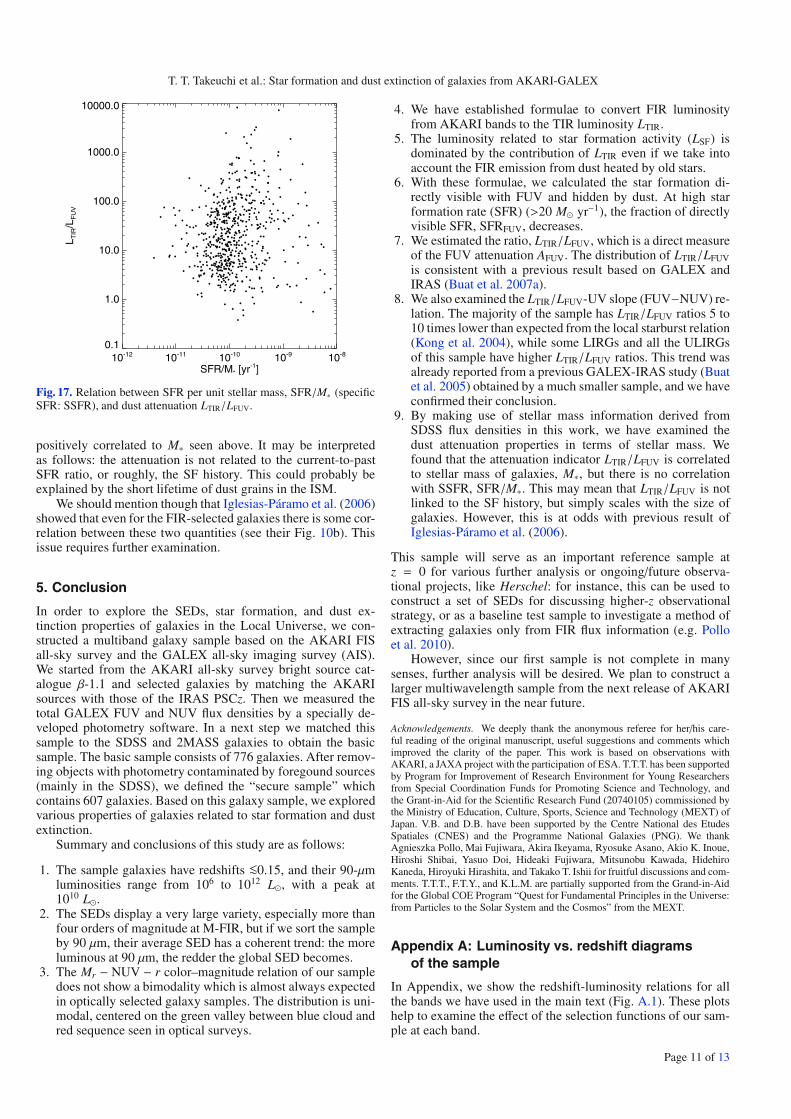
Now we show the relation between the SFR per unit stel-lar mass, SFR/M∗, which is often referred to as the specificSFR (SSFR), and the dust attenuation LTIR/LFUV in Fig. 17. It isindeed striking that there is obviously no correlation betweenthese quantities.
A first conclusion would be that there is no correlation be-tween a global attenuation and the SSFR. Generally, many au-thors showed that the dust attenuation increases with the SFR(see e.g. Fig. 7 of Buat et al. 2007a). But if there is no link withthe SSFR it implies that the dust attenuation is linked to the to-tal amount of SF scaled with galaxy size, because the SFR was
Page 10 of 13
T. T. Takeuchi et al.: Star formation and dust extinction of galaxies from AKARI-GALEX
10-12 10-11 10-10 10-9 10-8
SFR/M* [yr-1]
0.1
1.0
10.0
100.0
1000.0
10000.0
L TIR
/LF
UV
Fig. 17. Relation between SFR per unit stellar mass, SFR/M∗ (specificSFR: SSFR), and dust attenuation LTIR/LFUV.
positively correlated to M∗ seen above. It may be interpretedas follows: the attenuation is not related to the current-to-pastSFR ratio, or roughly, the SF history. This could probably beexplained by the short lifetime of dust grains in the ISM.
We should mention though that Iglesias-Páramo et al. (2006)showed that even for the FIR-selected galaxies there is some cor-relation between these two quantities (see their Fig. 10b). Thisissue requires further examination.
5. Conclusion
In order to explore the SEDs, star formation, and dust ex-tinction properties of galaxies in the Local Universe, we con-structed a multiband galaxy sample based on the AKARI FISall-sky survey and the GALEX all-sky imaging survey (AIS).We started from the AKARI all-sky survey bright source cat-alogue β-1.1 and selected galaxies by matching the AKARIsources with those of the IRAS PSCz. Then we measured thetotal GALEX FUV and NUV flux densities by a specially de-veloped photometry software. In a next step we matched thissample to the SDSS and 2MASS galaxies to obtain the basicsample. The basic sample consists of 776 galaxies. After remov-ing objects with photometry contaminated by foregound sources(mainly in the SDSS), we defined the “secure sample” whichcontains 607 galaxies. Based on this galaxy sample, we exploredvarious properties of galaxies related to star formation and dustextinction.
Summary and conclusions of this study are as follows:
1. The sample galaxies have redshifts <∼0.15, and their 90-μmluminosities range from 106 to 1012 L�, with a peak at1010 L�.
2. The SEDs display a very large variety, especially more thanfour orders of magnitude at M-FIR, but if we sort the sampleby 90 μm, their average SED has a coherent trend: the moreluminous at 90 μm, the redder the global SED becomes.
3. The Mr − NUV − r color–magnitude relation of our sampledoes not show a bimodality which is almost always expectedin optically selected galaxy samples. The distribution is uni-modal, centered on the green valley between blue cloud andred sequence seen in optical surveys.
4. We have established formulae to convert FIR luminosityfrom AKARI bands to the TIR luminosity LTIR.
5. The luminosity related to star formation activity (LSF) isdominated by the contribution of LTIR even if we take intoaccount the FIR emission from dust heated by old stars.
6. With these formulae, we calculated the star formation di-rectly visible with FUV and hidden by dust. At high starformation rate (SFR) (>20 M� yr−1), the fraction of directlyvisible SFR, SFRFUV, decreases.
7. We estimated the ratio, LTIR/LFUV, which is a direct measureof the FUV attenuation AFUV. The distribution of LTIR/LFUVis consistent with a previous result based on GALEX andIRAS (Buat et al. 2007a).
8. We also examined the LTIR/LFUV-UV slope (FUV−NUV) re-lation. The majority of the sample has LTIR/LFUV ratios 5 to10 times lower than expected from the local starburst relation(Kong et al. 2004), while some LIRGs and all the ULIRGsof this sample have higher LTIR/LFUV ratios. This trend wasalready reported from a previous GALEX-IRAS study (Buatet al. 2005) obtained by a much smaller sample, and we haveconfirmed their conclusion.
9. By making use of stellar mass information derived fromSDSS flux densities in this work, we have examined thedust attenuation properties in terms of stellar mass. Wefound that the attenuation indicator LTIR/LFUV is correlatedto stellar mass of galaxies, M∗, but there is no correlationwith SSFR, SFR/M∗. This may mean that LTIR/LFUV is notlinked to the SF history, but simply scales with the size ofgalaxies. However, this is at odds with previous result ofIglesias-Páramo et al. (2006).
This sample will serve as an important reference sample atz = 0 for various further analysis or ongoing/future observa-tional projects, like Herschel: for instance, this can be used toconstruct a set of SEDs for discussing higher-z observationalstrategy, or as a baseline test sample to investigate a method ofextracting galaxies only from FIR flux information (e.g. Polloet al. 2010).
However, since our first sample is not complete in manysenses, further analysis will be desired. We plan to construct alarger multiwavelength sample from the next release of AKARIFIS all-sky survey in the near future.
Acknowledgements. We deeply thank the anonymous referee for her/his care-ful reading of the original manuscript, useful suggestions and comments whichimproved the clarity of the paper. This work is based on observations withAKARI, a JAXA project with the participation of ESA. T.T.T. has been supportedby Program for Improvement of Research Environment for Young Researchersfrom Special Coordination Funds for Promoting Science and Technology, andthe Grant-in-Aid for the Scientific Research Fund (20740105) commissioned bythe Ministry of Education, Culture, Sports, Science and Technology (MEXT) ofJapan. V.B. and D.B. have been supported by the Centre National des EtudesSpatiales (CNES) and the Programme National Galaxies (PNG). We thankAgnieszka Pollo, Mai Fujiwara, Akira Ikeyama, Ryosuke Asano, Akio K. Inoue,Hiroshi Shibai, Yasuo Doi, Hideaki Fujiwara, Mitsunobu Kawada, HidehiroKaneda, Hiroyuki Hirashita, and Takako T. Ishii for fruitful discussions and com-ments. T.T.T., F.T.Y., and K.L.M. are partially supported from the Grand-in-Aidfor the Global COE Program “Quest for Fundamental Principles in the Universe:from Particles to the Solar System and the Cosmos” from the MEXT.
Appendix A: Luminosity vs. redshift diagramsof the sample
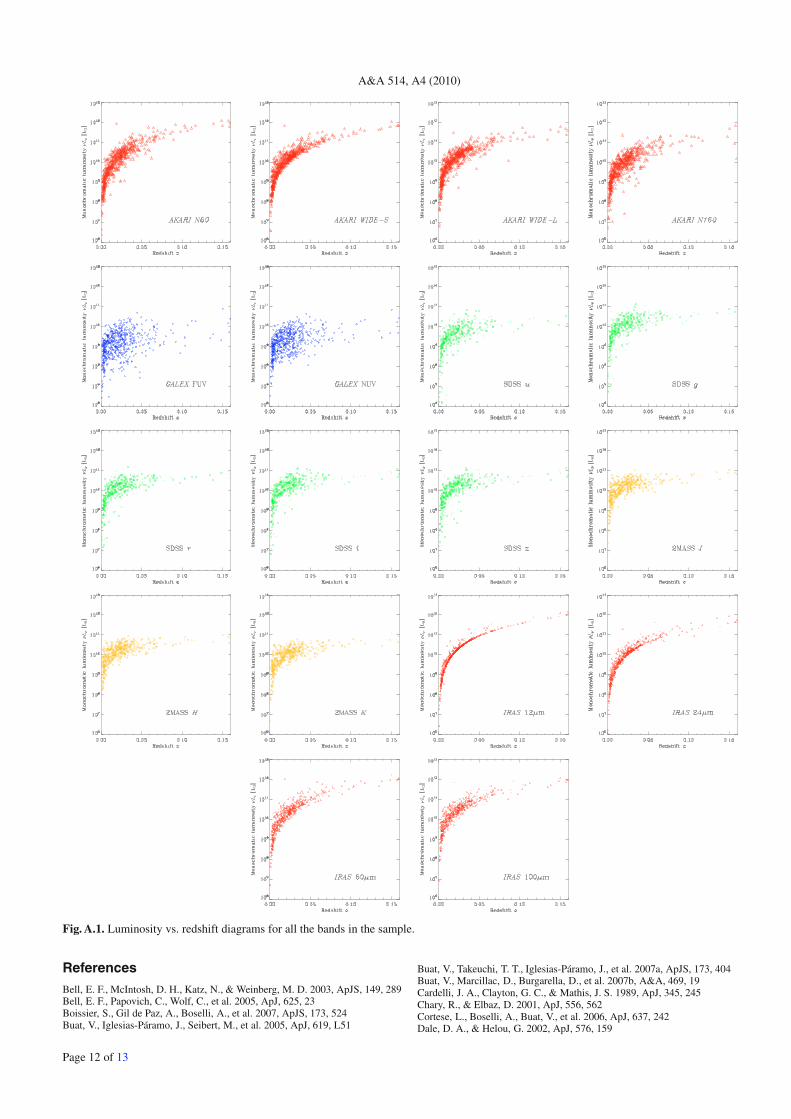
In Appendix, we show the redshift-luminosity relations for allthe bands we have used in the main text (Fig. A.1). These plotshelp to examine the effect of the selection functions of our sam-ple at each band.
Page 11 of 13
A&A 514, A4 (2010)
Fig. A.1. Luminosity vs. redshift diagrams for all the bands in the sample.
ReferencesBell, E. F., McIntosh, D. H., Katz, N., & Weinberg, M. D. 2003, ApJS, 149, 289Bell, E. F., Papovich, C., Wolf, C., et al. 2005, ApJ, 625, 23Boissier, S., Gil de Paz, A., Boselli, A., et al. 2007, ApJS, 173, 524Buat, V., Iglesias-Páramo, J., Seibert, M., et al. 2005, ApJ, 619, L51
Buat, V., Takeuchi, T. T., Iglesias-Páramo, J., et al. 2007a, ApJS, 173, 404Buat, V., Marcillac, D., Burgarella, D., et al. 2007b, A&A, 469, 19Cardelli, J. A., Clayton, G. C., & Mathis, J. S. 1989, ApJ, 345, 245Chary, R., & Elbaz, D. 2001, ApJ, 556, 562Cortese, L., Boselli, A., Buat, V., et al. 2006, ApJ, 637, 242Dale, D. A., & Helou, G. 2002, ApJ, 576, 159
Page 12 of 13
T. T. Takeuchi et al.: Star formation and dust extinction of galaxies from AKARI-GALEX
Dale, D. A., Helou, G., Contursi, A., et al. 2001, ApJ, 549, 215Dale, D. A., Bendo, G. J., Engelbracht, C. W., et al. 2005, ApJ, 633, 857Daddi, E., Dickinson, M., Morrison, G., et al. 2007, ApJ, 670, 156Dwek, E. 1998, ApJ, 501, 643Dwek, E., & Scalo, J. M. 1980, ApJ, 239, 193Genzel, R., & Cesarsky, C. J. 2000, ARA&A, 38, 761Gil de Paz, A., Boissier, S., Madore, B. F., et al. 2007, ApJS, 173, 185Goldader, J. D., Meurer, G., Heckman, T. M., et al. 2002, ApJ, 568, 651Helou, G., Khan, I. R., Malek, L., & Boehmer, L. 1988, ApJS, 68, 151Hirashita, H., Buat, V., & Inoue, A. K. 2003, A&A, 410, 83Hirashita, H., Kaneda, H., Onaka, T., & Suzuki, T. 2008, PASJ, 60, 477Hopkins, A. M., & Beacom, J. F. 2006, ApJ, 651, 142Iglesias-Páramo, J., Buat, V., Takeuchi, T. T., et al. 2006, ApJS, 164, 38Jarrett, T. H., Chester, T., Cutri, R., et al. 2000, AJ, 119, 2498Jeong, W.-S., Nakagawa, T., Yamamura, I., et al. 2007, PASJ, 59, 429Johnson, B. D., Schiminovich, D., Seibert, M., et al. 2007, ApJS, 173, 377Kartaltepe, J. S., Sanders, D. B., Frayer, D. T., et al. 2009, ASP Conf. Ser., 408,
272Kawada, M., Baba, H., Barthel, P. D., et al. 2007, PASJ, 59, 389Kong, X., Charlot, S., Brinchmann, J., & Fall, S. M. 2004, MNRAS, 349, 769Kroupa, P. 2001, MNRAS, 322, 231Martin, D. C., Fanson, J., Schiminovich, D., et al. 2005, ApJ, 619, L1Martin, D. C., Wyder, T. K., Schiminovich, D., et al. 2007, ApJS, 173, 342Meurer, G. R., Heckman, T. M., Leitherer, C., et al. 1995, AJ, 110, 2665Meurer, G. R., Heckman, T. M., & Calzetti, D. 1999, ApJ, 521, 64Morrissey, P., Conrow, T., Barlow, T. A., et al. 2007, ApJS, 173, 682Murakami, H., Baba, H., Barthel, P., et al. 2007, PASJ, 59, 369Nozawa, T., Kozasa, T., Umeda, H., Maeda, K., & Nomoto, K. 2003, ApJ, 598,
785Onaka, T., Matsuhara, H., Wada, T., et al. 2007, PASJ, 59, S401Pollo, A., Rybka, P., & Takeuchi, T. T. 2010, A&A, 514, A3Neugebauer, G., Habing, H. J., van Duinen, R., et al. 1984, ApJ, 278, L1
Reddy, N. A., & Steidel, C. C. 2009, ApJ, 692, 778Reddy, N. A., Steidel, C. C., Pettini, M., et al. 2008, ApJS, 175, 48Salim, S., Rich, R. M., Charlot, S., et al. 2007, ApJS, 173, 267Salpeter, E. E. 1955, ApJ, 121, 161Sanders, D. B., & Mirabel, I. F. 1996, ARA&A, 34, 749Saunders, W., Sutherland, W. J., Maddox, S. J., et al. 2000, MNRAS, 317, 55Schlegel, D. J., Finkbeiner, D. P., & Davis, M. 1998, ApJ, 500, 525Seibert, M., Martin, D. C., Heckman, T. M., et al. 2005, ApJ, 619, L55Skrutskie, M. F., Cutri, R. M., Stiening, R., et al. 2006, AJ, 131, 1163Soifer, B. T., Houck, J. R., & Neugebauer, G. 1987, ARA&A, 25, 187Soifer, B. T., Helou, G., & Werner, M. 2008, ARA&A, 46, 201Takeuchi, T. T., & Ishii, T. T. 2004, ApJ, 604, 40Takeuchi, T. T., Hirashita, H., Ohta, K., et al. 1999, PASP, 111, 288Takeuchi, T. T., Ishii, T. T., Hirashita, H., et al. 2001a, PASJ, 53, 37Takeuchi, T. T., Kawabe, R., Kohno, K., et al. 2001b, PASP, 113, 586Takeuchi, T. T., Yoshikawa, K., & Ishii, T. T. 2003a, ApJ, 587, L89Takeuchi, T. T., Hirashita, H., Ishii, T. T., Hunt, L. K., & Ferrara, A. 2003b,
MNRAS, 343, 839Takeuchi, T. T., Buat, V., & Burgarella, D. 2005a, A&A, 440, L17Takeuchi, T. T., Buat, V., Iglesias-Páramo, J., Boselli, A., & Burgarella, D.
2005b, A&A, 432, 423Takeuchi, T. T., Ishii, T. T., Nozawa, T., Kozasa, T., & Hirashita, H. 2005c,
MNRAS, 362, 592Vergani, D., Zamorani, G., Lilly, S., et al. 2010, A&A, 509, A42Verma, A., Charmandaris, V., Klaas, U., Lutz, D., & Haas, M. 2005, Space Sci.
Rev., 119, 355Yamamura, I., Fukuda, Y., & Makiuti, S. 2008, AKARI/FIS all-sky Survey
Bright Source Catalogue Version β-1 Release Note (Rev. 1)Yamamura, I., et al. 2009, in AKARI, a light to illuminate the misty Universe,
ed. T. Onaka, G. White, T. Nakagawa, I. Yamamura, ASP Conf. Ser., in pressYang, X., Mo, H. J., van den Bosch, F. C., et al. 2007, ApJ, 671, 153Zheng, X. Z., Bell, E. F., Rix, H.-W., et al. 2006, ApJ, 640, 784
Page 13 of 13