standardization of a rapid spectrophotometric method for ... · standardization of a rapid...
TRANSCRIPT
Standardization of a Rapid Spectrophotometric Method for Lycopene Analysis Gordon Anthon and Diane M. Barrett
Department of Food Science and Technology University of California – Davis 1 Shields Avenue Davis, CA 95616 USA Keywords: tomato, lycopene, analysis, spectrophotometric Abstract
Health professionals and consumers are becoming increasingly aware of the benefits of lycopene consumption; tomatoes provide the greatest source of this important phytonutrient. Our laboratory has developed a standard method for the extraction and determination of lycopene in tomato products. This is a sensitive, rapid and reproducible assay utilizing a mixture of hexane/ethanol/acetone for extraction. Following incubation for 1 hour, the hexane layer is removed using a Drummond pipettor and lycopene is determined by measuring absorbance at 503 nm. This method will be useful for breeding programs and processors who are interested in evaluation of a large number of samples in a rapid fashion. In this manuscript we describe the method and how it was validated. INTRODUCTION
There is currently no single standardized protocol for the routine determination of lycopene in tomatoes. In 2003, the California League of Food Processors requested that we evaluate published procedures for determination of lycopene, as well as develop a rapid method if such a procedure did not exist already. Based on our review of the many publications where lycopene content of tomatoes was determined, we concluded that a method based on solvent extraction followed by the direct spectrophotometric determination of lycopene will have the best combination of speed, simplicity, and analytical precision. Our focus was to examine and refine methods of this type with the aim of developing a single simplified protocol. We also include some data on the possible use of a reflectance colorimeter to estimate lycopene in tomato juice. SOLVENT EXTRACTION OF LYCOPENE
While many solvents and solvent combinations have been used to extract lycopene from tomatoes, none appears to offer an advantage over a mixture of hexane:ethanol:acetone at 2:1:1 (hereafter referred to as HEA), first used by Sadler et al. (1990). This original procedure called for 1 gram of tomato juice and 100 ml of the mixed solvents. Fish et al. (2002) later showed that these amounts could be reduced to 0.2 grams of juice and 20 ml of solvent. In either case an aliquot of tomato homogenate is weighed into a vial or flask, the solvent is added, and the lycopene is allowed to extract over the next 15 to 30 min. Water is added (15 ml per 100 ml of solvent) to cause a phase separation. The upper hexane phase contains all the lycopene, which can then be quantified spectrophotometrically or by High Performance Liquid Chromatography (HPLC). This solvent system has been used by many other investigators (e.g. Sharma and LeMaguer, 1996; Arias et al., 2000) and by the California League of Food Processors; and we believe the method should be adopted by the World Processing Tomato Council as the standard chemical method for all lycopene determinations. We have examined some of the details involved with using these solvents for extraction. Total Solvent Volume
If many samples are to be analyzed it is desirable to minimize the amount of solvent used per sample to reduce the cost of the assay. These costs include not only the
Proc. Xth IS on the Processing Tomato Eds.: A. B’Chir and S. Colvine Acta Hort. 758, ISHS 2007
111

purchase of the solvents but also the disposal costs. For the spectrophotometric quantification of extracted lycopene, only 3 ml of extract is actually needed. HPLC determinations require even less. Since the volume of the upper hexane layer is about half that of the total solvent volume, there is in theory no need to use more than 6 ml of the mixed solvents for the extraction. However, as a practical matter, to easily remove 3 ml of the upper layer without disturbing the lower layer, we have found that it is better if the total volume of solvent is slightly larger. For most of the work described here we have used 8 ml of the HEA solvent. To dispense this solvent we generally use a glass repipetter. Once properly calibrated we have found that this type of pipetter gives reproducible results. If only a few samples are to be analyzed it is generally not worth the trouble to set up this type of repeating pipetter. Instead a total solvent volume of 10 ml can be used, dispensed with a volumetric pipette.
One problem with using a reduced volume of organic solvent for extraction is that the amount of tomato that can be added to the assay without overloading it becomes very small. To get reasonable optical densities with 8 ml of extracting solvent, only about 100 mg, or about three drops, of juice from a typical tomato is needed. If added by weight, this requires weighing the sample to the nearest milligram or two. This can be a tedious and time consuming process when large numbers of samples are to be analyzed. As an alternative, we have found that adding the sample by volume, using a positive displacement pipetter, is a very accurate and more practical approach for handling these small amounts of liquid. Since the final result needs to be expressed as the amount of lycopene per weight of tomato, the weight of tomato juice dispensed by a 100 μL Drummond pipetter with various tomato products was examined (Table 1).
In most cases the weight is very close to 100 mg, as would be expected since tomato juice is mostly water. Two exceptions are catsup, which has a density greater than one, due to the presence of added sugars; and raw tomato juice prepared in an ordinary blender, which had a density less than one, due to the large amount of air in the solution. The reproducibility of these pipetters is excellent, in most cases ±1%. For the routine determination of lycopene this is a very acceptable level of precision. The advantages of dispensing the sample by volume are that it is rapid, and each assay receives the same sample size, eliminating the need to record the exact weight for each individual sample. This method of dispensing the sample is particularly appropriate for situations where large numbers of identically prepared samples are to be analyzed. We routinely use this procedure for analyzing samples of microwave hot break juice from our annual tomato variety evaluation trial. Before analyzing any large number of samples of a given type, it is a good idea to verify the precision and accuracy of the specific pipetter to be used with that type of sample by obtaining data like that in given in Table 1.
Despite all the advantages of reducing the amount of solvent used and dispensing the sample with a positive displacement pipetter, there are still cases where the original Sadler procedure using 100 ml of solvent and 1 gram of sample may be preferable. For instance, if the material is too viscous or contains too many large particles to be pipetted it may be necessary to add the sample by weight. The larger sample size is more easily weighed to the required accuracy. Small heterogeneities in the sample are also less likely to be a problem if a larger sample is used. The larger volume of solvent can be added using a simple graduated cylinder rather than a repipetter. For lab situations where delicate precision items like a repipetter or a Drummond pipetter might not be used correctly or survive at all, the simpler large volume procedure might be more appropriate. Time Course of Extraction
Extraction of lycopene with the HEA solvent system is rapid. Samples of tomato juice (100 μL) were incubated in 8 ml of solvent in a screw cap tube for various times before water was added to separate the phases and the lycopene absorbance of the upper layer determined. Almost no change in absorbance was observed over the time course, indicating that extraction was nearly complete after only 2 minutes, the earliest time point we analyzed (Fig. 1, left). A recommendation for a minimum extraction time of 10
112

minutes would appear to be conservative. Longer extraction times (up to 5 hours) also do not appear to be a problem (Fig. 1, right), which would allow many samples to be prepared at once for analysis later in the day. This is consistent with our belief that under normal laboratory conditions, lycopene is quite stable even after extraction into organic solvents (see discussion of lycopene stability, below).
Samples were mixed by using a vortex when the solvent was added and again after the addition of the water, but in between they received no agitation. Additional agitation during extraction does not appear to be needed. Vortexing immediately after solvent addition is essential for dispersing the sample in the organic solvent. If this mixing is delayed, we have observed that the tomato juice sample can sometimes adhere to the wall of the tube and greatly slow the lycopene extraction. Volume of Upper Layer
Quantification of lycopene, whether spectrophotometric or by HPLC, only determines the concentration of lycopene in the extract. To determine the amount of lycopene in the original sample, the volume of the extract must be known in order to convert this concentration into an amount. In the extraction procedure with hexane/acetone/ethanol (HEA), a known volume of mixed solvent is added, then after the lycopene has been extracted, water is added and the solvents separate into two phases. The upper layer, which contains the lycopene, is used for lycopene determination. This upper layer is primarily hexane and thus it has been assumed (Sadler et al., 1990; Fish et al., 2002) that its volume is simply equal to the volume of hexane added, or one half of the original volume of the mixed solvents. However, based on our experience with similar solvent systems, we have found that this is not necessarily a good assumption. Simple visual determination of this upper layer volume using a graduated cylinder indicated that its volume was actually slightly larger than the volume of added hexane. We undertook a more precise determination of this volume for both large and small total volumes of solvents.
The determination of the upper layer volume was based on the following. According to Beer’s Law, the optical absorbance of a lycopene solution is proportional to the lycopene concentration. The lycopene concentration is in turn simply the amount of lycopene per volume. Thus for a given amount of lycopene, the absorbance of the solution will be inversely proportional to its volume. The volume of the upper layer of the mixed solvents can thus be determined by measuring the absorbance of this layer when it contains a known amount of lycopene and comparing this absorbance to that obtained when the same amount of lycopene is dissolved in a known volume of hexane. By simple proportionality the volume of the upper layer can be calculated from the known volume of hexane and the ratio of the two measured absorbances.
To determine the upper layer volume for the original Sadler procedure, a small volume of a concentrated lycopene solution in hexane was added to a 125 ml flask and evaporated to dryness. This material was then re-dissolved in 50 ml of hexane and the absorbance at 503 nm was determined. Next 25 ml each of ethanol and acetone were added, and after separation of the phases by the addition of 15 ml of water, the upper layer was collected and the absorbance at 503 nm again determined. The absorbance of this upper layer was then compared to the absorbance obtained when the lycopene was initially dissolved in 50 ml of hexane. In all cases the absorbance obtained for the upper layer was less than that initially obtained when the sample was dissolved in hexane alone. The ratio of the final to the initial absorbance was 0.914±0.008 (n=3). Since both absorbance measurements were made on the same amount of lycopene, the differences in absorbances must reflect the differences in volumes. Thus, from this ratio of absorbance’s and the known initial hexane volume (50 ml), a volume of 54.7±0.5 ml can be calculated (i.e. 50 ÷ 0.914) for the upper layer when 50 ml of hexane and 25 ml each of ethanol and acetone (or equivalently 100 ml of the mixed solvents) are used for extraction. Previous calculations made by others that assumed a 50 ml volume for this layer would have underestimated the true amount of lycopene by about 10%.
113

We also determined the volume of the upper layer when smaller volumes of solvents are used. In this case 0.1 ml aliquots of a concentrated lycopene solution were added to a series of screw cap tubes and then allowed to evaporate to dryness. To some of these samples known volumes of hexane were added, and the absorbances of the resulting solutions determined. A standard curve for absorbance versus hexane volume was then constructed. To the remaining samples various volumes (7 to 12 ml) of the mixed solvents were added, followed by water to separate the phases. The absorbance’s of the resulting upper layers were determined, and from the slope of the standard curve for the known volumes, the volumes of the upper layers were calculated (Table 2). In all cases the ratio of the volume of the upper layer to the volume of the solvents used was close to 0.55. The overall average was 0.548. Two different 8 ml samples are included in Table 2. In the one marked with (*) the individual extracting solvents were added separately (4 ml hexane + 2 ml ethanol + 2 ml acetone) rather than premixed and added all at once as with the other samples. Separate versus combined solvent addition had no effect on the final volume of the upper layer.
In the samples in Table 2, the ratio of the volume of water added, to the volume of the extracting solvents was kept constant at 0.125. This is slightly less than the 0.15 used in the original Sadler procedure. To see if this water volume affected the final volume of the upper layer we repeated the experiment in Table 2, but with a constant 7 ml of the mixed solvents and variable amounts of water (Table 3). Over this range of water to solvent ratios, the volume of the upper layer was not affected.
The average value for the ratio of the upper layer volume to the volume of mixed solvents in Table 3 is 0.549. This is virtually identical to the average value of 0.548 in Table 2 and agrees very well with 54.7 ml determined above for 100 ml of extracting solvent. Therefore, in all our calculations we have incorporated a factor of 0.55 for the ratio of the upper layer volume to the volume of extracting solvent used. Stability of Extracted Lycopene
The literature is full of statements that, once extracted into organic solvents, lycopene becomes highly susceptible to isomerization and/or degradation by light and oxidants. Many papers report taking elaborate precautions such as working in the dark or under safe lights, or adding of antioxidants such as BHT to the solvents to prevent this breakdown. Some recent papers (Fish et al., 2002; Ishida et al., 2001) disagree with this assessment and show that at room temperature, in hexane and other solvents, trans-lycopene is lost by isomerization or others breakdown at less than 1% per hour. Further, it was shown that antioxidants such as BHT had no effect on this slow degradation. In contrast, others (Nguyen and Schwartz, 1998) have continued to stress the instability of lycopene in organic solvents and the need to take precautions when working with extracted lycopene. They reported isomerization rates as high as 50% in 3 hours in the dark when lycopene was dissolved in the solvent MTBE. It is possible that this higher rate of isomerization was due to this particular solvent.
Since the optical absorption spectra of isomerized or decomposed lycopene differs from that of trans-lycopene, monitoring the absorption spectra of a lycopene extract is a simple way to measure any breakdown or isomerization. We examined the absorbance spectra of lycopene dissolved in both hexane and MTBE to see if we could detect any changes over time. To do this, samples of tomato extracts containing lycopene were evaporated to dryness then re-dissolved in either hexane or MTBE. The absorbance spectra were recorded then the sealed cuvettes were left on the lab bench for 24 hours before re-determining the spectra. In neither solvent did we observe any significant change in the absorbance spectrum over the 24 hour period. A very small decrease in absorbance at 503 nm (<1%) was noted in each which is consistent with a very low rate of isomerization. This is consistent with the data in Figure 1 which showed that letting the extracted samples sit for 5 hours on the lab bench did not affect the lycopene determination. We cannot explain the earlier report (Nguyen and Schwartz, 1998) that
114

found such a high rate of isomerization for lycopene in MBTH. It is possible that certain artifacts associated with HPLC analysis are to blame.
From a practical point of view there is apparently no need to worry about the stability of lycopene when working under normal laboratory conditions and precautions such as safe lights or added anti-oxidants are unnecessary. Since the solvents used for lycopene extraction are quite volatile, evaporation of solvent is more likely to be a cause of errors if samples are left for extended periods. We should point out that the stability of extracted lycopene is affected by light. It is likely that if exposed to very bright light, such as direct sunlight, the rates of lycopene isomerization and breakdown would become more significant and thus such exposure should be avoided. QUANTIFICATION
The concentration of lycopene in a solvent extract from tomatoes can be determined either spectrophotometrically or by HPLC. An accurate quantification of the lycopene in the tomato extract by a single spectrophotometric measurement is possible because lycopene has an absorbance peak at a higher wavelength (503 nm), and is present at much higher concentrations than the other cartenoids in a tomato. The absorbance spectrum for cis- and trans-lycopene, as well as for β-carotene is given in Figure 2. Lycopene has three peaks of absorbance, 444, 471 and 503 nm. This third peak is at a wavelength at which the absorbance of β-carotene (and other minor carotenoids) have relatively low absorbance and thus cause very little interference. Measurements of absorbance at 503 nm are thus very good estimates of the lycopene content. HPLC methods add complexity and expense but do not significantly increase the accuracy of the determination. We see no need for HPLC analysis and thus will limit our discussion to the spectrophotometric method. Quantification of Lycopene by Absorbance at 503 nm
The extinction coefficients for lycopene in hexane were determined first by Zechmeister (1943) and a value of 172,000 M-1cm-1 for 503 nm is generally accepted. Using this extinction coefficient, the concentration of lycopene in a hexane extract can be determined from the absorbance of the solution at 503 nm. To convert this concentration into the weight of lycopene present in the original tomato sample, four additional numbers need to be factored in: 1. The ratio of the upper layer volume to the volume of mixed extracting solvents added,
0.55 for hexane:acetone:ethanol (2:1:1), as discussed above. 2. The molecular weight of lycopene, 537 (g/mole). 3. The weight of tomato juice analyzed (or its volumetric equivalent as described above),
W (mg). 4. The volume of mixed solvents added, V.
With these additional factors the concentration of lycopene in the tomato sample (C) in mg/kg is:
C (mg/kg) = (A503/172,000) 0.55V 537 1/W 106
Or it can be simplified to:
C (mg/kg) = 1,717 A503 V/W (1)
If 100 μL of tomato juice (equal to100 mg) and 8 ml of solvent are used then this becomes: C (mg/kg) = 137.4 A503 (2)
This simple method ignores any interference from other carotenoids such as β-carotene and thus may slightly overestimate the amount of lycopene. As shown below this overestimation is probably less than 2%.
115

Interferences by Other Pigments In addition to lycopene, ripe red tomatoes contain small amounts of other
carotenoids, principally β-carotene. If unripe material is included, there will also be small amounts of chlorophyll. These pigments are extracted into the non-polar upper phase along with the lycopene and could contribute to the measured absorbance at 503 nm. Since chlorophyll has virtually no absorbance between 500 and 600 nm, and is likely to be present at very low levels, its contribution will be negligible and can be ignored. Interference by β-carotene is more significant. Published values for the amount of β-carotene in red tomatoes, based on HPLC analysis, vary widely but in most cases are between 5% and 15% of the amount of lycopene. Based on the absorbance spectrum for β-carotene, it has been estimated that this leads to only a few percent error in the determination of lycopene by absorbance at 503 nm (Fish et al., 2003). In addition to β-carotene, there are also much smaller amounts of other carotenoids such as lutein and γ-carotene (Nguyen et al., 2001). These other carotenoids have absorbance spectra similar to that of β-carotene so their contribution to the total absorbance at 503 nm is minimal.
HPLC analysis has shown that some of the lycopene in a tomato is present as various cis-isomers rather than as the all trans-form. This affects the determination of total lycopene because some of the cis-isomers have lower absorbance at 503 nm than the all trans-form. By HPLC analysis the proportion of lycopene present as cis-isomers, in both raw and processed tomato products, is generally found to be no more than 5%. In some cases higher proportions have been found, but it is likely that these are due to isomerization after extraction and other artifacts associated with HPLC analysis (Scott, 1992). The cis-forms that have a lower absorbance at 503 nm also have a characteristic peak a 361 nm (Fig 2). Our analysis of the absorbance spectrum of a tomato extract prepared in the HEA solvent system showed only a very small peak at 361 nm indicating that the abundance of cis-isomers is very low.
As a reasonable approximation, all of the optical absorbance of an extract of red tomatoes is due to trans-lycopene and β-carotene. In such two component systems it is possible to determine the amount of each component by measuring absorbance’s at two wavelengths, then calculating the concentration of each component from their known absorbance’s at those wavelengths. To apply this to lycopene and β-carotene, one must know the extinction coefficient, which is the amount of absorbance for a given amount of a compound at a specified wavelength, for these two compounds at two wavelengths. The molar extinction coefficients for lycopene at the three main absorbance peaks, 444, 471, and 503 nm have been determined (Zechmeister et al., 1943) and are given in Table 4. The molar extinction coefficients for β-carotene at these same three wavelengths have not been published but can be determined by measuring the absorbance of β-carotene at these wavelengths and at 451 nm, a wavelength where the molar extinction of β-carotene is known. Using a value of 139,000 for the molar extinction coefficient at 451 nm (Zechmeister and Polgar, 1943), and calculating the ratios of the absorbance’s of a β-carotene solution at these other wavelengths to that at 451 nm, the values in Table 4 were obtained.
Assuming that all of the absorbance of a hexane extract from tomato is due to trans-lycopene and β-carotene, then the measured absorbance at any wavelength is simply the sum of the absorbance due to each compound. The total absorbance at the two wavelengths of interest, 444 and 503 nm is given by:
Absorbance (503 nm) = εlycopene (503) Clycopene + εβ-carotene (503) Cβ-carotene
Absorbance (444 nm) = εlycopene (444) Clycopene + εβ-carotene (444) Cβ-carotene Where Clycopene and Cβ-carotene are the concentrations of lycopene and β-carotene and εlycopene and εβ-carotene are the molar extinction coefficients for lycopene and β-carotene at these two wavelengths. Solving these equations for the concentrations, and plugging in the values in Table 4 for the extinction coefficients gives:
116
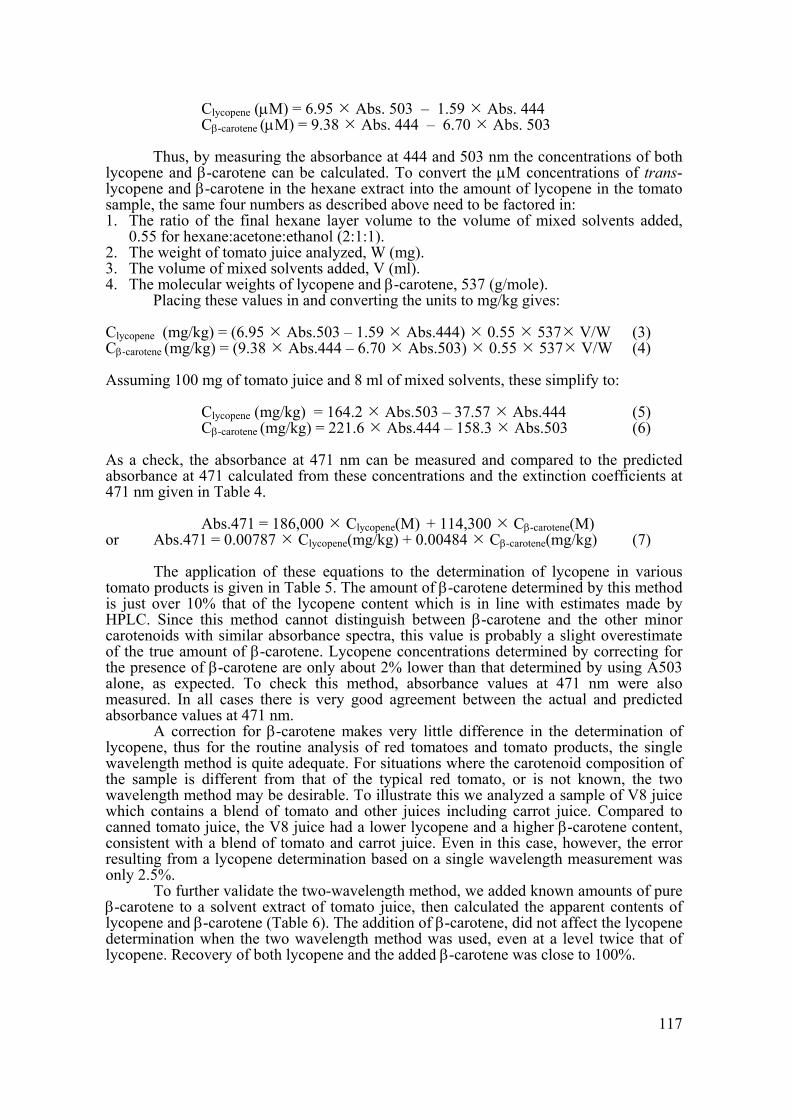
Clycopene (μM) = 6.95 Abs. 503 – 1.59 Abs. 444 Cβ-carotene (μM) = 9.38 Abs. 444 – 6.70 Abs. 503
Thus, by measuring the absorbance at 444 and 503 nm the concentrations of both lycopene and β-carotene can be calculated. To convert the μM concentrations of trans-lycopene and β-carotene in the hexane extract into the amount of lycopene in the tomato sample, the same four numbers as described above need to be factored in: 1. The ratio of the final hexane layer volume to the volume of mixed solvents added,
0.55 for hexane:acetone:ethanol (2:1:1). 2. The weight of tomato juice analyzed, W (mg). 3. The volume of mixed solvents added, V (ml). 4. The molecular weights of lycopene and β-carotene, 537 (g/mole).
Placing these values in and converting the units to mg/kg gives: Clycopene (mg/kg) = (6.95 Abs.503 – 1.59 Abs.444) 0.55 537 V/W (3) Cβ-carotene (mg/kg) = (9.38 Abs.444 – 6.70 Abs.503) 0.55 537 V/W (4) Assuming 100 mg of tomato juice and 8 ml of mixed solvents, these simplify to:
Clycopene (mg/kg) = 164.2 Abs.503 – 37.57 Abs.444 (5)
Cβ-carotene (mg/kg) = 221.6 Abs.444 – 158.3 Abs.503 (6) As a check, the absorbance at 471 nm can be measured and compared to the predicted absorbance at 471 calculated from these concentrations and the extinction coefficients at 471 nm given in Table 4. Abs.471 = 186,000 Clycopene(M) + 114,300 Cβ-carotene(M) or Abs.471 = 0.00787 Clycopene(mg/kg) + 0.00484 Cβ-carotene(mg/kg) (7)
The application of these equations to the determination of lycopene in various tomato products is given in Table 5. The amount of β-carotene determined by this method is just over 10% that of the lycopene content which is in line with estimates made by HPLC. Since this method cannot distinguish between β-carotene and the other minor carotenoids with similar absorbance spectra, this value is probably a slight overestimate of the true amount of β-carotene. Lycopene concentrations determined by correcting for the presence of β-carotene are only about 2% lower than that determined by using A503 alone, as expected. To check this method, absorbance values at 471 nm were also measured. In all cases there is very good agreement between the actual and predicted absorbance values at 471 nm.
A correction for β-carotene makes very little difference in the determination of lycopene, thus for the routine analysis of red tomatoes and tomato products, the single wavelength method is quite adequate. For situations where the carotenoid composition of the sample is different from that of the typical red tomato, or is not known, the two wavelength method may be desirable. To illustrate this we analyzed a sample of V8 juice which contains a blend of tomato and other juices including carrot juice. Compared to canned tomato juice, the V8 juice had a lower lycopene and a higher β-carotene content, consistent with a blend of tomato and carrot juice. Even in this case, however, the error resulting from a lycopene determination based on a single wavelength measurement was only 2.5%.
To further validate the two-wavelength method, we added known amounts of pure β-carotene to a solvent extract of tomato juice, then calculated the apparent contents of lycopene and β-carotene (Table 6). The addition of β-carotene, did not affect the lycopene determination when the two wavelength method was used, even at a level twice that of lycopene. Recovery of both lycopene and the added β-carotene was close to 100%.
117

In addition to correcting for the presence of carotenoids, multiple wavelength measurements can also be used to correct for background absorbance, due to things like air bubbles, dirt on the cuvette, or improper zeroing of the spectrophotometer. At 600 nm neither lycopene nor β-carotene has any appreciable absorbance. By measuring the absorbance at this wavelength and subtracting this value from the measured absorbance at 503 nm, any background absorbance is subtracted out and has no effect on the final result.
The difference in the lycopene concentration calculated from a single measurement at 503 nm, versus one corrected for β-carotene and background absorbance is very small. For the routine analyses with typical red tomatoes it is reasonable to ignore these corrections and use the single wavelength method. On the other hand, with modern spectrophotometers, like the Shimadzu UV-1700, it is trivial to make readings at several wavelengths and have the instrument calculate a lycopene concentration corrected for β-carotene and background absorbance. For example, using the UV-1700 in the multiple wavelength mode, pre-programmed equation #2 can be used with the following wavelengths and coefficients, assuming 0.1 mL of tomato juice and 8 mL of the HEA solvents were used in the extraction:
λ1 = 444 K1 = -1.59 λ2 = 503 K2 = 6.95 λ3 = 600 K3 = -5.36 ---------- K4 = 23.63
Lycopene (mg/kg) = (K1 Abs.λ1 + K2 Abs.λ2 + K3 Abs.λ3) K4
The spectrophotometer will then give the corrected lycopene value directly. If the sample and cuvette are clean, and the spectrophotometer has been properly zeroed, the value for Abs.λ3 (the absorbance at 600 nm) will be zero and this equation becomes identical to equation (5) above. If amounts of tomato juice [W] or solvent [V] other than 100 mg and 8.0 ml are used, the value of K4 can be recalculated according to: K4 = 295.3 V/W Linearity and Precision
Using a Drummond positive displacement pipettor to measure the sample, and a repipettor to dispense the solvents, gives very reproducible results. The average coefficient of variance for the samples listed in Table 5 is 1.4%. We also checked the linearity of the assay. When volumes of hot break tomato juice up to 200 μL were extracted with 8 ml of solvent, a linear response was obtained (Fig. 3). Spectrophotometer
One consideration in the choice of spectrophotometer for the spectrophotometric quantification of lycopene is the minimum slit width or band pass of the instrument. Generally, the less expensive the instrument the wider this band pass will be. Since the peak in absorbance for lycopene at 503 nm is very sharp, using an inexpensive instrument with a wide slit width will result in a lower apparent absorbance. For example, if the instrument has a 10 nm slit width, and the monochrometer is set at 503 nm, the instrument is actually measuring all the light between 498 and 508 nm and the measured absorbance is the average absorbance over this range. This average absorbance will be less than that of the actual peak. The wider the slit width the bigger this error will become. From the absorbance spectrum of lycopene one can estimate the size of this error (Fig. 4). At a slit width of 5 nm the error is just over 1%. Wider slit widths should be avoided. SOLVENT-FREE METHODS
Since lycopene is the primary pigment in tomatoes, estimating the lycopene content based on direct color measurements of tomato juice has been proposed as an alternative to solvent extraction (Arias et al., 2000; Davis et al., 2003). Previously, we undertook an extensive examination of some of these methods but had limited success
118
(Anthon and Barrett, 2006). A reasonable linear relationship between lycopene content and optical absorbance was obtained using a Hunter Lab UltraScan (Reston, VA). However, when we tried to use this method to discriminate between the relatively small differences in lycopene content in the samples from our annual tomato variety evaluation project, we were unsuccessful. We were also unsuccessful with color or optical density measurements made with a Hunter Lab LabScan XE. Despite these failures, we gave these methods one additional try, with some minor modifications in the procedure.
Based of the results presented in Anthon and Barrett (2004), it appeared that measurements with a LabScanXE might be most effective if the juice samples were highly diluted with water. We thus restricted our measurements to juice which had been diluted 10-fold with water. Frozen samples of microwave hot break juice were thawed and thoroughly mixed. Two 100 μL aliquots were removed for lycopene analysis by the standard spectrophotometric method, and then 5.0 g of the juice was weighed into a beaker. This was diluted with 45 ml of water then transferred into a glass cup and immediately measured with a LabScan XE. The sample was transferred in and out of the cup and re-measured. A total of three readings were taken and averaged. From the LabScan measurements various color and optical density values were calculated and plotted versus the lycopene contents of the samples.
The color parameter of these diluted samples which gave the best correlation with the lycopene content was the a/b ratio (Fig. 5). The relationship between a/b and lycopene is roughly linear. This is in contrast to undiluted juice samples where either no relationship or a non-linear relationship between lycopene concentrations and a/b ratio was found (Anthon and Barrett, 2006; Arias et al., 2000). It would appear that a/b measurements made on a 10-fold diluted juice sample might be useful as a rough screen to estimate lycopene levels. But given how easy and precise the measurement of lycopene by solvent extraction is, we question whether there is ever any reason to use such a method. Furthermore, to use such a method a calibration curve like that given in Figure 5 would need to be constructed, which would require the use of the solvent extraction method in any case.
One other optical method that could in theory be used to estimate lycopene is fluorescence. While lycopene does fluoresce under certain conditions (Fujii et al., 2001), our measurements on tomato juice indicated that the fluorescence level was too low to be useful as an analytical method (data not shown). CONCLUSION AND RECOMMENDATIONS
A very accurate measurement of the lycopene content of a tomato can be obtained with a simple solvent extraction and spectrophotometric determination. The correct determination is most dependent on how accurately the sample of tomato juice and the volume of solvent are added. We have found that dispensing the sample by volume with a Drummond positive displacement pipetter, and the solvent with a glass repipetter works well, but other methods would work equally well, so long as the addition of the sample and solvent are accurate. Since the lycopene is so highly colored, when a small volume of solvent is used for extraction the amount of tomato juice that can be added to the assay is quite small. It is essential then that the sample is well blended so that this small aliquot is representative of the sample as a whole. Whatever weight of sample and volume of solvent used, the lycopene content can be calculated using eq. (1), or if a correction for β-carotene is desired eq. (3). The correction for β-carotene only changes the calculated lycopene content by 2% with ordinary red tomatoes. Literature Cited Anthon, G.E. and Barrett, D.M. 2006. Potential and limitations for determining lycopene
in tomatoes by optical methods. Acta Hort. 724:243–246. Arias, R., Lee, T.C., Logendra, L. and Janes, H. 2000. Correlation of lycopene measured
by HPLC with the L*, a*, b* color readings of a hydroponic tomato and the
119

relationship of maturity with color and lycopene content. J. Agric. Food Chem. 48:1697–1702.
Barrett, D.M. and Anthon, G.E. 2001. Lycopene content of California-grown tomato varieties. Acta Hort. 542:165–173.
Davis, A.R., Fish, W.W. and Perkins-Veazie, P. 2003. A rapid spectrophotometric method for analyzing lycopene content in tomato and tomato products. Postharvest Biol. Technol. 28: 425–430.
Fish, W.W., Perkins-Veazie, P. and Collins, J.K. 2002. A quantitative assay for lycopene that utilizes reduced volumes of organic solvents. J. Food Comp. and Anal. 15:309–317.
Fujii, R., Onaka, K., Nagae, H., Koyama, Y. and Watanabe, Y. 2001. Fluorescence spectroscopy of all trans-lycopene. J. Luminescence. 92:213–222.
Ishida, B.K., Ma, J. and Chan, B. 2001. A simple, rapid method for HPLC analysis of lycopene isomers. Phytochem. Anal. 12:194–198.
Khachik, F., Goli, M.B., Beecher, G.R., Holden, J., Lusby, W.R., Tenorio, M.D. and Barrera, M.R. 1992. Effect of food preparation on qualitative and quantitative distribution of major carotenoid constituents of tomatoes and several green vegetables. J. Agric. Food Chem. 40:390–398.
Konings, E.J.M. and Roomans, H.S. 1997. Evaluation and validation of an LC method for the analysis of carotenoids in vegetables and fruit. Food Chem. 59:599–306.
Lin, C.H. and Chen, B.H. 2003. Determination of carotenoids in tomato juice by liquid chromatography J. Chromatog. A. 1012:103–109.
Nguyen, M.L. and Schwartz, S.J. 1998. Lycopene stability during food processing. Proc. Soc. Exp. Biol. Med. 218:101–105.
Nguyen, M., Francis, D. and Schwartz, S. 2003. Thermal isomerization susceptibility of carotenoids in different tomato varieties. J. Sci. Food Agric. 81:910–917.
Rao, A.V., Waseem, Z. and Agrawal, S. 1999. Lycopene content of tomatoes and tomato products and their contribution to dietary lycopene. Food Res. Intl. 31:737–743.
Sadler, G., Davis, J. and Dezman, D. 1990. Rapid extraction of lycopene and β-carotene from reconstituted tomato paste and pink grapefruit homogenates. J. Food Sci. 55:1460–1461.
Scott, K.J. 1992. Observations on some of the problems associated with the analysis of carotenoids in foods by HPLC. Food Chem. 47:403–404.
Sharma, S. and LeMaguer, M. 1996. Kinetics of lycopene degradation in tomato pulp solids under different processing and storage conditions. Food Res. Intl. 29:309–315.
Zechmeister, L., LeRosen, A.L., Schroder, W.A., Polger, A. and Pauling, L. 1943. Spectral characteristics and configuration of some stereoisomeric carotenoids including prolycopene and pro-γ-carotene. J. Am. Chem. Soc. 65:1940–1951.
Zechmeister, L. and Polgar, A. 1943. cis-trans isomers and spectral characteristics of carotenoids and some relate compounds. J. Am. Chem. Soc. 65:1522–1528.
Tables Table 1. Weight (mg) of tomato material dispensed by a 100 μL Drummond positive
displacement pipetter.
Tomato product
Weight of 100 μL mean ± s.d. (n=12)
Raw tomato juice (blender prepared) 93.5±2.2 Microwave hot break juice 98.8±1.2 Commercial hot break juice 99.6±0.9 Canned tomato juice 100.3±0.9 Paste (diluted 1:4 with water) 100.7±0.7 Catsup (diluted 1:1 with water) 105.7±1.1
120

Table 2. Determination of the upper solvent layer volume. Calculated upper layer
volumes are the mean and standard deviation of triplicate determinations.
Mixed solvent volume (ml)
Upper layer volume (ml)
Volume ratio upper layer/mixed solvents
7 3.93±0.04 0.561 8 4.38±0.03 0.547
8* 4.36±0.05 0.545 9 4.98±0.04 0.553 10 5.54±0.05 0.554 11 6.11±0.13 0.555 12 6.41±0.04 0.535
0.548±0.019 Table 3. The effect of different water volumes on the volume of the upper layer. In all
cases 7 ml of the mixed solvent were used for extraction and then the indicated amount of water was added to separate the phases. Calculated upper layer volumes are the mean and standard deviation of triplicate determinations.
Water (ml) Ratio
water/solvent Upper layer Volume (ml)
Volume ratio upper layer/mixed solvents
0.4 0.06 3.84±0.05 0.549 0.7 0.10 3.83±0.05 0.547 1.1 0.16 3.90±0.04 0.557 1.6 0.23 3.79±0.08 0.541
0.54±0.006 Table 4. Molar extinction coefficients for trans-lycopene and β-carotene.
Wavelength trans-lycopene β-carotene
444 nm 123,000 127,500 471 nm 186,000 114,300 503 nm 172,000 29,100
121

Table 5. Lycopene and β-carotene contents of various tomato products. Tomato paste was
diluted 1:4 and catsup was diluted 1:1 with water before analysis. One hundred microliter aliquots of the various tomato products were extracted with 8 ml of solvent. Absorbance values were measured at the three wavelengths indicated, then the lycopene and β-carotene contents calculated using the dual wavelength method according to eqs. (3) and (4) using the weights given in table 1. Predicted absorbances at 471 nm were calculated according to eq. (7). Lycopene contents were also determined based on A503 alone according to eq. (1). The percent difference in the lycopene values as determined by the single and dual wavelength methods is indicated. All samples were assayed in triplicate.
A444 and A503
Measured Absorbances Tomato Product A503 A444 A471
Predicted A471
β-carotene (mg/kg)
Lycopene (mg/kg)
A503 Lycopene (mg/kg)
% Diff.
Roma Raw juice
0.550 ± 0.010
0.426 ± 0.008
0.625 ± 0.012
0.623 ± 0.012 8.5±0.2 80.5±1.5 81.9±1.5 1.8
Hot Break Juice
0.646 ± 0.008
0.510 ± 0.007
0.739 ± 0.009
0.738 ± 0.009 11.1±0.2 88.0±1.1 89.9±1.1 2.1
Canned Juice
0.679 ± 0.004
0.523 ± 0.003
0.768 ± 0.004
0.766 ± 0.005 9.1±0.2 92.8±0.5 94.3±0.6 1.7
Diluted Paste
0.815 ± 0.017
0.640 ± 0.026
0.933 ± 0.035
0.928 ± 0.029 13.2±3.1 110.8±1.9 113.1±2.4 2.0
Diluted Catsup
0.498 ± 0.010
0.387 ± 0.008
0.564 ± 0.012
0.562 ± 0.012 6.7±0.2 64.0±1.2 65.2±1.2 1.8
V8 Juice
0.642 ± 0.006
0.515 ± 0.005
0.742 ± 0.008
0.740 ± 0.007 13.0±0.2 87.1±0.8 89.3±0.8 2.5
122

Table 6. Recovery of added β-carotene. Lycopene and β-carotene were determined, as described in table 5, for an extract of microwave hot break juice prepared from a roma tomato. Determinations were also made for two different aliquot sizes of a concentrated solution of pure β-carotene as well as for extracts of the hot break juice spiked with these aliquots of the pure β-carotene.
A444 and A503
Measured Absorbances % Recovery Tomato Product A503 A444 A471
Predicted A471
β-carotene (mg/kg)
Lycopene (mg/kg) β-carot. Lyc.
Roma Hot break juice
0.319 ± 0.003
0.263 ± 0.003
0.371 ± 0.002
0.372 ± 0.003 7.6±0.8 42.4±0.4
10 μL β-carotene
0.058 ± 0.001
0.236 ± 0.006
0.210 ± 0.006
0.211 ± 0.005 42.6±0.5 -0.6±0.5
20 μL β-carotene
0.088 ± 0.002
0.411 ± 0.010
0.365 ± 0.009
0.365 ± 0.009 77.1±1.9 -1.2±0.0
Juice plus 10 μL β-carotene
0.368 ± 0.013
0.471 ± 0.009
0.560 ± 0.014
0.558 ± 0.014 45.9±0.4 42.4±1.8 91.5 100
Juice plus 20 μL β-carotene
0.415 ± 0.007
0.689 ± 0.019
0.754 ± 0.016
0.753 ± 0.017 86.9±3.7 42.0±1.0 102.6 98.9
Figures
00.10.20.30.40.50.60.7
0 10 20 30
extraction time (min)
A50
3
00.10.20.30.40.50.60.7
0 100 200 300
extraction time (min)
A50
3
Fig. 1. Time course for lycopene extraction in HEA. Samples of tomato juice (100 μL) were incubated in 8 ml of solvent in a screw cap tube for various times before 1 ml of water was added to separate the phases and the absorbance at 503 nm of the upper layer determined. Figure on the right shows the absorbance over an extended time course.
123

β-carotene
trans-lycopene
cis-lycopene
0
0.2
0.4
0.6
0.8
1
1.2
350 400 450 500 550
w avelength (nm)
Abs
orba
nce
Fig. 2. Left: The absorbance spectra of β-carotene and cis- and trans- lycopene (adapted
from Ishida et al., 2001). The dashed line indicates 503 nm. Right: The absorbance spectrum of a hexane extract of tomato.
y = 0.0055x + 0.0005R2 = 0.9984
0
0.2
0.4
0.6
0.8
1
1.2
0 50 100 150 200Tomato Juice (μL)
A50
3
Fig. 3. Linearity of the lycopene assay. Different size aliquots of hot break juice were dispensed with a Drummond micropipetter, then samples were extracted with 8mL of HEA and absorbance at 503 nm determined.
124

-7
-6
-5
-4
-3
-2
-1
0
0 5 10
Slit Width (nm)
% E
rror
15
Fig. 4. Error in the determination of the 503 nm lycopene peak versus the slit width of the
spectrophotometer.
ig. 5. Relationship between the a/b ratio of a 10-fold diluted juice sample and the
y = 0.0039x + 0.3319R2 = 0.887
0.4
0.5
0.6
0.7
0.8
0.9
20 40 60 80 100 120
Lycopene (mg/kg)
a/b
Flycopene content of the tomato juice. The lycopene values given are for the undiluted juice.
125

Appendix Spectrophotometric determination of lycopene from tomatoes by extraction with hexane/ethanol/acetone and absorbance measurement at 503 nm Solvents. Acetone and hexane are HPLC grade from Fisher. The ethanol used is 200 proof absolute ethanol, which can be obtained from Aldrich or Spectrum chemicals. Mix in a ratio of two parts hexane to one part acetone and one part ethanol. Only mix as much solvent as you plan to use in the next few days and keep in a well stoppered bottle. Procedure.1. Starting with well homogenized tomato juice (prepared under vacuum to minimize the
introduction of air bubbles), use a 100 μL Drummond micropipettor to take a sample. After drawing the sample into the pipetter, wipe any tomato juice from the outside of the glass bore with a kimwipe then inspect the pipetter to be sure no large air bubbles have been included. Dispense the sample into a 20 125 screw cap tube. Also prepare several blank samples with 100 μL water instead of tomato pulp.
2. Add 8.0 ml of hexane:ethanol:acetone (2:1:1) using a repipetter. Cap and vortex the tube immediately then incubate out of bright light.
3. After at least 10 minutes, or as long as several hours later, add 1.0 ml water to each sample and vortex again.
4. Let samples stand 10 minutes to allow phases to separate and all air bubbles to disappear.
5. Rinse the cuvette with the upper layer from one of the blank samples. Discard, then use a fresh blank to zero the spectrophotometer at 503 nm (see comment #5 below). Determine the A503 of the upper layers of the lycopene samples.
Calculation of lycopene levels. Lycopene levels in the hexane extracts were calculated according to:
Lycopene (mg/kg fresh wt.) = (A503 x 537 x 8 x 0.55)/(0.10 x 172) (1) = A503 x 137.4 (2) where 537 g/mole is the molecular weight of lycopene, 8 ml is the volume of mixed solvent, 0.55 is the volume ratio of the upper layer to the mixed solvents, 0.10 g is the weight of tomato added, and 172 mM-1 is the extinction coefficient for lycopene in hexane. If 100 µL of tomato juice is analyzed but the volume of mixed solvent used is something other than 8 ml (see comment #1 below), then the lycopene concentration can be calculated by: Lycopene (mg/kg fresh wt.) = A503 x 17.17 x V Where V is the volume of mixed solvent added, in ml. Comments on the procedure. 1. If only a few samples are to be analyzed, rather than setting up a repipetter, the
solvent can be added using a 10 mL volumetric pipette. One ml of water can still be used to separate the phases. The multiplication factor for calculating the lycopene concentration increases from 137.4 to 171.7. If the sample material cannot be easily be pipetted, then it can be added by weight. In theory one could weigh out about 100 mg of tomato material and follow the procedure described above, but from a practical point of view it is easier and more accurate to weigh out a larger sample and then follow the original Sadler procedure for extraction. For this about 1.0 g of tomato material is accurately weighed into a 125 ml Erlenmeyer flask and 100 ml of mixed solvent is added with a graduated cylinder. The flask is sealed with a rubber stopper then, after at least 10 minutes of extraction, 15 ml of water is added to separate the phases and A503 of the upper phase determined. The lycopene concentration is given by:
126

Lycopene (mg/kg fresh wt.) = A503 x 171.7/ W where W is the exact weight of tomato added, in grams. 2. This extraction procedure is optimized for the amounts of lycopene typically found in
undiluted juice from red tomatoes. To analyze products like paste or other products where the tomato material has been concentrated, the material must be diluted with water back to the consistency of juice. If not diluted the amount of lycopene in the assay may be too high, leading to either incomplete extraction or too high of an absorbance value. Formulated products containing more than just tomatoes can also be analyzed using this procedure but only with care. The dual wavelength procedure should be used and the density of the material checked if the sample is to be added by volume. The dual wavelength procedure should also be used for analyzing juice from tomatoes that differ from the typical red, fully ripe material used for processing.
3. The solvents used in this procedure are very prone to evaporation and must be kept in a well stoppered bottle. Keep this bottle closed as much of the time as possible. Optimally, fresh solvent should be mixed daily. The solvents are also flammable and prolonged exposure to the vapors is considered harmful. A fume hood should be used.
4. The mixed solvents are 50% hexane by volume. When separated into two phases, the upper phase is often referred to as the “hexane layer”, so one might expect it to have a volume equal to 50% of the original mixed solvent volume. Actually the upper layer is not pure hexane and has a volume equal to 55% that of the original mixed solvent volume.
5. Sometimes when the first sample is put in the cuvette tiny droplets or haziness will form. To avoid this, rinse the cuvette with a sample of upper layer from a blank sample. This removes any residual material in the cuvette that causes the haze to form. Sometimes the cuvette needs to be rinsed several times. Be sure that the blank used to zero the spectrophotometer is clear.
127

128