spectrophotometric characteristics of
TRANSCRIPT
SPECTROPHOTOMETRIC CHARACTERISTICS OF HEMOGLOBINS
I. BEEF BLOOD AND MUSCLE HEMOGLOBINS**t
BY JOHN H. SHENK, J. LOWE HALL, AN? H. H, KING
(From the Department of Chemistry, ‘Kansas State College of Agriculture and
Applied Science, Manhattan)
PLATE 1
(Received for publication, April 23, 1934)
In connection with extensive investigations of meat, it became desirable to include in the color studies quantitative determina- tions of blood and muscle hemoglobins in beef muscle tissue. We wished to know how importantly residual blood might affect the color of lean meat, and to what extent management and excitement previous to slaughter and delayed bleeding at slaughter might affect the quantity of residual blood; also, what effect pasture feed- ing of beef animals, either grass alone, or with grain supplement, might have on the quantity of muscle hemoglobin developed in the muscle tissue. In the mind of the buyer, the intensity of the red color of lean beef is naturally associated with the age of the animal, leading to a discrimination against deep red beef. It has been shown by Whipple (1) that exercise is also a factor in the develop- ment of muscle hemoglobin. Consequently, ranging animals might be expected to develop more muscle hemoglobin and a more intensely colored lean than animals confined in a dry lot, without showing any appreciable differences in other factors affecting quality.
* Contribution No. 181, Department of Chemistry.
t This investigation has been a part of an Agricultural Experiment Station project, “Meat investigations,” involving the cooperation of the Departments of Animal Husbandry, Home Economics, and Chemistry.
The authors acknowledge the valuable assistance of Professor D. L. Mack- intosh of the Department of Animal Husbandry, who superintended the slaughter and management of the beef carcass. Appreciation is expressed
to Dr. J. H. Burt of the Division of Veterinary Medicine, who performed the perfusion operation in preparing blood-free muscle tissue.
741
by guest on February 13, 2018http://w
ww
.jbc.org/D
ownloaded from
742 Spectrophotometric Studies on Hb. I
It is well known that there are two red pigments in muscle, but so far no method has been given for the determination of the rela- tive amounts of the two in a mixture. These two pigments, mus- cle and blood hemoglobin, have absorption bands in the visible portion of the spectrum which are similar, but differ slightly in position. The purpose of this investigation was to make a spectro- photometric study of the two red pigments found in blood and muscle. In making this study it was proposed to determine the points of maximum and minimum absorption of light, with the ratios of the densities at these points, and from this information to devise, if possible, a method for determination of the relative amounts of these pigments in a sample of meat.
Morner (2) as a result of his spectroscopic observations was the first to call attention to the fact that the cx absorption band of muscle pigment did not occur at the same wave-length as for blood but was shifted 5 rnp toward the red end of the spectrum. The work of Morner was confirmed by Gunther (3), who suggests. that the pigment fractions of muscle and blood hemoglobin are identical but that the globin fractions are different.
The most recent observations are those of Kennedy and Whipple (4). These investigators used the spectrophotometer for their determinations and studied the color of solutions extracted from chopped red muscle by dilute ammonia. Their results agree with previous observations as to the position of the bands.
Very conclusive proof of the distinction between the two hemo- globins was presented by Hektoen, Robscheit-Robbins, and Whip- ple (5). A specific precipitin reaction for dog muscle hemoglobin was prepared which differentiates it sharply from the blood hemo- globin of the dog. It is significant that the two substances behave differently on introduction into the blood stream. These experi- ments give added evidence that muscle hemoglobin is quite distinct biologically from blood hemoglobin. The precipitin reac- tion also indicates that the difference may be in the globin fraction.,
Methods
Perfusion of Animal-The animal used for this work was a yearling Hereford steer in excellent condition weighing about 670 pounds. The animal was thrown on its left side and shackled. An incision was made in the right side of the neck exposing the
by guest on February 13, 2018http://w
ww
.jbc.org/D
ownloaded from
Shenk, Hall, and King 743
jugular vein and the carotid artery. A cannula was inserted into the carotid artery in such a manner that blood could be withdrawn at will. The animal was bled at a moderate rate from this artery until it had lost about one-fifth of its blood.
In order to prolong life and permit the heart to pump out a major portion of the circulating blood cells and also to dilute the blood, a sterile saline solution (0.85 per cent NaCl and 0.1 per cent CaC&. 6H,O) was injected by gravity into the vascular system through a T-tube inserted into the jugular vein. The fluid was injected at a rate approximately equal to that at which the blood was withdrawn from the artery. The heart action ceased after this exchange of saline for blood had been continued for about 10 minutes. In order to wash from the vascular system as com- pletely as possible the remaining traces of blood, the inflow can- nula was changed to the carotid artery and the solution was allowed to flow into the arterial system. Perfusion was continued until the fluid flowing from the jugular vein was practically color- less. This required approximately 21 gallons of solution. The animal was immediately opened, the paunch removed, and the right hind quarter further perfused. The cannula was inserted into the femoral artery, the liquid escaping from the femoral vein. About 9 gallons of saline solution were used. During the per- fusion, the inflow of saline was occasionally interrupted for a number of seconds because Larson and Bell (6) have shown that intermittent perfusion is more efficient in washing blood cells out of the vascular system than a continuous flow. The first liquid that escaped from this quatier was quite red but after a few min- utes the solution came through clear and colorless. This proce- dure was continued until only a very slight trace of color could be noticed. To aid further in adequately washing out the smaller vessels, the hind quarter was thoroughly massaged and flexed during perfusion.
The carcass was allowed to hang in the cooler at about 0” for 2 days, after which it was cut up and a portion of the round re- moved from the right hind quarter. All visible fat was removed, after which the muscle was ground and 100 gm. portions put into small sample bottles. These were kept in a refrigerating room at an average temperature of - 24.4” until wanted.
Preparation of Muscle Hemoglobin Solution-100 gm. portions
by guest on February 13, 2018http://w
ww
.jbc.org/D
ownloaded from
744 Spectrophotometric Studies on Hb. I
of meat were removed from the refrigerating room and allowed to thaw out in an electric refrigerator until the meat could be cut out with little difficulty. This was placed with 250 cc. of ice water into a previously cooled pebble mill and run for 1Q hours, the jar being kept cold with an ice bag in warm weather or outdoors in near freezing weather. At the end of this time, the meat had been thoroughly macerated and the muscle hemoglobin extracted. Later it was found that the hemoglobins could be completely extracted by beating the meat and water mixture in a wide mouthed bottle with a malted milk mixer for 10 minutes. This mixture was centrifuged and then filtered through a linen cloth to remove the solid fat. To each 100 cc. of this solution 0.1 gm. of solid sodium carbonate was added. The solution was very turbid. To clarify it and remove the muscle proteins, aluminum hydroxide was added and the solution shaken vigorously for 10 minutes, after which it was filtered in the refrigerator. It was necessary to re- peat this treatment before the solution was bright red in color and quite free from colloidal material. Only a very small amount of the muscle hemoglobin was removed by the aluminum hydroxide.
Preparation of Blood Hemoglobin Solution-Bovine blood was centrifuged, the plasma taken off, and the red cells were washed and centrifuged with saline solution (0.85’per cent NaCl and 0.1 per cent CaClz .6H,O) several times until the supernatant liquid was clear and colorless. The red cells were laked with 0.1 per cent sodium carbonate solution and made up to volume. Aluminum hydroxide was added and shaken vigorously for 10 minutes. This gave a solution that was clear and free from colloidal material. Marshall and Welker (7) state that aluminum hydroxide removes colloidal material quantitatively and that blood oxyhemoglobin is the only protein of blood that is not removed by it. However, quite a noticeable amount of blood oxyhemoglobin is removed by aluminum hydroxide. The precipitate retained on the filter paper is highly colored with this pigment.
Preparation of Solutions for Calorimetric and Spectrographic Analys&--The acid hematin solutions for calorimetric comparison were prepared by adding an equal volume of 0.2 N HCl to the 0.1 per cent sodium carbonate solution of the hemoglobins and allow- ing to stand for 1 hour. Newcomer (8) reports that the acid hematin color does not reach its full density until 24 hours have
by guest on February 13, 2018http://w
ww
.jbc.org/D
ownloaded from
Shenk, Hall, and King 745
passed but that it develops rather rapidly at first and has reached 99 per cent of its full intensity at the end of 40 minutes.
For the spectrographic analysis of the acid hematin and the globin fractions separately, the solutions were made by adding one-half as much glacial acetic acid and an equal volume of ether to the 0.1 per cent sodium carbonate solutions. This separated into two layers and the fractions were drawn off from a separatory funnel, the acid hematin in the ether layer.
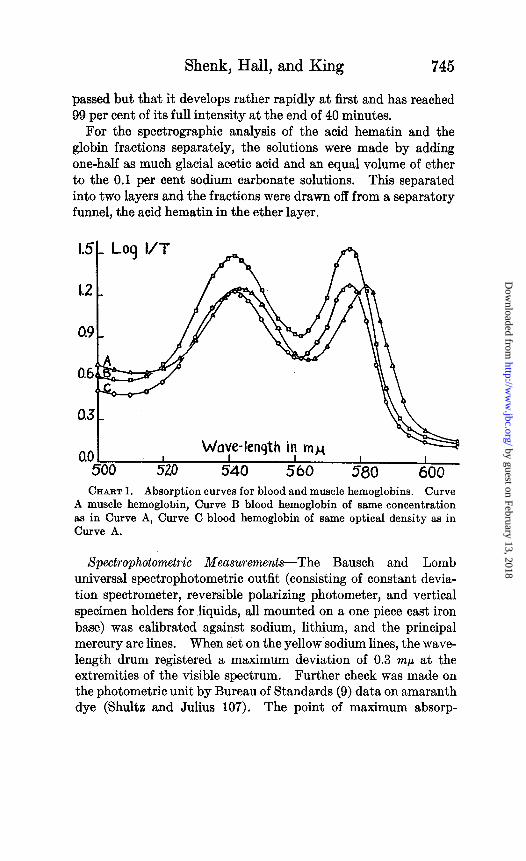
CHART 1. Absorption curves for blood and muscle hemoglobins. Curve A muscle hemoglobin, Curve B blood hemoglobin of same concentration as in Curve A, Curve C blood hemoglobin of same optical density as in Curve A.
Xpectrophotometric Measurements--The Bausch and Lomb universal spectrophotometric outfit (consisting of constant devia- tion spectrometer, reversible polarizing photometer, and vertical specimen holders for liquids, all mounted on a one piece cast iron base) was calibrated against sodium, lithium, and the principal mercury arc lines. When set on the yellow sodium lines, the wave- length drum registered a maximum deviation of 0.3 rnp at the extremities of the visible spectrum. Further check was made on the photometric unit by Bureau of Standards (9) data on amaranth dye (Shultz and Julius 107). The point of maximum absorp-
by guest on February 13, 2018http://w
ww
.jbc.org/D
ownloaded from
746 Spectrophotometric Studies on Hb. I
tion was found at 520.8 rnp which checked within 0.2 rnp of the point found by the Bureau of Standards.
Spectrophotometric determinations of the optical density for the entire range of the visible spectrum were made. Curves A and C on Chart 1 are the absorption curves for muscle and blood hemoglobin in 0.1 per cent sodium carbonate solution when the light absorbed by them is practically the same. Curve B is the absorption curve for a blood hemoglobin solution, the concentra- tion of which is equal to that of the muscle hemoglobin solution used in obtaining Curve A. The curves are very similar except that the curve for muscle hemoglobin is shifted toward the red end. Also, less light is absorbed by blood hemoglobin at 510 mp. Obviously there are three important points in these absorption curves; the maximum in the green, the maximum in the ,yellow, and the minimum between these maxima. These may be taken as reference points at which optical constants can be determined with greatest accuracy.
The points of maximum absorption for blood hemoglobin were found to occur at 577 mp, and 542 rnp, the minimum at 562 mp as compared to the corresponding values for muscle hemoglobin 582 rnp, 543 rnp, and 564 mp. At least fifteen solutions of each hemo- globin were used in determining the position of these points.
It was found that muscle and blood hemoglobin solutions could not be compared directly in the calorimeter satisfactorily, because the two colors differ slightly in hue. Therefore, solutions of equal concentration were made on the basis of acid hematin calorimetric standardizations. There is no noticeable difference in the color of the two acid hematin derivatives and comparison could be made quite accurately. The two hemoglobin solutions of equivalent concentration made up by this method did not show the same power of absorption (Chart I, Curves A and B).
The ratio of the densities of the maximum in the green to the minimum has been used to identify blood oxyhemoglobin but no mention of ratios including the maximum in the yellow was found. Table I gives the ratios of the densities of these three points already mentioned and also the ratio of the maximum in the yellow to the density at the point where the maximum for muscle hemo- globin occurs (577 : 582 mp) . It was found that all of these ratios were quite constant. Also the ratio of the two maxima is more
by guest on February 13, 2018http://w
ww
.jbc.org/D
ownloaded from
Shenk, Hall, and King 747
constant than that used to identify this pigment, namely the ratio of the densities at the maximum in the green and the minimum, given by Kennedy (10) as 1.63, which agrees very well with the results obtained. Ratios of the corresponding points for muscle hemoglobin are very little different from the values for blood hemoglobin at corresponding points, except the ratio of the two maxima which is significantly different for the two hemoglobins. Since there is a difference of 5 rnp between the points of maximum absorption of yellow light, and also considerable difference between the amount of light absorbed by the two hemoglobins at equal concentration, it was decided to use this ratio in an attempt to determine the relative percentage of the two hemoglobins in a mixture.
TABLE I
Ratios of Optical Densities at Critical Spectral Points
Spectral pointa, rnp ,..,..,..,._..,___._._....,..._ 1 542:562 ( 577:542 1 577:562 1 577:582
1.230 0.009
Blood Hb Average of 5 samples 1.632 1.053 1.700 Mean difference 0.017 0.008 0.020
--
Spectral points, 7nj.c. . . . . 543 : 564 582: 543 582:564 ~-
Muscle Hb Average of 5 samples 1.648 1.019 1.686
Mean difference 0.034 0.011 0.047
577: 582
0.884
0.006
From solutions of equal concentration of blood and muscle hemoglobin in 0.1 per cent sodium carbonate, mixtures were made at intervals of 20 per cent from pure blood hemoglobin to pure muscle hemoglobin. The optical density of the solution at 577 rnp
and 582 rnp was determined and the ratio calculated. The aver- aged results of five runs plotted against per cent hemoglobin give practically a straight line, as shown in Chart 2. For pure blood hemoglobin, this ratio was found to be 1.230, but a sample of whole blood diluted with 0.1 per cent sodium carbonate solution gave the ratio 1.072, probably owing to a pigment in the plasma. This linear relation affords a simple means to determine the relative per cent of muscle and blood hemoglobin in a solution. The per cent of total hemoglobin may be obtained by a determination of the acid hematin or by determining the density at 542 rnp and
by guest on February 13, 2018http://w
ww
.jbc.org/D
ownloaded from
748 Spectrophotometric Studies on Hb. I
using the absorption factors of the two hemoglobins as described below.
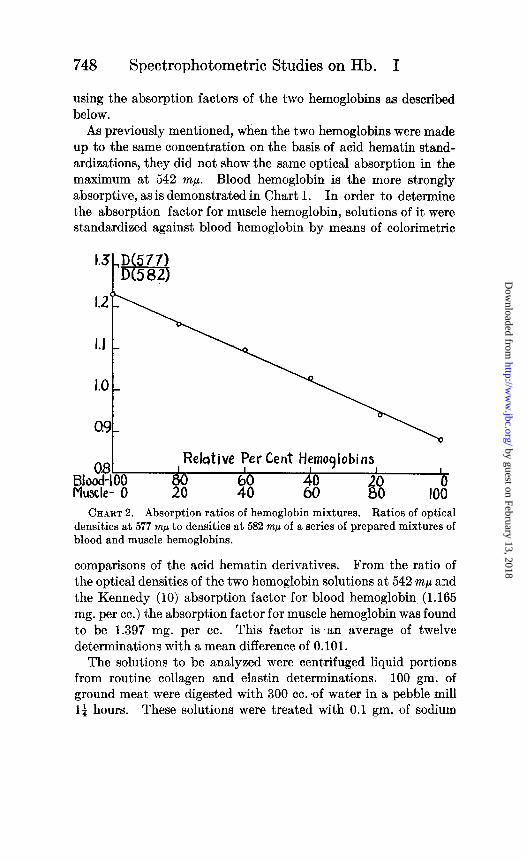
As previously mentioned, when the two hemoglobins were made up to the same concentration on the basis of acid hematin stand- ardizations, they did not show the same optical absorption in the maximum at 542 mp. Blood hemoglobin is the more strongly absorptive, as is demonstrated in Chart 1. In order to determine the absorption factor for muscle hemoglobin, solutions of it were standardized against blood hemoglobin by means of calorimetric
I.3
Relative Tf’er Cent Hynoqlobins, I F310%00 40 Muscle-
0 0 288 $8 60 6% 100
CHART 2. Absorption ratios of hemoglobin mixtures. Ratios of optical densities at 577 rnp to densities at 582 rnp of a series of prepared mixtures of blood and muscle hemoglobins.
comparisons of the acid hematin derivatives. From the ratio of the optical densities of the two hemoglobin solutions at 542 rnp and the Kennedy (10) absorption factor for blood hemoglobin (1.165 mg. per cc.) the absorption factor for muscle hemoglobin was found to be 1.397 mg. per cc. This factor is ‘an average of twelve determinations with a mean difference of 0.101.
The solutions to be analyzed were centrifuged liquid portions from routine collagen and elastin determinations. 100 gm. of ground meat were digested with 300 cc. of water in a pebble mill la hours. These solutions were treated with 0.1 gm. of sodium
by guest on February 13, 2018http://w
ww
.jbc.org/D
ownloaded from
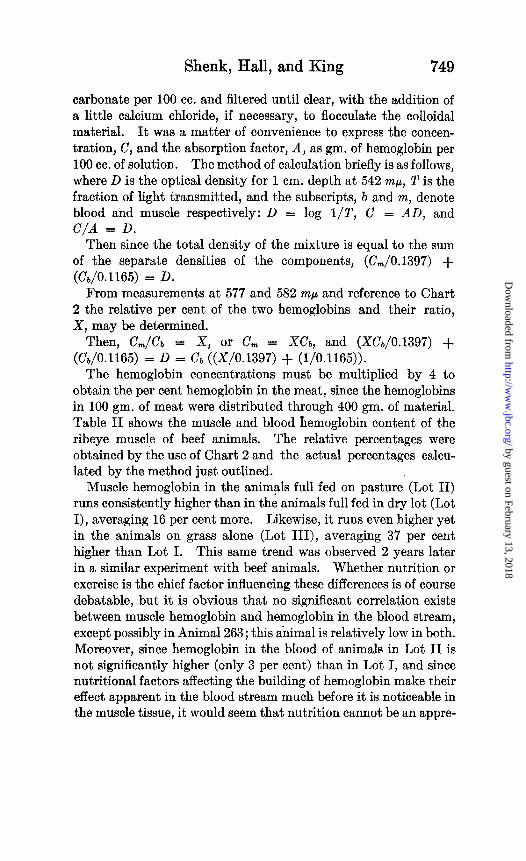
Shenk, Hall, and King 749
carbonate per 100 cc. and filtered until clear, with the addition of a little calcium chloride, if necessary, to flocculate the colloidal material. It was a matter of convenience to express the concen- tration, C, and the absorption factor, A, as gm. of hemoglobin per 100 cc. of solution. The method of calculation briefly is as follows, where D is the optical density for 1 cm. depth at 542 rnp, T is the fraction of light transmitted, and the subscripts, b and m, denote blood and muscle respectively: D = log l/T, C = AD, and C/A = D.
Then since the total density of the mixture is equal to the sum of the separate densities of the components, (CJO.1397) + (Ca/0.1165) = D.
From measurements at 577 and 582 rnp and reference to Chart 2 the relative per cent of the two hemoglobins and their ratio, X, may be determined.
Then, C,,,/G, = X, or C, = XG, and (X&/0.1397) + (&/0.1165) = D = Ca ((X/0.1397) + (l/0.1165)).
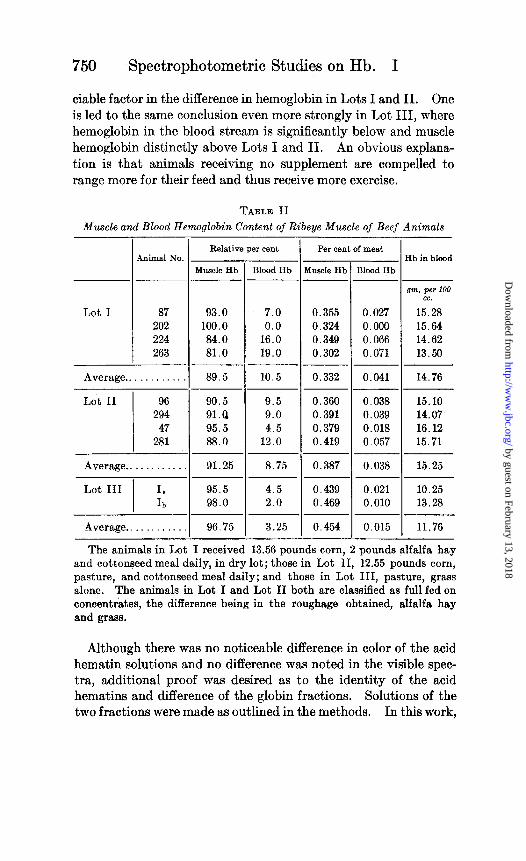
The hemoglobin concentrations must be multiplied by 4 to obtain the per cent hemoglobin in the meat, since the hemoglobins in 100 gm. of meat were distributed through 400 gm. of material. Table II shows the muscle and blood hemoglobin content of the ribeye muscle of beef animals. The relative percentages were obtained by the use of Chart 2 and the actual percentages calcu- lated by the method just outlined.
Muscle hemoglobin in the animals full fed on pasture (Lot II) runs consistently higher than in the animals full fed in dry lot (Lot I), averaging 16 per cent more. Likewise, it runs even higher yet in the animals on grass alone (Lot III), averaging 37 per cent higher than Lot I. This same trend was observed 2 years later in a similar experiment with beef animals. Whether nutrition or exercise is the chief factor influencing these differences is of course debatable, but it is obvious that no significant correlation exists between muscle hemoglobin and hemoglobin in the blood stream, except possibly in Animal 263; this animal is relatively low in both. Moreover, since hemoglobin in the blood of animals in Lot II is not significantly higher (only 3 per cent) than in Lot I, and since nutritional factors affecting the building of hemoglobin make their effect apparent in the blood stream much before it is noticeable in the muscle tissue, it would seem that nutrition cannot be an appre-
by guest on February 13, 2018http://w
ww
.jbc.org/D
ownloaded from
750 Spectrophotometric Studies on Hb. I
ciable factor in the difference in hemoglobin in Lots I and II. One is led to the same conclusion even more strongly in Lot III, where hemoglobin in the blood stream is significantly below and muscle hemoglobin distinctly above Lots I and II. An obvious explana- tion is that animals receiving no supplement are compelled to range more for their feed and thus receive more exercise.
TABLE II
Muscle and Blood Hemoglobin Content of Ribeye Muscle of Beef Animals
Animal No
Lot I 87 202 224 263
Average.. . . . .
Lot II 96 294 47
281
Average. . . . . .
Lot III I. Ih
Average.. . . . . . . . .
Relative per cent
Muscle Hb Blood Hb ~___
93.0 7.0 100.0 0.0 84.0 16.0 81.0 19.0
-___ 89.5 10.5
90.5 9.5 91.0 9.0 95.5 4.5 88.0 12.0
91.25 8.75
95.5 4.5 98.0 2.0
96.75 3.25
- I Per cent of meat
fwcle Hb Blood Hb
0.355 0.027 0.324 0.000 0.349 0.066 0.302 0.071
0.332 0.041
0.360 0.038 0.391 0.039 0.379 0.018 0.419 0.057
0.387 0.038
0.439 0.021 0.469 0.010
0.454 0.015
-
-
.
. .
_
-
Hb in blood
*m. per 100 cc.
15.28 15.64 14.62 13.50
14.76
15.10 14.07 16.12 15.71
15.25
10.25 13.28
11.76
The animals in Lot I received 13.56 pounds corn, 2 pounds alfalfa hay and cottonseed meal daily, in dry lot; those in Lot II, 12.55 pounds corn, pasture, and cottonseed meal daily; and those in Lot III, pasture, grass alone. The animals in Lot I and Lot II both .are classified as full fed on concentrates, the difference being in the roughage obtained, alfalfa hay and grass.
Although there was no noticeable difference in color of the acid hematin solutions and no difference was noted in the visible spec- tra, additional proof was desired as to the identity of the acid hematins and difference of the globin fractions. Solutions of the two fractions were made as outlined in the methods. In this work,
by guest on February 13, 2018http://w
ww
.jbc.org/D
ownloaded from
Shenk, Hall, and King 751
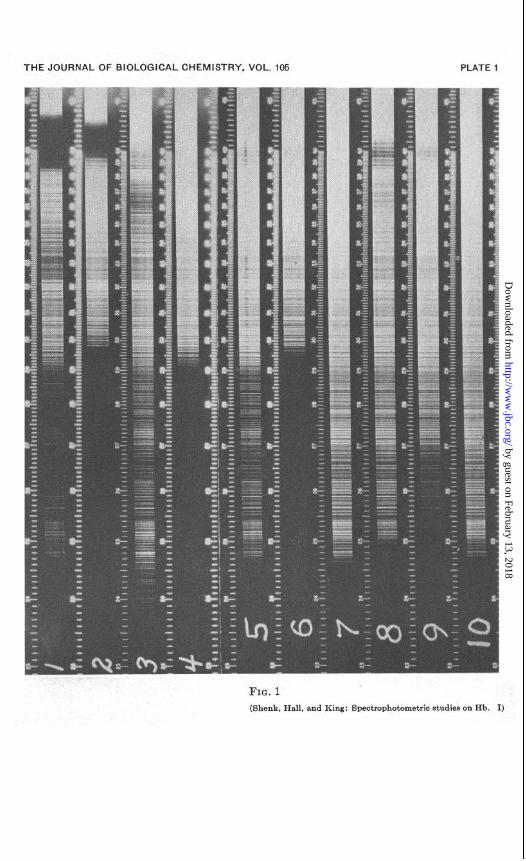
light from an arc of impregnated carbons was passed through a quartz cell 9 mm. thick which contained the material to be exam- ined. A Bausch and Lomb quartz spectrograph was used, the spectra being photographed on Eastman panchromatic plates.
In Fig. 1 the absorption spectra of muscle and blood hemoglobins are shown. The time of exposure is too long to show the a! and p absorption bands and that portion is removed in the cut, but both hemoglobins show a wide absorption at 410 mp, the one for blood being considerably wider. There is a decided difference in absorp- tion below 295 mp. All of the light is absorbed by the muscle extract while blood hemoglobin allows transmission as far as 246 rnp. This same difference in absorption is shown in the spectra of the acid hematin derivatives in 0.1 N HCl. The same marked difference appears in the absorption spectra of the globin fractions, but very little difference in the absorption spectra of the acid hematin fractions. This difference may be due to a slight solu- bility of the globin in the ether fraction. These absorption spectra in the ultra-violet show that the principal difference lies in the globin fraction, although a small difference may be noted in the hematin fractions at 400 rnp. Here the blood acid hematin shows a slightly greater absorption than the muscle acid hematin. Both bands are faint however. Strong bands showing a similar relation occur in this region in the spectra of the whole hemoglobins.
SUMMARY
Solutions of muscle hemoglobin free from blood hemoglobin were prepared and examined by the spectrophotometer. These solu- tions gave absorption curves very similar to the curves obtained from blood hemoglobin but they are displaced toward the red por- tion of the spectrum.
The absorption factor for muscle hemoglobin has been deter- mined. Equal concentrations of the two hemoglobins do not have equal power of light absorption. The two hemoglobins cannot be matched directly, since the colors of the solutions do not have the same hue, but their acid hematin derivatives have been shown to be identical.
The ratio of the densities of the maximum absorption in the yellow to the maximum in the green, the ratios of both maxima to the minimum between them, and the ratio of the densities at 577 rnp to 582 rnp were found to be constant.
by guest on February 13, 2018http://w
ww
.jbc.org/D
ownloaded from
752 Spectrophotometric Studies on Hb. I
The points of maximum absorption for blood oxyhemoglobin were found to be at 542 and 577 rnp, the minimum at 562 rnp as compared to 543, 582, and 564 mp, the corresponding points for muscle oxyhemoglobin.
A spectrographic study shows a very marked difference in the ultra-violet absorption spectra of the two hemoglobins and a similar difference in the absorption spectra of the globin fractions. Very little difference was shown between the acid hematin fractions, indicating that the difference is in the protein part of the molecule.
A method for determining the relative percentages of blood and muscle hemoglobin in the same solution based on the ratio of the optical densities at 577 and 582 rnp is presented.
The results here submitted indicate that animals on pasture have a higher muscle hemoglobin level than dry lot-fed animals, and the difference cannot all be from nutritional causes, but may be explained by the assumption that the animals on pasture have more exercise.
BIBLIOGRAPHY
1. Whipple, G. H., Am. J. Physiol., 76,693 (1926). 2. Morner, Nerd. med. Ark., No. 2 (1897). 3. Gunther, Virchows Arch. path. And., 230, 146 (1921). 4. Kennedy, R. P., and Whipple, G. H., Am. J. Physiol., 76, 685 (1926). 5. Hektoen, L., Robscheit-Robbins, F. S., and Whipple, G. H., J. Infect.
Dis., 42, 31 (1928). 6. Larson, W. P., and Bell, E. J., J. Infect. Dis., 24, 185 (1919). 7. Marshall, J., and Welker, W. H., J. Am. Chem. SOL, 36,820 (1913). 8. Newcomer, H. S., J. Biol. C’hem., 37, 465 (1919). 9. Gibson, K. S., et al., Bur. Standards Scient. Papers, No. 440 (1922).
10. Kennedy, R. P., Am. J. Physiol., 79, 346 (1926).
EXPLANATION OF PLATE 1
FIG. 1. Absorption spectra of blood and muscle hemoglobins and deriva- tives, taken by quartz spectrograph. I, blood hemoglobin in 0.1 per cent sodium carbonate solution; R, muscle hemoglobin in 0.1 per cent sodium carbonate solution; b, blood acid hematin in 0.1 N HCl (unseparated); 4, muscle acid hematin in 0.1 N KC1 (unseparated) ; 6, globin fraction of blood hemoglobin; 6, globin fraction of muscle hemoglobin; 7, solvent for globin fraction; 8, acid hemat,in fraction of blood hemoglobin; 8, acid hematin frac- tion of muscle hemoglobin; 10, solvent for acid hematin.
by guest on February 13, 2018http://w
ww
.jbc.org/D
ownloaded from
THE JOURNAL OF BIOLOGICAL CHEMISTRY. VOL. 105 PLATE 1
FIG. 1 (Shenk, Hall, and King: Spectrophotometric studies on Hb. I)
by guest on February 13, 2018http://w
ww
.jbc.org/D
ownloaded from
John H. Shenk, J. Lowe Hall and H. H. KingMUSCLE HEMOGLOBINS
HEMOGLOBINS: I. BEEF BLOOD ANDCHARACTERISTICS OF
SPECTROPHOTOMETRIC
1934, 105:741-752.J. Biol. Chem.
http://www.jbc.org/content/105/4/741.citation
Access the most updated version of this article at
Alerts:
When a correction for this article is posted•
When this article is cited•
alerts to choose from all of JBC's e-mailClick here
tml#ref-list-1
http://www.jbc.org/content/105/4/741.citation.full.haccessed free atThis article cites 0 references, 0 of which can be by guest on February 13, 2018
http://ww
w.jbc.org/
Dow
nloaded from