İstanbul technical university institute of science and ... · mikrotübüller, alfa ve beta...
TRANSCRIPT

İSTANBUL TECHNICAL UNIVERSITY ���� INSTITUTE OF SCIENCE AND TECHNOLOGY
REGULATION OF MICROTUBULE SEVERING
M.Sc. Thesis by
Şirin KORULU, B.Sc.
Department: Advanced Technologies in Engineering
Programme: Molecular Biology–Genetics and Biotechnology
Supervisor: Assoc. Prof. Dr. Arzu KARABAY KORKMAZ
JUNE 2006

İSTANBUL TECHNICAL UNIVERSITY ���� INSTITUTE OF SCIENCE AND TECHNOLOGY
REGULATION OF MICROTUBULE SEVERING
M.Sc. Thesis by
Şirin KORULU, B.Sc.
(521031218)
Department: Advanced Technologies in Engineering
Programme: Molecular Biology–Genetics and Biotechnology
Supervisor: Assoc. Prof. Dr. Arzu KARABAY KORKMAZ
JUNE 2006

İSTANBUL TECHNICAL UNIVERSITY ���� INSTITUTE OF SCIENCE AND TECHNOLOGY
M.Sc. Thesis by
Şirin KORULU, B.Sc. (521031218)
Date of submission : 8 May 2006
Date of defence examination: 8 June 2006
Supervisor: Assoc.Prof.Dr.Arzu KARABAY KORKMAZ
Members of the Examining Committee: Assist.Prof.Dr.Eda TAHİR TURANLI (İ.T.Ü.)
Assoc.Prof.Dr. Hakan GÜRVİT (İ.Ü.)
JUNE 2006
REGULATION OF MICROTUBULE SEVERING
İSTANBUL TEKNİK ÜNİVERSİTESİ ���� FEN BİLİMLERİ ENSTİTÜSÜ
MİKROTÜBÜL KESİLMESİNİN REGÜLASYONU
YÜKSEK LİSANS TEZİ Şirin KORULU
(521031218)
HAZİRAN 2006
Tezin Enstitüye Verildiği Tarih : 8 Mayıs 2006
Tezin Savunulduğu Tarih : 8 Haziran 2006
Tez Danışmanı : Doç.Dr. Arzu KARABAY KOKMAZ
Diğer Jüri Üyeleri: Yar.Doç.Dr. Eda TAHİR TURANLI (İ.T.Ü.)
Doç.Dr. Hakan GÜRVİT (İ.Ü.)

ii
ACKNOWLEDGEMENTS
I would like to thank Associate Professor Arzu Karabay Korkmaz for invaluable guidance, advice, and also for her motivation and morale support at difficult times.
I would like to thank Ayşegüls ☺ (Ayşegül Yıldız and Ayşegül Dilsizoğlu) for being with me in all conditions. They are very enjoyable partners, as well as very good friends. It was easier to work in lab until late hours with such friends.
I would like to thank also Ceren Eke Koyuncu, Eyser Kılıç, Burcu Turanlı, Iraz Toprak Aydın for their friendship.
I would like to thank Prof. Peter W. Baas from Drexel University, Department of Neurobiology and Anatomy for providing me position in his lab. I would also like to thank Dr. Wenqian Yu for sharing all her technical experience during this lab work.
I would also like to acknowledge the funding agencies. This study was supported by TUBİTAK Career Project assigned for Dr. Arzu Karabay Korkmaz.
I would like to thank Ersin Koç for waiting for me ☺ and being the most enjoyable part of my life. He helped me to see that there is another life outside the lab ☺.
Finally, I would like to thank my family for their endless love and support. I always felt their courage.
June, 2006 Şirin KORULU
iii
TABLE OF CONTENTS
ABBREVIATIONS v
LIST OF TABLES vi
LIST OF FIGURES vii
LIST OF SYMBOLS viii
SUMMARY ix
ÖZET x
1. INTRODUCTION 1
1.1. Cytoskeleton 1
1.1.1. Microtubules 1 1.1.1.1. Dynamic instability of microtubules 2 1.1.2. Microtubule associated proteins (MAPs). 4 1.1.2.1. MAP2 and MAP2c 4 1.1.2.2. MAP1b 6 1.2. Neuronal Cytoskeleton 7 1.2.1. Neuronal polarity 8 1.3. Microtubule Severing 9
1.3.1. AAA Family proteins 10 1.3.1.1. Katanin 11 1.3.1.2. Spastin 13 1.4. Aim of the Study 16 2. MATERIALS AND METHODS 19
2.1. Materials 19 2.1.1. Animals 19 2.1.2. ATCC cell lines 19 2.1.3. Plasmid constructs 19 2.1.4. Antibodies 19 2.1.5. Solutions and buffers 20 2.1.5.1. PBS 20 2.1.5.2. Borate buffer 20 2.1.5.3. PHEM 20 2.1.5.4. Mounting medium 21 2.1.5.5. Hippocampus dissection medium 21 2.1.5.6. Hippocampus plating medium 21 2.1.5.7. Hippocampus serum free 21 2.1.5.8. Fixative 21 2.1.5.9. Triton X – 100 22 2.1.5.10. Blocking solution 22 2.1.5.11. ATCC medium 22 2.1.5.12. L – Glutamine 22 2.1.5.13. Chemicals 23
iv
2.1.5.14. Kits 23 2.1.5.15. Equipments 23 2.2. Methods 24
2.2.1. Coverslips 24 2.2.2. Media 24 2.2.3. Primary culture 25 2.2.4. Hippocampal culture 26 2.2.4.1. Dissection of the hippocampus 26 2.2.4.2. Plasmid DNA preparation 29 2.2.4.3. Transfection 30 2.2.4.4. Cell fixation 32 2.2.4.5. Immunostaining 34 2.2.4.6. Imaging / Analyzing 35 2.2.5. RFL - 6 Cultures 35 2.2.5.1. Passage P0 35 2.2.5.2. Splitting the cells 36 2.2.5.3. Detaching the cells 37 2.2.5.4. Endofree plasmid DNA purification 37 2.2.5.5. Transfection of RFL - 6 cells 39 2.2.5.6. Fixation/ co-extraction of RFL - 6 cells 40 2.2.5.7. Immunostaining 41 2.2.5.8. Imaging / Analyzing 44
3. RESULTS 46
3.1. Spastin Overexpression in Hippocampus Cells 46
3.2. Regulation of Spastin, MT Severing Protein, by Microtubule 50
Associated Proteins
4. DISCUSSION 55
5. CONCLUSION 60
REFERENCES 61
APPENDIX 67
RESUME 74

v
ABBREVIATIONS
AAA : ATPases Associated with various cellular Activities ATCC : The American Type Culture Collection BSA : Bovine Serum Albumine CNS : Central Nervous System DNA : Deoxyribonucleic Acid GFP : Green Fluorescent Protein HSP : Hereditary Spastic Paraplegia IR : Inter Repeats MAPs : Microtubule-associated proteins MTBR : Microtubule Binding Repeats MTOC : Microtubule Organizing Center MW : Molecular Weight NGF : Nerve Growth Factor PBS : Phosphate Buffered Saline RT : Room Temperature

vi
LIST OF TABLES
Page No
Table 2.1. List of plasmid constructs……………………………………... 19 Table 2.2. List of chemicals………………………………………………. 23 Table 2.3. List of kits……………………………………………………... 23 Table 2.4. List of equipments…………………………………………….. 23 Table 2.5. Fixative ingredients for hippocampus cells…………………… 33 Table 2.6. Constructs used for transfection………………………………. 39 Table 2.7. Fixative ingredients for RFL-6 cells…………………………... 40 Table 2.8. Dilution ratio for primary antibodies…………………………. 41 Table 2.9. Flowchart for primary antibody application…………………... 42 Table 2.10. Dilution ratio for secondary antibodies 42 Table 2.11. Flowchart for secondary antibody application for MAP1b
part…………………………………………………………….. 43
Table 2.12. Flowchart for secondary antibody application for MAP2c part……………………………………………………………..
43
Table A.1. Process measurements values of spastin overexpressing cells, day 4…………………………………………………………..
68
Table A.2. Process measurements values of p-60 katanin overexpressing cells, day 4…………………………………………………….
69
Table A.3. Process measurements values of GFP overexpressing control cells, day 4…………………………………………………….
69
Table A.4. Process measurements values of spastin overexpressing cells, day 6…………………………………………………………..
70
Table A.5. Process measurements values of p-60 katanin overexpressing cells, day 6…………………………………………………….
71
Table A.6. Process measurements values of GFP overexpressing control cells, day 6…………………………………………………….
72
Table A.7. Measurements values of MAP experiments……… 73
vii
LIST OF FIGURES
Page No
Figure 1.1 :MT assembly…………………………………………………. 1 Figure 1.2 :GTP sites in α- and β- tubulin subunits……………………… 2 Figure 1.3 :Dynamic instability…………………………………………... 3 Figure 1.4 :Model for MAP2 – MT interaction…………………………... 5 Figure 1.5 :Model for MAP1b gene organization………………………… 6 Figure 1.6 :Typical vertebrate neuron…………………………………….. 8 Figure 1.7 :Conformational change of AAA protein ring………………… 11 Figure 1.8 :Model for microtubule severing by katanin………………….. 12 Figure 1.9 :Domain localization of spastin……………………………….. 15 Figure 2.1 :Primary cell culture…………………………………………... 26 Figure 2.2 :Hippocampus dissection…………………….………………... 28 Figure 2.3 :Monolayer fibroblast cells…………………………………….. 36 Figure 3.1 :Spastin, p60, GFP overexpression in hippocampus cells
(day4)………………………………………………………….. 47
Figure 3.2 : Total process length per cell 48 Figure 3.3 :Spastin, p60, GFP overexpression in hippocampus cells
(day6)…………………………………………………….......... 49
Figure 3.4 :Average process numbers of cells…………………………...... 50 Figure 3.5 :MAP1b / Spastin co – expression…………………………….. 51 Figure 3.6 :MAP2c / Spastin co – expression…………………………….. 52 Figure 3.7 :MT mass change depending on the expressed protein ……….. 54 Figure 4.1 :Model for MAP–Microtubule Severing Protein Interaction…. 59
viii
LIST OF SYMBOLS
10 : Primary
20 : Secondary
H2O : Water Ab : Antibody dd : Double distilled fig. : Figure GFP : Green Fluorescent Protein g : Gram h : Hour IFs : Intermediate Filaments Lys : Lysine MAPs : Microtubule-associated proteins MFs : Microfilaments mRNA : Messenger-ribonucleic acid µl : Microliter µg : Microgram µm : Micrometer mg : Milligram ml : Milliliter MTs : Microtubules NF : Neurofilament PFA : Paraformaldehyde Tb : Tubulin
γγγγ-TuRC : γ-tubulin Ring Complex
ix
REGULATION OF MICROTUBULE SEVERING
SUMMARY
Microtubules are cytoskeletal polymers made of alpha and beta tubulin heterodimers. They are essential for the cell and have role in important cellular processes such as cell transport, cell motility and cell division. In neurons, MTs provide support for the growth and maintenance of the axonal and dendritic processes. They also serve as railroads along which organelles are transported within the axon.
Cells reconfigure their MTs by assembly and disassembly phases, known as dynamic instability. However, many cell types, such as neurons, have complex MT organization patterns, and it is difficult to explain their reconfiguration by dynamic instability, especially when the MTs are stabilized by some proteins. All these suggest that there are some other models for MT movement in the cell. According to our model, long MTs are stationary, but short MTs are mobile. Cells mobilize their MTs by severing them into short pieces. Severing activity is performed by enzymes such as katanin and spastin. Once short MTs elongate, they lose their mobility property.
Katanin and spastin are MT severing enzymes. Katanin is one of the best characterized MT severing proteins. It has two subunits, p60 and p80. P60 subunit has high homology with another MT severing protein, spastin. Nowadays, spastin is as popular as katanin because it is known that spastin mutation leads to neurological disorder, hereditary spastic paraplegia.
In this study, our aim was to have some further steps in characterization of spastin and also to identify the regulation mechanisms of MT severing by spastin and katanin. In this study, we specifically concentrated on MAP1b and MAP2c proteins that have protective role over MTs.
In the first part of the study, we have worked with hippocampus cells. In order to identify the role of spastin in neurons, we overexpressed GFP, p60 –katanin and spastin constructs in hippocampal cells. Cells were fixed at the particular time points following transfection, day2 and day4. After fixation, immunostaining was done and then by using primary and secondary antibodies cells were analyzed with fluorescent microscopy. Control cells, p60 –katanin overexpressing and spastin overexpressing cells were compared with each others.
In the second part of the study, MAP’s protective functions were analyzed in spastin and p60 –katanin overexpressing cells. P60 –katanin and spastin constructs were overexpressed with and without MAPs such as MAP1b and MAP2c in living fibroblast cells, RFL-6. Cells were fixed on the following day of transfection and stained with primary and secondary antibodies. After immunostaining, cells were analyzed with fluorescent microscopy.
x
MİKROTÜBÜL KESİLMESİNİN REGÜLASYONU
ÖZET
Mikrotübüller, alfa ve beta tubulin heterodimerlerinden oluşan hücre iskeleti polimerleridirler. Hücre için son derece gerekli olup hücre taşınması, hücre hareketi, hücre bölünmesi gibi hücre için hayati önem taşıyan olaylarda görevlidirler. Sinir hücrelerinde, MTler hücrenin büyümesine destek sağlamakla beraber hücresel yapının şekillenmesinde, akson ve dendritlerin oluşumunda da etkilidirler. Ayrıca MTler organel gibi moleküllerin akson boyunca çift yönlü taşınmasında da demir yolu vazifesi görmektedirler.
Hücreler “dinamik kararsızlık” adı verilen mekanizma ile MTlerini yeniden yapılandırmaktadırlar. Ancak sinir hücrelerinde olduğu gibi, birçok hücre tipi karmaşık MT ağına sahiptir. Bu hücrelerin MT yapılanmalarını dinamik kararsızlık ile açıklamak, özellikle de MTler başka proteinler ile de etkileşim halindeyken oldukça güçtür. Bu bulgular MTlerin hücre içi hareketini açıklamaya çalışan başka modellerin de mevcut olduğunu düşündürmektedir. Üzerinde çalıştığımız modele göre (“kes ve koş” modeli), uzun MTler durağan, kısa MTler ise hareketlidirler. Bu modele göre, hücreler MTlerini hareketli hale getirmek için onların katanin, spastin gibi proteinler tarafından kesilip, küçük parçalara ayrılmasını sağlamaktadırlar. Kısa MTler tekrardan uzun hale geçtiklerinde ise hareket yeteneklerini kaybetmektedirler.
Katanin ve spastin MT kesici enzimlerdir. Katanin, karakterizasyonu en güzel yapılan MT kesen proteinlerinden biridir. İki alt üniteden oluşur, p60 ve p80. En az onun kadar popüler olan diğer bir MT bölme proteini de spastindir ve p60–katanin alt ünitesi ile büyük benzerlik göstermektedir. Spastinin en fazla ilgi çeken proteinlerden biri haline gelmesinin nedeni de bu proteinin MT temel hücre biyolojisini nörolojik hastalıklarla birleştirmesidir. Spastinin mutasyonunda kalıtsal spastik parapleji rahatsızlığına neden olduğu bilinmektedir.
Bizim bu çalışmadaki hedefimiz spastinin karakterizasyonunda yeni adımlar atabilmek, MTlerin spastin, katanin tarafından kesilmesinin mikrotübül ilişkili proteinler tarafından düzenlenmesini aydınlatmaya çalışmaktır. Çalışmanın bu kısmında MTler üzerinde koruyucu görevleri olan mikrotübül–ilişkili proteinler, özellikle de MAP1b ve MAP2c üzerinde durulmuştur.
Spastinin görevini aydınlatabilmek için hipokampüs hücrelerinde GFP, spastin, p60–katanin proteinlerinin ekspresyonu gerçekleştirildi. Hücreler transfeksiyonu takip eden 2. ve 4. günlerde sabitlendi. Birincil ve ikincil antikorlar ile boyandıktan sonra hücreler floresan mikroskobu ile incelendi. Kontrol hücreleri, katanin ve spastin proteinlerini aşırı eksprese eden hücreler aralarında karşılaştırıldı.

xi
Çalışmanın ikinci kısmında ise mikrotübül ilişkili proteinlerin, p60–katanin ve spastin eksprese eden hücreler üzerinde herhangi bir düzenleyici rolünün olup olmadığı aydınlatılmaya çalışıldı. P60–katanin ve spastin proteinleri mikrotübül ilişkili proteinlerin varlığında ya da bu proteinler olmadan fibroblast hücrelerinde eksprese edildiler. Transfeksiyonu takip eden günde hücreler sabitlendi. Birincil ve ikincil antikorlarla işaretlendikten sonra hücreler floresan mikroskobunda incelendiler.

1
1. INTRODUCTION
1.1. Cytoskeleton
In all eukaryotes, there are fibrous proteins in the cytosol. These proteins are
microfilaments, microtubules and intermediate filaments. They are collectively
called “cytoskeleton”. These cytoskeletal fibers give the cell strength and rigidity.
They also have control on movement within the cell, especially microtubules (MTs)
have very important role in cell division (Lodish, 1995).
1.1.1. Microtubules
Among the cytoskeletal proteins, microtubules are thought to have the most
important roles, especially in generation of cell shape and polarity, cell division, cell
growth and intracellular organelle transport.
Microtubules are polymers of α- and β- tubulin subunits. These subunits are
arranged in a cylindrical tube 24 nm in diameter. There are both lateral and
longitudinal interactions between the tubulin heterodimer subunits. These
interactions maintain the tubular form of microtubules (Lodish, 1995; Vale et al.,
1999).
Figure 1.1: MT Assembly
2
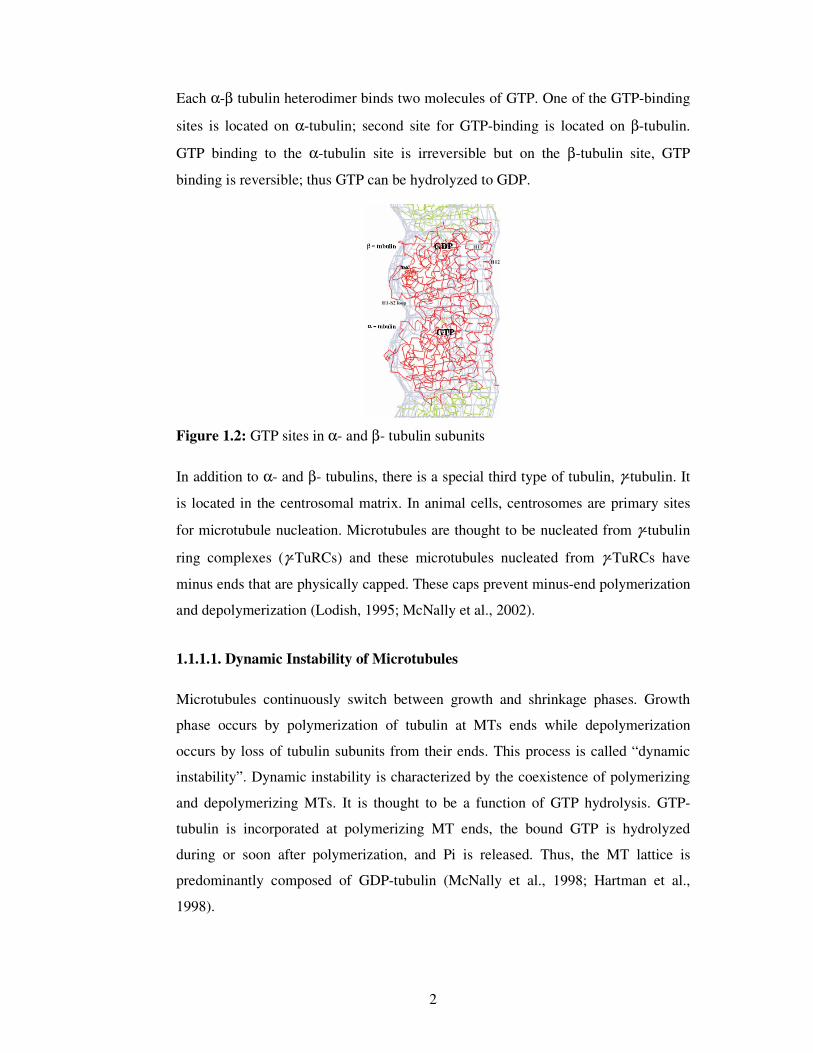
Each α-β tubulin heterodimer binds two molecules of GTP. One of the GTP-binding
sites is located on α-tubulin; second site for GTP-binding is located on β-tubulin.
GTP binding to the α-tubulin site is irreversible but on the β-tubulin site, GTP
binding is reversible; thus GTP can be hydrolyzed to GDP.
Figure 1.2: GTP sites in α- and β- tubulin subunits
In addition to α- and β- tubulins, there is a special third type of tubulin, γ-tubulin. It
is located in the centrosomal matrix. In animal cells, centrosomes are primary sites
for microtubule nucleation. Microtubules are thought to be nucleated from γ-tubulin
ring complexes (γ-TuRCs) and these microtubules nucleated from γ-TuRCs have
minus ends that are physically capped. These caps prevent minus-end polymerization
and depolymerization (Lodish, 1995; McNally et al., 2002).
1.1.1.1. Dynamic Instability of Microtubules
Microtubules continuously switch between growth and shrinkage phases. Growth
phase occurs by polymerization of tubulin at MTs ends while depolymerization
occurs by loss of tubulin subunits from their ends. This process is called “dynamic
instability”. Dynamic instability is characterized by the coexistence of polymerizing
and depolymerizing MTs. It is thought to be a function of GTP hydrolysis. GTP-
tubulin is incorporated at polymerizing MT ends, the bound GTP is hydrolyzed
during or soon after polymerization, and Pi is released. Thus, the MT lattice is
predominantly composed of GDP-tubulin (McNally et al., 1998; Hartman et al.,
1998).
3
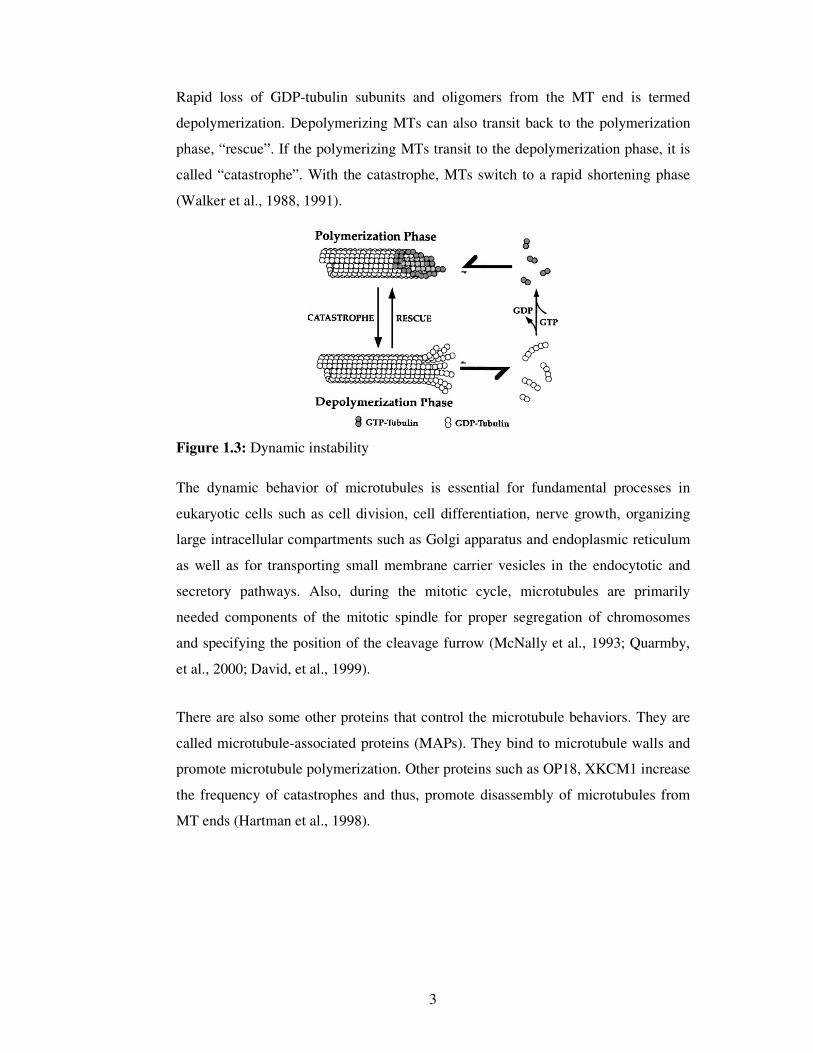
Rapid loss of GDP-tubulin subunits and oligomers from the MT end is termed
depolymerization. Depolymerizing MTs can also transit back to the polymerization
phase, “rescue”. If the polymerizing MTs transit to the depolymerization phase, it is
called “catastrophe”. With the catastrophe, MTs switch to a rapid shortening phase
(Walker et al., 1988, 1991).
Figure 1.3: Dynamic instability
The dynamic behavior of microtubules is essential for fundamental processes in
eukaryotic cells such as cell division, cell differentiation, nerve growth, organizing
large intracellular compartments such as Golgi apparatus and endoplasmic reticulum
as well as for transporting small membrane carrier vesicles in the endocytotic and
secretory pathways. Also, during the mitotic cycle, microtubules are primarily
needed components of the mitotic spindle for proper segregation of chromosomes
and specifying the position of the cleavage furrow (McNally et al., 1993; Quarmby,
et al., 2000; David, et al., 1999).
There are also some other proteins that control the microtubule behaviors. They are
called microtubule-associated proteins (MAPs). They bind to microtubule walls and
promote microtubule polymerization. Other proteins such as OP18, XKCM1 increase
the frequency of catastrophes and thus, promote disassembly of microtubules from
MT ends (Hartman et al., 1998).
4
1.1.2. Microtubule Associated Proteins (MAPs)
Microtubule Associated Proteins (MAPs) control MT behaviors. It has been
proposed that MT – MAP interaction is predominantly electrostatic. MAPs are
positively charged and act by screening negative charges (highly acidic sites) on the
C – terminal domain of both in α- and β- tubulin. MAPs have N – terminal
projection domains, so that they can crosslink and bundle MTs. This promotes rescue
and causes stabilization. (Nogales, 2000; Desui et al., 1997).
Neuronal MAPs can be classically divided into two groups: (1) Very high molecular
weight polypeptides such as MAP1 and MAP2, which are abundant in adult brain,
(2) intermediate – sized proteins, such as tau. There is also MAP4 in non – neuronal
cells (Matus, 1988).
MAP2, MAP4 and tau have conserved C – terminal MT binding domain with three
or four pseudo repeats. Each repeat represents a MT binding site and is composed of
31 – 32 amino acids including several basic residues. MAP1 has only one N –
terminal MT binding domain which is acidic rather than basic (Nogales, 2000).
Most of the identified MAPs are thought to be regulated by phosphorylation.
Phosphorylation decreases MAPs ability to bind MTs by weakening the electrostatic
interaction between MTs and MAPs. When the phosphorylation increases, MAPs are
inhibited in MT stabilization ability.
1.1.2.1. MAP2 and MAP2c
MAP2 is a monomeric protein that has four isoforms 2a, 2b, 2c and 2d. MAP2 shares
homology in its MT binding domain with tau and MAP4. It stimulates the growth of
MTs in vitro by promoting nucleation and tubulin subunit addition at MT ends. MT –
MAP2 binding also leads to stabilization of MTs, in other terms reduction in their
dynamic instability and increase in MT rescue (Halpain et al., 2000).
Multiple isoforms of MAP2 are encoded by a single gene as a result of differential
alternative splicing mechanisms. MAP2a, MAP2b are high MW isoforms, but
MAP2c and MAP2d are low MW isoforms (Halpain et al., 2000). MAP2a and
MAP2b are mainly found in dendrites and cell body while MAP2c is particularly
5
pronounced in developing axons (Mandelkow et al., 1992). MAP2c is also
considered as juvenile MAP and it is expressed perinatally in rats, coincident with
the period of maximal dendritic outgrowth and synaptogenesis, then it is replaced by
MAP2a, MAP2b postnatally. Only some Central Nervous System (CNS) regions that
undergo neuritigenesis throughout postnatal life such as olfactory bulb, retina,
continue to express MAP2c at high levels into adulthood. This leads to the idea that
MAP2c has a specific function associated with dendritic outgrowth and
synaptogenesis (Mandelkow et al., 1992; Halpain et al., 2000).
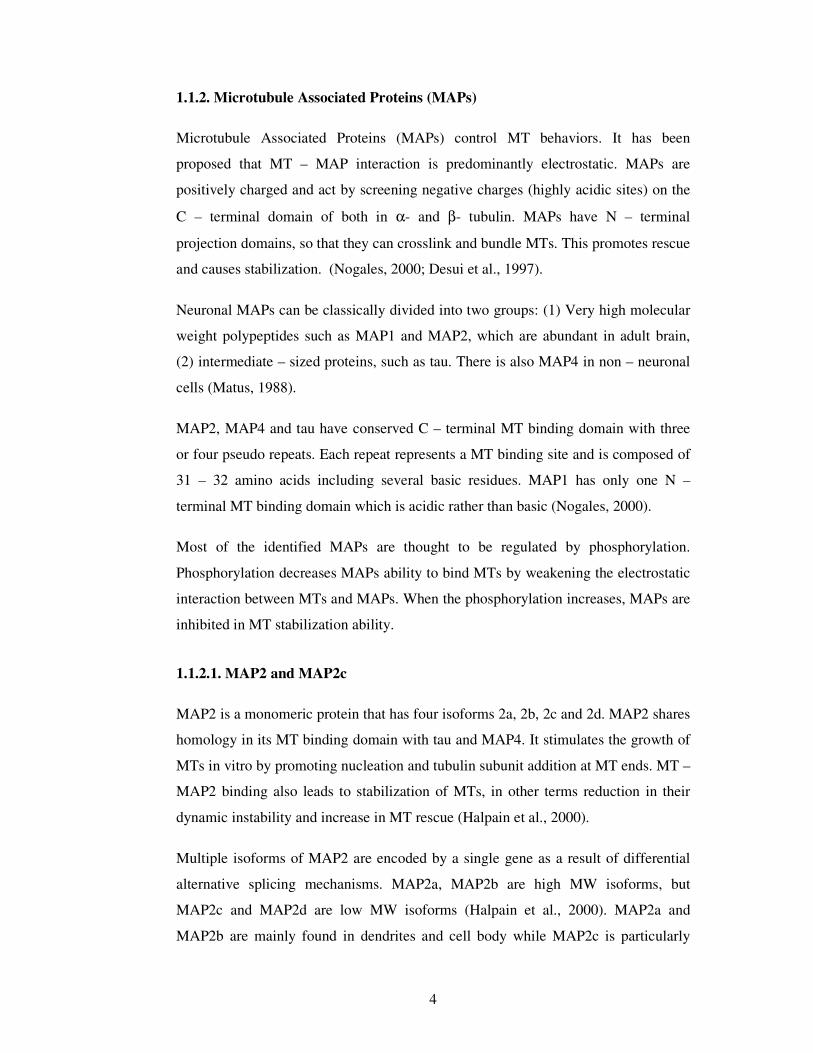
Bloom and Valle suggested that MAP2 may be divided into two structural domains
(see fig. 1.4). C terminal domain has MT binding site which is positively charged. It
contains three 18 – residue MT binding repeats (MTBR) separated by 13 – 14
residue inter – repeats (IR). This domain promotes MT assembly. N terminal domain
is predominantly negatively charged and represents portion of MAP2 observed as a
projection of MT surface. Differently, the projection domain of MAP2 does not bind
to the MTs and is thought to extend into the solution, away from MT surface. This
projection domain contains binding sites for regulatory subunits of protein kinases
and these kinases have role in MAP2 regulation via phosphorylation (Vallee et al.,
1983; Mandelkow et al., 1992; Milligan et al., 2002).
Figure 1. 4: Model for MAP2 – MT interaction

6
1.1.2.2. MAP1b
MAP1b is one of the first MAPs to be expressed during embryonic development of
the nervous system. It is also known as MAP1x, MAP1.2 or MAP5. Molecular
weight of the protein is about 320kDa and its structure is filamentous with a small
spherical segment at one end (Kunkel, 1994; Taniquchi et al., 1997; Propst et al.,
2000). MAP1b is a multimeric protein complex that contains one heavy chain
(regulatory subunit) and at least one light chain (active subunit). There is a MT
binding domain in the N – terminal half of the heavy chain. This region is composed
of 21 times repeated highly basic KKE(E/I/V) motifs. It has been proposed that this
positively charged domain has an α – helical structure that binds to a negatively
charged α – helical domain at the C – terminus of β – tubulin which is on the outer
surface of the MT (Tögel, et al., 1998; Propst et al., 2000; Franzen et al., 2001).
Beside its MT binding ability, MAP1b can also bind to actin filaments; hence,
MAP1b is a link between these two proteins that form the growth cone cytoskeleton.
MAP1b is the earliest MAP expressed in the developing nervous system and is
abundant early in development. The level decreases in the adult, but it is still high in
adult dorsal root ganglion (DRG) neurons and sciatic nerve axons (Kunkel et al.,
1994; Fischer et al., 2000).
Figure 1. 5: Model for MAP1b gene organization
7
Localization studies have shown that MAP1b expression is much higher in actively
growing and developing neurons. It is also present in axons, cell bodies and dendrites
of neurons and in glial cells. Because MAP1b is especially expressed in axons during
their initial outgrowth, it has been suggested that MAP1b plays important role in
neurogenesis. When phosphorylated, it causes growth cone MTs to be in a
dynamically unstable form which is necessary for axonogenesis (Noble et al., 1989;
Kunkel et al., 1994; Tögel, et al., 1998; Bomont et al, 2003).
MAP1b is regulated by phosphorylation and dephosphorylation. Two modes were
identified for MAP1b phosphorylation. Mode I may be catalyzed by proline directed
protein kinases (PDPK), whereas the mode II is due to the action of casein kinase II
(CKII). MAP1b expression decreases after neuronal maturation; phosphorylation
state of MAP1b is also modified. Mode I phosphorylation disappears while the mode
II phosphorylation is still present in adult MAP1b (Avila et al., 1994).
1.2. Neuronal Cytoskeleton
Neurons develop from mitotic cells of ectodermal origin. After several divisions,
these cells begin to express neuron specific proteins. Human nervous system consists
of over 1011 neurons associated with over 1012 supporting glial cells. Neurons are non
– dividing cells, in order to transmit signals they stop dividing early in development
(Baas, 1999). Typical neuron has an enlarged cell body that contains a nucleus and
most of the cytoplasmic organelles. Cell body is also the place where all the neuronal
proteins are synthesized. Neuron has two different extensions from the cell body.
Branching ones are called dendrites and long one is called axon. Axons send
information over long distances, dendrites act as receptors for incoming information
(Baas, 2002). In humans, axons can grow to enormous length. This leads to
questions: “How does the neuron support and maintain such a long process?”, “How
can materials be transported along the axon?” The general answer lies under the
“neuronal cytoskeleton”. Neuronal cytoskeleton is composed three types of
filamentous proteins. Microtubules (MTs), microfilaments (MFs) and intermediate
filaments (IFs). Each has different types of subunits, tubulin for MTs, actin for MFs,
and a family of related proteins for IFs.

8
1.2.1. Neuronal Polarity
Neurons are the most polarized cells in nature. They contain one axon and multiple
dendrites. In axons, there are long MTs oriented with their plus ends away from the
cell body and MT polarity is uniform; whereas microtubules in the dendrites are
short and they have mixed polarity orientation (Baas, 1989; 1999; Vale et al., 1999,
Ahmad, et al., 1999). Another difference between axon and dendrites is
compartmentalization of some organelles. For example, dendrites have ribosomes
and Golgi elements, but axons do not. This explains why each process has
specialized roles during neuronal activities.
The most important question in neuronal polarity is that, how the neurons know to
extend a single axon and multiple dendrites? Broad agreement is that, this event is
due to changes in the cytoskeleton. Laboratory studies showed that when expression
of tau, major axonal MAP, was suppressed, transformation of immature neurite into
an axon was curtailed. This indicates that MT stability might be the basis of axonal
differentiation. However, the mechanism is not clear, since MAPs such as tau are
also involved in many activities, not just in MT stabilization (Baas, 2002).
Besides maintaining the cell shape, neuronal cytoskeleton is also important for
axonal transport. There is no protein synthesis machinery in axons and dendrites;
hence they can not synthesize tubulin subunits locally. Therefore, proteins and
tubulins must be transported in some form. There are two types of transport; fast and
slow transport.
Figure 1. 6: Typical vertebrate neuron
9
Fast transport is responsible for movement of organelles, and the travel rate is 100-
400 mm per day. Slow transport moves cytoskeletal proteins and soluble enzymes
and travel rate is 0.1 – 3 mm per day. This type of transport is especially important
for neuronal growth and process maintenance (Hirokawa, N., 1993; Baas, 1999).
1.3. Microtubule Severing
In many cell types, such as fibroblasts, minus-ends of microtubules are anchored
near the centrosome, whereas the plus-ends are oriented towards the cell periphery.
In other cells, such as epithelial cells and neurons, non-centrosomal microtubules are
needed for the activity of differentiated cell. There are three possible ways to
produce non-centrosomal microtubules: (1) the release of microtubules originally
anchored at the centrosome, (2) de novo nucleation and growth of microtubules in
the cytosol, (3) severing of microtubules at sites remote from the centrosome
(Quarmby, et al., 2000; Quarmby, et al., 1999). Recent studies support the idea that
microtubule severing is an important source of non-centrosomal microtubules. Most
of the newly formed minus-ends (as a result of microtubule severing) seem to be
stable (Quarmby, et al., 1999).
When it comes to possible roles of microtubule severing, this mechanism may play a
role in regulating poleward flux of tubulin in the metaphase spindle during cell
division, degradation of sperm axonemal microtubules after fertilization (in sea
urchin oocytes), microtubule reorganization during the transition from interphase to
mitosis in dividing cells, and the release of centrosome-nucleated microtubules
(Lohret et al., 1998).
Microtubule severing also plays a role in specific activities of differentiated cells. For
example in neurons, it is important in neuronal branching and axonal growth. The
effect of microtubule severing on neuronal cells was investigated by experiments that
inhibited the microtubule severing ATPase katanin activity. When anti-katanin
antibodies were injected into neurons, centrosomal microtubules accumulated and
the neuronal process did not occur (Ahmad, et al., 1999). According to the
experimental studies, the following model was developed for the effects of katanin
inhibition on process outgrowth. In control cells with active katanin, microtubules

10
are nucleated from centrosome and they are rapidly released by katanin after their
lengths become a few microns. Then, motor proteins transport microtubules outward
towards the cell periphery. These severing activities ensure that microtubules remain
relatively short. On the other hand, in experimental cells with inactivated katanin,
microtubules are not released from centrosomes. The number of individual
microtubules cannot be increased by severing the microtubules. As a result of all
these events, the process outgrowth is inhibited (Ahmad, et al., 1999). This supports
the idea that centrosomal katanin, so microtubule severing is important for the
production of non-centrosomal microtubules (Quarmby, et al., 2000).
As already mentioned, dendrites and axons contain large numbers of non-
centrosomal microtubules that are essential for architectural support and also act as
railway for the transport of materials along the axon (Dent, et al., 1999, Joshi, et al.,
1998). There are two possible mechanisms for the formation of non-centrosomal
microtubules in neuron cells: (1) these non-centrosomal microtubules are derived
from in situ nucleation and assembly, or (2) these non-centrosomal microtubules are
transported from the cytosol as polymers. As axons are incapable of locally
synthesizing the tubulin subunits, microtubules nucleated at centrosomes must be
actively transported from their sites of synthesis within the cell body of the neuron
down the axon in the form of assembled microtubule polymer (Baas, et al., 1997). If
the second mechanism occurs, these microtubules are probably produced by
microtubule severing (Quarmby, et al., 1999, Quarmby, et al., 2000).
1.3.1. AAA Family Proteins
Katanin and spastin are members of a large protein family, AAA which stands for
ATPases Associated with various cellular Activities. This family proteins play
important role in numbers of cellular activities including proteolysis, protein folding,
membrane trafficking, cytoskeletal regulation, organelle biogenesis, DNA replication
and intracellular motility (McNally et al., 1993; Vale et al., 2000).
The common feature of the AAA superfamily is an ATPase domain. This domain is
composed of about 220 amino acids. It is known that AAA domains assemble into
oligomeric structures and this allows proteins to change their shapes during ATPase
cycle. ATP binding induces structural rearrangements at the interface region of AAA
11
proteins. This increases interactions between adjacent AAA domains, also increases
interactions between AAA protein and its target (Vale et al., 2000; McNally, F. et al.,
2000).
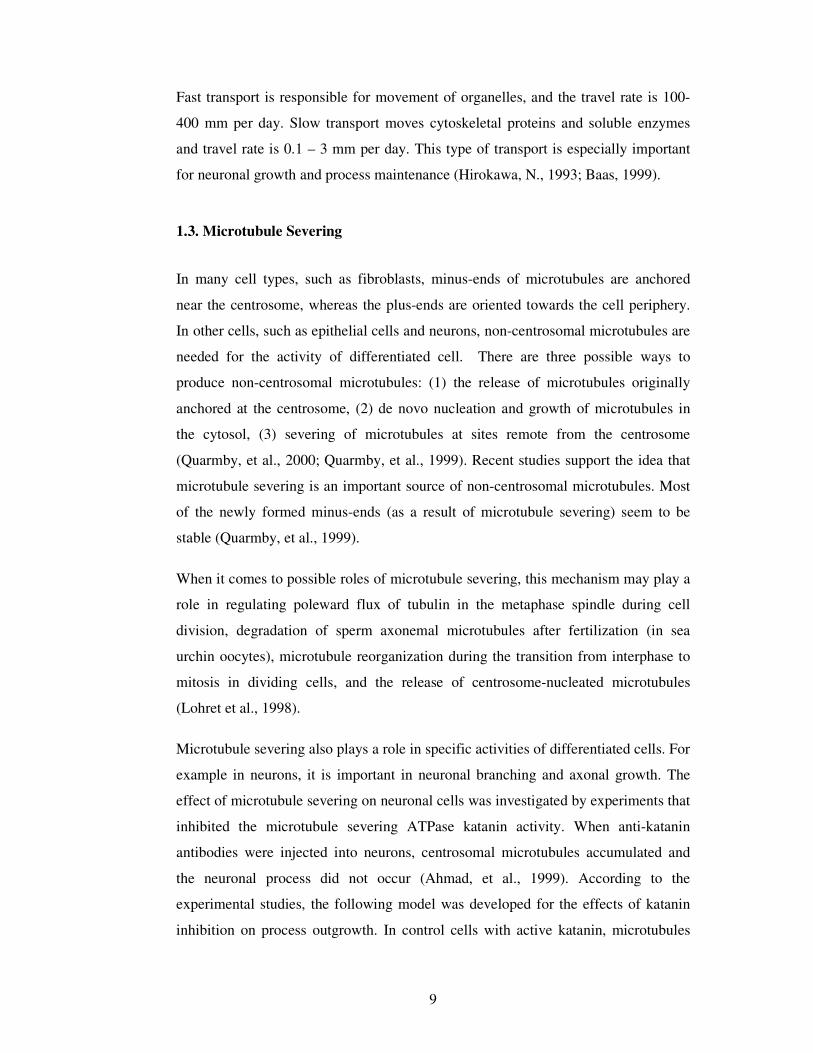
Figure 1.7: Conformational change of AAA protein ring
Ring-like structures are useful for AAA enzyme mechanism. This allows subunits to
switch between tense and relaxed states in a concerted manner. These structures also
provide framework for binding target proteins at multiple sites. If ring-binding sites
change their positions, this will also cause tension application to bound protein (Vale
et al., 2000).
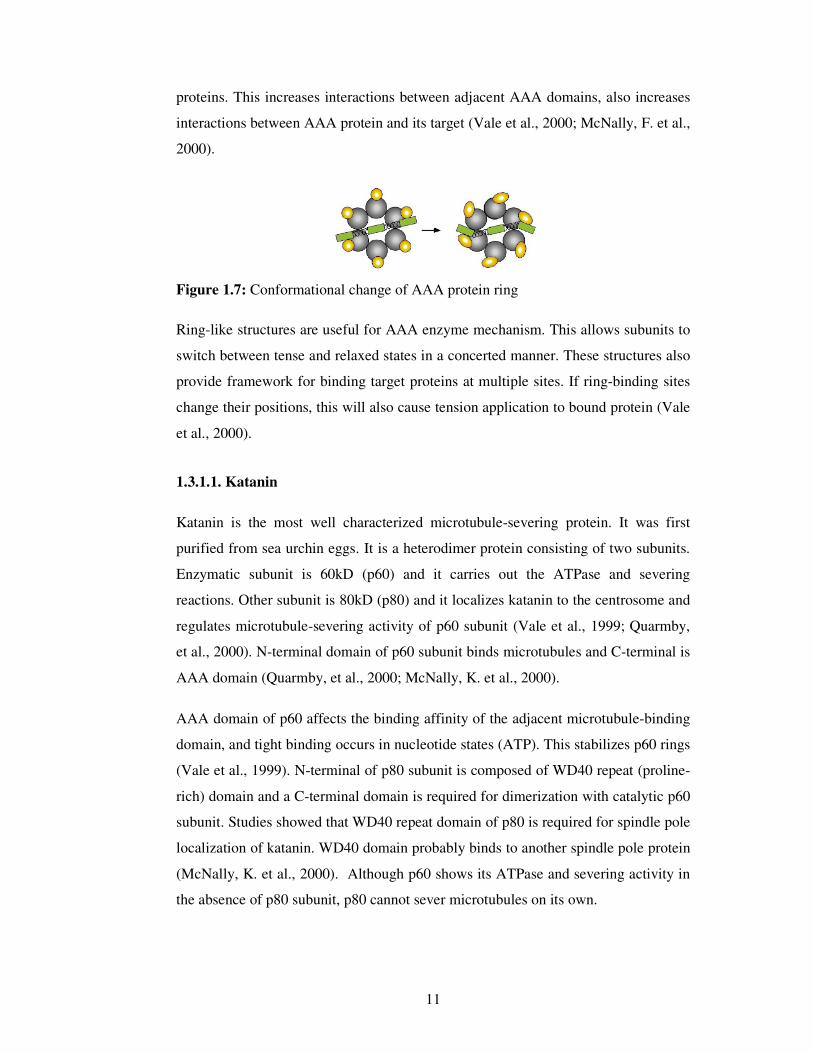
1.3.1.1. Katanin
Katanin is the most well characterized microtubule-severing protein. It was first
purified from sea urchin eggs. It is a heterodimer protein consisting of two subunits.
Enzymatic subunit is 60kD (p60) and it carries out the ATPase and severing
reactions. Other subunit is 80kD (p80) and it localizes katanin to the centrosome and
regulates microtubule-severing activity of p60 subunit (Vale et al., 1999; Quarmby,
et al., 2000). N-terminal domain of p60 subunit binds microtubules and C-terminal is
AAA domain (Quarmby, et al., 2000; McNally, K. et al., 2000).
AAA domain of p60 affects the binding affinity of the adjacent microtubule-binding
domain, and tight binding occurs in nucleotide states (ATP). This stabilizes p60 rings
(Vale et al., 1999). N-terminal of p80 subunit is composed of WD40 repeat (proline-
rich) domain and a C-terminal domain is required for dimerization with catalytic p60
subunit. Studies showed that WD40 repeat domain of p80 is required for spindle pole
localization of katanin. WD40 domain probably binds to another spindle pole protein
(McNally, K. et al., 2000). Although p60 shows its ATPase and severing activity in
the absence of p80 subunit, p80 cannot sever microtubules on its own.
12
Besides targeting katanin to the centrosomes it also enhances severing capacity of
p60. Association of the two subunits increases their affinity for microtubules and also
microtubule-severing activity (Hartman et al., 1998; Quarmby, et al., 2000; Ahmad
et al., 1999).
Katanin is a microtubule stimulated ATPase; thus microtubule concentration affects
the enzyme activity. Katanin forms ring structures and the ring formation occurs only
when katanin subunits bind to adjacent tubulin subunits in the microtubule wall
(McNally, F. et al., 2000). If microtubules are not present at the centrosome, katanin
is distributed in the cytoplasm. Once microtubules are nucleated at the centrosome
tubulin-katanin interactions make ring formation occur (Baas et al., 1997). At low
microtubule concentrations (<2µM), ATPase activity increases with increasing
microtubule concentration; but at higher microtubule concentrations, ATPase activity
decreases until it approaches basal levels.
This ATPase behavior of katanin is unusual, and there are some explanations for the
unusual ATPase behavior of katanin. Katanin binds microtubules at two sites; this
increases local microtubule concentration by cross-linking and thereby stimulates
katanin’s ATPase activity. At higher microtubule concentrations, the ratio of katanin
to microtubules is lower, less cross-linking occurs, thus less ATPase stimulation will
be observed. A second explanation is about katanin oligomerization into rings.
Microtubules promote p60-p60 oligomerization and oligomerization stimulates
ATPase activity. Low microtubule concentrations facilitate oligomerization because
p60 monomers are more likely to bind near one another on the microtubule. On the
other hand, when the microtubule concentration is high, this will inhibit p60
assembly by sequestering p60 monomers at non-contiguous sites (Vale et al., 1999;
Hartman et al., 1998).
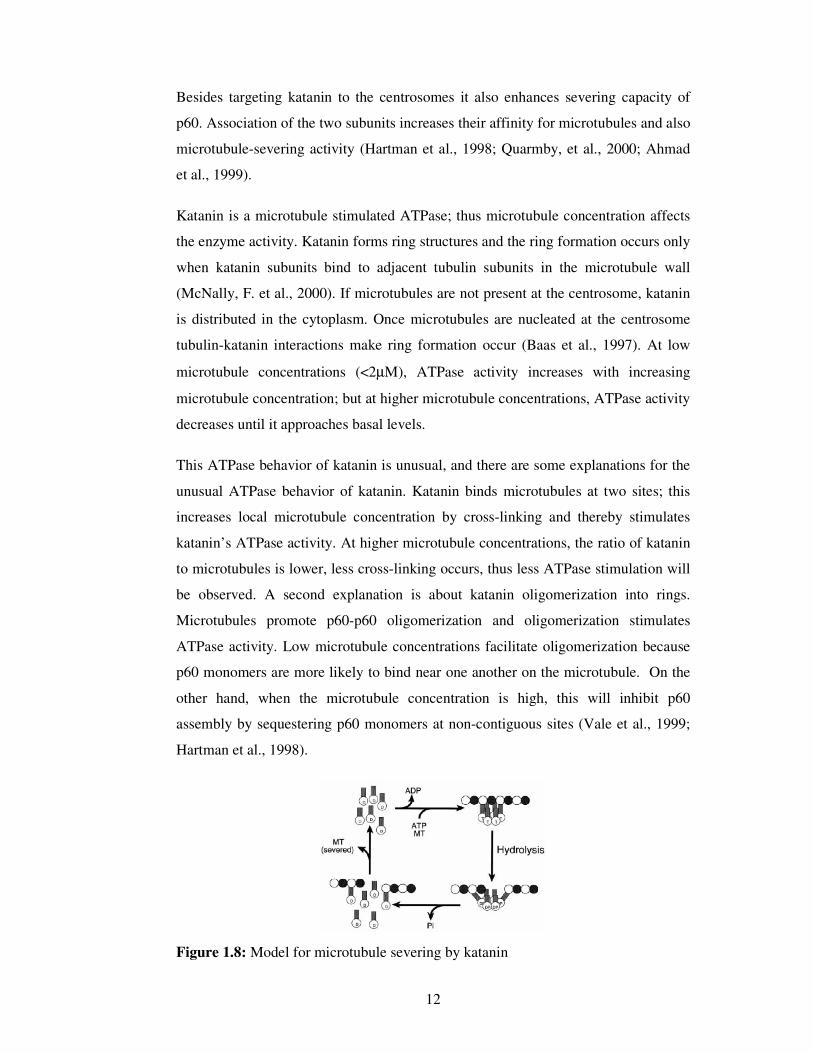
Figure 1.8: Model for microtubule severing by katanin
13
The following question is “how does katanin sever microtubules?” Studies on
katanin gave rise to a model of microtubule severing. Katanin-ADP is monomeric
molecule. When katanin exchanges its ADP for ATP, p60-p60 affinity is enhanced,
and then oligomerization on microtubule is most efficient. Oligomerization allows
binding of multiple katanin subunits to multiple adjacent tubulin subunits in the
microtubule and 14-16 nanometer katanin ring is formed. Once a complete katanin
ring is assembled on the microtubule, the ATPase activity of katanin is stimulated.
As a result of ATPase reaction, phosphate group is released. Katanin undergoes a
conformational change. This creates a pulling or pushing force on the tubulin
subunits, leading to destabilization of tubulin-tubulin contacts. Katanin-ADP
monomer has lower affinity for other katanin molecules and for tubulin subunits.
This leads to the dissociation of complex and the recycling of the katanin (Vale et al.,
1999; Quarmby et al., 2000; McNally, F. et al., 2000).
Because of being hexamer, the katanin ring cannot be docked on the sides of
microtubule in such a way as to create identical interactions between katanin
subunits and tubulin subunits. There are two possible solutions for this paradox:
katanin hexamer can be docked inside the lumen of the microtubule. According to
this model, katanin monomers enter microtubule through dynamic lattice defects in
the microtubule wall and oligomerization occurs inside the microtubule. Second
solution is assembly of higher-order oligomers of hexameric rings on the outside of
the microtubules. Unlike a single hexameric ring, these can form multiple
homologous contacts with tubulin subunits in the microtubule wall. Coordinated
conformational changes in both structures lead to disrupt tubulin- tubulin interactions
(McNally, F. et al., 2000).
1.3.1.2. Spastin
Spastin is a member of AAA family and recently became protein of interest because
it merges the fundamental cell biology of MTs with a neurological disorder. Spastin
mutation leads to a genetically inherited disease spastic paraplegia.

14
There are also some other genes identified that are responsible for the disease. Most
frequent (~40%) form is due to SPG4 locus mutation which encodes spastin protein.
The mutations can be missense, nonsense, splice site mutation, deletion or insertion
in spastin gene (Errico et al, 2002).
Hereditary Spastic Paraplegia (HSP) can be in pure or complicated form. In pure
form weakness and spasticity of lower limbs are main characteristics. Patience
usually experience difficulties in walking. When the disease is in complicated form,
it has some additional neurological abnormalities such as retinopathy, deafness and
ataxia (Errico et al., 2002; Sherwood et al., 2004).
The degenerative process of the disease is interesting. It selectively affects some of
the longest axons in central nervous system. Corticospinal axon is most severely
affected. Next one is dorsal column. The degenerative process starts from distal ends
of these axons and proceeds toward the cell body. This is called “dying back”
axonopathy and the reason of such mechanism is still unclear (McDermott et al.,
2003).
There are hypothesis for the situation. Mutant spastin disrupts MT dynamics by
causing impairment of organelle transport on MT network. Supporting the
hypothesis, studies with rat cortical neurons showed that there was a decrease in
kinesin staining in mutant spastin overexpressing cells. Also in the same study, it was
observed that spastin do not localize in axonal and dendritic processes while mutant
spastin extended into the axons but not into dendrites (McDermott et al., 2003).
Another degeneration hypothesis is spastin can cause degeneration by diminishing
the supply of short MTs required for process generation. Mutant spastin lacks MT
severing activity, so that short MTs can not be formed via severing activity of spastin
(Baas et al, 2005).
Spastin is a member of AAA protein family. It belongs to the meiotic subgroup
which also contains proteins involved in vesicle trafficking and MT dynamics. P60 –
katanin is also a member of this group and it is the most characterized one. Spastin
shares great homology with p60 –katanin within AAA domain but they do not have
homology in their N – terminal region. Because of this homology, spastin is thought
to be MT severing protein as p60 –katanin. To test the hypothesis, several cell

15
culture experiments were done and overexpression of wild type spastin really caused
disassembly of MT cytoskeleton. Drosophila studies also showed that spastin
overexpression in muscle erases their MT networks consistent with the idea that
spastin is a MT severing protein. The same study also showed that Drosophila
spastin (Dspastin) has a positive role in maintaining the synapse by encouraging
growth through increasing dynamic instability of MTs. One more hypothesis raised
from this study: proteins that destabilize MTs should facilitate synaptic growth
(Sherwood et al., 2004; Roll – Mecck, 2005).
Spastin is encoded by SPG4 (SPAST) locus and it is composed of 17 exons
(Fonknechten, 2000). Spastin is 616 amino acid long and approximately 67.2 kDa. It
contains two leucine – zipper and coiled – coil dimerization motif (Charvin et. al.,
2003; Hazan et al., 1999).
Spastin is composed of three domains. N – terminal region contains putative
transmembrane region TM, MIT is a microtubule interacting and trafficking domain.
This domain is well conserved in spastin family. Final domain is ATP binding AAA
domain (Roll – Mecck, 2005).
Figure 1.9: Domain localization of spastin
Although having similarity with p60 –katanin in function, spastin needs lots of
further investigations. Even localization of spastin is controversial. It was reported
that there is a putative nuclear localization signal RGKKK at 7 – 11 positions of
human aminoacid sequence of spastin, but its sub cellular localization is still not
clear (Charvin et al., 2003).
Various studies were done by using different antibodies generated against the
protein. Some results pointed spastin to be a cytoplasmic protein however some
results reported nuclear localization (Sherwood, 2004).

16
Charvin et al. found spastin in nuclei, whereas most recent study detected spastin in
the cytoplasm and/or in the nucleus depending on neuronal population. All these
findings possibly underlies multifaced cellular role for spastin.
It is possible for endogenous spastin to be a nuclear protein but because of conditions
in transient transfection and overexpression, factors that localize spastin to the
nucleus could be overwhelmed. This may lead spastin to be distributed as aggregates
surrounding the nucleus. Alternative idea is that spastin is initially cytoplasmic
protein that is transported slowly into nucleus. This process can not occur in transient
overexpression conditions (Fink et al., 2004).
In dividing cells, spastin is mainly nuclear in interphase cells, becomes associated
with centrosomes, the spindle MTs, the midzone and finally midbody during cell
division (Errico, et al., 2004).
When it comes to post-mitotic cells, spastin is localized in discrete nuclear domains,
but most interestingly detects a specific signal in the neurites. This signal is
characteristically enriched in the distal axon and in the branching regions such as
growth cones. According to these results it can be hypothesized that spastin
influences MT dynamics in growth cones; thus regulating the stability of axons and
axonal transport (Errico, et al., 2004).
1.4. Aim of the Study
Microtubules are essential polymers for the cell. Specifically in nerve cells, the
neuronal morphology is related to the capacity of the neuron to reconfigure its
microtubule scaffold. Recent studies indicate that microtubule movement is directly
related to its length; the shorter the microtubule is the faster the movement (Dent et
al., 1999). Based on these studies, it can be concluded that reconfiguration and
transport of microtubules require that longer microtubule are severed into shorter
pieces.
17
Neurons are rich in protein called katanin, which is a microtubule severing ATPase.
It has been shown to severe microtubules from centrosomes and play role in
generating short microtubules throughout the neuron (Ahmad et al., 1999). Recently,
spastin, another microtubule severing protein expressed in neurons was identified
(Errico et al., 2002).
First aim of the study was to analyze the basis of existence for two different proteins
with the same functions. In previous studies done with katanin, researchers expected
to obtain neurons with increased process formations upon overexpression of katanin
(Karabay et al., 2004). Unfortunately, the expectations did not come true. We
thought that, although having similar function with katanin, spastin may act in
different way in the cell. Our expectation was based on dilemma about the
localization of spastin. Besides the studies that support cytoplasmic localization of
the protein there are also studies that address nuclear localization. If localization
pattern of spastin is different than katanin, it may also lead severing of microtubules
in different compartments of the neuron and cause variations in process formations,
for instance it may increase dendrite formations. We hypothesized that “spastin,
microtubule severing protein, may lead new process formations in neurons by
breaking down long microtubules into short pieces throughout the cell”
In order to test the hypothesis, overexpression of spastin, katanin and GFP (as
control) constructs were carried out in hippocampal cell cultures.
Neurons contain high levels of katanin and theoretically it can be claimed that
katanin continuously severs microtubules into subunits. If not, there should be some
regulatory mechanisms for the severing activity of katanin. Observations showed that
katanin is more active in mitotic extracts than in interphase extracts, and that the
activity is related to phosphorylation in some ways (McNally et al., 2002). However,
katanin itself is not phosphorylated so this leads the idea that phosphorylation of
other proteins regulates katanin.
It was shown that the frog homolog of MAP4 reduced the microtubule severing in
vitro (McNally et al., 2002) and this result is the basis of the model where katanin is
regulated by microtubule –associated proteins (MAPs).
18
In 2005, Yu et al., showed that p60 –katanin overexpression in cultured neurons
causes widespread severing and loss of microtubules in cell bodies, minor processes,
dendrites and not in axons. In axons, microtubules appear to be more resistant to
severing. This protection can be due to existence of MAPs like MAP2c, MAP1b, tau
that are enriched in the axon. Our hypothesis was “microtubule severing protein,
spastin is regulated by microtubule associated proteins and MAP overexpression
prevents microtubules to be severed by spastin”
In this part of the study the aim was to test whether individual neuronal MAPs, in
this case MAP2c and MAP1b, have the ability to protect microtubules from being
severed by overexpressed spastin. Since fibroblasts do not have intrinsic MAP2c,
MAP1b expression feature, RFL6 cell line was chosen in the study.

19
2. MATERIALS AND METHODS
2.1. Materials
2.1.1. Animals
Rat embryos at embryonic day 18 (E18) were used for hippocampal dissection.
Embryos were taken from pregnant female-Sprague-Dawley rat with a c-section,
which was about to give a birth. Rats usually give birth on the 21st or 22nd day post-
conception.
2.1.2. ATCC Cell Lines
Fetal, rat lung fibroblasts RFL-6 (ATCC, CCL-192) were obtained from American
Type Culture Collection (Rockville, Maryland).
2.1.3. Plasmid Constructs
Table 2.1: List of plasmid constructs
Construct Reference
pEGFP-C1- p60 katanin Karabay, et al, 2004
pcDNA3-spastin-myc-GFP Errico, et al, 2002
pEGFP-C1 Clontech, catalog number: 6084-1
pMAP2c – human MAP2c Gamblin, et al, 1996
pMAP1b – mouse MAP1b Weeks and Fischer, 2000
2.1.4. Antibodies
• Goat polyclonal anti-MAP1b antibody (Ab) (Santa Cruz, CA, sc-8971);
• Unconjugated mouse monoclonal anti-beta-tubulin Ab (Sigma, catalog
number T4026);
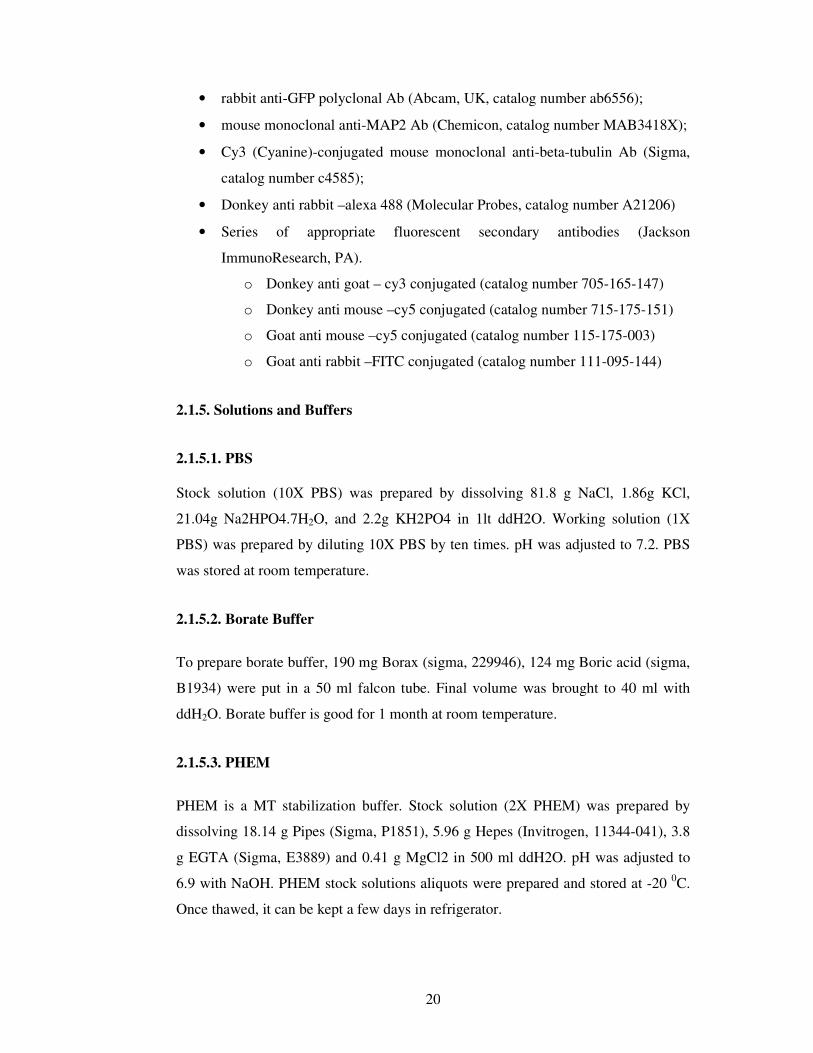
20
• rabbit anti-GFP polyclonal Ab (Abcam, UK, catalog number ab6556);
• mouse monoclonal anti-MAP2 Ab (Chemicon, catalog number MAB3418X);
• Cy3 (Cyanine)-conjugated mouse monoclonal anti-beta-tubulin Ab (Sigma,
catalog number c4585);
• Donkey anti rabbit –alexa 488 (Molecular Probes, catalog number A21206)
• Series of appropriate fluorescent secondary antibodies (Jackson
ImmunoResearch, PA).
o Donkey anti goat – cy3 conjugated (catalog number 705-165-147)
o Donkey anti mouse –cy5 conjugated (catalog number 715-175-151)
o Goat anti mouse –cy5 conjugated (catalog number 115-175-003)
o Goat anti rabbit –FITC conjugated (catalog number 111-095-144)
2.1.5. Solutions and Buffers
2.1.5.1. PBS
Stock solution (10X PBS) was prepared by dissolving 81.8 g NaCl, 1.86g KCl,
21.04g Na2HPO4.7H2O, and 2.2g KH2PO4 in 1lt ddH2O. Working solution (1X
PBS) was prepared by diluting 10X PBS by ten times. pH was adjusted to 7.2. PBS
was stored at room temperature.
2.1.5.2. Borate Buffer
To prepare borate buffer, 190 mg Borax (sigma, 229946), 124 mg Boric acid (sigma,
B1934) were put in a 50 ml falcon tube. Final volume was brought to 40 ml with
ddH2O. Borate buffer is good for 1 month at room temperature.
2.1.5.3. PHEM
PHEM is a MT stabilization buffer. Stock solution (2X PHEM) was prepared by
dissolving 18.14 g Pipes (Sigma, P1851), 5.96 g Hepes (Invitrogen, 11344-041), 3.8
g EGTA (Sigma, E3889) and 0.41 g MgCl2 in 500 ml ddH2O. pH was adjusted to
6.9 with NaOH. PHEM stock solutions aliquots were prepared and stored at -20 0C.
Once thawed, it can be kept a few days in refrigerator.
21
2.1.5.4. Mounting Medium
Mounting medium was prepared by bringing 0.106g N-Propyl gallate (Sigma,
P3130), 5 ml 1x PBS and 45 ml glycerol (Sigma, G2025) together. It was vortexed
very well and kept at 4 0C.
2.1.5.5. Hippocampus Dissection Medium
To prepare Hippocampus Dissection Medium, 10 ml HBSS (Invitrogen, 14185), 1 ml
1M HEPES (Invitrogen, 15630-080), 1 ml Penicillin-Streptomycin (Sigma, P4333)
were mixed. Final volume was brought to 100 ml by addition of 88 ml ddH2O.
Medium was filter sterilized with 0, 2 µm Nalgene filter. All the filter sterilizations
were done with same method. Medium is good for 15 days in 4 0C. It has to be kept
on ice while working.
2.1.5.6. Hippocampus Plating Medium
To prepare Hippocampus Plating Medium, 45,92 ml Neurobasal Medium
(Invitrogen, 12349-015), 1 ml B27 Supplement (Invitrogen, 17504-044), 0, 33 ml
45% Glucose (Sigma, G8769), 0, 25 ml L-Glutamine (Invitrogen, 25030-164) and
2.5 ml FBS (Biological Industries, 04-001-1) were brought up together. Final
volume was 50 ml. After filter sterilization, medium was kept in 4 0C for 15 days.
2.1.5.7. Hippocampus Serum Free
To prepare Hippocampus Serum Free Medium, 48,42 ml Neurobasal Medium
(Invitrogen, 12349-015), 1 ml B27 Supplement (Invitrogen, 17504-044), 0,33 ml
45% Glucose (Sigma, G8769), 0,25 ml L-Glutamine were brought up together. Final
volume was 45 ml. After filter sterilization, medium was kept in 4 0C for 15 days.
2.1.5.8. Fixative
To prepare 40 ml fixation solution, 160 µl 50% Gluteraldehyde (Sigma, 7651), 400
µl 10% Triton X100, 40µl 10 mM taxol and 20 ml 2X PHEM solution were mixed.
Final volume was brought to 40 ml with ddH2O. Fixative was warmed in 37 0C
water bath before using.
22
2.1.5.9. Triton X100
Triton X100 is a detergent that is mostly used to extract the membrane from cells so
that the cytoskeleton can be accessed. It is usually prepared as 10% solution. To
prepare this, 4 ml of pure Triton X100 (Sigma, T-9284) was placed in 50 ml tube.
ddH2O was added into tube up to 40 ml. Tube was capped and covered with
parafilm. Tube was rotated overnight in the cold room to fully disperse the tick
detergent. Next morning, 4 ml aliquot tubes of 10% Triton X100 were prepared.
Tubes were covered with parafilm and stored at -20 0C. When the aliquot is thawed it
has to be stored at 4 0C.
2.1.5.10. Blocking Solution
Blocking solution application is important to reduce unspecific bindings. To prepare
1 ml blocking solution 100 µl GOAT (or DONKEY) serum and 10 mg BSA were
dissolved in 1X PBS and filtered with 0.8µm Nalgene filter. The final concentrations
of ingredients were 10% serum and 10 mg/ ml BSA. Blocking solution is good for 15
days when stored at 4 0C.
2.1.5.11. ATCC Medium
ATCC medium was recommended by the manufacturer of RFL – 6 cell line. To
prepare 200 ml of the medium, 40 ml FBS (Biological Industries, 04-001-1) and 160
ml F12K (Sigma, N3520) were mixed. The final concentration of ingredients were
20% FBS and 80% F12K.
2.1.5.12. L – Glutamine
L-glutamine is an essential amino acid that is a crucial component of culture media
that serves as a major energy source for cells in culture. L-glutamine is very stable as
a dry powder and as a frozen solution; however in liquid media or stock solutions, L-
glutamine degrades relatively rapidly. For optimal cell performance, L-glutamine is
usually added to the media prior to use. In this study, the L-glutamine was purchased
from Sigma, with the catalog number G7513.

23
2.1.5.13. Chemicals
Table 2.2: List of chemicals
25% Gluteraldehyde EMS
Taxol Sigma
NaHBo Sigma
BSA Calbiochem
0.25 % Trypsin/EDTA Sigma
2.5% Trypsin Gibco
DNase Sigma
Wax Sigma
Nail polisher
2.1.5.14. Kits
Table 2.3: List of kits
Rat Neuron Nucleofactor Kit (catalog number: VPG-1003), Amaxa.
Plasmid Midi Kit (catalog number: 12143), Qiagen.
Endofree Plasmid Maxi Kit (catalog number: 12362), Qiagen.
2.1.5.15. Equipments
Table 2.4: List of equipments
Water bath
CO2 Incubator Shel Lab
Ultrapure water system USF-Elga UHQ (USA)
Centrifuge Beckman coulter
Hemacytometer
Fluorescent Microscope Carl Zeiss, Oberkochen,Germany
Light Microscope Olympus CH30 (USA)
Micropipettes Eppendorf (Germany)
Filters Nalgene (USA)
24
2.2. Methods
2.2.1. Coverslips
Much of our work requires microscopic techniques, so that it is difficult to use plastic
culture dishes for plating the cells. Because of this, we plate the hippocampal cells
onto glass coverslips that have been already treated with poly – L – lysine. These
dishes can be prepared by fixing the glass coverslips onto the plate or commercially
available cell culture dishes can be used. These dishes have special chamber made of
glass, and after coating this chamber with desired substrate, we can plate the
hippocampal cells into this hole. Using substrates, like poly-lysine, enhances cell
adhesion. Obtaining successful neuronal cultures also depends on finding appropriate
substrate. Surfaces treated with basic amino acid polymers such as polylysine and
polyornithine are very common.
To prepare the coating substrate, 10 mg poly – L – lysine was dissolved in 10 ml
borate buffer (1 mg/ ml) and filter sterilized by using 0,2 µm Nalgene filter.
• Each dish was covered with 0.2 ml of poly – L – lysine solution for 1 hour at
room temperature.
• Then, the dishes were washed 6 times for 5 minutes each with sterile double
distilled water.
• Water was taken off and 2 ml of hippocampal plating medium was added into
the dishes.
• Dishes were kept in incubator with water until the day of culturing or dried.
• On the day of culturing, plating medium was removed and cells were plated
immediately
• All the coating procedure was done under the UV sterilized hood.
2.2.2. Media
Tissue was dissected and dissociated in Hepes-buffered, calcium- and magnesium-
free Hank’s balanced salt solution (HBSS), “Hippocampus Dissection Medium”. At
all stages tissues and cells have to be maintained in an osmotically balanced solution
at physiological pH. This medium is intended for short-term use. After obtaining

25
single cell suspension, neurons were plated into serum- containing medium,
“Hippocampus Plating Medium”. The plating medium contains serum that provides
the trace nutrients and growth factors needed for long-term growth of the cells, also
amino acids and some other ingredients. In this study we used fetal bovine serum
(FBS). FBS is rich in mitogenic factors and preferred for proliferating cells.
When the cells were attached to the substrate, medium was changed with serum free
medium “Hippocampus Serum-Free Medium” because there are some disadvantages
when serum is used to supplement culture medium. Serum represents a major
potential route for the introduction of agents including bacteria, fungi and viruses
into cell culture. This could be disruptive. The presence of serum also influences
downstream processing. At 10% concentration, serum contributes about 4-8 mg of
protein per ml while recombinant proteins are frequently expressed at levels of tens
of micrograms per ml. In this situation, efficient purification of the required protein
may be difficult.
The Neurobasal Medium that was used in plating medium has to be phenol red-free,
because phenol red is endocytosed by the cells and can contribute significantly to
fluorescence background and to phototoxicity.
2.2.3. Primary Culture
In this part of the study primary neuron culture cells were used. When the culture
started from cells, tissue or organs taken directly from organisms it is termed
“primary culture”. When the tissue is dissociated into single cell suspension and
plated into culture dish, go through series of event. If cells are mitotic, they undergo
rapid division. When they approach confluence and contact with one another, their
division rate slows and they start differentiation. Each type of different cell has
different differentiation pattern.
Because they are post-mitotic cells, the situation is different in neuron cells. When
the embryonic brain cells are dissociated and plated into culture dish, neurons that
have completed their division in situ start to extend processes, form synapses with
one another, become electrically active, etc. This makes the study of neurons in
culture completely different from other cell types. One of the important things about
26
neurons is that, in dissociated cultures they also retain their individual identities, and
each different type of neurons expresses its own properties.
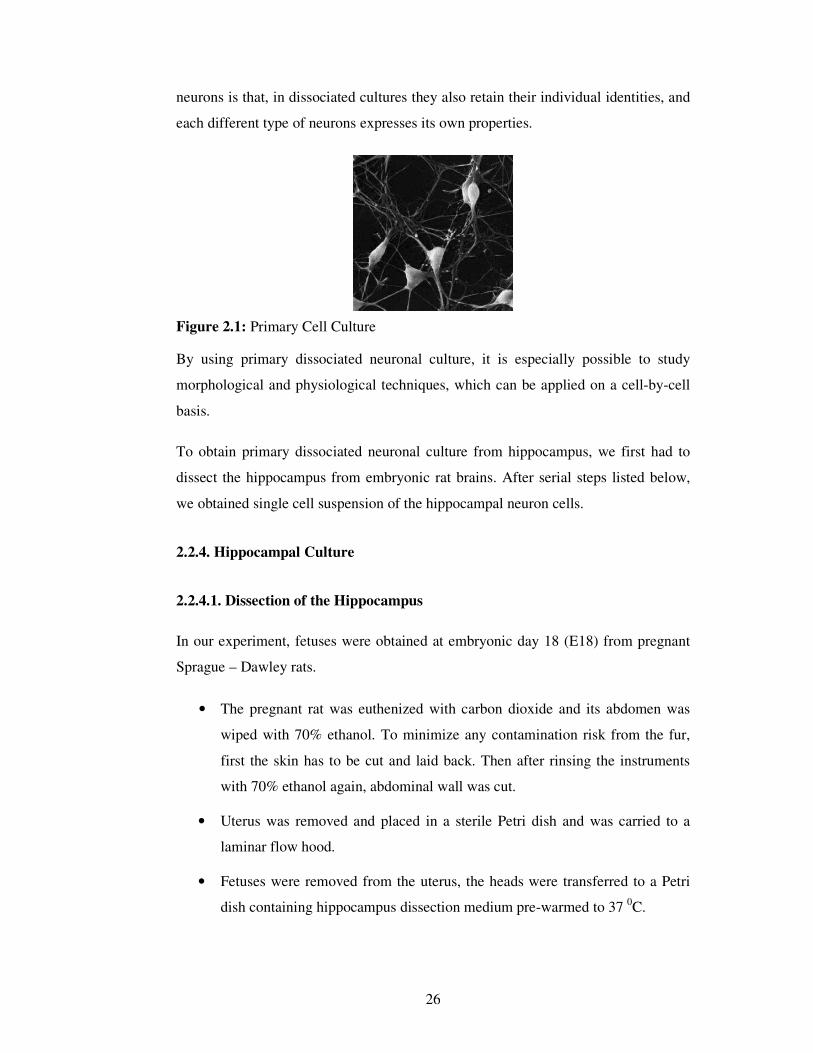
Figure 2.1: Primary Cell Culture
By using primary dissociated neuronal culture, it is especially possible to study
morphological and physiological techniques, which can be applied on a cell-by-cell
basis.
To obtain primary dissociated neuronal culture from hippocampus, we first had to
dissect the hippocampus from embryonic rat brains. After serial steps listed below,
we obtained single cell suspension of the hippocampal neuron cells.
2.2.4. Hippocampal Culture
2.2.4.1. Dissection of the Hippocampus
In our experiment, fetuses were obtained at embryonic day 18 (E18) from pregnant
Sprague – Dawley rats.
• The pregnant rat was euthenized with carbon dioxide and its abdomen was
wiped with 70% ethanol. To minimize any contamination risk from the fur,
first the skin has to be cut and laid back. Then after rinsing the instruments
with 70% ethanol again, abdominal wall was cut.
• Uterus was removed and placed in a sterile Petri dish and was carried to a
laminar flow hood.
• Fetuses were removed from the uterus, the heads were transferred to a Petri
dish containing hippocampus dissection medium pre-warmed to 37 0C.

27
• Brains were removed under a dissection microscope. For this procedure two
Dumont-style forceps (no.5) were used.
o The cerebral hemispheres were separated from diencephalon and brain
stem (A, B). Diencephalon and brain stem were discarded.
o Meninges were carefully stripped away (C).
o (D) shows one of the hemispheres after removal of meninges.
Arrowheads indicate the boundary between the hippocampus and the
adjoining cortex; small arrows mark the free edge of the hippocampus.
o (E) shows the removal of hippocampus. The hemisphere was
stabilized with forceps and another forceps was used to cut the
hippocampus and to take it out of the hemisphere.
o (F) shows the hippocampus after it has been removed.
When viewed from the midline, the hippocampus forms a C in the hemispheres.
When all the required hippocampi have been lift them with the forceps and transfer
to a dish containing hippocampus dissection medium. The hippocampi were cut into
small pieces and transferred into 15 ml conical centrifuge tube.
• The volume was bringed to 4.5 ml with hippocampus dissection medium.
• 0.5 ml Trypsin 2,5% (Gibco # 25095-19) and 0.25 ml DNase (Sigma#DN-25)
(10 mg/ ml) were added into tube, tube was gently mixed and incubated in
37 0C water bath for 15 minutes.
• Hippocampi pieces were settled to the bottom of the tube, and after the
incubation trypsin and DNase were pipetted off.
• Hippocampi pieces were rinsed 2 times for 5 minutes each with 5 ml
hippocampus plating medium.
• 1 ml warm hippocampus plating medium was added into the tube.
• Trituration was done 6-7 times against the side of the tube with a fire-
polished Pasteur pipette. The medium was especially pushed out against the
side of the tube to prevent frothing because the cells at an air-liquid interface
can be lysed.
• Dissociation was completed, and the cell density was determined by using
hemacytometer.

28
Hemacytometer is a specially designed slide with a counting chamber 0.1 mm deep
and ruled in a grid pattern. After the density and proportion of the viable cells was
determined the required amount of cells were taken and diluted. For transfection, we
used 106 cells per dish.
Figure 2.2: Hippocampus Dissection

29
2.2.4.2. Plasmid DNA Preparation (midi scale)
Plasmid mini preparation was performed using Qiagen, Plasmid Midi Kit for large-
scale (midi) preparations, following instructions of the manufacturer. The principle
of this purification is as follows: alkaline lysis releases plasmid DNA from bacteria
and RNase removes all the RNA in the lysate. Then, in the presence of a chaotropic
salt (guanidine HCl), plasmid DNA binds selectively to glass fiber fleece in a
centrifuge tube. The DNA remains bound while a series of rapid “wash-and-spin”
steps remove contaminating bacterial components. Finally, low salt elution removes
the DNA from the glass fiber fleece.
The protocol is as follows:
• A single bacterial colony was picked and inoculated into 5 ml selective LB
media containing Falcon tube, and grown for 8 hours with shaking (250 rpm)
at 37 ºC.
• Starter culture was diluted into 25 ml selective LB media containing flask and
grown for 16 hours with shaking (250 rpm) at 37 ºC.
• The following day, culture was distributed into 2 centrifuge tubes (12.5 ml
each tube), and the bacteria were harvested by centrifugation for 15 minutes
at 6.000 x g at 4 ºC. The supernatants were discarded.
• The bacterial pellet was resuspended in 4 ml of suspension buffer, Buffer P1
in each centrifuge tube separately and then collected to one centrifuge tube.
Suspension buffer contains RNase which removes bacterial RNA.
• To lyse the cells, 4 ml lysis buffer, Buffer P2 was added (contains NaOH),
mixed by inverting the tube 6 times and incubated at room temperature for up
to 5 minutes.
• Lysis was stopped by addition of 4 ml ice-cold binding buffer, Buffer P3.
Tube was again inverted 6 times and incubated on ice for up to 15 minutes.
• The mixture was centrifuged for 30 minutes at 20.000 x g at 4 ºC and
supernatant was transferred to a new centrifuge tube. Chromosomal DNA
was precipitated with cellular debris during centrifugation and this
supernatant contains the plasmid DNA
• Supernatant was centrifuged again for 15 minutes at 20.000 x g at 4 ºC.

30
• Filter tube, Qiagen-tip 100 was equilibrated by adding 4 ml Buffer QBT.
Column was allowed to empty by gravity flow.
• When the Qiagen-tip 100 was drained completely, supernatant was applied to
Qiagen-tip 100 and allowed to enter the resin by gravity flow. Plasmid DNA
is bound to the glass fibers pre-packed in the filter tube. Flow-through was
discarded from the collection tube.
• Qiagen-tip 100 was washed 2 times with 10 ml washing buffer, Buffer QC.
Buffer QC was allowed to move through the Qiagen-tip 100 by gravity flow.
The first wash is sufficient to remove all contaminants in the majority of
plasmid DNA preparations. The second wash is especially necessary when
large culture volumes or bacterial strains producing large amounts of
carbohydrates are used.
• To elute the DNA 5 ml elution buffer, Buffer QF was added. Eluate was
collected in 15 ml centrifuge tube. Since polycarbonate tubes are not resistant
to alcohol, it is not recommended to use polycarbonate centrifuge tubes.
• Eluted DNA was precipitated by adding 3.5 ml room-temperature
isopropanol.
• Tube was mixed and centrifuged immediately at 15.000 x g for 30 minutes at
4 ºC.
• DNA pellet was washed with 2 ml of room-temperature 70% ethanol, and
centrifuged at 15.000 x g for 10 minutes.
• Supernatant was discarded very carefully without disturbing the DNA pellet.
• Pellet was air-dried for 30 minutes.
• When the pellet is dried completely, it was redissolved in 100 µl TE buffer,
pH 8.
2.2.4.3. Transfection
Many research techniques in molecular biology require a foreign gene to be inserted
into a host cell. Since the phospholipid bilayer of the plasma membrane has a
hydrophilic exterior and hydrophobic interior, any polar molecules, such as DNA,
are unable to freely pass through the membrane. Many methods have been developed
to allow the insertion of DNA and other molecules into the cells to be studied. In
dividing cells, if the DNA enters into the cytoplasm, it will enter the nucleus during

31
break down of the nuclear envelope during mitosis. On the other hand, neurons are
post-mitotic cells and they do not have ability to divide so that it is difficult to
transfect these cells. If standard methods such as calcium phosphate co-precipitation,
lipid mediated transfection, etc… are used to transfect the neurons the efficiency is
usually very low, ≤ 1 %. Other methods that have been used for transfecting neurons
are microinjection and biolistics. Also some adenoviral transfection methods give
very high transfection efficiencies.
The method that we used in this experiment was electroporation, which is also
termed electrotransfer or electropermeabilization. In this experimental technique,
brief electric pulses, lasting a few microseconds to a millisecond, are applied to the
cells. This quick voltage shock disrupts areas of the membrane temporarily, causes
the formation of temporary aqueous pores. The electric potential across the
membrane of the cell simultaneously rises by about 0.5-1.0 V so that charged
molecules (such as DNA) are driven across the membrane through the nucleus. As
charged ions and molecules flow through the pores, the cell membrane discharges
and the pores quickly close, and the phospholipid bilayer reassembles. The plasmid
of interest supposed to be inside the cell for further use or study.
Although the efficiency is high in electroporation, this technique has some
disadvantages also; if the pulses are of the wrong length or intensity, some pores may
become too large or fail to close after membrane discharge causing cell damage. The
transport of material during the electropermeability is relatively nonspecific, this may
cause an ion imbalance that could later lead to improper cell function and cell death
(Banker & Goslin, 1998)
• Required amount of cells were taken from cell suspension that was prepared
by trituration and centrifuged at 3000 rpm for 5 minutes.
• Supernatant was removed and pellet was resuspended in Nucleofactor
solution. 100 µl of Nucleofactor solution was used per cuvette.
• 100 µl cell – Nucleofactor solution mix was placed into the tubes that contain
interested plasmids:
o rat p60-GFP → 15 µg/cuvette
o spastin-myc-GFP → 15 µg/cuvette
o GFP → 5 µg/cuvette

32
• Cells, Nucleofactor solution and plasmids were combined.
• Combination was transferred into the electroporation cuvette.
• Electroporation was done by using program G-13 in Amaxa nucleofactor.
• Cells were taken out of the cuvette immediately and transferred into new tube
containing 900 µl plating medium by Amaxa certified pipette.
• Cells were diluted with plating medium. The final concentration was 8000
cells/dish.
• 200 µl of cells were plated into 35-mm Petri dishes and placed into 37 0C 5%
CO2 incubator.
• 2 – 3 hours later, 2 ml of plating medium was added into the dishes and kept
in 37 0C 5% CO2 incubator.
• Cell fixation/co-extraction was done on day 2, day 4.
2.2.4.4. Cell Fixation
To be able to analyze the cells under the microscope they have to be fixed. This also
preserves the cells for longer storage periods. There are several methods for fixation.
Besides the aldehydes organic solvents can be used in fixation. Aldehydes fix by
denaturation and chemical modification of proteins. For example, covalent reactions
can occur with free amino groups of lysine residues. When protein cross linking
occurs cells become rigid. The cell membrane of intact cells remains relatively
impenetrable to larger molecules such as antibodies. Thus, “cell permeabilization” is
required before immunostaining.
When it comes to the organic solvents such as methanol, ethanol, acetone, they
denature proteins without covalent modifications, they just remove bound H2O
molecules. These solvents also remove membrane and some structural lipids, and
cells become permeable to antibodies.
In our study we used gluteraldehyde as fixative. We also used detergent, Triton-
100X for cell extraction that led cell permeabilization. Both procedures were done in
the same step, termed fixation/co-extraction.

33
Table 2.5: Fixative ingredients for hippocampus cells
Chemical Stock concentration Final concentration
Gluteraldehyde 25% 0,2%
Triton100x 10% 0,1%
Taxol 10mM 10µM
PHEM 2X 1X
ddH2O - Up to final volume
• The fixation/extraction solution consisting chemicals listed above was
warmed in 37 0C water bath.
• Petri dishes containing the cultured cells were filled with 2 ml of
fixation/extraction solution.
• Cultures were incubated at room temperature for 15 minutes.
• Cultures were rinsed with PBS 3 times for 5 minutes and were kept at 4 0C
until the day of immunostaining.
In this study, cell fixation/co-extraction was done in day 2 and 4. At the end of the
day 4, fixation/co-extraction and Sodium Borohydrate treatment were done. This
treatment is necessary to block free aldehyde groups formed during the fixation
process, since they may decrease antigenic site accessibility.
• 10 mg/ ml Sodium Borohydrate solution was prepared in PBS.
• Cells were quenched three times for 10 minutes with Sodium Borohydrate
solution.
• Cells then were rinsed with PBS 3 times for 5 minutes.
Cells were blocked with goat-blocking solution at room temperature for 1 hour, this
is important to reduce unspecific bindings. To prepare blocking solution 10% GOAT
serum and 10 mg/ ml BSA were dissolved in PBS and filtered with 0.8 µm Nalgene
filter.
34
2.2.4.5. Immunostaining
Immunostaining is a biochemical technique that applies an antibody to a specific cell
protein, which can be used either to detect whether the protein exists in the sample,
or to highlight the location of the specific protein. Some immunostaining agents are
applied in a single stage - the antibody is directly conjugated to a colored agent.
Others are two-stage, first antibody does not have the chemical structure to support a
colored agent - in this case, after application of the first (colorless) antibody, a
second antibody linked to a colored agent is applied, and the second antibody binds
to the first. The colored agent can then be visualized under the microscope. Two –
stage method has also some advantages. Variety of coloring agents can be conjugated
to any given species of secondary antibody. This gives chance to visualize different
types of proteins at the same time.
The constructs used in this study had GFP protein linked to protein of interest. In
order to see whether we had expression of the interested protein, “rabbit anti-GFP
polyclonal primary antibody” was used. This antibody also amplified GFP signal in
the constructs. Secondary antibody was “goat anti rabbit - alexa 488 conjugate”
which is green colored. To be able to visualize the microtubule channel, Cy3
conjugated –monoclonal anti-β-tubulin clone 2.1 antibody (produced in mouse) was
used.
• Antibodies were diluted in PBS (dilution ratio for rabbit anti GFP polyclonal
antibody was 1:500).
• To remove any precipitates formed during storage, diluted antibodies were
centrifuged at 10.000 rpm for 10 minutes at 40C.
• 200 µl of 1o Ab solution was put in the hole containing fixed cells.
• 1o Ab containing cells were incubated at 40C for overnight. During this
staining period, the dishes were placed in a “humidified chamber,” a large
Petri dish containing moistened filter paper, which minimizes evaporation of
the antibody.
• 1o Ab was removed by vacuum carefully and dishes were washed by using
PBS 3 times for 5 minutes each.
• Cells were blocked again for 1 hour at room temperature with goat blocking
solution.
35
• 2o Ab was diluted and centrifuged in the same way as 1o Ab (dilution ratio
was 1:200 for goat anti rabbit -alexa 488 antibody and 1:400 for Cy3
conjugated -beta-Tb antibody).
• 200 µl of 2o Ab solution was put in the hole and cells were incubated for 1
hour in 37 0C incubator. Working in dark with 2o Ab is very important.
• Dishes were rinsed with PBS 3 times for 5 minutes each.
• 6-7 drops of mounting medium was added into the dishes.
• Cover slips were placed on the dishes and fixed from the edges by using nail
polisher.
• Dishes were visualized and analyzed by using fluorescent microscopy.
2.2.4.6. Imaging / Analyzing
Parameters of the software were kept constant during the imaging process. Images
were taken in two different channels.
In spastin / katanin over expression experiments,
• Cy5 (Rhodamine, red) channel was used for MT visualization,
• FITC (green) channel was used to visualize spastin / katanin / GFP
expression.
Images were acquired with 40X objective of AxioVert 200M microscope (Carl
Zeiss) and images were taken at identical setting of exposure time, brightness, and
contrast. After the imaging, cells were analyzed. In spastin / katanin over expression
experiments, process numbers, process lengths were determined.
2.2.5. RFL – 6 Cultures
2.2.5.1. Passage P0
• Stock tube that contains RFL-6 cells was taken out from the liquid nitrogen
tank.
• Tube was shaken very carefully in 37 0C water bath to melt the cells.
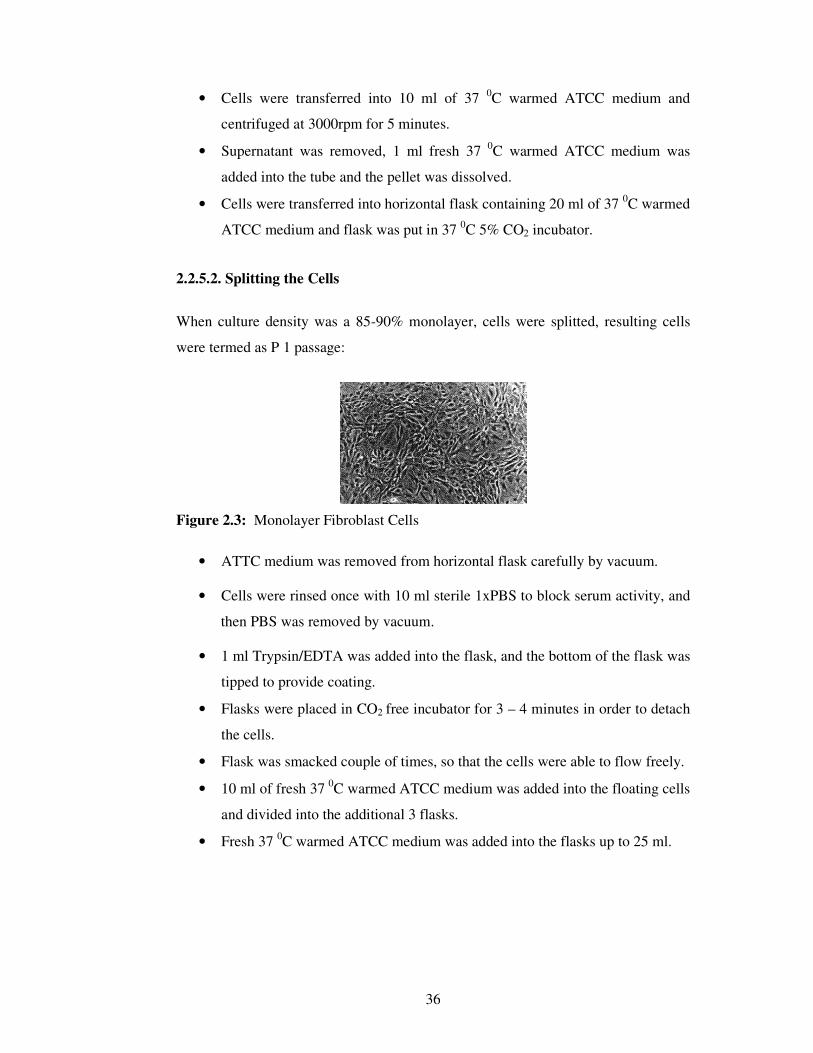
36
• Cells were transferred into 10 ml of 37 0C warmed ATCC medium and
centrifuged at 3000rpm for 5 minutes.
• Supernatant was removed, 1 ml fresh 37 0C warmed ATCC medium was
added into the tube and the pellet was dissolved.
• Cells were transferred into horizontal flask containing 20 ml of 37 0C warmed
ATCC medium and flask was put in 37 0C 5% CO2 incubator.
2.2.5.2. Splitting the Cells
When culture density was a 85-90% monolayer, cells were splitted, resulting cells
were termed as P 1 passage:
Figure 2.3: Monolayer Fibroblast Cells
• ATTC medium was removed from horizontal flask carefully by vacuum.
• Cells were rinsed once with 10 ml sterile 1xPBS to block serum activity, and
then PBS was removed by vacuum.
• 1 ml Trypsin/EDTA was added into the flask, and the bottom of the flask was
tipped to provide coating.
• Flasks were placed in CO2 free incubator for 3 – 4 minutes in order to detach
the cells.
• Flask was smacked couple of times, so that the cells were able to flow freely.
• 10 ml of fresh 37 0C warmed ATCC medium was added into the floating cells
and divided into the additional 3 flasks.
• Fresh 37 0C warmed ATCC medium was added into the flasks up to 25 ml.
37
2.2.5.3. Detaching the Cells:
• Cells in the flasks were rinsed once with 10 ml sterile 1xPBS to block serum
activity, and then PBS was removed by vacuum.
• 1 ml Trypsin/EDTA was added into the flask, and the bottom of the flask was
tipped to provide coating.
• Flasks were placed in CO2 free incubator for 3 – 4 minutes in order to detach
the cells.
• Flask was smacked couple of times, so that the cells were able to flow freely.
• 10 ml of fresh 37 0C warmed ATCC medium was added into each flask.
• All the cells were brought up together and 40 ml of cell suspension was
obtained.
2.2.5.4. Endofree Plasmid DNA Purification (maxi scale)
Plasmid maxi preparation was performed using Qiagen, Endofree Plasmid Maxi Kit
for large-scale (maxi) preparations, following instructions of the manufacturer. This
purification process is specifically important to remove endotoxins.
Endotoxins are cell membrane components of Gram-negative bacteria (e.g., E. coli).
Bacteria shed small amounts of endotoxins into their surroundings while they are
actively growing and large amounts when they die. During lysis of bacterial cells for
plasmid preparations, endotoxin molecules are released from the outer membrane
into the lysate. Endotoxins strongly influence transfection of DNA into primary cells
and sensitive cultured cells, and increased endotoxin levels lead to sharply reduced
transfection efficiencies. Furthermore, it is extremely important to use endotoxin-free
plasmid DNA for gene therapy applications, since endotoxins cause fever, endotoxic
shock syndrome, and activation of the complement cascade in animals and humans.
Protocol is as follows:
• A single bacterial colony was picked and inoculated into 5 ml selective LB
media containing Falcon tube, and grown for 8 hours with shaking (250 rpm)
at 37 ºC.
• Starter culture was diluted into 100 ml selective LB media containing flask
and grown for 16 hours with shaking (250 rpm) at 37 ºC.

38
• The following day, culture was distributed into 2 centrifuge tubes (50 ml each
tube), and the bacteria were harvested by centrifugation for 15 minutes at
6.000 x g at 4 ºC. The supernatants were discarded.
• The bacterial pellet was resuspended in 10 ml of suspension buffer, Buffer P1
in each centrifuge tube separately and then collected to one centrifuge tube.
Suspension buffer contains RNase which removes bacterial RNA.
• To lyse the cells, 10 ml lysis buffer, Buffer P2 was added (contains NaOH),
mixed by inverting the tube 6 times and incubated at room temperature for up
to 5 minutes.
• During the incubation, QIAfilter Cartridge was prepared and placed in a
convenient tube.
• Lysis was stopped by addition of 10 ml ice-cold binding buffer, Buffer P3.
Tube was again inverted 6 times and incubated on ice for up to 15 minutes.
• Lysate was poured in the barrel of the QIAfilter Cartridge and it was
incubated at room temperature for 10 minutes.
• Plunger was genteelly inserted into the QIAfilter Cartridge and lysate was
filtered into 50ml tube.
• 2.5 ml of Buffer ER was added into the filtered lysate and it was mixed by
inverting the tube 10 times.
• Tube containing lysate was incubated on ice for 30 minutes.
• Filter tube, Qiagen-tip 500 was equilibrated by adding 10 ml Buffer QBT.
Column was allowed to empty by gravity flow.
• When the Qiagen-tip 500 was drained completely, filtered lysate was applied
to Qiagen-tip 500 and allowed to enter the resin by gravity flow. Plasmid
DNA is bound to the glass fibers pre-packed in the filter tube. Flow-through
was discarded from the collection tube.
• Qiagen-tip 500 was washed 2 times with 30 ml washing buffer, Buffer QC.
Buffer QC was allowed to move through the Qiagen-tip 500 by gravity flow.
The first wash is sufficient to remove all contaminants in the majority of
plasmid DNA preparations. The second wash is especially necessary when
large culture volumes or bacterial strains producing large amounts of
carbohydrates are used.
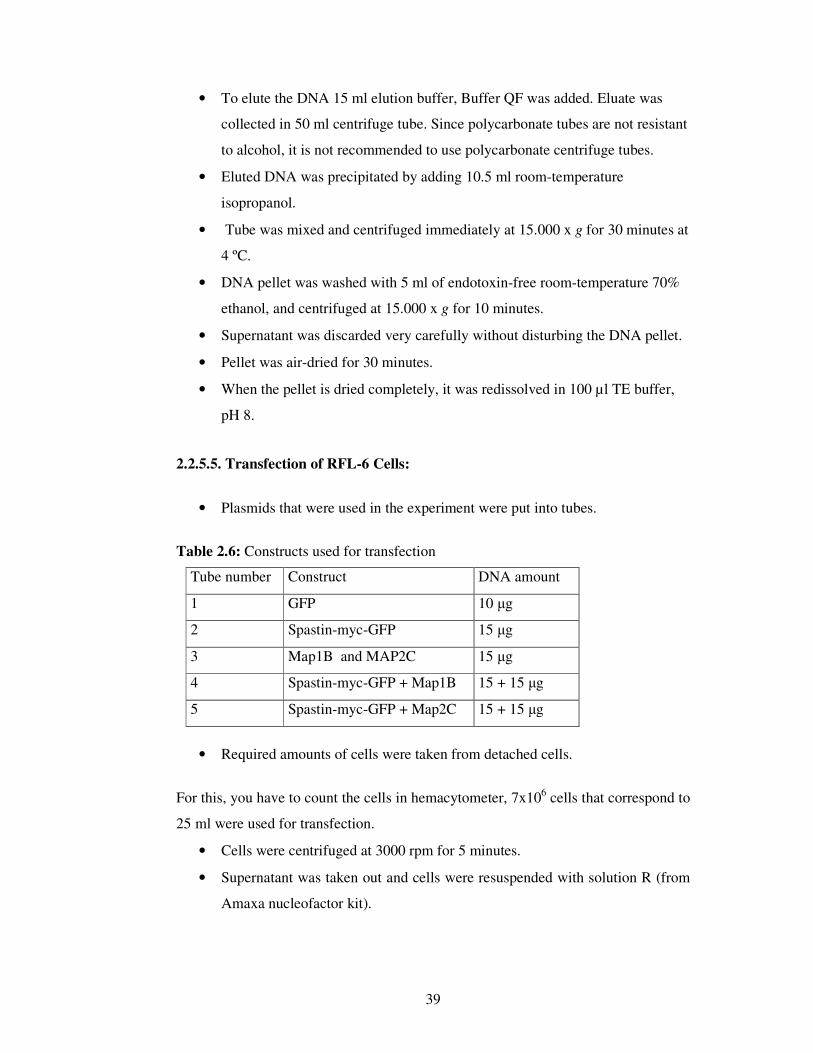
39
• To elute the DNA 15 ml elution buffer, Buffer QF was added. Eluate was
collected in 50 ml centrifuge tube. Since polycarbonate tubes are not resistant
to alcohol, it is not recommended to use polycarbonate centrifuge tubes.
• Eluted DNA was precipitated by adding 10.5 ml room-temperature
isopropanol.
• Tube was mixed and centrifuged immediately at 15.000 x g for 30 minutes at
4 ºC.
• DNA pellet was washed with 5 ml of endotoxin-free room-temperature 70%
ethanol, and centrifuged at 15.000 x g for 10 minutes.
• Supernatant was discarded very carefully without disturbing the DNA pellet.
• Pellet was air-dried for 30 minutes.
• When the pellet is dried completely, it was redissolved in 100 µl TE buffer,
pH 8.
2.2.5.5. Transfection of RFL-6 Cells:
• Plasmids that were used in the experiment were put into tubes.
Table 2.6: Constructs used for transfection
Tube number Construct DNA amount
1 GFP 10 µg
2 Spastin-myc-GFP 15 µg
3 Map1B and MAP2C 15 µg
4 Spastin-myc-GFP + Map1B 15 + 15 µg
5 Spastin-myc-GFP + Map2C 15 + 15 µg
• Required amounts of cells were taken from detached cells.
For this, you have to count the cells in hemacytometer, 7x10⁶ cells that correspond to
25 ml were used for transfection.
• Cells were centrifuged at 3000 rpm for 5 minutes.
• Supernatant was taken out and cells were resuspended with solution R (from
Amaxa nucleofactor kit).
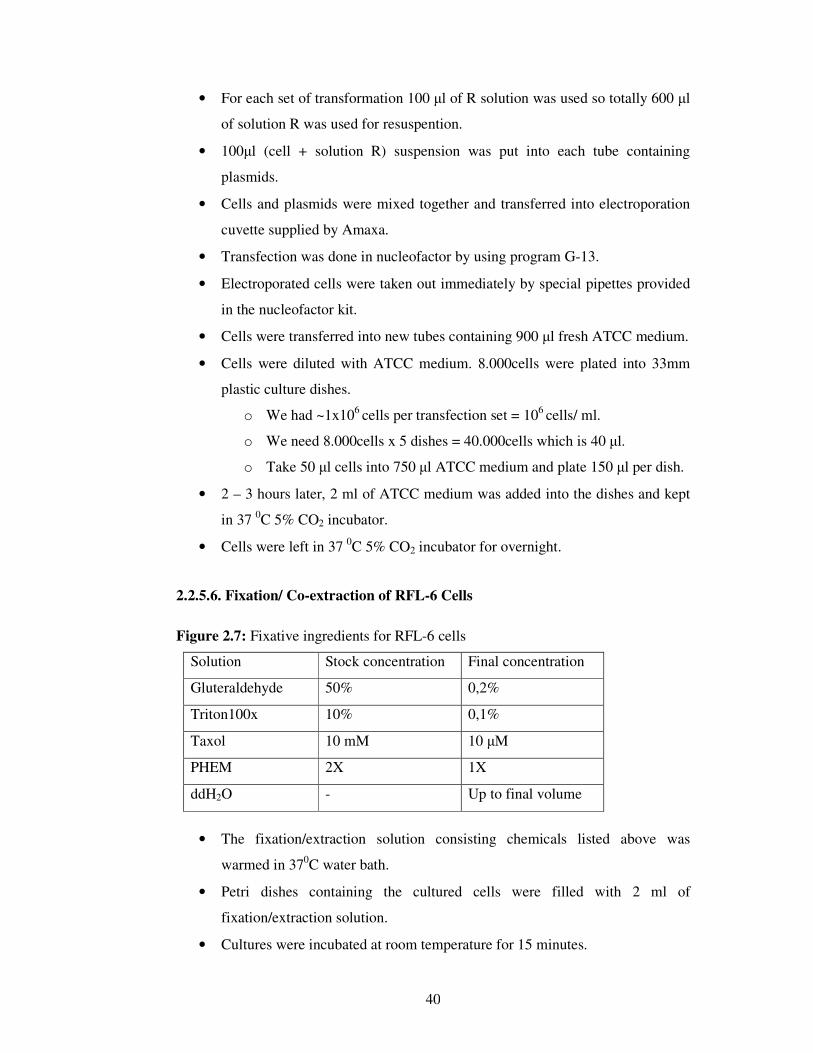
40
• For each set of transformation 100 µl of R solution was used so totally 600 µl
of solution R was used for resuspention.
• 100µl (cell + solution R) suspension was put into each tube containing
plasmids.
• Cells and plasmids were mixed together and transferred into electroporation
cuvette supplied by Amaxa.
• Transfection was done in nucleofactor by using program G-13.
• Electroporated cells were taken out immediately by special pipettes provided
in the nucleofactor kit.
• Cells were transferred into new tubes containing 900 µl fresh ATCC medium.
• Cells were diluted with ATCC medium. 8.000cells were plated into 33mm
plastic culture dishes.
o We had ~1x10⁶ cells per transfection set = 106 cells/ ml.
o We need 8.000cells x 5 dishes = 40.000cells which is 40 µl.
o Take 50 µl cells into 750 µl ATCC medium and plate 150 µl per dish.
• 2 – 3 hours later, 2 ml of ATCC medium was added into the dishes and kept
in 37 0C 5% CO2 incubator.
• Cells were left in 37 0C 5% CO2 incubator for overnight.
2.2.5.6. Fixation/ Co-extraction of RFL-6 Cells
Figure 2.7: Fixative ingredients for RFL-6 cells
Solution Stock concentration Final concentration
Gluteraldehyde 50% 0,2%
Triton100x 10% 0,1%
Taxol 10 mM 10 µM
PHEM 2X 1X
ddH2O - Up to final volume
• The fixation/extraction solution consisting chemicals listed above was
warmed in 370C water bath.
• Petri dishes containing the cultured cells were filled with 2 ml of
fixation/extraction solution.
• Cultures were incubated at room temperature for 15 minutes.

41
• 2 mg/ ml Sodium Borohydrate solution was prepared in PBS.
• Cells were quenched two times for 15 minutes with Sodium Borohydrate
solution.
• Cells then were rinsed with PBS 3 times for 5 minutes.
• Dishes were kept in 4 0C until the day of immunostaining.
2.2.5.7. Immunostaining
• Fixed cells were blocked with blocking solution for 1 hour at room
temperature. Blocking solution was different for each set of experiment.
• Blocking solution was removed with vacuum carefully.
• Antibodies were diluted in PBS.
Table 2.8: Dilution ratio for primary antibodies
Goat Map1B 1:200
Mouse beta Tb 1:200
Rabbit GFP polyclonal 1:500
Mouse Map2c 1:200
• To remove any precipitates formed during storage, diluted antibodies were
centrifuged at 10.000rpm for 10 minutes in 40C.
• 200 µl of 1o Ab solution was put in the hole containing fixed cells.
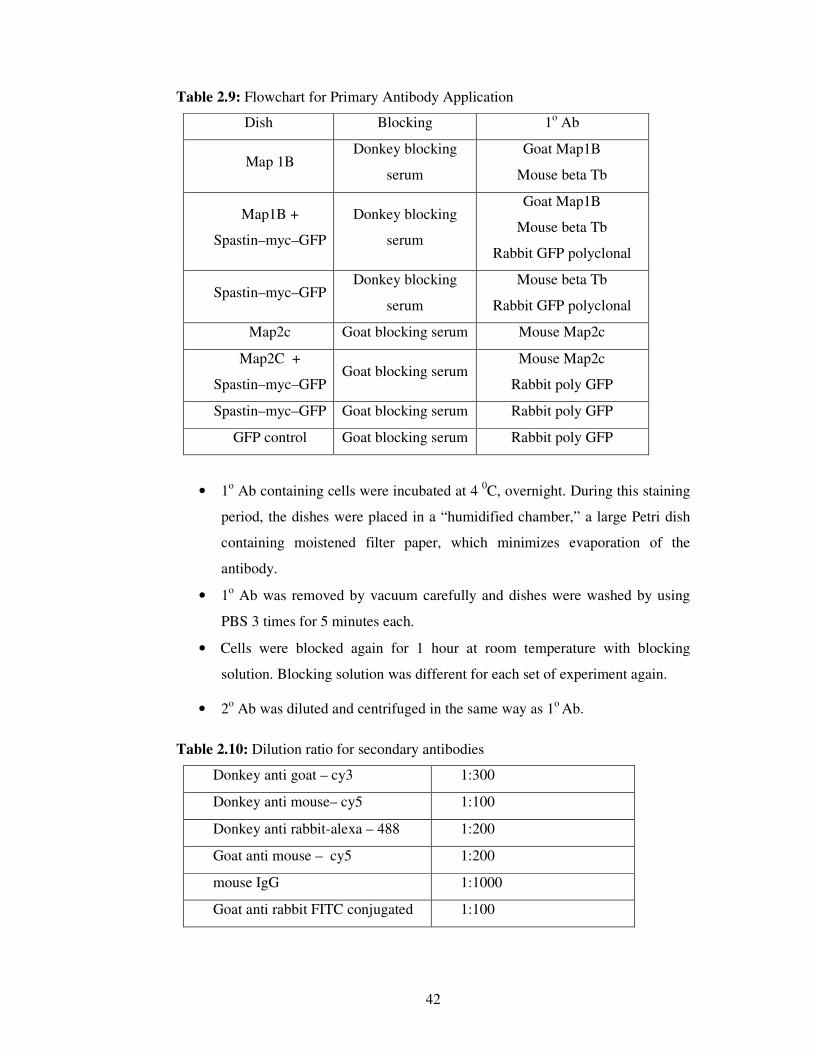
42
Table 2.9: Flowchart for Primary Antibody Application
Dish Blocking 1o Ab
Map 1B Donkey blocking
serum
Goat Map1B
Mouse beta Tb
Map1B +
Spastin–myc–GFP
Donkey blocking
serum
Goat Map1B
Mouse beta Tb
Rabbit GFP polyclonal
Spastin–myc–GFP Donkey blocking
serum
Mouse beta Tb
Rabbit GFP polyclonal
Map2c Goat blocking serum Mouse Map2c
Map2C +
Spastin–myc–GFP Goat blocking serum
Mouse Map2c
Rabbit poly GFP
Spastin–myc–GFP Goat blocking serum Rabbit poly GFP
GFP control Goat blocking serum Rabbit poly GFP
• 1o Ab containing cells were incubated at 4 0C, overnight. During this staining
period, the dishes were placed in a “humidified chamber,” a large Petri dish
containing moistened filter paper, which minimizes evaporation of the
antibody.
• 1o Ab was removed by vacuum carefully and dishes were washed by using
PBS 3 times for 5 minutes each.
• Cells were blocked again for 1 hour at room temperature with blocking
solution. Blocking solution was different for each set of experiment again.
• 2o Ab was diluted and centrifuged in the same way as 1o Ab.
Table 2.10: Dilution ratio for secondary antibodies
Donkey anti goat – cy3 1:300
Donkey anti mouse– cy5 1:100
Donkey anti rabbit-alexa – 488 1:200
Goat anti mouse – cy5 1:200
mouse IgG 1:1000
Goat anti rabbit FITC conjugated 1:100

43
Secondary antibody application was done in different way for the different sets of
experiment.
• 200 µl of secondary antibody solution was applied to the Map1b dishes.
• Cells were incubated for 1hour in 37 0C incubator.
Table 2.11: Flowchart for Secondary Antibody Application for MAP1b Part
Dishes Blocking 2o Ab
Map 1B Donkey blocking
serum
Donkey anti goat-cy3
Donkey anti mouse-cy5
Map1B +
Spastin–myc–GFP
Donkey blocking
serum
Donkey ant goat-cy3
Donkey anti mouse-cy5
Donkey anti rabbit-alexa 488
Spastin–myc–GFP Donkey blocking
serum
Donkey anti mouse-cy5
Donkey anti rabbit-alexa 488
Table 2.12: Flowchart for Secondary Antibody Application for MAP2c Part
Dishes Blocking 2o Ab
Map2c Goat blocking
serum
Goat anti mouse cy5 ► 1h at 370C
▼
mouse IgG blocking ► 1h at RT
▼
Cy3-beta-Tb
Map2C +
Spastin–myc–GFP
Goat blocking
serum
Goat anti rabbit FITC conjugated
Goat anti mouse cy5 ► 1h at 370C
▼
mouse IgG blocking ► 1h at RT
▼
Cy3-beta-Tb
Spastin–myc–GFP Goat blocking
serum
Goat anti rabbit FITC conjugated
Cy3-beta-Tb
GFP control Goat blocking
serum
Goat anti rabbit FITC conjugated
Cy3-beta-Tb

44
• 200 µl of secondary antibody solution, except Cy3 – conjugated – beta –
tubulin, were applied to the cells in the dishes.
• Dishes were incubated for 1hour in 37 0C incubator. Working in dark with 2o
Ab is very important.
• 2o Ab was removed by vacuum carefully and dishes were washed with PBS 3
times for 5 minutes each.
• 200 µl of mouse IgG was added into the dishes to block non-specific
bindings. Cells were blocked for 1hour at room temperature.
• Blocking solution was removed with vacuum device and 200 µl of Cy3 –
conjugated – beta – tubulin antibody solution was applied to the cells.
• Cells were incubated for 1hour in 37 0C incubator
• All the dishes were rinsed with PBS 3 times for 5 minutes each.
• 6-7 drops of mounting medium was added into the dishes.
• Cover slips were placed on the dishes and fixed from the edges by using nail
polisher.
• Dishes were visualizes and analyzed by using fluorescent microscopy.
2.2.5.8. Imaging / Analyzing
Parameters of the software were kept constant during the imaging process. Images
were taken in two or three different channels according to the constructs expressed in
the cells.
In Map1b experiments,
• Cy5 (Rhodamine, red) channel was used for MT visualization,
• Cy3 (purple) channel was used to visualize Map1b expression,
• FITC (green) channel was used to visualize spastin / GFP expression.
In Map2c experiments,
• Cy5 (Rhodamine, red) channel was used for MT visualization,
• Cy3 (purple) channel was used to visualize Map2c expression,

45
• FITC (green) channel was used to visualize spastin / GFP expression.
Images were taken by using 40X objective of the microscope. After the imaging,
next step was to analyze the cells. The analyses were done by using software of the
microscope. In Map experiments, MT fluorescence intensity of the cells was
determined.

46
3. RESULTS
There are two sets of studies presented here, one on primary cultured neurons and the
other on RFL6 fibroblasts. The studies on cultured neurons, in this case hippocampal
neurons, seek to test whether overexpressed spastin causes dramatic increase in the
numbers of processes, specifically in the number of dendrite formations. In the
second set of studies, MAP experiments on RFL6 fibroblast were performed to
investigate whether individual neuronal MAPs have the ability to protect
microtubules from being severed by overexpressed spastin. Both primary neurons
and RFL6 cells were from rat. We chose RFL6 cells for these studies because they
are very flat, and hence excellent for imaging microtubules using
immunofluorescence, and because they do not express MAP2c, MAP1b proteins
endogenously.
3.1. Spastin Overexpression in Hippocampus Cells
In the first set of studies we sought to overexpress spastin (pcDNA3-spastin-myc-
GFP; human spastin; Errico et al., 2002) and GFP (pEGFP-C1; BD Bioscience), as
control constructs, in cultured hippocampal cells to ascertain how sensitive the
neuron is to alterations in expressed protein levels. Based on the great homology
with spastin, p60–katanin (pEGFP-C1-p60; rat p60–katanin; Karabay et al., 2004)
overexpression was also performed as a control.
To investigate whether expressed constructs were showing the expected effects on
neurons, we had to wait for a period of time in which the adequate expression levels
were obtained. The most applicable time points were day 4 and day 6 where dramatic
changes occurred in the morphology of the cells. Further investigations were
performed with the hippocampal cells fixed on the day 4 and day 6.
Figure 3.1 shows images of overexpressed GFP, p60 – katanin and spastin proteins
that were immunostained with polyclonal antibodies against the fusion protein, GFP.
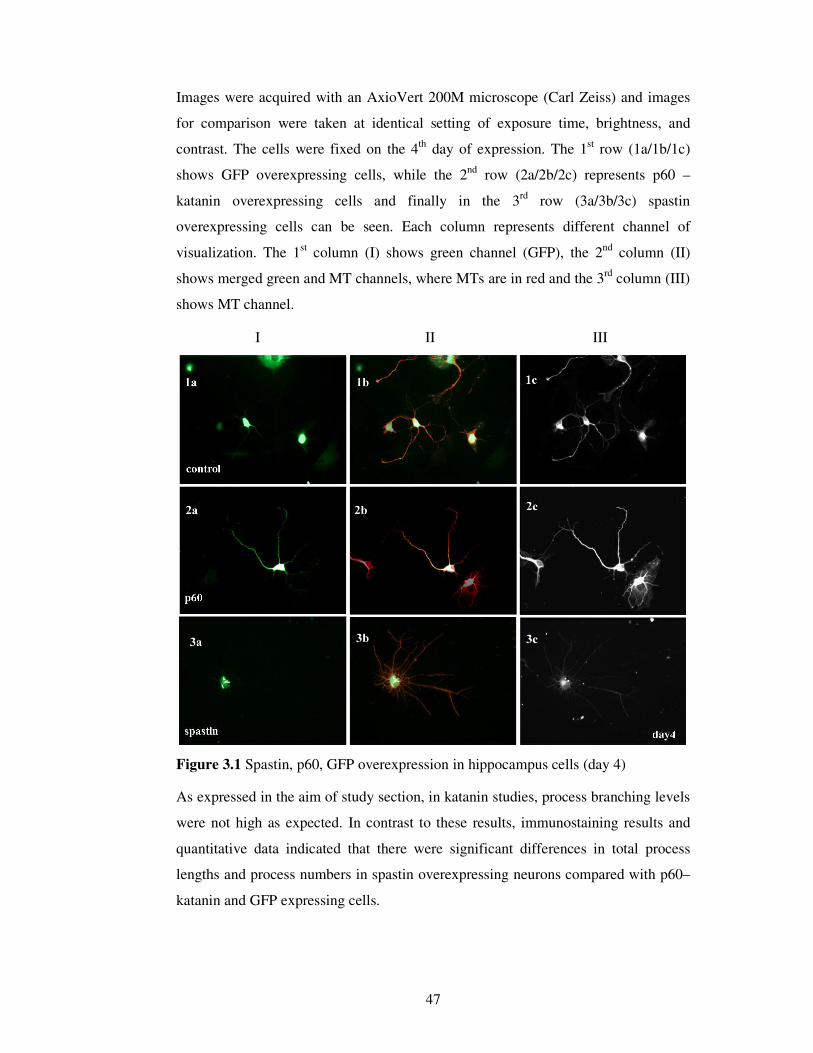
47
Images were acquired with an AxioVert 200M microscope (Carl Zeiss) and images
for comparison were taken at identical setting of exposure time, brightness, and
contrast. The cells were fixed on the 4th day of expression. The 1st row (1a/1b/1c)
shows GFP overexpressing cells, while the 2nd row (2a/2b/2c) represents p60 –
katanin overexpressing cells and finally in the 3rd row (3a/3b/3c) spastin
overexpressing cells can be seen. Each column represents different channel of
visualization. The 1st column (I) shows green channel (GFP), the 2nd column (II)
shows merged green and MT channels, where MTs are in red and the 3rd column (III)
shows MT channel.
I II III
Figure 3.1 Spastin, p60, GFP overexpression in hippocampus cells (day 4)
As expressed in the aim of study section, in katanin studies, process branching levels
were not high as expected. In contrast to these results, immunostaining results and
quantitative data indicated that there were significant differences in total process
lengths and process numbers in spastin overexpressing neurons compared with p60–
katanin and GFP expressing cells.

48
As illustrated in figure 3.2 and 3.4, the degree of increase was ~60% in process
numbers and ~50% in total process lengths (Student’s t- Test, p<0.01). There were
no significant differences statistically between GFP expressing control cells and
p60–katanin expressing cells in terms of total process lengths and process numbers
(Student’s t- Test, p>0.05).
The slight distribution of spastin was observed through the dendrites especially in the
day 6 fixed cells. Furthermore, spastin localization was substantially obtained as
clusters around the cell body.
Figure 3.2: Total process length per cell
By day 6, minor processes and axons became much more developed. Thus, the
process formations increased in all cell types.
Figure 3.3 shows images of overexpressed GFP, p60 – katanin and spastin proteins
that were immunostained with polyclonal antibodies against the fusion protein, GFP
on the 6th day of expression. Images were acquired with an AxioVert 200M
microscope (Carl Zeiss) and images were taken at identical setting of exposure time,
brightness, and contrast. The 1st row (1a/1b/1c) shows GFP overexpressing control
cells, the 2nd row (2a/2b/2c) represents p60 – katanin overexpressing cells and finally
the 3rd row (3a/3b/3c) shows spastin overexpressing cells. Each column represents
different channel of visualization. The 1st column (I) shows green channel (GFP), the
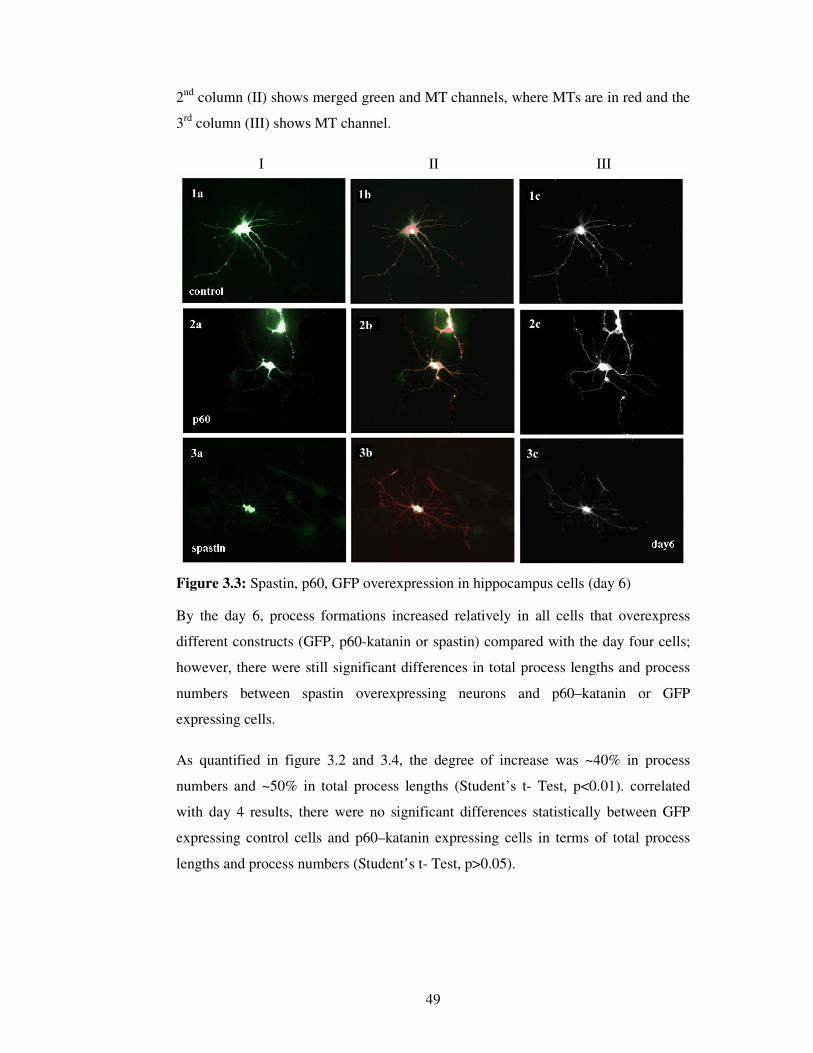
49
2nd column (II) shows merged green and MT channels, where MTs are in red and the
3rd column (III) shows MT channel.
I II III
Figure 3.3: Spastin, p60, GFP overexpression in hippocampus cells (day 6)
By the day 6, process formations increased relatively in all cells that overexpress
different constructs (GFP, p60-katanin or spastin) compared with the day four cells;
however, there were still significant differences in total process lengths and process
numbers between spastin overexpressing neurons and p60–katanin or GFP
expressing cells.
As quantified in figure 3.2 and 3.4, the degree of increase was ~40% in process
numbers and ~50% in total process lengths (Student’s t- Test, p<0.01). correlated
with day 4 results, there were no significant differences statistically between GFP
expressing control cells and p60–katanin expressing cells in terms of total process
lengths and process numbers (Student’s t- Test, p>0.05).

50
Spastin expression was substantially obtained as aggregates around the cell body as it
was reported in the previous part of the study. However, despite having great
homology with spastin, the distribution of katanin was indicated to be rich in axons
and dendrites.
If we compare the total process lengths and process numbers of the cells, regardless
of overexpressed protein type, gradual increase can be observed in the number of
process formations. Quantification results confirmed that the observations on the
total length of the processes per cell were also correlating with results obtained in the
process numbers analysis.
Figure 3.4: Average process numbers of cells
3.2. Regulation of Spastin, MT Severing Protein, by Microtubule Associated
Proteins
In this part, studies sought to test whether MAPs have any role on microtubules to
protect them from being severed by microtubule severing protein, spastin. To test the
capacity of MAPs to protect the microtubules against severing, MAP1b and MAP2c
were overexpressed. The DNA constructs used for these studies were: pEGFP-C1
(Clontech, #6084-1, as a control), pcDNA3 –spastin –myc –GFP (Errico, et al, 2002),
pMAP1b (mouse Map1b, Weeks and Fischer, 2000) and pMAP2c (human MAP2c,
Gamblin, et al, 1996).
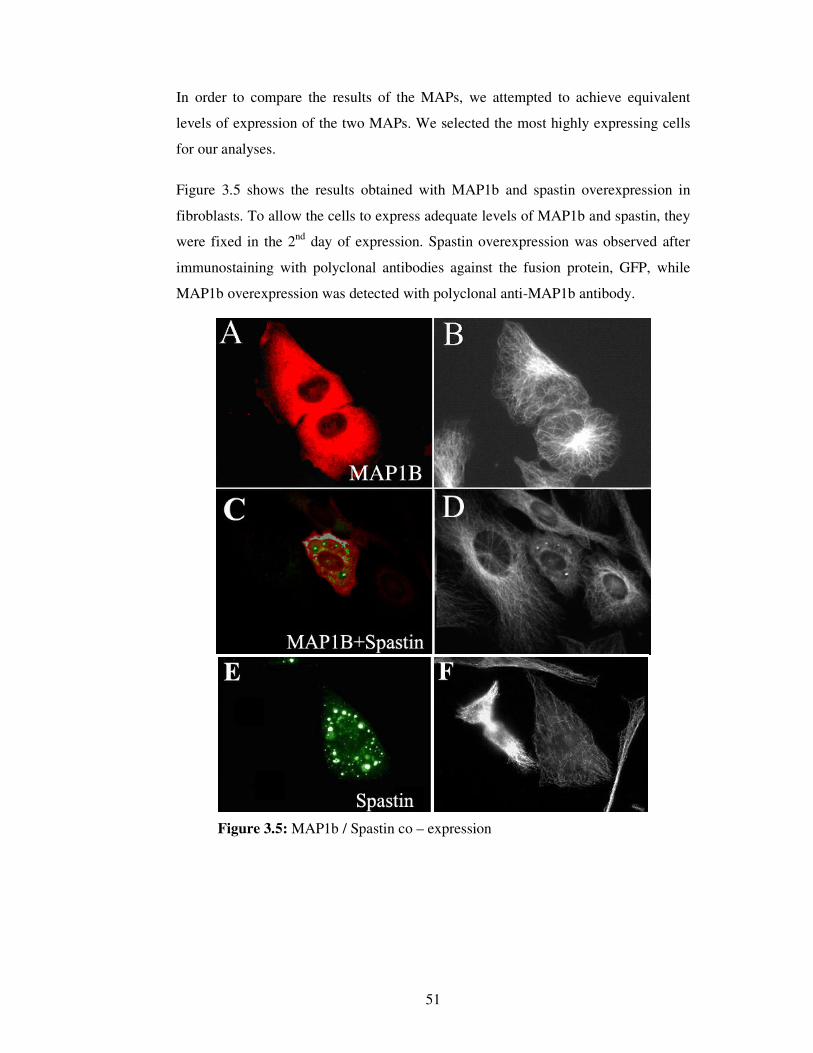
51
In order to compare the results of the MAPs, we attempted to achieve equivalent
levels of expression of the two MAPs. We selected the most highly expressing cells
for our analyses.
Figure 3.5 shows the results obtained with MAP1b and spastin overexpression in
fibroblasts. To allow the cells to express adequate levels of MAP1b and spastin, they
were fixed in the 2nd day of expression. Spastin overexpression was observed after
immunostaining with polyclonal antibodies against the fusion protein, GFP, while
MAP1b overexpression was detected with polyclonal anti-MAP1b antibody.
Figure 3.5: MAP1b / Spastin co – expression
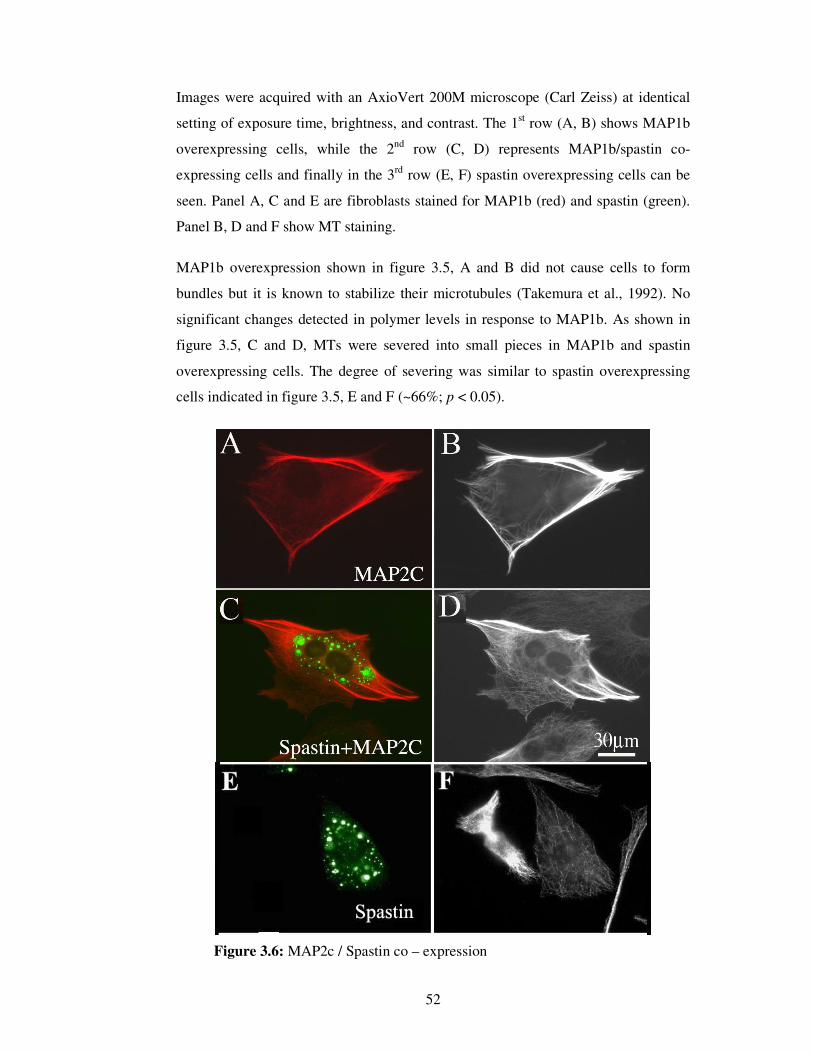
52
Images were acquired with an AxioVert 200M microscope (Carl Zeiss) at identical
setting of exposure time, brightness, and contrast. The 1st row (A, B) shows MAP1b
overexpressing cells, while the 2nd row (C, D) represents MAP1b/spastin co-
expressing cells and finally in the 3rd row (E, F) spastin overexpressing cells can be
seen. Panel A, C and E are fibroblasts stained for MAP1b (red) and spastin (green).
Panel B, D and F show MT staining.
MAP1b overexpression shown in figure 3.5, A and B did not cause cells to form
bundles but it is known to stabilize their microtubules (Takemura et al., 1992). No
significant changes detected in polymer levels in response to MAP1b. As shown in
figure 3.5, C and D, MTs were severed into small pieces in MAP1b and spastin
overexpressing cells. The degree of severing was similar to spastin overexpressing
cells indicated in figure 3.5, E and F (~66%; p < 0.05).
Figure 3.6: MAP2c / Spastin co – expression

53
Figure 3.6 shows the images of overexpressed MAP2c and spastin. As in the MAP1b
set, MAP2c expressing cells were fixed in the 2nd day of expression. This short
period of time allow cells to express MAP2c ectopically. Cells were immunostained
with polyclonal primary antibodies, mouse anti-MAP2 against MAP2c and rabbit
anti-GFP against the fusion protein GFP in spastin construct.
Images were acquired with an AxioVert 200M microscope (Carl Zeiss) at identical
setting of exposure time, brightness, and contrast. The 1st row (A, B) shows MAP2c
overexpressing cells, while the 2nd row (C, D) represents MAP2c/spastin co-
expressing cells and finally in the 3rd row (E, F) spastin overexpressing cells can be
seen. In panel A, C and E, fibroblasts stained for MAP2c (red) and spastin (green)
are shown. Panel B, D and F show MT staining.
Figure 3.6, A and B show noticeable bundling of microtubules by MAP2c, although
there were also numerous unbundled microtubules as well. Polymer levels increased
in the presence of MAP2c. Unlike in the case with MAP1b, co-expression of spastin
and MAP2c did not alter the length of microtubules, their bundling, or the levels of
polymer in any detectable way (figure 3.6, C and D). Similar to the observations in
bundled microtubules, unbundled microtubules remained long. This result indicated
that it was not the bundling itself that prevented severing. There was no significant
lose of microtubule mass from either group (p > 0.05).
Figure 3.7 shows quantitative analysis of microtubule mass in fibroblasts induced to
overexpress spastin together with MAP1b and MAP2c constructs. Digital grey values
of image pixels representing arbitrary fluorescence units (AFUs) were obtained. The
abbreviations in the figure are: GFP, GFP alone as control; spastin, human spastin
alone; MAP2c, MAP2c alone; MAP2c plus spastin, the cells expressing MAP2c and
spastin; MAP1b, MAP1b alone and MAP1b plus spastin, the cells expressing
MAP1b and spastin. Y axis shows change in MT fluorescence intensity which is
related to the microtubule mass and X axis represents different types of expressed
constructs. The quantification results indicated that microtubule polymerization
increased in MAP2c expressing cells; as expected, in spastin expressing cells
microtubule density was decreased. However, spastin failed to show its severing
activity in MAP2c/spastin co-expressing cells.

54
Although MAP1b is also stabilization protein, results with MAP1b did not correlate
with the MAP2c results. Microtubule mass of MAP1b expressing cells was very
similar to control cells. There was no microtubule protection observed against
severing by spastin in MAP1b cells. Hence, in MAP1b/ spastin co-expressing cells
there was dramatic diminution in microtubule mass suggesting that spastin
performed its severing activity despite the presence of MAP1b.
Figure 3.7: MT Mass Change Depending on the Expressed Protein

55
4. DISCUSSION
In neurons microtubules are nucleated at the centrosome. However, to be transported
from centrosomes down into the axons, microtubules must be severed into short
pieces (Ahmad et al., 1994). Specifically, during the formation of collateral axonal
brunches, microtubule numbers need to be increased at distal sites of the centrosomes.
Hence, it was speculated that long microtubules in the axons might be severed into
multiple shorter microtubules at strategic locations such as brunch points (Joshi and
Baas, 1993). Since these early studies, the breakage of microtubules at axonal brunch
points was visualized by different groups (Dent et al., 1999). Conclusion from all
these observations was that microtubule severing is an important phenomenon for
regulating microtubule length and number throughout the neuron, as well as for
releasing microtubules from centrosome (Dent et al., 1999).
Since most of the studies were performed with p60-katanin, it may be speculated that
recently identified severing protein, spastin, based on the great sequence homology
with p60–katanin, has same function in the cell as p60-katanin.
Spastin mutation was shown to degenerate corticospinal axons in the neuron.
Mutation in spastin might cause degeneration of longer axons by diminishing the
supply of short microtubules required for process generations or by the mutant
spastin molecules accumulating on the microtubules and impeding their ability to
participate in the transport of vesicular cargo (McDermott et al., 2003). This is
indicated by the fact that functional spastin does not appear to accumulate on the
microtubules, but the mutant spastin does.
There are discrepancies on sub-cellular localization of spastin. Besides the studies
reporting cytoplasmic targeting of spastin, studies indicating detection of nuclear
localization of spastin are also available (Errico, et al., 2002, 2004; Charvin et al.,
2003). Although its function is currently unknown, recently identified spastin variant,
short N-terminal truncated isoforms, was shown to have nuclear localization
(Claudiani, et al., 2005). In this study, results on hippocampal cells indicated that
56
spastin overexpression was localized in the cell body of the neuron. There was nearly
no spastin observed in the processes of the day 4 fixed cells, however, spastin
expression was slightly observed in the processes of day 6 fixed cells. Consistent
with these results, independent studies have also found spastin in the cytoplasm and
synaptic terminals of pyramidal cells of the cerebral cortex and hippocampus, in
Purkinje cells, and in spinal motor neurons (Wharton, et al., 2003). Whereas, our
results on another microtubule severing protein, p60-katanin, indicated expression of
the protein in the cell body and processes as well. Previous studies also reported p60-
katanin to be rich in distal regions of the axon (Karabay et al., 2004). Comparing
spastin overexpressing day 4 and day 6 hippocampal cells, there are no distinctive
diversities in the expression levels. We can speculate that spastin expression
increases during process development stage of the neuron and remain constant after
reaching to particular levels in the cell.
Another goal of this study was to ascertain whether spastin increases process
branching and if so how the increased levels change comparing with p60-katanin.
We found that spastin increased the number of process formation relatively more
than p60-katanin. Although the images of results can easily be examined with visual
observation, quantification results also confirmed ~50% increase in average process
numbers in spastin overexpressing cells compared with control cells and p60-katanin
overexpressing cells. Although p60-katanin is also a microtubule severing protein, its
overexpression did not yield an increase in the branch formation. There is no
clarification indicated for the results on p60-katanin, but one speculation may be
different regulation mechanisms of proteins. In neurons, p60-katanin may require
sufficient amounts of related proteins such as nerve growth factor, NGF, to be able o
show its severing activity in vitro or increase in the p60-katanin level may be
buffered by certain MAPs. Although there is no observation that p60-katanin co-
localizes with another protein, there might be such a protein that acts synergistically
with p60-katanin and regulate its activity in neurons.
On the other hand, spastin has microtubule interacting and transmembrane domain
both of which lead to the prediction that spastin has a role in membrane trafficking as
well. Recent studies have also shown spastin interaction with various proteins that
act as spastin binding partners and direct spastin to several membrane sites (Reid et
57
al., 2005). Although exact localization regions have not been identified yet, it was
indicated that spastin co-localizes with atlastin, a protein whose mutation also leads
to hereditary spastic paraplegia and with endosomal protein CHMP1B (Reid et al.,
2005).
With all of this in mind, it can be concluded that spastin may play a role in local
regulation of microtubules, perhaps coupled to the movement of membrane-bound
organelles (especially in axons) and/or the remodeling of organelle architecture or
even may have a separate role unrelated its microtubule severing function.
Both spastin and p60-katanin are virtually present in the neuron and to be able to
prevent microtubules from breaking down into smaller pieces everywhere at all times,
severing must be strategically regulated by the cell. It was already mentioned that
severing of microtubules increases during mitosis; hence the regulation was thought
to be phosphorylation related. There was no evidence from other cell types that p60-
katanin itself was phosphorylated (McNally, et al., 2002). This leads to the
probability that p60-katanin, so does spastin, might be regulated by the
phosphorylation of other proteins. In our case, these proteins were MAPs.
In our study we specifically concentrated on MAP1b and MAP2c. RFL-6 fibroblast
cells were chosen in this study because they are very flat and hence excellent for
imaging immunostained microtubules and the most importantly MAP4 is the only
traditional fibrous MAP endogenously expressed in fibroblasts.
We sought to test whether these MAPs protect microtubules from being severed by
spastin. It was indicated that MAP2c provides strong protection of the microtubules
against severing by overexpressed spastin. Similar results were shown in the studies
done with p60-katanin. Furthermore, the four-repeat form of tau was shown to
protect better and have stronger binding affinities to the microtubules than three-
repeat form of tau (Qiang et al., 2006). Since MAP2c and tau share similar
microtubule binding domains, the level of protection is thought to be related to
binding affinity of the MAP to the microtubule.
58
We think that regulation of microtubule severing by MAPs is based on physically
restricted access of the severing protein, in this case spastin, to the microtubule
lattice rather than interacting directly with severing protein itself. According to our
thought, projection domains in MAP2c and tau provide additional steric hindrance of
the access of spastin to the microtubule.
In contrast with MAP2c results, it was shown that MAP1b is not capable of
protecting cells against severing by spastin. The difference in protection level of
MAP2c and MAP1b is probably based on their different microtubule interacting
domains. MAP1b has only one microtubule binding domain whereas MAP2c has
three microtubule binding domains plus projection arm as an additional hindrance
factor.
In previous studies of our group on katanin, it was tested whether taxol stabilization
alters severing response of p60-katanin overexpression. Results indicated that in the
presence of taxol, katanin caused microtubules to be broken down into short pieces
(Qiang, et. al, 2006). Hence, it can be speculated that protection of microtubules
against spastin is MAP2c related rather than stabilization or bundling. Since neuron
express excess amounts of MAP2 isoforms in the axon, it can be concluded that
MAP2c protects microtubules against severing by spastin in axons.
Baas et al., (2005) proposed a model for katanin-MAPs interaction, which we think
is the same for spastin. According to the model in figure 4.1, the microtubule is
decorated by MAPs such as tau. The MAPs reduce the possibility of both motor
(kinesin)-microtubule and katanin-microtubule interaction. Hence, katanin subunits
can not form hexamer around the microtubule to break it and motor cannot move
along the microtubule. This would lead long microtubules but insufficient cargo
transport.
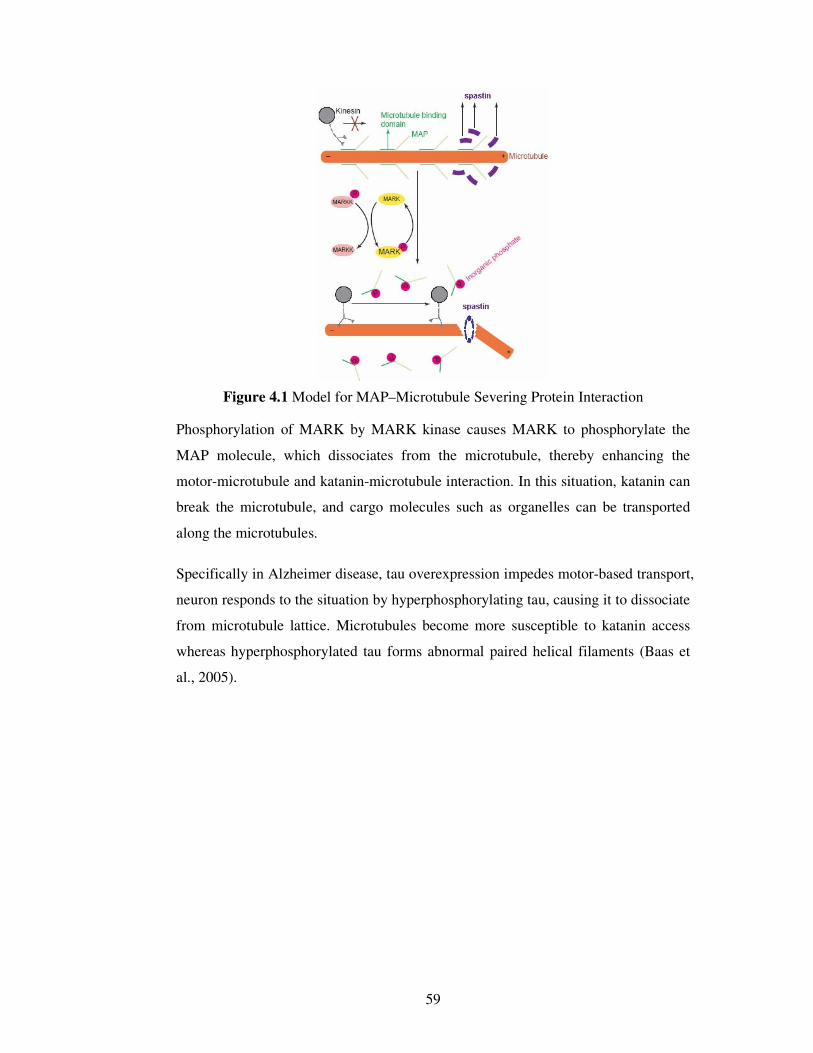
59
Figure 4.1 Model for MAP–Microtubule Severing Protein Interaction
Phosphorylation of MARK by MARK kinase causes MARK to phosphorylate the
MAP molecule, which dissociates from the microtubule, thereby enhancing the
motor-microtubule and katanin-microtubule interaction. In this situation, katanin can
break the microtubule, and cargo molecules such as organelles can be transported
along the microtubules.
Specifically in Alzheimer disease, tau overexpression impedes motor-based transport,
neuron responds to the situation by hyperphosphorylating tau, causing it to dissociate
from microtubule lattice. Microtubules become more susceptible to katanin access
whereas hyperphosphorylated tau forms abnormal paired helical filaments (Baas et
al., 2005).
60
5. CONCLUSION
Microtubules undergo between growth and shrinkage phases continuously. This
process is called dynamic instability. This dynamic behavior of microtubules is
essential in eukaryotic cells for fundamental processes such as cell division, cell
differentiation, and nerve growth. However, the dynamic instability is not enough to
explain all microtubule reorganization in the cell, specifically as in the case of
process formation in the neurons.
Since microtubule reorganization is thought to be based on microtubule severing via
spastin and katanin, in this study we have concentrated on spastin and its possible
MAP based regulation mechanism.
Spastin overexpression was performed in hippocampus cells, and to investigate
spastin’s regulation mechanism, MAP/spastin co-expression studies were performed.
Increased branch formation was observed in spastin over-expressing cells, as a result
of severing activity of spastin. In MAP based experiments, it was observed that
MAP2c protects microtubules from being severed against spastin.
Neurons are terminally differentiated cells, hence degeneration of these cells lead
irreversible paralysis of body parts. Regeneration of neurons may be possible with
newly branching axons and dendrites. In order to better understand neuro-
degenerative disorders like Alzheimer’s, it is very important to understand
microtubule reorganization mechanism in nerve cells. Since reorganization is thought
to be a result of microtubule severing via spastin and katanin, it is important to
further analyze both function and regulation of these proteins.

61
REFERENCES
Ahmad, F.J., Yu, W., McNally F.J., Baas, P.W., 1999. An Essential role for
Katanin in Severing Microtubules in the Neuron, Journal of Cell
Biology, 145, 305-315.
Avila, J., Ulloa, L., Diez-Guerra, J., Diaz-Nido, J., 1994. Role of Phosphorylated
MAP1b in Neurogenesis, Cell Biology International, 18, 309.
Baas, P.W., Black, M.M., 1989. The basis of polarity in neurons, TINS, 12, 211-214
Baas, P., 1997. Microtubules and Axonal Growth, Current Opinion in Cell Biology,
9, 29-36.
Baas, P.W., 1999. Microtubules and Neuronal Polarity: Lessons from Mitosis,
Neuron, 22, 23-31.
Baas, P.W., 2002, Neuronal Polarity: microtubules strike back, Nature Cell Biology,
4, E194-195.
Banker, G. and Goslin. K., 1998. Culturing Nerve Cells (2nd edition). MIT Press,
London:
Bloom, G. S., Vallee, R. B., 1983, Association of Microtubule-associated Protein 2
(MAP 2) with Microtubules and Intermediate Filaments in Cultured
Brain Cells, The Journal Of Cell Biology, 96, 1523 – 1531.
Bomont, P., Koenig, M., 2003. Intermediate filament aggregation in fibroblasts of
giant axonal neuropathy patients is aggravated in non dividing cells
and by microtubule destabilization, Human Molecular Genetics, 12,
813 – 822.
Charvin, D., Cifuentes-Diaz, C., Fonknechten, N., Joshi, V., Hazan, J., Melki, J.,
Betuing, S., 2003. Mutations of SPG4 are responsible for a loss of
function of spastin, an abundant Neuronal protein localized in the
nucleus, Human Molecular Genetics, 12, 1 71–178.

62
Claudiani, P., Riano,E., Errico, A., Andolfi, G., Rugarli, E.I., 2005, Spastin
subcellular localization is regulated through usage of different
translation start sites and active export from the nucleus,
Experimental Cell Research, 309, 358 – 369.
David, J., Briggs, A.H., DeMarco1, A., Kirschner, M.W., 1999. Microtubule
bending and breaking in living fibroblast cells, Journal of Cell
Science, 112, 3283-3288.
Dent, E.W., Callaway, J.L., Baas, P.W., 1999. Reorganization and Movement of
Microtubules in Axonal Growth Cones and Developing Interstitial
Branches, The Journal of Neuroscience, 19, 8894-8908.
Desai, A., and Mitchison, T. J., 1997. Microtubule Polymerization Dynamics,
Annu. Rev. Cell Dev. Biol. 13, 83–117.
Errico, A., Ballabio, A., Rugarli,E., 2002. Spastin, the protein mutated in
autosomal dominant hereditary spastic paraplegia, is involved in
microtubule dynamics, 11, 153-163.
Errico, A., Claudiani, P., D’Addio, M., Rugarli, E.I., 2004. Spastin interacts with
the centrosomal protein NA14, and is enriched in the spindle pole, the
midbody and the distal axon Human Molecular Genetics, 13, 182121–
182132.
Fink,J.K., Rainier,S., Arbor, A., 2004. Hereditary Spastic Paraplegia, Arch
Neurol., 61, 830-832.
Fischer, I., Ma, D., Himes, T. Shea, T.B., 2000. Axonal Transport of Microtubule-
Associated Protein 1B (MAP1B) in the Sciatic Nerve of Adult Rat:
Distinct Transport Rates of Different Isoforms, The Journal of
Neuroscience, 20, 2112 – 2120.

63
Fonknechten, N., Mavel, D., Byme, D., Davoine, C.S., Cruaud, C., Boentsch, D.,
Samson, D., Coutinho, P., Hutchinson, M., McMonagie, P.,
Burgunder, J.M., Tartaglione, A., Heinzlef, B., Feki, I., Deufel.,
T., Parfrey, N., Brice, A., Fontaine, B., Prud’homme, J.F.,
Weissenbach, J., Dürr, A., Hazan, J., 2000. Spectrum of SPG4
mutation is autosomal dominant spastic paraplegia, Human Molecular
Genetics, 9, 637-644.
Franzen, R., Taner, S. L., Dashiell, S. M., Rottkamp C. A., Hammer J. A.,
Quarles, R. H., 2001. Microtubule-associated protein 1B: a neuronal
binding partner for myelin-associated glycoprotein, The Journal of
Cell Biology, 155, 893 – 898.
Friedrich Propst, F., Wiche, G., Lassmann, H., Bittner, E. R., Kropf, N.,
Thalhammer J., Führer, S., Wässle, H., Haverkamp, S., Meixner,
A., 2000. MAP1B Is Required for Axon Guidance and Is Involved in
the Development of the Central and Peripheral Nervous System, The
Journal of Cell Biology, 151, 1169 – 1178.
Gordon-Weeks, P. R., Fischer, I., 2000. MAP1B Expression and Microtubule
Stability in Growing and Regenerating Axons, Microscopy Research
and Technique, 48, 63 – 74.
Halpain, S., Ozer, R. S., 2000. Phosphorylation-dependent Localization of
Microtubule-associated Protein MAP2c to the Actin Cytoskeleton,
Molecular Biology of the Cell, 11, 3573 – 3587.
Hartman J.J., Mahr, J., McNally, K., 1998. Katanin a Microtubule-Severing
Protein, Is a Novel AAA ATPase that Targets to the centrosome
Using a WD40-Containig Subunit, Cell, 93, 277-287.
Hazan, J., Fonknechten, N., Mavel1, D., Paternotte, C., Samson, D.,
Artiguenave, F., Davoine, C.S., Cruaud, C., Dürr, A., Wincker, P.,
Brottier, P., Cattolico1, L., Barbe, V., Burgunder, J.M.,
Prud’homme, J.F., Brice, A., Fontaine, B., Heilig, R.,
Weissenbach, J., 1999. Spastin, a new AAA protein, is altered in the
most frequent form of autosomal dominant spastic paraplegia, Nature
Genetics, 23, 296-303.
64
Hirokawa, N., Terada, S., Funakoshi, T., Takeda, S., 1997. Slow axonal transport:
the subunit transport model, Trends in Cell Biology, 7, 384-388.
Joshi, H. C., 1998. Microtubule dynamics in living cells, Current Opinion in Cell
Biology, 10, 35-44.
Joshi, H.C., Baas, P.W., 1993. A New Perspective on Microtubules and Axon
Growth, The Journal of Cell Biology, 121, 1191-1196.
Karabay, A., Yu, W., Solowska, J. M., Baird, D.H., Baas, P.W., 2004. Axonal
Growth Is Sensitive to the Levels of Katanin, Protein That Severs
Microtubules, The Journal of Neuroscience, 24, 5778 – 5788.
Kunkel, L. M., Lien, L. L., Fener, C. A., Fiscbach, N., 1994. Cloning of Human
Microtubule-Associated Protein 1B and the Identification o a related
Gene on Chromosome 15, Genomics, 22, 273 – 280.
Lodish, H., Baltimore, D., 1995. Molecular Cell Biology (3rd edition). Scientific
American Books, New York
Lohret, T.A., McNally, F.J., Quarmby, L., 1998. A Role for Katanin-mediated
Axonemal Severing during Chlamydomonas Deflagellation,
Molecular Biology of the Cell, 9, 1195-1207.
Mandelkow, E., Willes, H., Mandelkow, E. M., 1992. The Juvenile Microtubule-
associated Protein MAP Is a Rod-like Molecule That Forms
Antiparallel Dimers, The Journal of Biological Chemistry, 267, 10737
– 10742.
Matus, A., 1988. Microtubule – Associated Proteins: Their Potential Role in
Determining Neuronal Morphology. Ann. Rev. Neurosci,. 11, 29-44.
McDermott, C.H., Grierson, A.J., Wood, J.D., Bingley, M., Wharton, S.B.,
Bushby, M. D., Shaw, P.J., 2003. Hereditary Spastic Paraparesis:
Disrupted Intracellular Transport Associated with Spastin Mutation,
Ann Neurol., 54, 748–759.
McNally F. J. & Vale, R. D., 1993. Identification of Katanin, an ATPase That
Severs and Disassembles Stable Microtubules, Cell, 75, 419-429.

65
McNally, F.J. & Thomas, S., 1998. Katanin Is responsible for the M-Phase
Microtubule- severing Activity in Xenopus Egg, Molecular Biology of
the Cell, 9, 1847-1861.
McNally, F., (2000), Capturing a Ring of Samurai, Nature Cell Biology, 2: E4-E7
McNally, K. P., Bazirgan, O. A., McNally, F. J., 2000. Two domains of p80
katanin regulate severing and spindle pole targeting by p60 katanin,
Journal of Cell Science, 113, 1623-1633.
McNally F. J., McNally K., Buster, D., 2002. Katanin inhibition prevents
redistribution of γ- tubulin at mitosis, Journal of Cell Science, 115,
1083-1092.
Milligan, R., Halpain, S., Safer, D., Ozer, R. S., Al-Bassam, J., 2002. MAP2 and
tau bind longitudinally along the outer ridges of microtubule
protofilaments, The Journal of Cell Biology, 157, 1187 – 1196.
Noble, M., Lewis, S. A., Cowan, N. J., 1989. The Microtubule Binding Domain of
Microtubule-associated Protein MAPIB Contains a Repeated
Sequence Motif Unrelated to that of MAP2 and Tau, The Journal of
Cell Biology, 109, 3367-3376.
Nogales, E., 2000. Structural Insights Into Microtubule Function. Annu. Rev.
Biochem., 69, 277–302.
Qiang, L., Yu, W., Andreadis, A., Luo, M., Baas, P.W., 2006. Tau Protects
Microtubules in the Axon from Severing By Katanin, The Journal of
Neuroscience, 26, 3120-3129.
Quarmby, L., 2000. Cellular Samurai: katanin and the severing of microtubules,
Journal of the Cell Science, 113, 2821-2827.
Quarmby, L. and Lohret, T.A., 1999. Microtubule Severing, Cell Motility and the
Cytoskeleton, 43, 1-9.
Reid, E., Connell, J., Edwards, T.L., Duley, S., Brown, S.E., Sanderson, C.M.,
2005. The hereditary spastic paraplegia protein spastin interacts with
the ESCRT-III complex-associated endosomal protein CHMP1B,
Human Molecular Genetics, 14, 19– 38.
66
Roll-Mecak, A., Vale, R.D., 2005. The Drosophila Homologue of the Hereditary
Spastic Paraplegia Protein, Spastin, Severs and Disassembles
Microtubules, Current Biology, 15, 650–655.
Sherwood, N.T., Sun, Q., Xue, M., Zhang, B., Zinn, K., 2004. Drosophila Spastin
Regulates Synaptic Microtubule Networks and Is Required for
Normal Motor Function, PLoS Biology, 2, e429.
Takemura, R., Okabe, S., Umeyama, T., Kanai, Y., Cowan N.J., Hirokawa, N.,
1992. Increased Microtubule Stability and alpha Tubulin Acetylation
in Cells Transfected with Microtubule Associated Proteins MMAP1b,
MAP2 or tau, The Journal of Cell Sciences, 103, 953 – 964.
Taniguchi, H., Titani K., Yamauchi, E., 1997. Specific Binding of Acidic
Phospholipids to Microtubule-associated Protein MAP1B Regulates
Its Interaction with Tubulin, The Journal Of Bıologıcal Chemıstry,
272, 22948 –22953.
Tögel, M, Wiche, G., Propst F., 1998. Novel Features of the Light Chain of
Microtubule-associated Protein MAP1B: Microtubule Stabilization,
Self Interaction, Actin Filament Binding, and Regulation by the
Heavy Chain.
Vale, R. D. & Hartman, J. J., 1999. Microtubule Disassembly by ATP-Dependent
Oligomerization of the AAA Enzyme Katanin, Science, 286, 782-784.
Vale, R. D., 2000. AAA Proteins: Lords of the Ring, The Journal of Cell Biology,
150, F13-F19.
Walker, R. A., O’Brien, E. T., Pryer, N.K., Soboeiro, M.F., Voter, W. A., and
Erickson, H.P., 1988. Dynamic instability of individual microtubules
analyzed by video light microscopy: rate constants and transition
frequencies. The Journal of Cell Biology, 107, 1437-1448.
Walker, R. A., Pryer, N. K., and Salmon E. D., 1991. Dilution of individual
microtubules observed in real time in vitro: evidence that cap size is
small and independent of elongation rate. The Journal of Cell Biology,
114, 73-81.

67
Wharton, S.B., McDermott, C.J., Grierson, A.J., Wood, J.D., Gelsthorpe, C.,
Ince, P.G., Shaw, P.J., 2003. The cellular and molecular pathology
of the motor system in hereditary spastic paraparesis due to mutation
of the spastin gene, Journal of neuropathology and experimental
neurology, 62, 1166–1177.
68
APPENDIX
Table A.1: Process measurements values of spastin overexpressing cells, day 4 (µm)
spastin
DAY 4
cell1 cell2 cell3 cell4 cell5 cell6 cell7 cell8 cell9 cell10 cell11 cell12
246,61 434,18 814,47 414,08 578,15 185,93 581,58 390,97 288,67 311,37 291,78 426,29
45,8 99,45 760,76 65,97 360,59 56 110,98 92,71 144,07 284,6 92,27 84,14
116,95 360,08 545,72 115,65 96,21 50 246,21 1072,65 51,31 518,22 35,65 141,91
54,14 265,85 624,23 151,15 42 155,97 284,17 98,51 53,31 192,29 145 390,03
50,14 159,58 178,68 470,66 105,31 125,1 202,65 255,19 97,24 134,15 24 132,89
38,63 74 106,97 92 47,65 38,95 295,5 432,48 66,13 129,92 127,3 241,05
64,97 124,4 69,65 74 42,97 83,65 168,91 439,12 75,8 173,73 360,84 349,71
32 43,41 89,31 158,24 47,56 84,14 145,1 325,94 127,45 149,25 62,62 109,35
141,65 82,97 76,48 64 28,48 196,72 142,95 238,94 136,63 160,54 429,69 133,31
68,95 277,57 53,65 83 40 149,85 69,44 152,67 276,9 140,37 215,85 210,27
40,61 355,38 47,65 167,92 96,87 140,28 302,34 312,1 383,37 111,45 91,8
65,31 572,82 34 117,78 89 103,1 122,27 65,8 199,08 252,4
56,14 123,93 372,25 63,44 128,4 115,31 209,21 44,13 300,31
74,97 102,25 78 76 51,57 75,31 48,48 299,07
71,9 88 72,14 44,83 149,21 416,49 15,65 646,55
67,65 121,11 106,48 97,1 72,61 437,87 44,48 193,31
56,47 188,28 212,97 105,25 170,05 409,5 56,14 189,08
52,83 102,27 81,78 83,8 55,65 42,82 66,62
95,31 591,24 26,83 347,02 412,71 90,82 210,95
85,43 123,38 18 164,27 48,48 78,14 58,48
113,24 128,61 40,83 48,14 126,83 120,97 201,94
48,95 645,07 167,43 53,65 95,72
78,82 229,98 95,31 365,43 214,18
109,31 130,51 215,1 254,08 134,78
175,11 406,48 422,08 414,86 735,28
97,93 222,13 129,31 190,25 133,58
44,97 115,09 45,65 866,73 159,09
64,14 123,44 48,83 288,61 272,58
78,05 380,75 60,83 368,35 250,15
69,31 96,14 71,8 112,54 85,65
44 154,82 26 58,48
26,83 136,55 95,71 174,88
45,31 76,97 146,66
70,83 71,11 207,55
56,83 124,14 238,39
82,48 107,11 100,13
87,65 88,48 24
143,71 66,62 132
115,44 193,91 206,3
139,6 140,94 98,62
152,07
113,91
52,83
115,14
2477,12 3473,26 3401,57 7578,55 2128,85 4832,09 2787,41 3811,28 6873,23 3046,6 7763,53 2218,95 TOTAL
69
Table A.2: Process measurements values of p-60 katanin overexpressing cells, day 4 (µm)
p60
DAY 4
cell1 cell2 cell3 cell4 cell5 cell6 cell7 cell8 cell9 cell10 cell11
336,81 378,67 322,28 486,21 416,18 70,83 146,77 190,64 373,35 549,28 510
345 333,69 219,21 428,73 85,49 83,6 197,01 76,24 262,47 259,89 169
132,4 355,63 88,62 248,65 215,17 64,25 155,03 139,65 353,28 81,1 200,7
117,8 114,97 152,27 139,57 442,28 68,97 55,31 72,4 300,68 78,48 202,3
319,7 260,17 50,65 158,8 64,95 309,62 671,62 90,89 83,6 323,43
390 463,63 162,06 113,1 120,05 48,83 102,74 405,87 54,8 242,01
224,48 80,47 93,91 855,12 1003,4 43,31 99,31 261,29 67,35
154,75 286,44 96,83 320,34 42,48 78,14 181,92 63,07
206,33 78,97 96,72 50,14 326,87 63,44 87,78
100,48 607,18 722,72 104,6 120,6
213,24 132,64 90,9 183,58
113,71 125,81 99,45 102,97
786,63 66,14 88,24 565,17
361,28 126,22
208,4
122,67
4133,68 2352,64 2340,54 2750,52 1159,12 1476,12 2049,81 2713,93 2293,19 1445,95 1647,44 TOTAL
Table A.3: Process measurements values of GFP overexpressing control cells, day 4 (µm)
GFP
DAY 4
cell1 cell2 cell3 cell4 cell5 cell6 cell7 cell8
504,27 426,21 518,85 760 844,6 260,21 76,82 711,23
129,65 493,18 656,55 242,44 1166,6 368,33 194,21 679,54
98,13 760,61 196,14 195,31 518,29 137,14 127,09 742,2
49,65 516,45 206,22 428,05 319,5 463,49 140,94 366,8
104,83 150,64 182,27 125,72 177,56 61,45 247,88 84,95
155,6 245 104,97 169,71 182,53 134,54 83,8
109,65 119,78 107,24 126,4 90,48 174,32 169,23
117,93 787,45 81,44 140,71 273,68 120,61
230,42 452,47 68,48 306,3 128,42
67,93 242,65 145,6 49,6
56,14 179,37 285,6 101,81
193,4 107,92 122,14 41,3
87,31
38,82
39,31
1983,04 2347,09 3364,73 2045,17 3322,6 2302,76 2229,12 3279,49 TOTAL
70
Table A.4: Process measurements values of spastin overexpressing cells, day 6 (µm)
spastin DAY 6
cell1 cell2 cell3 cell4 cell5 cell6 cell7 cell8
785,91 425,08 958,82 199,37 374,44 243,14 865,53 132,83
108,75 238,61 373,12 203,04 371 445,3 323,88 131
37,65 736,09 581,63 110,14 133,8 607,58 119,78 118,28
85,65 54,14 121,1 125,31 97,54 132,6 128,05 65,94
99,45 673,05 761,56 108,25 94,94 63,44 215,17 167,99
133,91 323,4 149,63 157,1 396,13 109,93 887,65 198,66
52,95 517,34 148,62 116,53 575,5 154,8 198,56 496,94
42,48 196,21 497,51 850,34 209 152,4 105,78 869,3
221,98 169,45 107,39 136,92 494,18 34 116,4 122,97
123,8 146,21 138,33 90 625,4 276,37 120,87 149,84
42,82 124,53 170,47 128,61 192,26 90,28 64,48 302,91
148,42 122,62 160,62 10 236,48 139,11 86,14 106,48
456,94 150,41 150,14 94,95 213,83 281,58 84,62 54,97
162,22 116,14 88,13 88,62 249,8 346,15 97,8 130,1
290,1 288,04 130,28 51,8 191,6 110,6 210,55 110,9
273,98 114,97 73,78 53,31 775,23 67,31 38,47 60
124,48 80 331,16 158,62 59,65 569,92 71,65
104,97 123,25 122,61 231,31 37,31 82 45,65
146,28 89,44 115,45 89,58 88,62 150,67 261,07
117,31 101,65 57,45 194,5 64 94,97 254,05
122,08 50,48 703,33 72 96,97 429,57 295,25
85,7 88,48 98,05 26,48 157,54 130,91
305,39 106,88 94,14 130,28 122,62 235,71
83,44 100,97 96,97 340,49 95,31
216,62 170,54 105,65 908,35 106,63
49,65 94,55 110,26 185,01 553,05
26 143,38 64,48 297,84 146,97
46 77,31 173,1 184,24 70,61
64,14 236,35 309,53 102,5
206,61 50,83 88,84
124,5 223,9 155,11
65,31 123,45 176,3
191,7 89,11 203,44
223,64 149
112,58 86,82
445,81 199,3
223,6 117,87
199,58 42,15
76,62 95,65
168,62 91,44
154,04
111,8
73,8
52
105
99,44
4494,93 5036,47 6784,21 2524,29 5977,14 7179,36 7983,77 6994,39 TOTAL
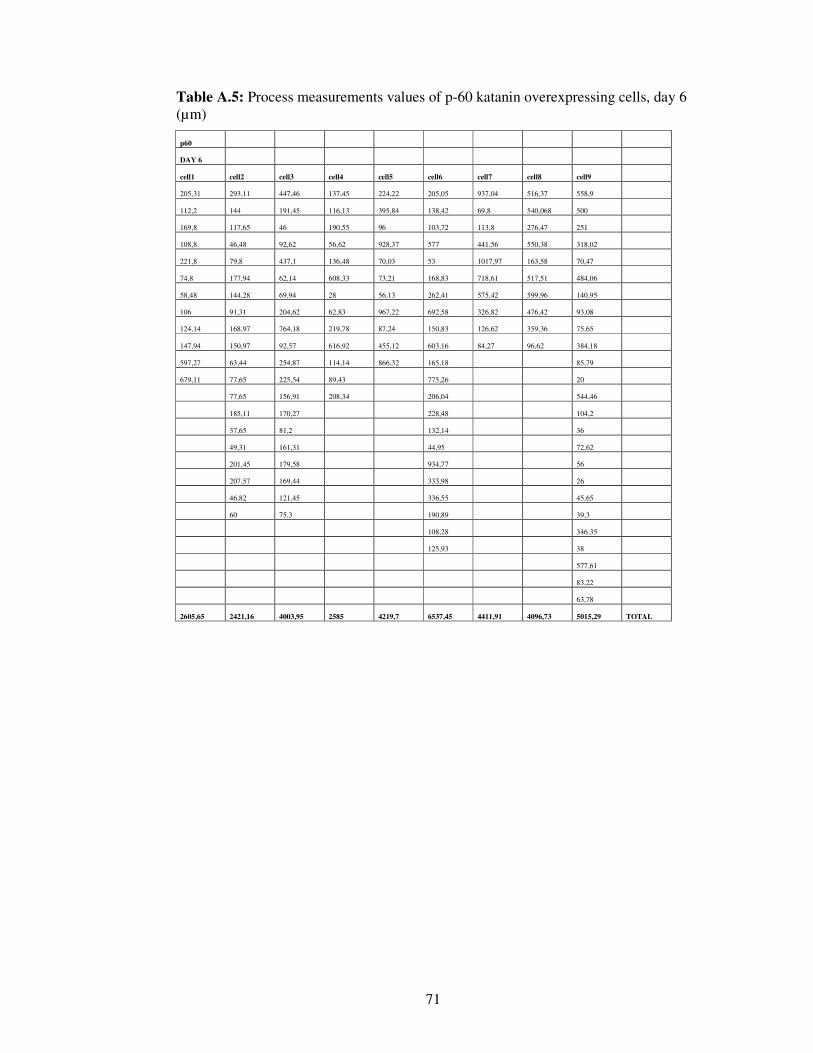
71
Table A.5: Process measurements values of p-60 katanin overexpressing cells, day 6 (µm)
p60
DAY 6
cell1 cell2 cell3 cell4 cell5 cell6 cell7 cell8 cell9
205,31 293,11 447,46 137,45 224,22 205,05 937,04 516,37 558,9
112,2 144 191,45 116,13 395,84 138,42 69,8 540,068 500
169,8 117,65 46 190,55 96 103,72 113,8 276,47 251
108,8 46,48 92,62 56,62 928,37 577 441,56 550,38 318,02
221,8 79,8 437,1 136,48 70,03 53 1017,97 163,58 70,47
74,8 177,94 62,14 608,33 73,21 168,83 718,61 517,51 484,06
58,48 144,28 69,94 28 56,13 262,41 575,42 599,96 140,95
106 91,31 204,62 62,83 967,22 692,58 326,82 476,42 93,08
124,14 168,97 764,18 219,78 87,24 150,83 126,62 359,36 75,65
147,94 150,97 92,57 616,92 455,12 603,16 84,27 96,62 384,18
597,27 63,44 254,87 114,14 866,32 165,18 85,79
679,11 77,65 225,54 89,43 775,26 20
77,65 156,91 208,34 206,04 544,46
185,11 170,27 228,48 104,2
37,65 81,2 132,14 36
49,31 161,31 44,95 72,62
201,45 179,58 934,77 56
207,57 169,44 333,98 26
46,82 121,45 336,55 45,65
60 75,3 190,89 39,3
108,28 346,35
125,93 38
577,61
83,22
63,78
2605,65 2421,16 4003,95 2585 4219,7 6537,45 4411,91 4096,73 5015,29 TOTAL
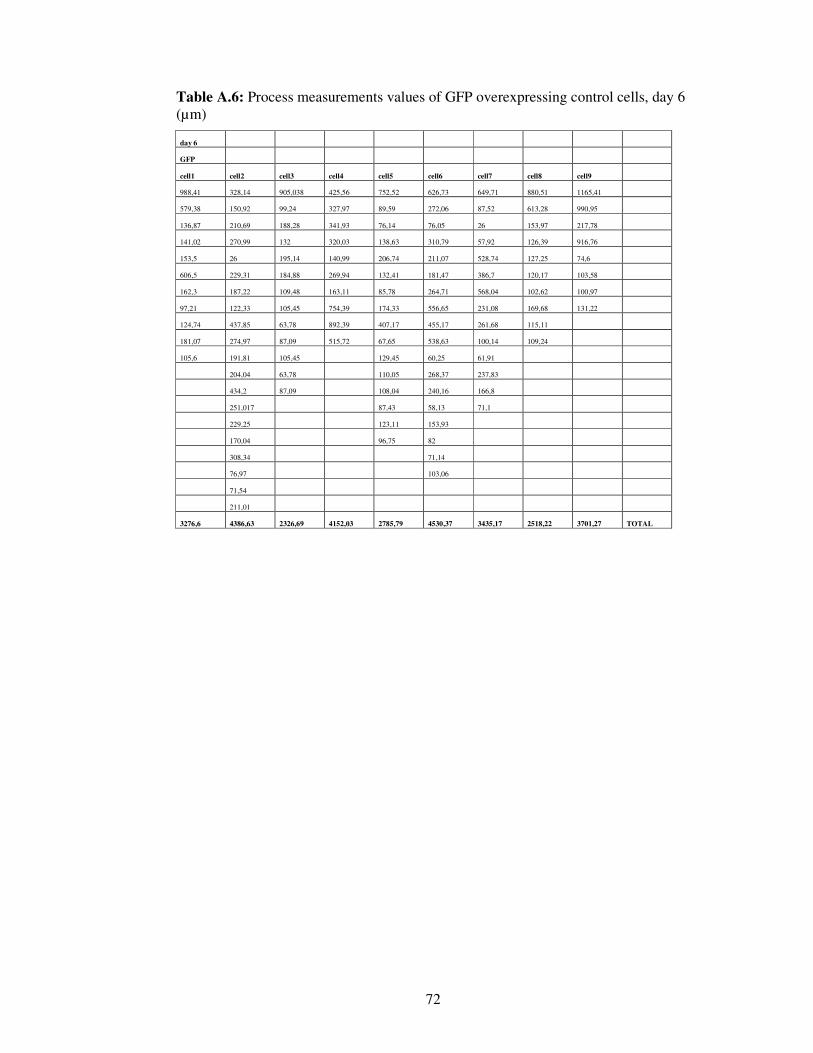
72
Table A.6: Process measurements values of GFP overexpressing control cells, day 6 (µm)
day 6
GFP
cell1 cell2 cell3 cell4 cell5 cell6 cell7 cell8 cell9
988,41 328,14 905,038 425,56 752,52 626,73 649,71 880,51 1165,41
579,38 150,92 99,24 327,97 89,59 272,06 87,52 613,28 990,95
136,87 210,69 188,28 341,93 76,14 76,05 26 153,97 217,78
141,02 270,99 132 320,03 138,63 310,79 57,92 126,39 916,76
153,5 26 195,14 140,99 206,74 211,07 528,74 127,25 74,6
606,5 229,31 184,88 269,94 132,41 181,47 386,7 120,17 103,58
162,3 187,22 109,48 163,11 85,78 264,71 568,04 102,62 100,97
97,21 122,33 105,45 754,39 174,33 556,65 231,08 169,68 131,22
124,74 437,85 63,78 892,39 407,17 455,17 261,68 115,11
181,07 274,97 87,09 515,72 67,65 538,63 100,14 109,24
105,6 191,81 105,45 129,45 60,25 61,91
204,04 63,78 110,05 268,37 237,83
434,2 87,09 108,04 240,16 166,8
251,017 87,43 58,13 71,1
229,25 123,11 153,93
170,04 96,75 82
308,34 71,14
76,97 103,06
71,54
211,01
3276,6 4386,63 2326,69 4152,03 2785,79 4530,37 3435,17 2518,22 3701,27 TOTAL
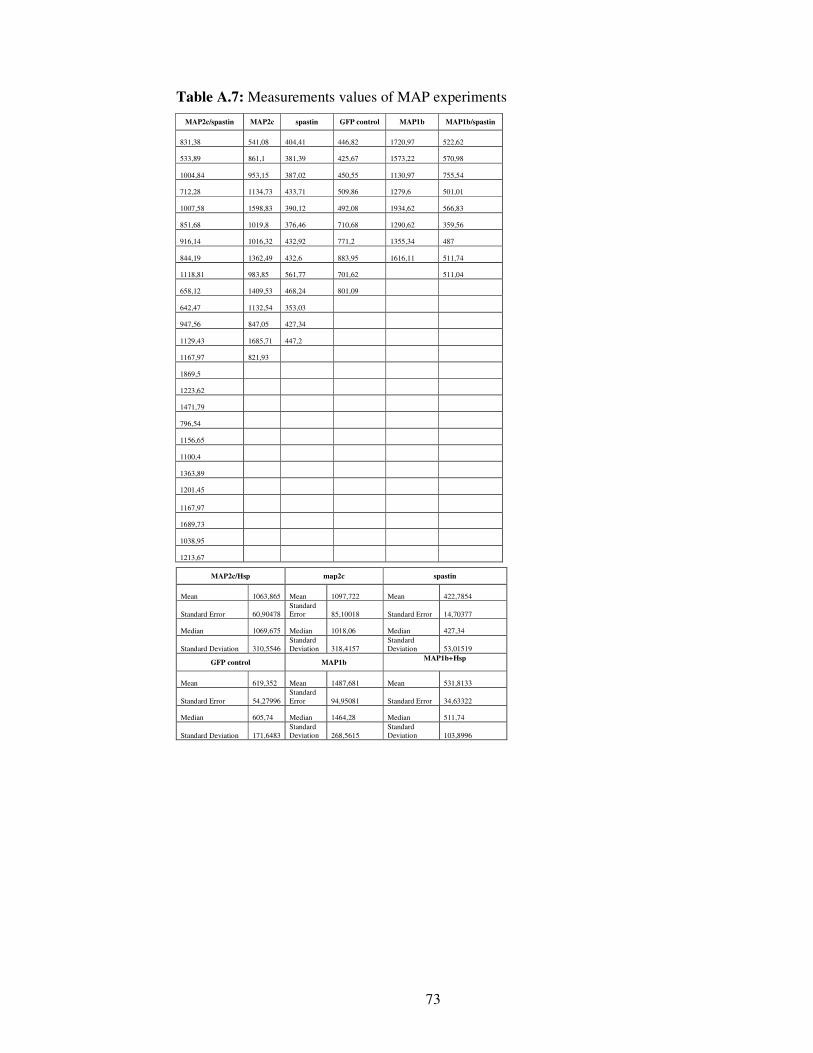
73
Table A.7: Measurements values of MAP experiments
MAP2c/spastin MAP2c spastin GFP control MAP1b MAP1b/spastin
831,38 541,08 404,41 446,82 1720,97 522,62
533,89 861,1 381,39 425,67 1573,22 570,98
1004,84 953,15 387,02 450,55 1130,97 755,54
712,28 1134,73 433,71 509,86 1279,6 501,01
1007,58 1598,83 390,12 492,08 1934,62 566,83
851,68 1019,8 376,46 710,68 1290,62 359,56
916,14 1016,32 432,92 771,2 1355,34 487
844,19 1362,49 432,6 883,95 1616,11 511,74
1118,81 983,85 561,77 701,62
511,04
658,12 1409,53 468,24 801,09
642,47 1132,54 353,03
947,56 847,05 427,34
1129,43 1685,71 447,2
1167,97 821,93
1869,5
1223,62
1471,79
796,54
1156,65
1100,4
1363,89
1201,45
1167,97
1689,73
1038,95
1213,67
MAP2c/Hsp map2c spastin
Mean 1063,865 Mean 1097,722 Mean 422,7854
Standard Error 60,90478 Standard Error 85,10018 Standard Error 14,70377
Median 1069,675 Median 1018,06 Median 427,34
Standard Deviation 310,5546 Standard Deviation 318,4157
Standard Deviation 53,01519
GFP control MAP1b MAP1b+Hsp
Mean 619,352 Mean 1487,681 Mean 531,8133
Standard Error 54,27996 Standard Error 94,95081 Standard Error 34,63322
Median 605,74 Median 1464,28 Median 511,74
Standard Deviation 171,6483 Standard Deviation 268,5615
Standard Deviation 103,8996

74
RESUME
Şirin Korulu was born in Bulgaria in 1980. After getting her high school diploma from Bursa Boys High School in 1999, she has continued her undergraduate degree at Istanbul Technical University, Department of Molecular Biology and Genetics in 1999. She had her Bachelor degree in 2003. She has continued to her graduate studies at Advanced Technologies in Molecular Biology – Genetics and Biotechnology program in the Istanbul Technical University. She has been also working as a research assistant in Department of Molecular Biology and Genetics. She is still pursuing her studies in the same department.