staff report for the 2017 article iv … · staff report for the 2017 article iv consultation –...
TRANSCRIPT
ZIMBABWE
STAFF REPORT FOR THE 2017 ARTICLE IV CONSULTATION –
DEBT SUSTAINABILITY ANALYSIS
Approved by
Anne-Marie Gulde-Wolf,
Zeine Zeidane (IMF) and
Paloma Anós Casero (IDA)
Zimbabwe is in debt distress, and its total public and external debt is unsustainable.
With longstanding external arrears, foreign financing has been scarce, and large fiscal
deficits are lately being financed through domestic borrowing. Domestic debt, which
was negligible five years ago, has increased sharply to more than 25 percent of GDP,
and is on an unsustainable trajectory. External debt indicators, notably those related to
solvency, continue to breach their thresholds under the baseline scenario, while those
measuring liquidity (debt service) are deteriorating over time. Attaining debt
sustainability would require sharp fiscal consolidation and external support from the
international community.1 The authorities broadly concurred with the staff’s
assessment, and were confident that the envisaged reengagement with the
international community will help restore debt sustainability.
1 This DSA was prepared jointly by IMF and World Bank staff under the joint Fund-Bank Low-Income Country Debt
Sustainability Framework (LIC DSF, 2013). Zimbabwe’s Country Policy and Institutional Assessment (CPIA) Rating was
2.9 in 2015, and categorized as weak policy performance. Zimbabwe’s fiscal year runs from January 1 to December
31. The result of this DSA were discussed with the authorities and they are in broad agreement with its conclusions.
Prepared by the staffs of the International
Monetary Fund and the International
Development Association
June 19, 2017
ZIMBABWE
2 INTERNATIONAL MONETARY FUND
BACKGROUND AND RECENT DEVELOPMENTS
1. The economic environment has experienced a major deterioration, further eroding
Zimbabwe’s already precarious fiscal status. Real GDP growth in 2016 decreased to
0.7 percent from 1.4 percent in 2015. A severe drought resulted in the lowest maize harvest in
25 years, and foreign exchange inflows declined as key export prices remained depressed and
country risk increased. Reforms aiming at fostering fiscal discipline were constrained by political
difficulties. As a result, annual fiscal expenditures increased by 5 percent of GDP in 2016, while
revenues fell by 2 percent of GDP. Public debt reached almost 70 percent of GDP.
2. The process of reengagement with external creditors has been slower than
anticipated. Arrears to the IMF-administered Poverty Reduction and Growth Trust were cleared in
October 2016, allowing Zimbabwe’s PRGT eligibility to be restored and the declaration of
noncooperation to be lifted. However, discussions are still ongoing over financing and modalities to
clear the arrears to the World Bank and the African Development Bank. As reengagement with
international institutions is delayed, and reforms on governance, and human and property rights
have not proceeded at the expected pace, debt treatment from bilateral creditors also remains
constrained. External obligations are being serviced selectively, and with a view to unlocking
additional financing.
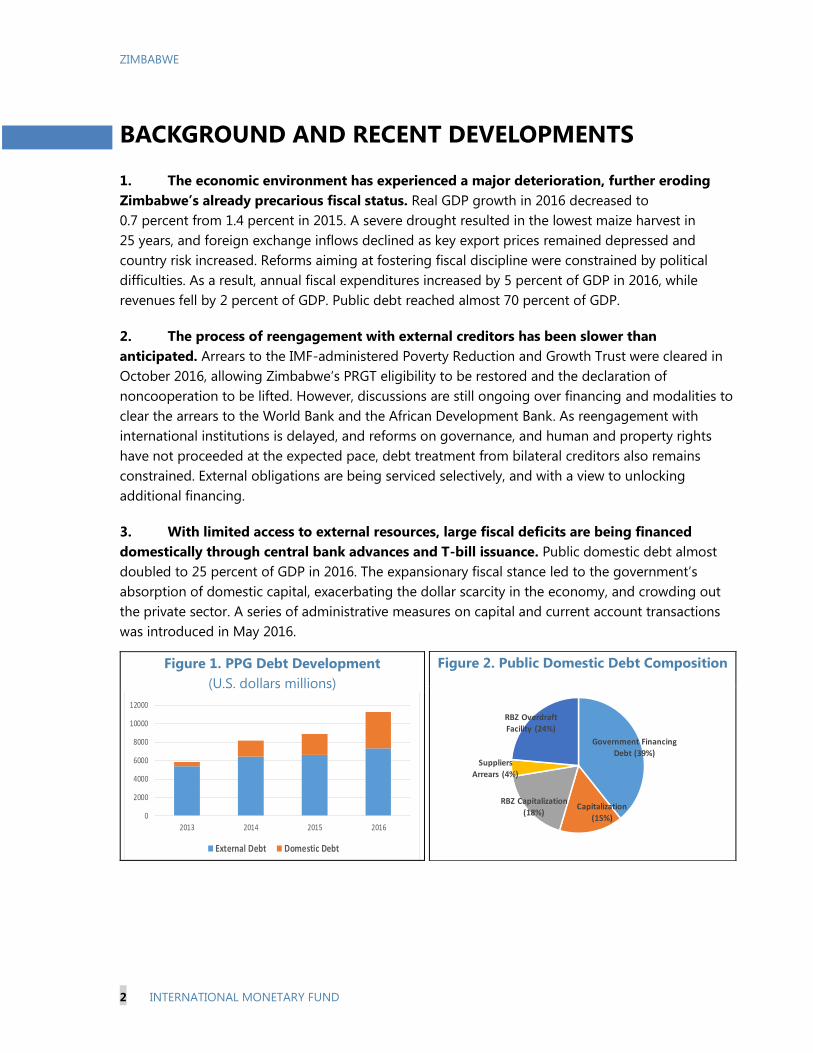
3. With limited access to external resources, large fiscal deficits are being financed
domestically through central bank advances and T-bill issuance. Public domestic debt almost
doubled to 25 percent of GDP in 2016. The expansionary fiscal stance led to the government’s
absorption of domestic capital, exacerbating the dollar scarcity in the economy, and crowding out
the private sector. A series of administrative measures on capital and current account transactions
was introduced in May 2016.
Figure 2. Public Domestic Debt Composition Figure 1. PPG Debt Development
(U.S. dollars millions)
Government Financing
Debt (39%)
Capitalization
(15%)
RBZ Capitalization
(18%)
Suppliers
Arrears (4%)
RBZ Overdraft
Facility (24%)
Figure 2. Public Domestic Debt Composition
0
2000
4000
6000
8000
10000
12000
2013 2014 2015 2016
Figure 1. PPG Debt Development
(U.S. dollars million)
External Debt Domestic Debt
ZIMBABWE
INTERNATIONAL MONETARY FUND 3
MACROECONOMIC ASSUMPTIONS
4. The macroeconomic assumptions underlying the previous DSA have been revised to
reflect recent developments. The long-term growth outlook has been moderated, reflecting the
current challenges, including the crowding out of private sector borrowing, the continued external
payment arrears and delays in addressing them, and the perceived difficulties in the investment
climate. The fiscal deficit is anticipated to narrow only slowly as the wage and hiring freezes from
this year take effect. Equally, the external current account deficit is expected to continue to decline,
as import compression persists, and sources of financing remain limited. The private sector is likely
to find it hard to attract lines of credit in a context of dollar scarcity. Similarly, a continuation of the
country’s arrears situation would result in the maintenance of the status quo regarding sources of
official financing from traditional creditors.
5. Key assumptions: The macroeconomic assumptions that underpin the baseline scenario are
as follows:
Annual real GDP growth is projected to be just under 3 percent in 2017, mainly reflecting
the rebound in agriculture from a low base last year and some recovery in manufacturing.
Over the medium term, however, prospects are weak, with near zero growth (a range of
0.3 to -0.3 percent) through 2022, reflecting subdued private sector activity, a difficult
business environment, declining policy credibility, and a likely limited impact of
government-led efforts to increase production. Thereafter, the DSA assumes an increase of
growth to around 2 percent a year, far lower than its potential under the right policies.
Average inflation is projected to pick up in the short term to 8–9 percent, reflecting
sustained monetary financing of the deficit, which in combination with the foreign exchange
controls in place would drive up prices of domestically produced and imported goods,
before stabilizing at 2 percent over the longer term.
Exports in nominal terms are anticipated to grow at about 3 percent per year over the
projection period, reflecting an anticipated production increase in the mining sector,
particularly in chrome ore and diamonds.
Import growth is envisaged to be constrained in the near term by the foreign exchange
controls, and subsequently reach 3 percent annually in the medium and longer terms.
The non-interest current account deficit is expected to stabilize at around 1 percent of
GDP, reflecting limited inward investment and low private sector’s capacity to borrow.
Government revenues are projected to reach 21 percent of GDP by 2018, while primary
expenditure would fall gradually from 29.8 percent in 2016 to 21 percent by the end of the
projection period.
ZIMBABWE
4 INTERNATIONAL MONETARY FUND
A forced fiscal adjustment is assumed over the medium term. Amid the financing
constraint, a continued policy of salary freezes could generate an adjustment in the
wage-to-GDP ratio over the medium term. However, the baseline scenario assumes that
such an adjustment would be insufficient to restore macroeconomic stability, and thus the
persisting deficits, while lower than the current one, would continue to hamper private
investment and growth.
New external borrowing is assumed to average just 1½ percent of GDP, with a grant
element close to zero, in line with recent trends. Staff assumes that Zimbabwe will continue
to receive limited financing from non-traditional creditors only as repayments unlock new
credit, especially in the near term. Private sector external borrowing would remain subdued.
External arrears are expected to remain in place, and accumulation of arrears is assumed to
be only related to debt currently not being serviced.
International reserves are projected to remain around the current low level, reflecting the
difficulties in building buffers under current policies.
DEBT SUSTAINABILITY INDICATORS
A. External DSA
6. Zimbabwe’s Public and Publicly Guaranteed (PPG) external debt burden indicators
remain elevated, and the external debt overhang is large.2 PPG external debt is estimated at
44.8 percent of GDP as of end-2016, of which 70 percent stands in arrears (Table 1). Private external
debt is estimated at 13 percent of GDP.3
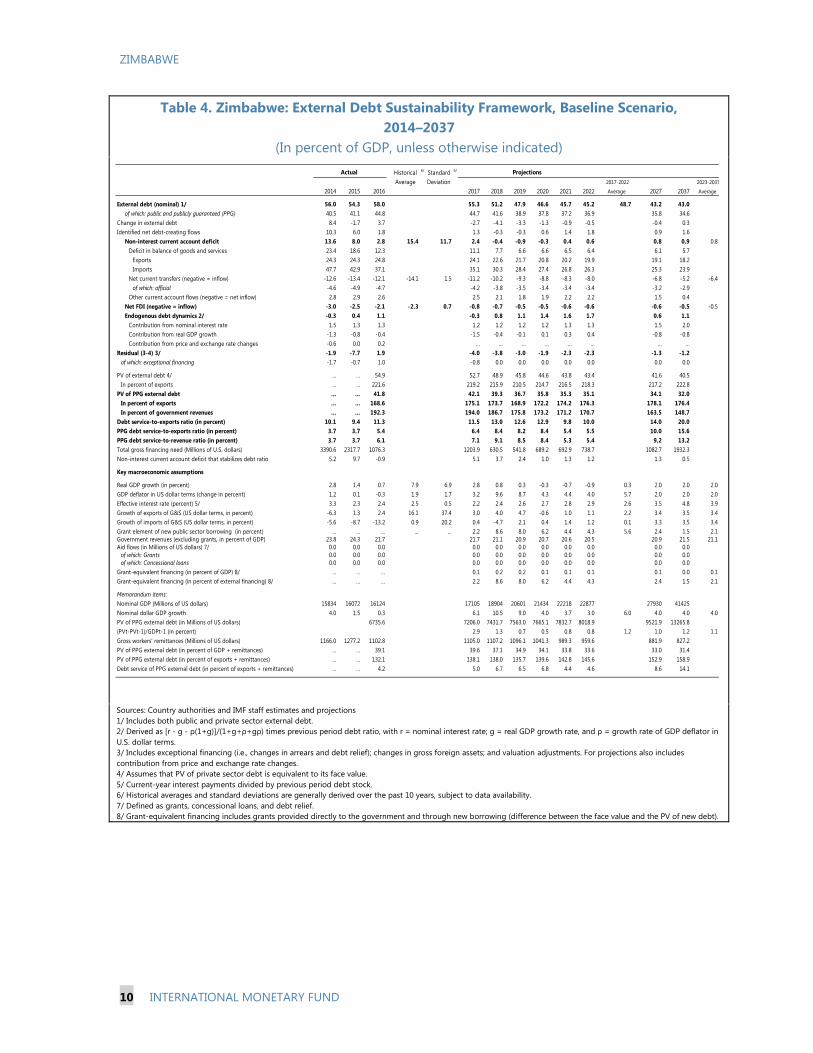
7. Zimbabwe remains in external debt distress. As of end-2016, with a present value (PV) of
PPG external debt-to-GDP ratio of 41.8 percent, a PV of debt-to-revenue ratio of 192.3 percent, and
a PV of debt-to-export ratio of 168.6 percent, Zimbabwe’s PPG external debt breached most
indicative thresholds. Moreover, per the assumptions in the baseline scenario, external debt in
relation to exports remains above the threshold throughout the 20-year projection period by a
substantial margin of around 70 percent. (Table 4 and Figure 3). The results suggest that absent
much stronger growth or more concessional financing and debt relief, Zimbabwe has little chance
of emerging from its debt problems even in the long term. These outturns, together with the
existence of substantial arrears and ongoing negotiations on debt restructuring, support the
determination that Zimbabwe is in external debt distress.
2 The external DSA is based on official statistics on the debt contracted and/or guaranteed by the central
government, and on estimates for the private sector.
3 The data on private sector external debt is based on available data and staff estimates; therefore, it might not cover
the entirety of the debt stock.
ZIMBABWE
INTERNATIONAL MONETARY FUND 5
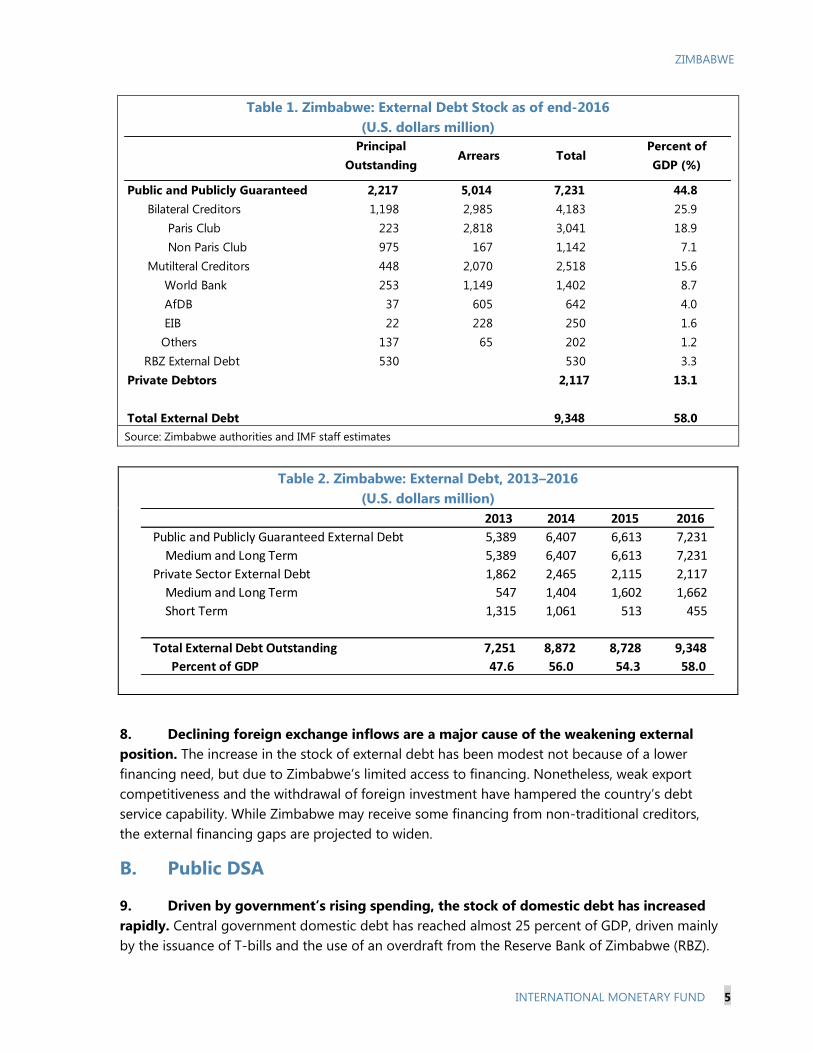
Table 1. Zimbabwe: External Debt Stock as of end-2016
(U.S. dollars million)
Source: Zimbabwe authorities and IMF staff estimates
Table 2. Zimbabwe: External Debt, 2013–2016
(U.S. dollars million)
8. Declining foreign exchange inflows are a major cause of the weakening external
position. The increase in the stock of external debt has been modest not because of a lower
financing need, but due to Zimbabwe’s limited access to financing. Nonetheless, weak export
competitiveness and the withdrawal of foreign investment have hampered the country’s debt
service capability. While Zimbabwe may receive some financing from non-traditional creditors,
the external financing gaps are projected to widen.
B. Public DSA
9. Driven by government’s rising spending, the stock of domestic debt has increased
rapidly. Central government domestic debt has reached almost 25 percent of GDP, driven mainly
by the issuance of T-bills and the use of an overdraft from the Reserve Bank of Zimbabwe (RBZ).
Public and Publicly Guaranteed 2,217 5,014 7,231 44.8
Bilateral Creditors 1,198 2,985 4,183 25.9
Paris Club 223 2,818 3,041 18.9
Non Paris Club 975 167 1,142 7.1
Mutilteral Creditors 448 2,070 2,518 15.6
World Bank 253 1,149 1,402 8.7
AfDB 37 605 642 4.0
EIB 22 228 250 1.6
Others 137 65 202 1.2
RBZ External Debt 530 530 3.3
Private Debtors 2,117 13.1
Total External Debt 9,348 58.0
Principal
Outstanding
Percent of
GDP (%)TotalArrears
2013 2014 2015 2016
Public and Publicly Guaranteed External Debt 5,389 6,407 6,613 7,231
Medium and Long Term 5,389 6,407 6,613 7,231
Private Sector External Debt 1,862 2,465 2,115 2,117
Medium and Long Term 547 1,404 1,602 1,662
Short Term 1,315 1,061 513 455
Total External Debt Outstanding 7,251 8,872 8,728 9,348
Percent of GDP 47.6 56.0 54.3 58.0
ZIMBABWE
6 INTERNATIONAL MONETARY FUND
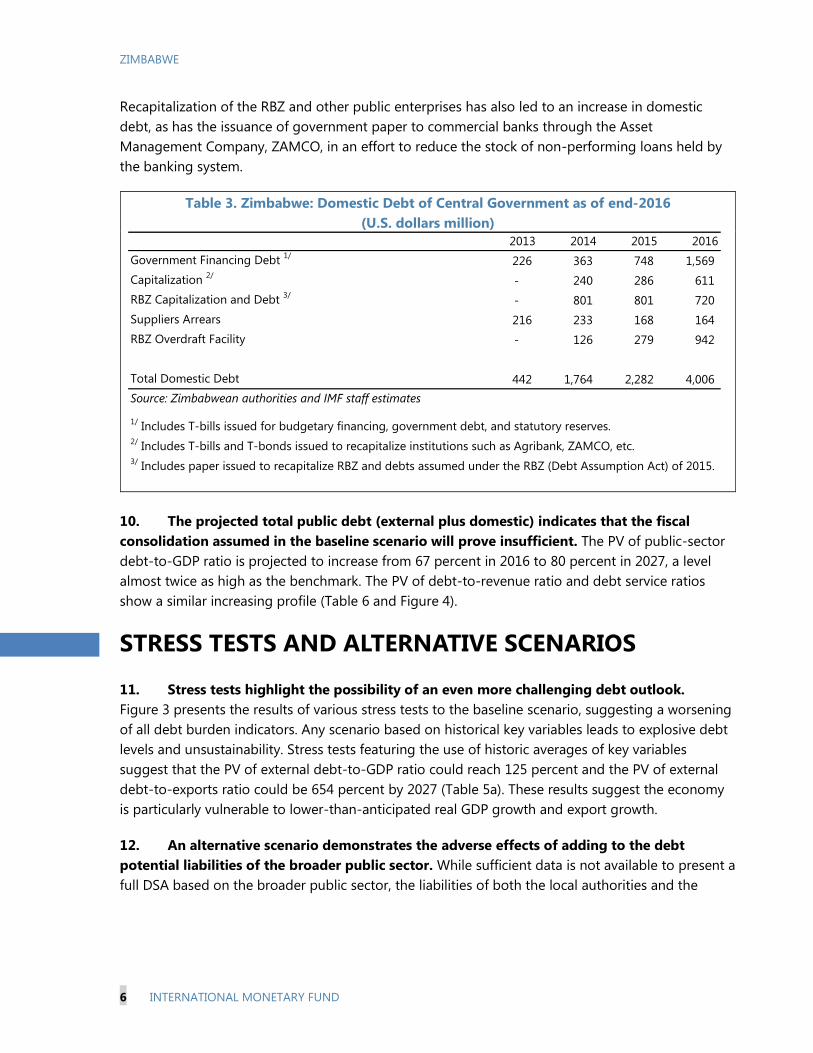
Recapitalization of the RBZ and other public enterprises has also led to an increase in domestic
debt, as has the issuance of government paper to commercial banks through the Asset
Management Company, ZAMCO, in an effort to reduce the stock of non-performing loans held by
the banking system.
Table 3. Zimbabwe: Domestic Debt of Central Government as of end-2016
(U.S. dollars million)
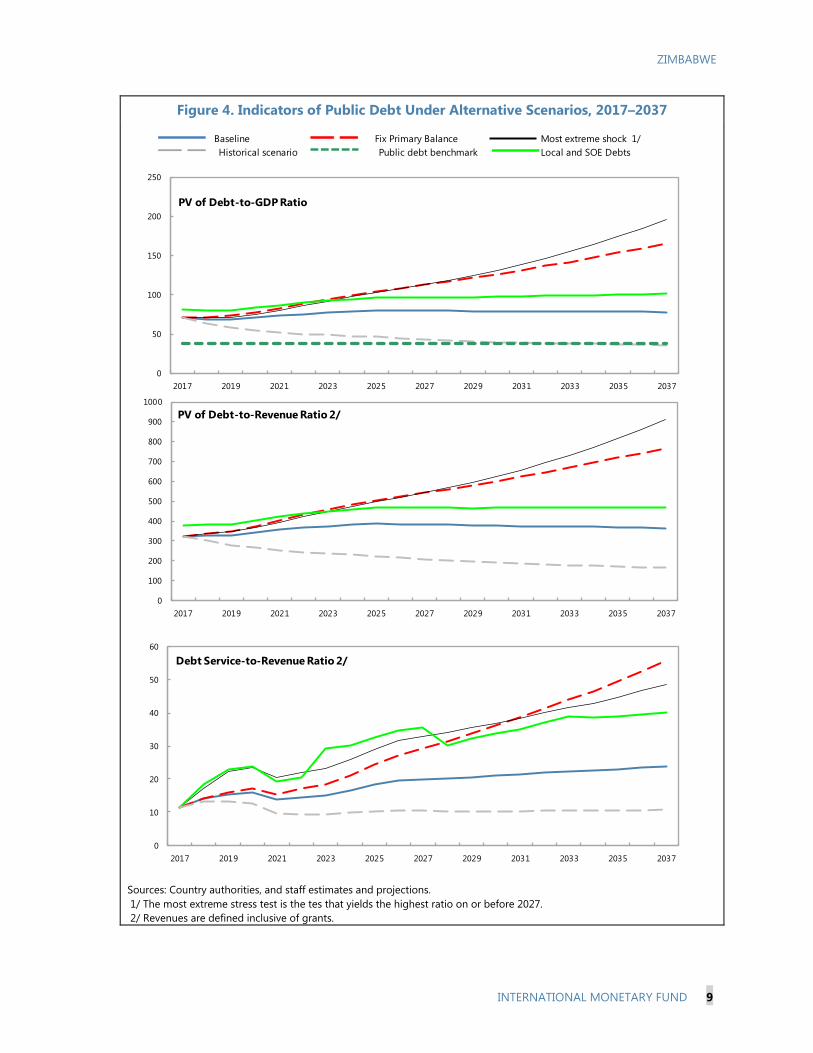
10. The projected total public debt (external plus domestic) indicates that the fiscal
consolidation assumed in the baseline scenario will prove insufficient. The PV of public-sector
debt-to-GDP ratio is projected to increase from 67 percent in 2016 to 80 percent in 2027, a level
almost twice as high as the benchmark. The PV of debt-to-revenue ratio and debt service ratios
show a similar increasing profile (Table 6 and Figure 4).
STRESS TESTS AND ALTERNATIVE SCENARIOS
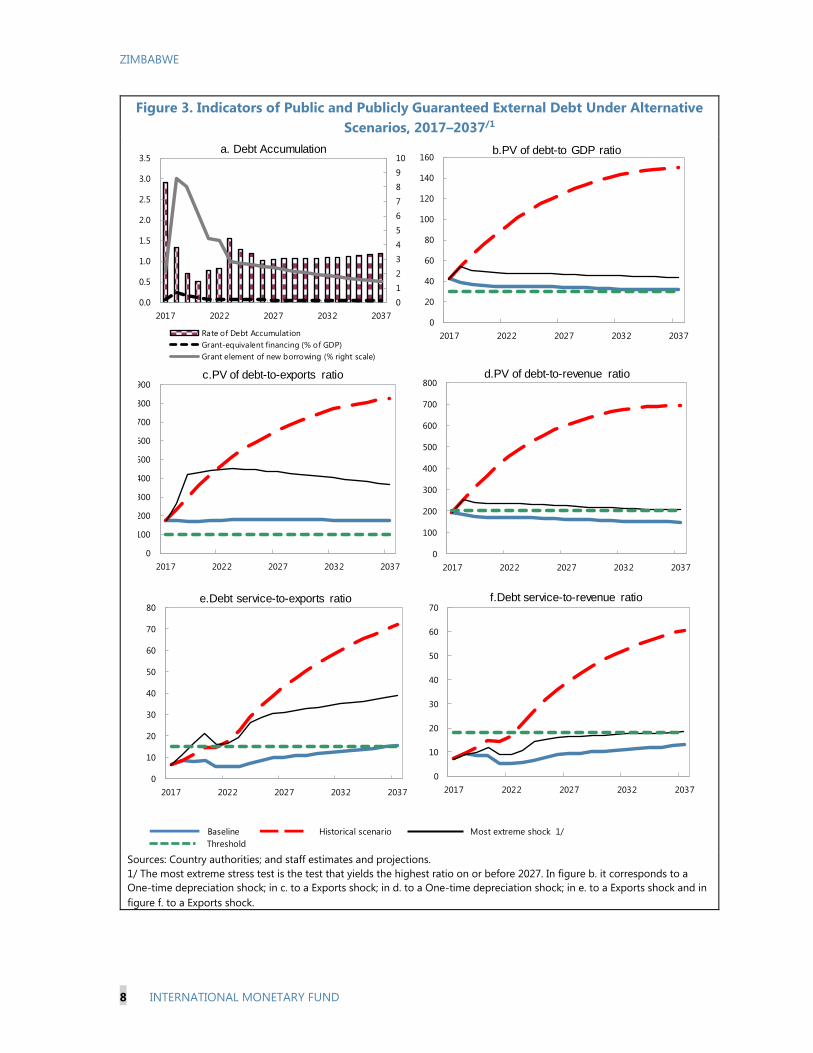
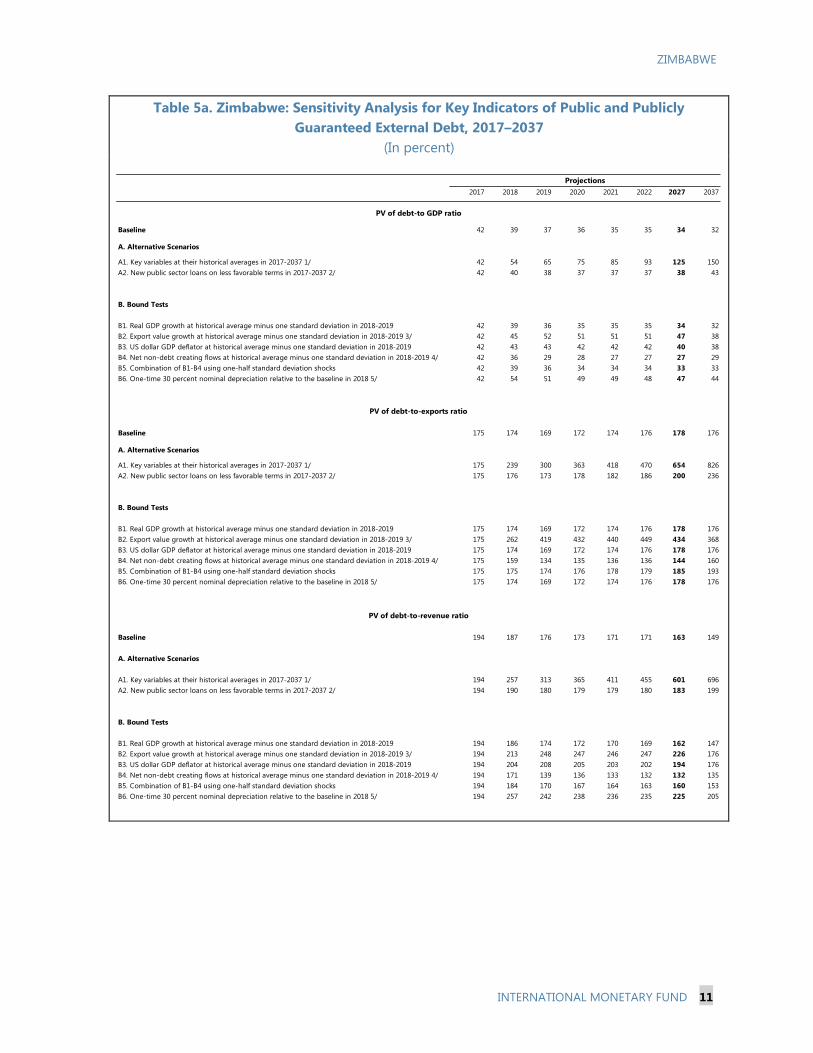
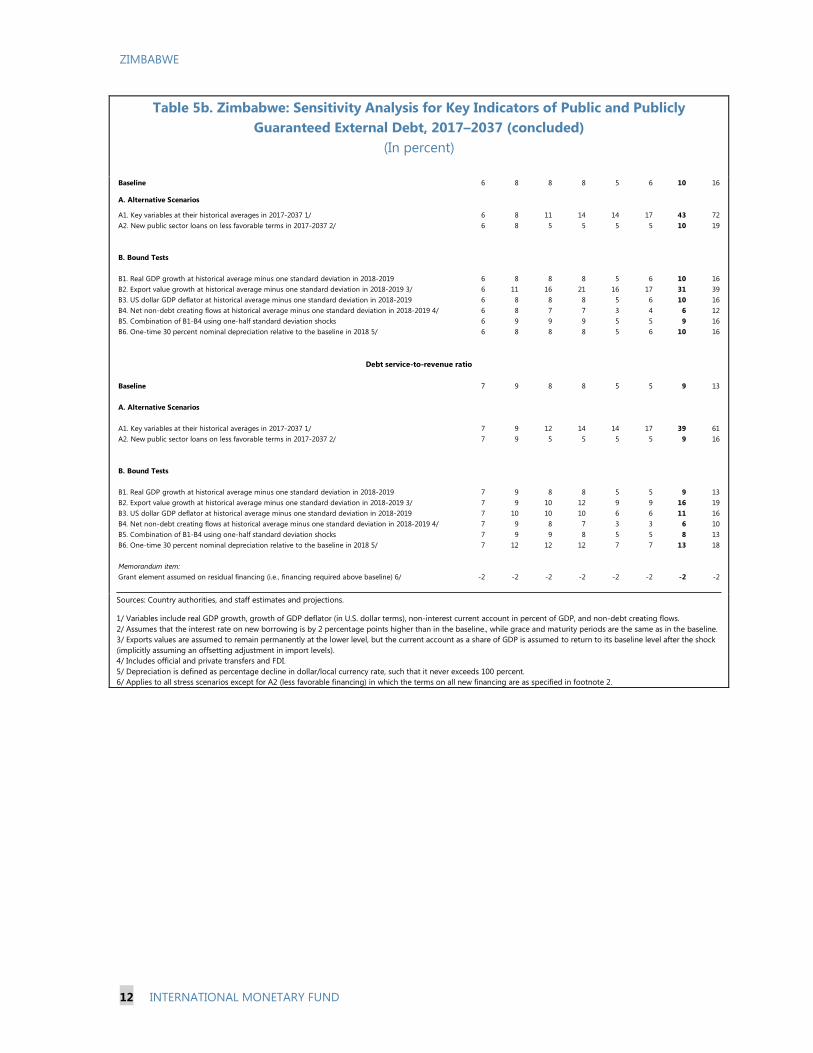
11. Stress tests highlight the possibility of an even more challenging debt outlook.
Figure 3 presents the results of various stress tests to the baseline scenario, suggesting a worsening
of all debt burden indicators. Any scenario based on historical key variables leads to explosive debt
levels and unsustainability. Stress tests featuring the use of historic averages of key variables
suggest that the PV of external debt-to-GDP ratio could reach 125 percent and the PV of external
debt-to-exports ratio could be 654 percent by 2027 (Table 5a). These results suggest the economy
is particularly vulnerable to lower-than-anticipated real GDP growth and export growth.
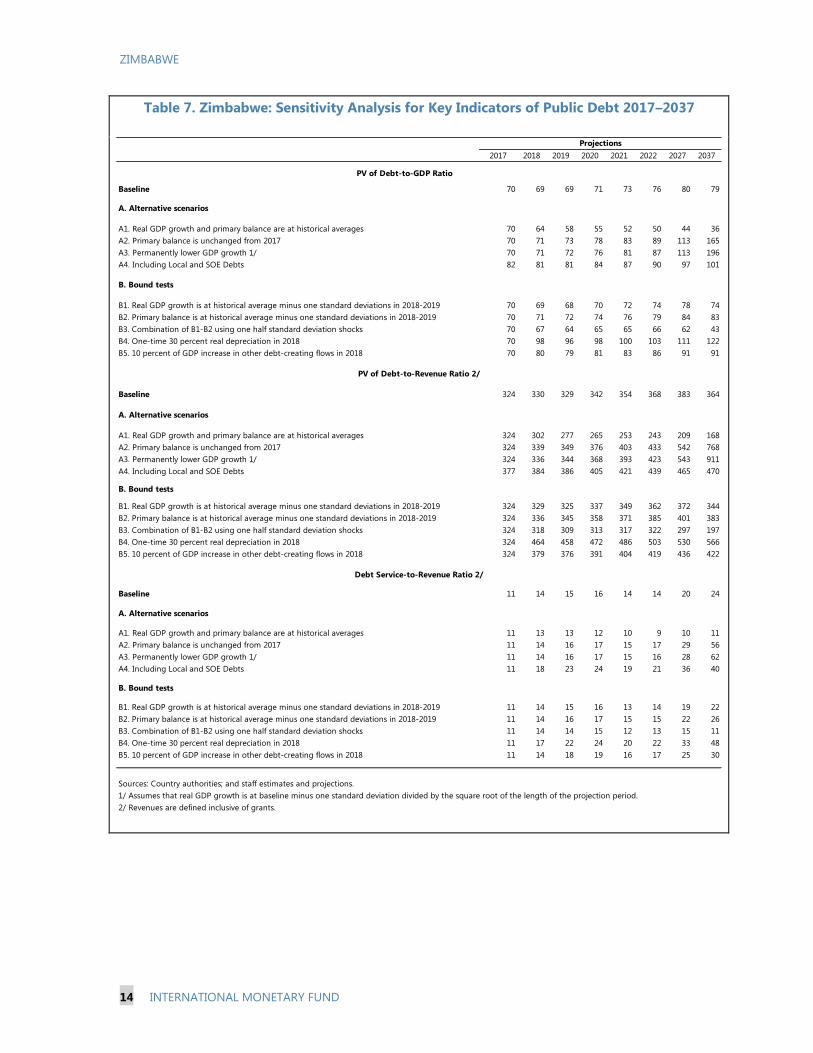
12. An alternative scenario demonstrates the adverse effects of adding to the debt
potential liabilities of the broader public sector. While sufficient data is not available to present a
full DSA based on the broader public sector, the liabilities of both the local authorities and the
2013 2014 2015 2016
Government Financing Debt 1/
226 363 748 1,569
Capitalization 2/
- 240 286 611
RBZ Capitalization and Debt 3/
- 801 801 720
Suppliers Arrears 216 233 168 164
RBZ Overdraft Facility - 126 279 942
Total Domestic Debt 442 1,764 2,282 4,006
Source: Zimbabwean authorities and IMF staff estimates
1/ Includes T-bills issued for budgetary financing, government debt, and statutory reserves.
2/ Includes T-bills and T-bonds issued to recapitalize institutions such as Agribank, ZAMCO, etc.
3/ Includes paper issued to recapitalize RBZ and debts assumed under the RBZ (Debt Assumption Act) of 2015.
ZIMBABWE
INTERNATIONAL MONETARY FUND 7
State-Owned Enterprises (SOEs) are high and growing.4 The debt stock of local governments
reached an estimated $555 million in 2015 (3.4 percent of GDP)5, while the debt of nonfinancial
public corporations stood at around $440 million as of end-2016 (2.7 percent of GDP). Contingent
liabilities stemming from transport projects are estimated at just under $1 billion (6.2 percent of
GDP). For illustrative purposes, if these obligations were to be added to the central government’s
stock of debt in 2017, the PV of public debt-to-GDP ratio would increase by 12 percentage points to
82 percent. Assuming no adjustment, the gap with the baseline scenario would continue to widen to
22 percent over the projection period, as additional debt service would have to be paid with new
borrowing (were the government able to contract such new loans) (Table 7).
CONCLUSION
13. Zimbabwe is in debt distress. In addition to the already excessive external debt burden
that led the country to incur arrears, Zimbabwe has now accumulated significant domestic debt, to
the point where domestic financing of the deficit has begun to undermine the competitiveness of
the private sector. Furthermore, the debt indicators are not projected to improve much on current
policies, and are estimated to worsen under the various shock scenarios.
14. The adoption of an ambitious set of policies is essential if Zimbabwe is to emerge
from its current difficulties. Sharp fiscal adjustment and bold structural reforms to restore growth
and attract investment are necessary to this end. Furthermore, external support and debt relief from
the international community must be part of the strategy. Supported by a robust reform program,
the envisaged reengagement process could bear fruit and restore growth and sustainability.
4 See Government of Zimbabwe and World Bank (2017), Public Expenditure Review, forthcoming, for a fuller
discussion.
5 ibid.
ZIMBABWE
8 INTERNATIONAL MONETARY FUND
Figure 3. Indicators of Public and Publicly Guaranteed External Debt Under Alternative
Scenarios, 2017–2037/1
Sources: Country authorities; and staff estimates and projections.
1/ The most extreme stress test is the test that yields the highest ratio on or before 2027. In figure b. it corresponds to a
One-time depreciation shock; in c. to a Exports shock; in d. to a One-time depreciation shock; in e. to a Exports shock and in
figure f. to a Exports shock.
Figure XXX. Zimbabwe: Indicators of Public and Publicly Guaranteed External Debt
under Alternatives Scenarios, 2017-2037 1/
Baseline Historical scenario Most extreme shock 1/
Threshold
0
10
20
30
40
50
60
70
2017 2022 2027 2032 2037
f.Debt service-to-revenue ratio
0
1
2
3
4
5
6
7
8
9
10
0.0
0.5
1.0
1.5
2.0
2.5
3.0
3.5
2017 2022 2027 2032 2037
Rate of Debt Accumulation
Grant-equivalent financing (% of GDP)
Grant element of new borrowing (% right scale)
a. Debt Accumulation
0
100
200
300
400
500
600
700
800
900
2017 2022 2027 2032 2037
c.PV of debt-to-exports ratio
0
20
40
60
80
100
120
140
160
2017 2022 2027 2032 2037
b.PV of debt-to GDP ratio
0
100
200
300
400
500
600
700
800
2017 2022 2027 2032 2037
d.PV of debt-to-revenue ratio
0
10
20
30
40
50
60
70
80
2017 2022 2027 2032 2037
e.Debt service-to-exports ratio
ZIMBABWE
INTERNATIONAL MONETARY FUND 9
Figure 4. Indicators of Public Debt Under Alternative Scenarios, 2017–2037
Sources: Country authorities, and staff estimates and projections.
1/ The most extreme stress test is the tes that yields the highest ratio on or before 2027.
2/ Revenues are defined inclusive of grants.
Most extreme shock Growth LTBaseline
Public debt benchmark
Most extreme shock 1/
Local and SOE DebtsHistorical scenario
Fix Primary Balance
0
100
200
300
400
500
600
700
800
900
1000
2017 2019 2021 2023 2025 2027 2029 2031 2033 2035 2037
PV of Debt-to-Revenue Ratio 2/
0
50
100
150
200
250
2017 2019 2021 2023 2025 2027 2029 2031 2033 2035 2037
PV of Debt-to-GDP Ratio
0
10
20
30
40
50
60
2017 2019 2021 2023 2025 2027 2029 2031 2033 2035 2037
Debt Service-to-Revenue Ratio 2/
ZIMBABWE
10 INTERNATIONAL MONETARY FUND
Table 4. Zimbabwe: External Debt Sustainability Framework, Baseline Scenario,
2014–2037
(In percent of GDP, unless otherwise indicated)
Sources: Country authorities and IMF staff estimates and projections
1/ Includes both public and private sector external debt.
2/ Derived as [r - g - ρ(1+g)]/(1+g+ρ+gρ) times previous period debt ratio, with r = nominal interest rate; g = real GDP growth rate, and ρ = growth rate of GDP deflator in
U.S. dollar terms.
3/ Includes exceptional financing (i.e., changes in arrears and debt relief); changes in gross foreign assets; and valuation adjustments. For projections also includes
contribution from price and exchange rate changes.
4/ Assumes that PV of private sector debt is equivalent to its face value.
5/ Current-year interest payments divided by previous period debt stock.
6/ Historical averages and standard deviations are generally derived over the past 10 years, subject to data availability.
7/ Defined as grants, concessional loans, and debt relief.
8/ Grant-equivalent financing includes grants provided directly to the government and through new borrowing (difference between the face value and the PV of new debt).
Historical6/
Standard6/
Average Deviation 2017-2022 2023-2037
2014 2015 2016 2017 2018 2019 2020 2021 2022 Average 2027 2037 Average
External debt (nominal) 1/ 56.0 54.3 58.0 55.3 51.2 47.9 46.6 45.7 45.2 48.7 43.2 43.0
of which: public and publicly guaranteed (PPG) 40.5 41.1 44.8 44.7 41.6 38.9 37.8 37.2 36.9 35.8 34.6
Change in external debt 8.4 -1.7 3.7 -2.7 -4.1 -3.3 -1.3 -0.9 -0.5 -0.4 0.3
Identified net debt-creating flows 10.3 6.0 1.8 1.3 -0.3 -0.3 0.6 1.4 1.8 0.9 1.6
Non-interest current account deficit 13.6 8.0 2.8 15.4 11.7 2.4 -0.4 -0.9 -0.3 0.4 0.6 0.8 0.9 0.8
Deficit in balance of goods and services 23.4 18.6 12.3 11.1 7.7 6.6 6.6 6.5 6.4 6.1 5.7
Exports 24.3 24.3 24.8 24.1 22.6 21.7 20.8 20.2 19.9 19.1 18.2
Imports 47.7 42.9 37.1 35.1 30.3 28.4 27.4 26.8 26.3 25.3 23.9
Net current transfers (negative = inflow) -12.6 -13.4 -12.1 -14.1 1.5 -11.2 -10.2 -9.3 -8.8 -8.3 -8.0 -6.8 -5.2 -6.4
of which: official -4.6 -4.9 -4.7 -4.2 -3.8 -3.5 -3.4 -3.4 -3.4 -3.2 -2.9
Other current account flows (negative = net inflow) 2.8 2.9 2.6 2.5 2.1 1.8 1.9 2.2 2.2 1.5 0.4
Net FDI (negative = inflow) -3.0 -2.5 -2.1 -2.3 0.7 -0.8 -0.7 -0.5 -0.5 -0.6 -0.6 -0.6 -0.5 -0.5
Endogenous debt dynamics 2/ -0.3 0.4 1.1 -0.3 0.8 1.1 1.4 1.6 1.7 0.6 1.1
Contribution from nominal interest rate 1.5 1.3 1.3 1.2 1.2 1.2 1.2 1.3 1.3 1.5 2.0
Contribution from real GDP growth -1.3 -0.8 -0.4 -1.5 -0.4 -0.1 0.1 0.3 0.4 -0.8 -0.8
Contribution from price and exchange rate changes -0.6 0.0 0.2 … … … … … … … …
Residual (3-4) 3/ -1.9 -7.7 1.9 -4.0 -3.8 -3.0 -1.9 -2.3 -2.3 -1.3 -1.2
of which: exceptional financing -1.7 -0.7 1.0 -0.8 0.0 0.0 0.0 0.0 0.0 0.0 0.0
PV of external debt 4/ ... ... 54.9 52.7 48.9 45.8 44.6 43.8 43.4 41.6 40.5
In percent of exports ... ... 221.6 219.2 215.9 210.5 214.7 216.5 218.3 217.2 222.8
PV of PPG external debt ... ... 41.8 42.1 39.3 36.7 35.8 35.3 35.1 34.1 32.0
In percent of exports ... ... 168.6 175.1 173.7 168.9 172.2 174.2 176.3 178.1 176.4
In percent of government revenues ... ... 192.3 194.0 186.7 175.8 173.2 171.2 170.7 163.5 148.7
Debt service-to-exports ratio (in percent) 10.1 9.4 11.3 11.5 13.0 12.6 12.9 9.8 10.0 14.0 20.0
PPG debt service-to-exports ratio (in percent) 3.7 3.7 5.4 6.4 8.4 8.2 8.4 5.4 5.5 10.0 15.6
PPG debt service-to-revenue ratio (in percent) 3.7 3.7 6.1 7.1 9.1 8.5 8.4 5.3 5.4 9.2 13.2
Total gross financing need (Millions of U.S. dollars) 3390.6 2317.7 1076.3 1203.9 630.5 541.8 689.2 692.9 738.7 1082.7 1932.3
Non-interest current account deficit that stabilizes debt ratio 5.2 9.7 -0.9 5.1 3.7 2.4 1.0 1.3 1.2 1.3 0.5
Key macroeconomic assumptions
Real GDP growth (in percent) 2.8 1.4 0.7 7.9 6.9 2.8 0.8 0.3 -0.3 -0.7 -0.9 0.3 2.0 2.0 2.0
GDP deflator in US dollar terms (change in percent) 1.2 0.1 -0.3 1.9 1.7 3.2 9.6 8.7 4.3 4.4 4.0 5.7 2.0 2.0 2.0
Effective interest rate (percent) 5/ 3.3 2.3 2.4 2.5 0.5 2.2 2.4 2.6 2.7 2.8 2.9 2.6 3.5 4.8 3.9
Growth of exports of G&S (US dollar terms, in percent) -6.3 1.3 2.4 16.1 37.4 3.0 4.0 4.7 -0.6 1.0 1.1 2.2 3.4 3.5 3.4
Growth of imports of G&S (US dollar terms, in percent) -5.6 -8.7 -13.2 0.9 20.2 0.4 -4.7 2.1 0.4 1.4 1.2 0.1 3.3 3.5 3.4
Grant element of new public sector borrowing (in percent) ... ... ... ... ... 2.2 8.6 8.0 6.2 4.4 4.3 5.6 2.4 1.5 2.1
Government revenues (excluding grants, in percent of GDP) 23.8 24.3 21.7 21.7 21.1 20.9 20.7 20.6 20.5 20.9 21.5 21.1
Aid flows (in Millions of US dollars) 7/ 0.0 0.0 0.0 0.0 0.0 0.0 0.0 0.0 0.0 0.0 0.0
of which: Grants 0.0 0.0 0.0 0.0 0.0 0.0 0.0 0.0 0.0 0.0 0.0
of which: Concessional loans 0.0 0.0 0.0 0.0 0.0 0.0 0.0 0.0 0.0 0.0 0.0
Grant-equivalent financing (in percent of GDP) 8/ ... ... ... 0.1 0.2 0.2 0.1 0.1 0.1 0.1 0.0 0.1
Grant-equivalent financing (in percent of external financing) 8/ ... ... ... 2.2 8.6 8.0 6.2 4.4 4.3 2.4 1.5 2.1
Memorandum items:
Nominal GDP (Millions of US dollars) 15834 16072 16124 17105 18904 20601 21434 22218 22877 27930 41425
Nominal dollar GDP growth 4.0 1.5 0.3 6.1 10.5 9.0 4.0 3.7 3.0 6.0 4.0 4.0 4.0
PV of PPG external debt (in Millions of US dollars) 6735.6 7206.0 7431.7 7563.0 7665.1 7832.7 8018.9 9521.9 13265.8
(PVt-PVt-1)/GDPt-1 (in percent) 2.9 1.3 0.7 0.5 0.8 0.8 1.2 1.0 1.2 1.1
Gross workers' remittances (Millions of US dollars) 1166.0 1277.2 1102.8 1105.0 1107.2 1096.1 1041.3 989.3 959.6 881.9 827.2
PV of PPG external debt (in percent of GDP + remittances) ... ... 39.1 39.6 37.1 34.9 34.1 33.8 33.6 33.0 31.4
PV of PPG external debt (in percent of exports + remittances) ... ... 132.1 138.1 138.0 135.7 139.6 142.8 145.6 152.9 158.9
Debt service of PPG external debt (in percent of exports + remittances) ... ... 4.2 5.0 6.7 6.5 6.8 4.4 4.6 8.6 14.1
Actual Projections
ZIMBABWE
INTERNATIONAL MONETARY FUND 11
Table 5a. Zimbabwe: Sensitivity Analysis for Key Indicators of Public and Publicly
Guaranteed External Debt, 2017–2037
(In percent)
2017 2018 2019 2020 2021 2022 2027 2037
Baseline 42 39 37 36 35 35 34 32
A. Alternative Scenarios
A1. Key variables at their historical averages in 2017-2037 1/ 42 54 65 75 85 93 125 150
A2. New public sector loans on less favorable terms in 2017-2037 2/ 42 40 38 37 37 37 38 43
B. Bound Tests
B1. Real GDP growth at historical average minus one standard deviation in 2018-2019 42 39 36 35 35 35 34 32
B2. Export value growth at historical average minus one standard deviation in 2018-2019 3/ 42 45 52 51 51 51 47 38
B3. US dollar GDP deflator at historical average minus one standard deviation in 2018-2019 42 43 43 42 42 42 40 38
B4. Net non-debt creating flows at historical average minus one standard deviation in 2018-2019 4/ 42 36 29 28 27 27 27 29
B5. Combination of B1-B4 using one-half standard deviation shocks 42 39 36 34 34 34 33 33
B6. One-time 30 percent nominal depreciation relative to the baseline in 2018 5/ 42 54 51 49 49 48 47 44
Baseline 175 174 169 172 174 176 178 176
A. Alternative Scenarios
A1. Key variables at their historical averages in 2017-2037 1/ 175 239 300 363 418 470 654 826
A2. New public sector loans on less favorable terms in 2017-2037 2/ 175 176 173 178 182 186 200 236
B. Bound Tests
B1. Real GDP growth at historical average minus one standard deviation in 2018-2019 175 174 169 172 174 176 178 176
B2. Export value growth at historical average minus one standard deviation in 2018-2019 3/ 175 262 419 432 440 449 434 368
B3. US dollar GDP deflator at historical average minus one standard deviation in 2018-2019 175 174 169 172 174 176 178 176
B4. Net non-debt creating flows at historical average minus one standard deviation in 2018-2019 4/ 175 159 134 135 136 136 144 160
B5. Combination of B1-B4 using one-half standard deviation shocks 175 175 174 176 178 179 185 193
B6. One-time 30 percent nominal depreciation relative to the baseline in 2018 5/ 175 174 169 172 174 176 178 176
Baseline 194 187 176 173 171 171 163 149
A. Alternative Scenarios
A1. Key variables at their historical averages in 2017-2037 1/ 194 257 313 365 411 455 601 696
A2. New public sector loans on less favorable terms in 2017-2037 2/ 194 190 180 179 179 180 183 199
B. Bound Tests
B1. Real GDP growth at historical average minus one standard deviation in 2018-2019 194 186 174 172 170 169 162 147
B2. Export value growth at historical average minus one standard deviation in 2018-2019 3/ 194 213 248 247 246 247 226 176
B3. US dollar GDP deflator at historical average minus one standard deviation in 2018-2019 194 204 208 205 203 202 194 176
B4. Net non-debt creating flows at historical average minus one standard deviation in 2018-2019 4/ 194 171 139 136 133 132 132 135
B5. Combination of B1-B4 using one-half standard deviation shocks 194 184 170 167 164 163 160 153
B6. One-time 30 percent nominal depreciation relative to the baseline in 2018 5/ 194 257 242 238 236 235 225 205
PV of debt-to-exports ratio
PV of debt-to-revenue ratio
PV of debt-to GDP ratio
Projections
ZIMBABWE
12 INTERNATIONAL MONETARY FUND
Table 5b. Zimbabwe: Sensitivity Analysis for Key Indicators of Public and Publicly
Guaranteed External Debt, 2017–2037 (concluded)
(In percent)
Sources: Country authorities, and staff estimates and projections.
1/ Variables include real GDP growth, growth of GDP deflator (in U.S. dollar terms), non-interest current account in percent of GDP, and non-debt creating flows.
2/ Assumes that the interest rate on new borrowing is by 2 percentage points higher than in the baseline., while grace and maturity periods are the same as in the baseline.
3/ Exports values are assumed to remain permanently at the lower level, but the current account as a share of GDP is assumed to return to its baseline level after the shock
(implicitly assuming an offsetting adjustment in import levels).
4/ Includes official and private transfers and FDI.
5/ Depreciation is defined as percentage decline in dollar/local currency rate, such that it never exceeds 100 percent.
6/ Applies to all stress scenarios except for A2 (less favorable financing) in which the terms on all new financing are as specified in footnote 2.
Baseline 6 8 8 8 5 6 10 16
A. Alternative Scenarios
A1. Key variables at their historical averages in 2017-2037 1/ 6 8 11 14 14 17 43 72
A2. New public sector loans on less favorable terms in 2017-2037 2/ 6 8 5 5 5 5 10 19
B. Bound Tests
B1. Real GDP growth at historical average minus one standard deviation in 2018-2019 6 8 8 8 5 6 10 16
B2. Export value growth at historical average minus one standard deviation in 2018-2019 3/ 6 11 16 21 16 17 31 39
B3. US dollar GDP deflator at historical average minus one standard deviation in 2018-2019 6 8 8 8 5 6 10 16
B4. Net non-debt creating flows at historical average minus one standard deviation in 2018-2019 4/ 6 8 7 7 3 4 6 12
B5. Combination of B1-B4 using one-half standard deviation shocks 6 9 9 9 5 5 9 16
B6. One-time 30 percent nominal depreciation relative to the baseline in 2018 5/ 6 8 8 8 5 6 10 16
Baseline 7 9 8 8 5 5 9 13
A. Alternative Scenarios
A1. Key variables at their historical averages in 2017-2037 1/ 7 9 12 14 14 17 39 61
A2. New public sector loans on less favorable terms in 2017-2037 2/ 7 9 5 5 5 5 9 16
B. Bound Tests
B1. Real GDP growth at historical average minus one standard deviation in 2018-2019 7 9 8 8 5 5 9 13
B2. Export value growth at historical average minus one standard deviation in 2018-2019 3/ 7 9 10 12 9 9 16 19
B3. US dollar GDP deflator at historical average minus one standard deviation in 2018-2019 7 10 10 10 6 6 11 16
B4. Net non-debt creating flows at historical average minus one standard deviation in 2018-2019 4/ 7 9 8 7 3 3 6 10
B5. Combination of B1-B4 using one-half standard deviation shocks 7 9 9 8 5 5 8 13
B6. One-time 30 percent nominal depreciation relative to the baseline in 2018 5/ 7 12 12 12 7 7 13 18
Memorandum item:
Grant element assumed on residual financing (i.e., financing required above baseline) 6/ -2 -2 -2 -2 -2 -2 -2 -2
Debt service-to-revenue ratio
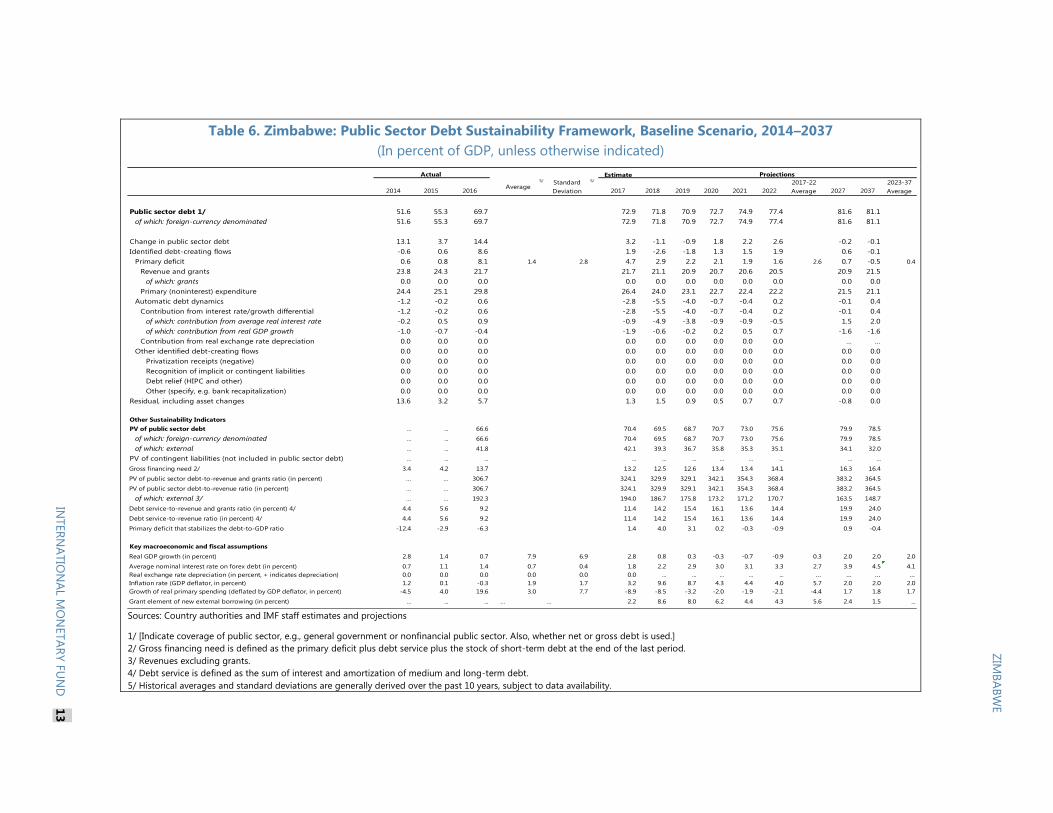
Table 6. Zimbabwe: Public Sector Debt Sustainability Framework, Baseline Scenario, 2014–2037
(In percent of GDP, unless otherwise indicated)
Sources: Country authorities and IMF staff estimates and projections
1/ [Indicate coverage of public sector, e.g., general government or nonfinancial public sector. Also, whether net or gross debt is used.]
2/ Gross financing need is defined as the primary deficit plus debt service plus the stock of short-term debt at the end of the last period.
3/ Revenues excluding grants.
4/ Debt service is defined as the sum of interest and amortization of medium and long-term debt.
5/ Historical averages and standard deviations are generally derived over the past 10 years, subject to data availability.
Estimate
2014 2015 2016Average
5/ Standard
Deviation
5/
2017 2018 2019 2020 2021 2022
2017-22
Average 2027 2037
2023-37
Average
Public sector debt 1/ 51.6 55.3 69.7 72.9 71.8 70.9 72.7 74.9 77.4 81.6 81.1
of which: foreign-currency denominated 51.6 55.3 69.7 72.9 71.8 70.9 72.7 74.9 77.4 81.6 81.1
Change in public sector debt 13.1 3.7 14.4 3.2 -1.1 -0.9 1.8 2.2 2.6 -0.2 -0.1
Identified debt-creating flows -0.6 0.6 8.6 1.9 -2.6 -1.8 1.3 1.5 1.9 0.6 -0.1
Primary deficit 0.6 0.8 8.1 1.4 2.8 4.7 2.9 2.2 2.1 1.9 1.6 2.6 0.7 -0.5 0.4
Revenue and grants 23.8 24.3 21.7 21.7 21.1 20.9 20.7 20.6 20.5 20.9 21.5
of which: grants 0.0 0.0 0.0 0.0 0.0 0.0 0.0 0.0 0.0 0.0 0.0
Primary (noninterest) expenditure 24.4 25.1 29.8 26.4 24.0 23.1 22.7 22.4 22.2 21.5 21.1
Automatic debt dynamics -1.2 -0.2 0.6 -2.8 -5.5 -4.0 -0.7 -0.4 0.2 -0.1 0.4
Contribution from interest rate/growth differential -1.2 -0.2 0.6 -2.8 -5.5 -4.0 -0.7 -0.4 0.2 -0.1 0.4
of which: contribution from average real interest rate -0.2 0.5 0.9 -0.9 -4.9 -3.8 -0.9 -0.9 -0.5 1.5 2.0
of which: contribution from real GDP growth -1.0 -0.7 -0.4 -1.9 -0.6 -0.2 0.2 0.5 0.7 -1.6 -1.6
Contribution from real exchange rate depreciation 0.0 0.0 0.0 0.0 0.0 0.0 0.0 0.0 0.0 ... ...
Other identified debt-creating flows 0.0 0.0 0.0 0.0 0.0 0.0 0.0 0.0 0.0 0.0 0.0
Privatization receipts (negative) 0.0 0.0 0.0 0.0 0.0 0.0 0.0 0.0 0.0 0.0 0.0
Recognition of implicit or contingent liabilities 0.0 0.0 0.0 0.0 0.0 0.0 0.0 0.0 0.0 0.0 0.0
Debt relief (HIPC and other) 0.0 0.0 0.0 0.0 0.0 0.0 0.0 0.0 0.0 0.0 0.0
Other (specify, e.g. bank recapitalization) 0.0 0.0 0.0 0.0 0.0 0.0 0.0 0.0 0.0 0.0 0.0
Residual, including asset changes 13.6 3.2 5.7 1.3 1.5 0.9 0.5 0.7 0.7 -0.8 0.0
Other Sustainability Indicators
PV of public sector debt ... ... 66.6 70.4 69.5 68.7 70.7 73.0 75.6 79.9 78.5
of which: foreign-currency denominated ... ... 66.6 70.4 69.5 68.7 70.7 73.0 75.6 79.9 78.5
of which: external ... ... 41.8 42.1 39.3 36.7 35.8 35.3 35.1 34.1 32.0
PV of contingent liabilities (not included in public sector debt) ... ... ... ... ... ... ... ... ... ... ...
Gross financing need 2/ 3.4 4.2 13.7 13.2 12.5 12.6 13.4 13.4 14.1 16.3 16.4
PV of public sector debt-to-revenue and grants ratio (in percent) … … 306.7 324.1 329.9 329.1 342.1 354.3 368.4 383.2 364.5
PV of public sector debt-to-revenue ratio (in percent) … … 306.7 324.1 329.9 329.1 342.1 354.3 368.4 383.2 364.5
of which: external 3/ … … 192.3 194.0 186.7 175.8 173.2 171.2 170.7 163.5 148.7
Debt service-to-revenue and grants ratio (in percent) 4/ 4.4 5.6 9.2 11.4 14.2 15.4 16.1 13.6 14.4 19.9 24.0
Debt service-to-revenue ratio (in percent) 4/ 4.4 5.6 9.2 11.4 14.2 15.4 16.1 13.6 14.4 19.9 24.0
Primary deficit that stabilizes the debt-to-GDP ratio -12.4 -2.9 -6.3 1.4 4.0 3.1 0.2 -0.3 -0.9 0.9 -0.4
Key macroeconomic and fiscal assumptions
Real GDP growth (in percent) 2.8 1.4 0.7 7.9 6.9 2.8 0.8 0.3 -0.3 -0.7 -0.9 0.3 2.0 2.0 2.0
Average nominal interest rate on forex debt (in percent) 0.7 1.1 1.4 0.7 0.4 1.8 2.2 2.9 3.0 3.1 3.3 2.7 3.9 4.5 4.1
Real exchange rate depreciation (in percent, + indicates depreciation) 0.0 0.0 0.0 0.0 0.0 0.0 ... ... ... ... ... ... ... ... ...
Inflation rate (GDP deflator, in percent) 1.2 0.1 -0.3 1.9 1.7 3.2 9.6 8.7 4.3 4.4 4.0 5.7 2.0 2.0 2.0
Growth of real primary spending (deflated by GDP deflator, in percent) -4.5 4.0 19.6 3.0 7.7 -8.9 -8.5 -3.2 -2.0 -1.9 -2.1 -4.4 1.7 1.8 1.7
Grant element of new external borrowing (in percent) ... ... ... … … 2.2 8.6 8.0 6.2 4.4 4.3 5.6 2.4 1.5 ...
Actual Projections
INTER
NA
TIO
NA
L MO
NETA
RY F
UN
D
13
ZIM
BA
BW
E
ZIMBABWE
14 INTERNATIONAL MONETARY FUND
Table 7. Zimbabwe: Sensitivity Analysis for Key Indicators of Public Debt 2017–2037
2017 2018 2019 2020 2021 2022 2027 2037
Baseline 70 69 69 71 73 76 80 79
A. Alternative scenarios
A1. Real GDP growth and primary balance are at historical averages 70 64 58 55 52 50 44 36
A2. Primary balance is unchanged from 2017 70 71 73 78 83 89 113 165
A3. Permanently lower GDP growth 1/ 70 71 72 76 81 87 113 196
A4. Including Local and SOE Debts 82 81 81 84 87 90 97 101
B. Bound tests
B1. Real GDP growth is at historical average minus one standard deviations in 2018-2019 70 69 68 70 72 74 78 74
B2. Primary balance is at historical average minus one standard deviations in 2018-2019 70 71 72 74 76 79 84 83
B3. Combination of B1-B2 using one half standard deviation shocks 70 67 64 65 65 66 62 43
B4. One-time 30 percent real depreciation in 2018 70 98 96 98 100 103 111 122
B5. 10 percent of GDP increase in other debt-creating flows in 2018 70 80 79 81 83 86 91 91
Baseline 324 330 329 342 354 368 383 364
A. Alternative scenarios
A1. Real GDP growth and primary balance are at historical averages 324 302 277 265 253 243 209 168
A2. Primary balance is unchanged from 2017 324 339 349 376 403 433 542 768
A3. Permanently lower GDP growth 1/ 324 336 344 368 393 423 543 911
A4. Including Local and SOE Debts 377 384 386 405 421 439 465 470
B. Bound tests
B1. Real GDP growth is at historical average minus one standard deviations in 2018-2019 324 329 325 337 349 362 372 344
B2. Primary balance is at historical average minus one standard deviations in 2018-2019 324 336 345 358 371 385 401 383
B3. Combination of B1-B2 using one half standard deviation shocks 324 318 309 313 317 322 297 197
B4. One-time 30 percent real depreciation in 2018 324 464 458 472 486 503 530 566
B5. 10 percent of GDP increase in other debt-creating flows in 2018 324 379 376 391 404 419 436 422
Baseline 11 14 15 16 14 14 20 24
A. Alternative scenarios
A1. Real GDP growth and primary balance are at historical averages 11 13 13 12 10 9 10 11
A2. Primary balance is unchanged from 2017 11 14 16 17 15 17 29 56
A3. Permanently lower GDP growth 1/ 11 14 16 17 15 16 28 62
A4. Including Local and SOE Debts 11 18 23 24 19 21 36 40
B. Bound tests
B1. Real GDP growth is at historical average minus one standard deviations in 2018-2019 11 14 15 16 13 14 19 22
B2. Primary balance is at historical average minus one standard deviations in 2018-2019 11 14 16 17 15 15 22 26
B3. Combination of B1-B2 using one half standard deviation shocks 11 14 14 15 12 13 15 11
B4. One-time 30 percent real depreciation in 2018 11 17 22 24 20 22 33 48
B5. 10 percent of GDP increase in other debt-creating flows in 2018 11 14 18 19 16 17 25 30
Sources: Country authorities; and staff estimates and projections.
1/ Assumes that real GDP growth is at baseline minus one standard deviation divided by the square root of the length of the projection period.
2/ Revenues are defined inclusive of grants.
PV of Debt-to-GDP Ratio
Projections
PV of Debt-to-Revenue Ratio 2/
Debt Service-to-Revenue Ratio 2/