burkina faso: staff report for 2009 article iv
TRANSCRIPT
© 2010 International Monetary Fund January 2010 IMF Country Report No. 10/7 January 8, 2009 January 28, 2009 xxxJanuary 29, 2001 xxxJanuary 29, 2001 January 28, 2009 Burkina Faso: Staff Report for 2009 Article IV Consultation, Fifth Review Under the Poverty Reduction and Growth Facility, and Requests for Augmentation of Access and Modification of Performance Criteria The following documents have been released and are included in this package: • The staff report, prepared by a staff team of the IMF, following discussions that ended on
October 2, 2009, with the officials of Burkina Faso on economic developments and policies. Based on information available at the time of these discussions, the staff report was completed on December 1, 2009. The views expressed in the staff report are those of the staff team and do not necessarily reflect the views of the Executive Board of the IMF.
• A Public Information Notice (PIN).
• A Press Release.
• A statement by the Executive Director for Burkina Faso.
The document(s) listed below will be separately released. Letter of Intent sent to the IMF by the authorities of Burkina Faso*
Memorandum of Economic and Financial Policies by the authorities of Burkina Faso* Technical Memorandum of Understanding* *Also included in Staff Report
The policy of publication of staff reports and other documents allows for the deletion of market-sensitive information.
Copies of this report are available to the public from
International Monetary Fund • Publication Services 700 19th Street, N.W. • Washington, D.C. 20431
Telephone: (202) 623-7430 • Telefax: (202) 623-7201 E-mail: [email protected] Internet: http://www.imf.org
International Monetary Fund
Washington, D.C.
INTERNATIONAL MONETARY FUND
BURKINA FASO Staff Report for the 2009 Article IV Consultation, Fifth Review Under the Poverty
Reduction and Growth Facility, and Requests for Augmentation of Access and Modification of Performance Criteria
Prepared by the African Department
(In collaboration with other departments)
Approved by Peter Allum and Dominique Desruelle
November 30, 2009
Executive Summary
Consultation focus: The discussions focused on adverse shocks that hit Burkina Faso in 2008-09 and the appropriate policy response, the medium-term outlook, and program performance. Fiscal policy, debt sustainability issues, and obstacles to sustained growth dominated the consultation agenda. The authorities’ plea for an augmentation of access under the PRGF featured prominently in fiscal policy discussions.
Assessment: The global food, energy, and economic crises of 2008-09, and heavy flooding in September 2009 adversely affected Burkina Faso’s short-term outlook, the fiscal position, and the economic welfare of the population. The global economic crisis hit the cotton sector particularly hard, exacerbating its financial difficulties. Two of the three ginning companies, including the publicly owned SOFITEX need to be recapitalized. Some improvement is envisioned for 2010, though there are risks. Social indicators have deteriorated because of the crises, and the flooding has left many people homeless and added to the authorities’ challenges to improve infrastructure. Performance under the program was satisfactory.
Staff recommendations: (i) An expansionary fiscal policy in 2009 is consistent with the need to support economic recovery, and mitigate the impact of adverse shocks. Some fiscal consolidation should be possible in 2010. The momentum of tax and expenditure management reforms must be maintained to safeguard medium-term fiscal and debt sustainability; (ii) Restructuring the cotton sector is critical for the economy and for poverty reduction; and (iii) Structural reforms to support diversification, productivity and competitiveness gains, and to develop the financial sector are crucial to reduce vulnerability to exogenous shocks, and support growth. The authorities should remain engaged with donors to mobilize budget support.
The authorities’ position: The authorities shared the staff assessment and concurred with the recommendations. They agreed that limited administrative capacity might continue to constrain investment execution. They are concerned about increased vulnerabilities in the cotton sector caused by the continued weak global demand for textile, low international cotton prices, and structural problems in the sector.
PRGF arrangement: The Executive Board approved the three-year PRGF arrangement on April 23, 2007, with access of 10 percent of quota, which was augmented by 15 percent of quota on January 9, 2008. The authorities are requesting additional financing under the PRGF arrangement, equivalent to 55 percent of quota in a single disbursement at the conclusion of the fifth PRGF review. Staff supports the request and recommends the completion of the fifth review based on Burkina Faso’s good performance under the program.
Staff: The mission met with the authorities in Ouagadougou during September 17-October 2, 2009. It also met with donors, the business community, labor union representatives, civil society organizations, and the press. The team comprised Ms. Malangu Kabedi-Mbuyi (head), Ragnar Gudmundsson, Roland Kpodar, Charles Yartey (all AFR), and Isabell Adenauer (Resident Representative).
2
Contents Page
I. Introduction ............................................................................................................................5
II. Background ...........................................................................................................................5
III. Medium-Term Outlook ......................................................................................................12
IV. Policy Discussions .............................................................................................................12 A. Fiscal Policy: Addressing Exogenous Shocks and Sustainability Challenges ........12 B. Fostering Economic Growth ...................................................................................20
V. Fifth Program Review, Capacity to Repay the Fund and Program Monitoring .................23
VI. Risks to the Outlook ..........................................................................................................26
VII. Staff Appraisal ..................................................................................................................26 Tables 1. Selected Economic and Financial Indicators, 2007–11 ...............................................28 2. Balance of Payments, 2008–14 ....................................................................................29 3. Consolidated Operations of the Central Government, 2008–14 ..................................30 4. Monetary Survey, 2008–12 ..........................................................................................32 5. Medium-Term Selected Economic and Financial Indicators, 2009–14 .......................33 6. Indicators of Capacity to Repay the Fund, 2008–15 ....................................................34 7. Schedule of Disbursements Under the PRGF Arrangement, 2007–10 ........................35 8. Poverty-Reducing Social Expenditures, 2001–10 .......................................................36 9. Selected Indicators on the Millennium Development Goals, 1990–2008 ...................37 Boxes 1. Status of Policy Recommendations from the 2007 Article IV Consultation .................6 2. Impact of Flooding in Ouagadougou .............................................................................8 3. Competitiveness and Real Effective Exchange Rate Assessment ...............................10 4. Fiscal Reforms for the Medium Term .........................................................................18 5. The Samendeni Dam Project—Supporting Growth and Poverty Reduction ...............22 6. Cotton Sector―Past Reforms and Challenges ............................................................24
3
Figures 1. Recent Economic Developments, 2004–2009 ...............................................................7 2. Competitiveness and Real Effective Exchange Rate .....................................................9 3. Medium-Term Outlook, 2010–14 ................................................................................13 4. Medium-Term Fiscal Outlook, 2010–14 .....................................................................17 5. Selected Millennium Development Goals for 2015 .....................................................19 6. Doing Business Rankings, 2009 ..................................................................................21 Appendix 1. Letter of Intent....................................................................................................38 Attachment I. Memorandum of Economic and Financial Policies for 2009/10 .........41 Attachment II. Technical Memorandum of Understanding ........................................54 Appendix II. Debt Sustainability Analysis (Update) ..............................................................62
4
List of Acronyms ASYCUDA Automated system for customs data BCEAO Central Bank of West African States BIC Tax on industrial and commercial profits CNO OHADA National Commission CPIA Country Policy and Institutional Assessment FSAP Financial Sector Assessment Program IUTS Single progressive tax on wages and salaries LTO Large taxpayer office MEFP Memorandum of Economic and Financial Policies MTO Medium taxpayer office NPV Net present value NPL Non performing loan OHADA Organization for the Harmonization of Business Law in Africa PC Performance criterion PFM Public financial management PRGF Poverty Reduction and Growth Facility REER Real effective exchange rate SOFITEX Société Burkinabè des Fibres Textiles VAT Value-added tax WAEMU West African Economic and Monetary Union
5
I. INTRODUCTION
1. The Executive Board approved Burkina Faso’s PRGF-supported program on April 23, 2007, in an amount of SDR 6.02 million, equivalent to 10 percent of quota. On January 9, 2008, the Board approved an access augmentation of 15 percent of quota, to help Burkina Faso address the impact of exogenous shocks in 2007–08. Reform and policy implementation have been solid, despite some delays in structural reforms; and all reviews have been completed as scheduled.
2. The policy dialogue between Fund staff and the authorities is excellent. The authorities have generally agreed with Fund advice and responded favorably to technical assistance recommendations. Progress in implementing the Fund’s 2007 surveillance advice was generally satisfactory (Box 1).
3. Despite a difficult environment in 2009, the authorities implemented the program consistently with the objectives. All quantitative benchmarks and performance criteria at end-June were observed, and all structural benchmarks through September were met except for one that was delayed to mid-October.
4. In the attached Letter of Intent, the authorities are requesting the completion of the fifth PRGF review, and an augmentation of access equivalent to 55 percent of quota to cope with the impact of exogenous shocks that affected the economy in 2008–09. They are also seeking a modification of the performance criterion on the overall deficit for December 2009.
II. BACKGROUND
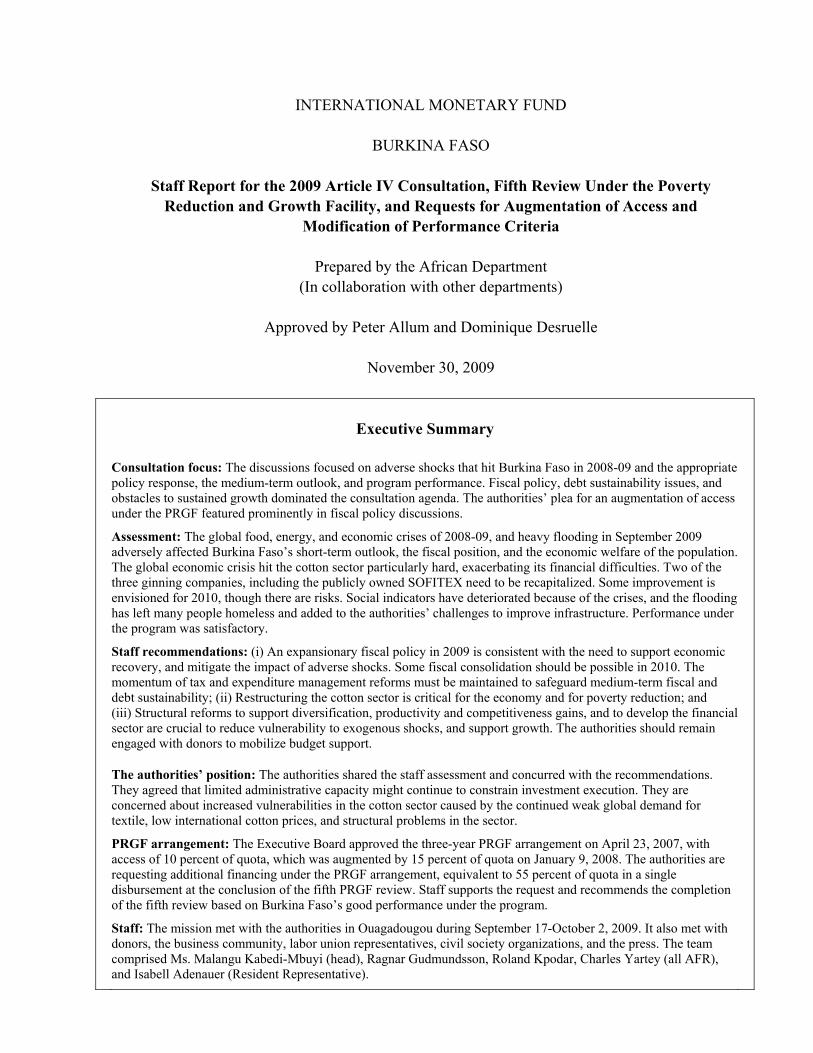
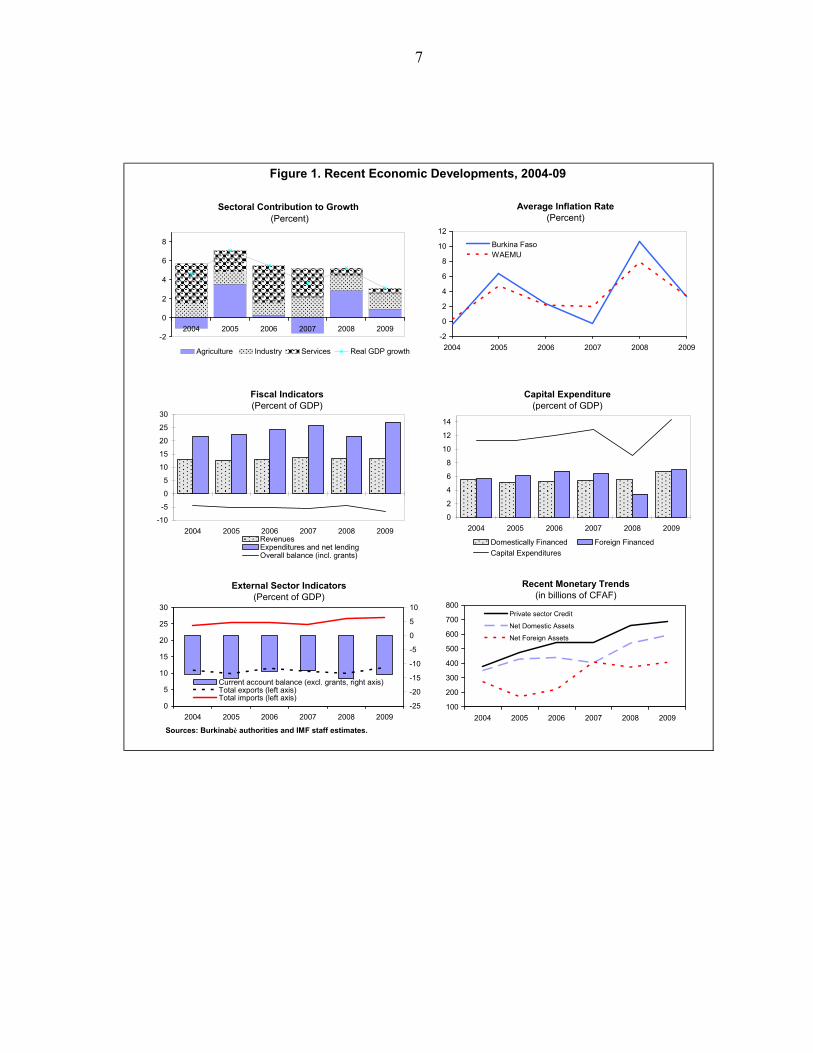
5. Economic activity slowed in 2009, mainly reflecting the impact of the global economic downturn, particularly on the cotton sector and related activities. A sustained output level in agriculture and the expected doubling of gold production would support growth, forecast at 3.1 percent (Table 1, Figure 1).
6. The increase in global food and fuel prices, the global economic and financial crisis, and heavy flooding in September 2009 affected the population’s welfare. In particular, the flooding left many households homeless, and made their living conditions more precarious (Box 2). The World Bank estimated that because of the food and energy crisis of 2008, the incidence of poverty rose from 42 percent in 2006 to over 46 percent in 2008. The impact of the global crisis on the cotton sector affected several portions of the population whose livelihood depends on cotton production.
7. The political and social situation is calm. The next presidential election is scheduled for late 2010.
6
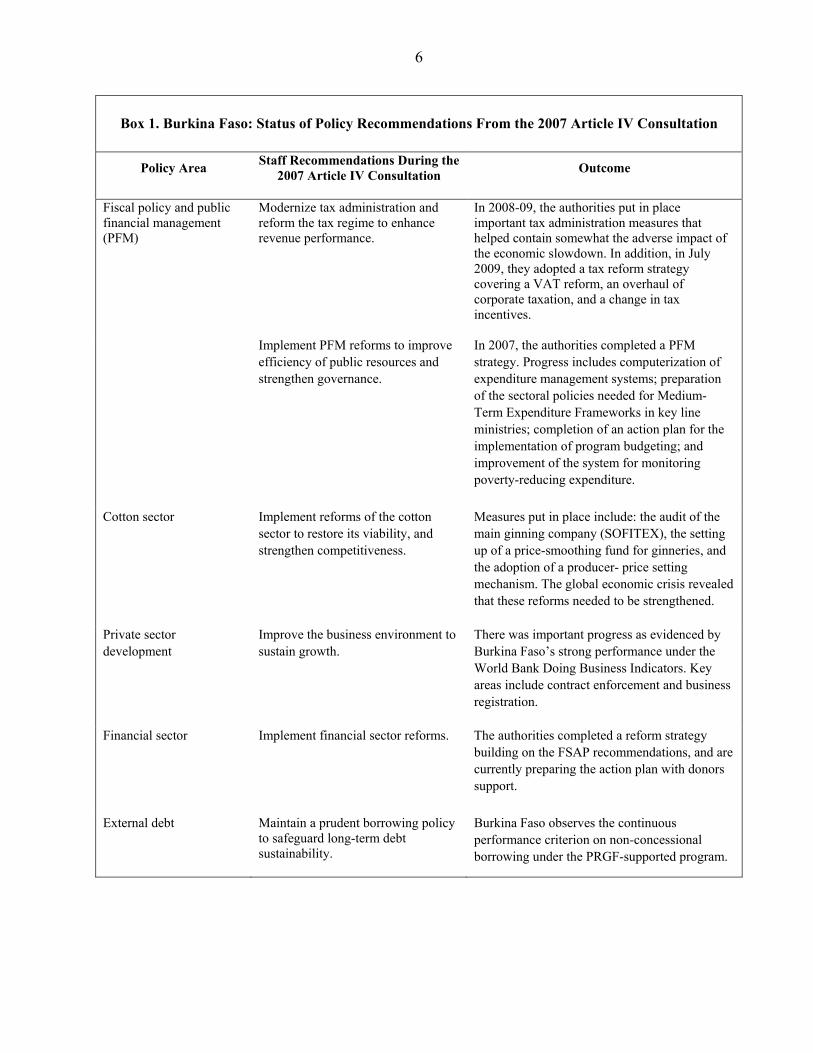
Box 1. Burkina Faso: Status of Policy Recommendations From the 2007 Article IV Consultation
Policy Area Staff Recommendations During the
2007 Article IV Consultation Outcome
Fiscal policy and public financial management (PFM)
Modernize tax administration and reform the tax regime to enhance revenue performance.
In 2008-09, the authorities put in place important tax administration measures that helped contain somewhat the adverse impact of the economic slowdown. In addition, in July 2009, they adopted a tax reform strategy covering a VAT reform, an overhaul of corporate taxation, and a change in tax incentives.
Implement PFM reforms to improve efficiency of public resources and strengthen governance.
In 2007, the authorities completed a PFM strategy. Progress includes computerization of expenditure management systems; preparation of the sectoral policies needed for Medium-Term Expenditure Frameworks in key line ministries; completion of an action plan for the implementation of program budgeting; and improvement of the system for monitoring poverty-reducing expenditure.
Cotton sector Implement reforms of the cotton
sector to restore its viability, and strengthen competitiveness.
Measures put in place include: the audit of the main ginning company (SOFITEX), the setting up of a price-smoothing fund for ginneries, and the adoption of a producer- price setting mechanism. The global economic crisis revealed that these reforms needed to be strengthened.
Private sector development
Improve the business environment to sustain growth.
There was important progress as evidenced by Burkina Faso’s strong performance under the World Bank Doing Business Indicators. Key areas include contract enforcement and business registration.
Financial sector Implement financial sector reforms. The authorities completed a reform strategy building on the FSAP recommendations, and are currently preparing the action plan with donors support.
External debt Maintain a prudent borrowing policy
to safeguard long-term debt sustainability.
Burkina Faso observes the continuous performance criterion on non-concessional borrowing under the PRGF-supported program.
7
-2
0
2
4
6
8
10
12
2004 2005 2006 2007 2008 2009
Burkina FasoWAEMU
Sectoral Contribution to Growth (Percent)
Average Inflation Rate(Percent)
Fiscal Indicators(Percent of GDP)
Capital Expenditure(percent of GDP)
Figure 1. Recent Economic Developments, 2004-09
Sources: Burkinabè authorities and IMF staff estimates.
-2
0
2
4
6
8
2004 2005 2006 2007 2008 2009
Agriculture Industry Services Real GDP growth
-10
-5
0
5
10
15
20
25
30
2004 2005 2006 2007 2008 2009RevenuesExpenditures and net lendingOverall balance (incl. grants)
0
2
4
6
8
10
12
14
2004 2005 2006 2007 2008 2009
Domestically Financed Foreign Financed
Capital Expenditures
0
5
10
15
20
25
30
2004 2005 2006 2007 2008 2009
-25
-20
-15
-10
-5
0
5
10
Current account balance (excl. grants, right axis)Total exports (left axis)Total imports (left axis)
External Sector Indicators(Percent of GDP)
100
200
300
400
500
600
700
800
2004 2005 2006 2007 2008 2009
Private sector Credit
Net Domestic Assets
Net Foreign Assets
Recent Monetary Trends(in billions of CFAF)
8
Box 2. Impact of Flooding in Ouagadougou
On September 1, 2009, there was exceptionally heavy rainfall in the capital city of Ouagadougou that caused flooding, casualties, and left some 180,000 people homeless. The impact on infrastructure was significant:
Twelve bridges were damaged, and several roads were partially destroyed. The main hospital was flooded, destroying expensive and critical bio-medical equipment. Government buildings were damaged, office equipment was lost, and an important storage
facility for agriculture seeds was destroyed. Some 24,000 private houses were destroyed, and about 1,360 small agricultural producers
lost their crops and reserves.
Macroeconomic impact The impact on growth should be limited because agricultural production and the road network outside Ouagadougou were unaffected. However, the fiscal impact is substantial because of higher expenditure to cover the cost of temporary housing and basic necessities and the rapid restoration of key infrastructure. Costing and financing The impact of the flooding is estimated at some CFAF 82 billion (2 percent of GDP). The authorities have allocated CFAF 26 billion in the 2009 Supplementary Budget and CFAF 18 billion in the 2010 Budget to address humanitarian, relocation, and reconstruction needs. A thorough costing will be carried out in the next few weeks, with assistance from the World Bank. The authorities hope to mobilize financing from donors, which has been limited so far.
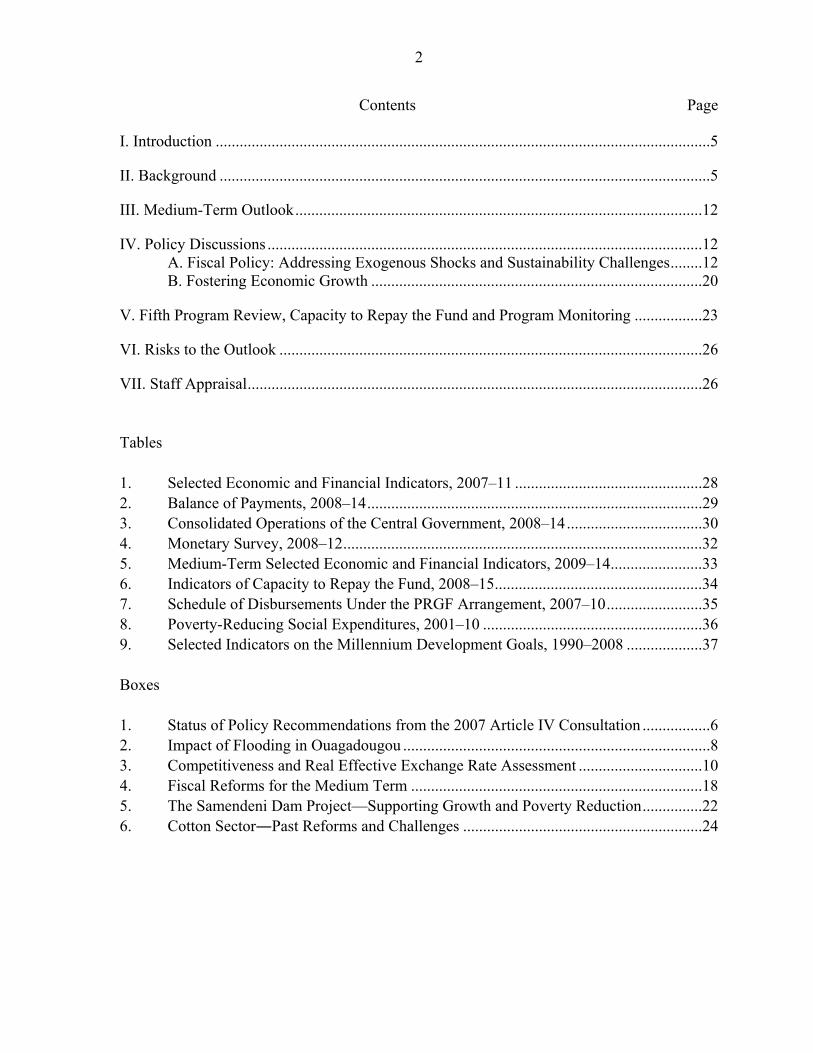
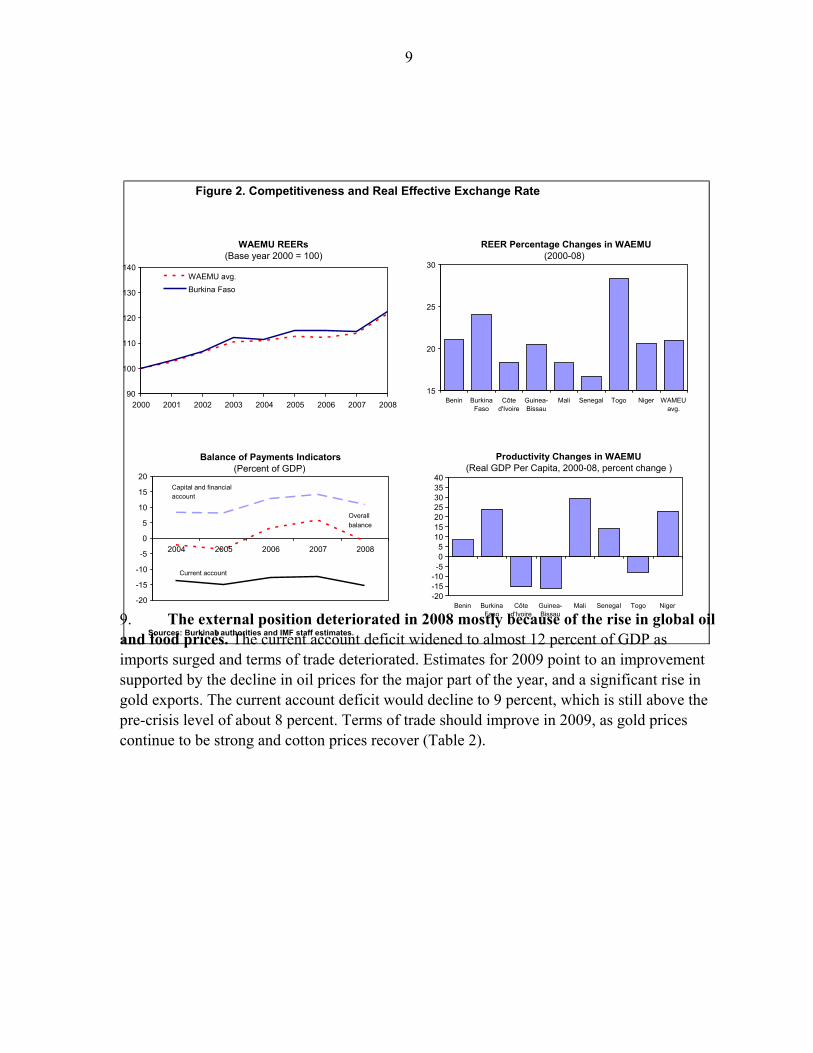
8. Inflation declined in 2009 mostly because of a good harvest, and the decline in global food and fuel prices, easing pressure on the real effective exchange rate (REER). The average 12-month inflation rate stood at 5.3 percent in September, compared to 8.5 percent in 2008. In recent months price developments also benefited from the freeze in fuel retail prices. Inflation is expected to slow to less than 3 percent by year-end. This would reduce pressure on the REER, which appreciated in 2008 because Burkina Faso’s inflation was high compared to its trading partners and the Euro appreciated against the US Dollar (Figure 2). Although quantitative analysis indicates that the REER is broadly in line with fundamentals, non-price factors continue to weigh on Burkina Faso’s competitiveness, underlining the need for continued structural reforms (Box 3).
9
9. The external position deteriorated in 2008 mostly because of the rise in global oil and food prices. The current account deficit widened to almost 12 percent of GDP as imports surged and terms of trade deteriorated. Estimates for 2009 point to an improvement supported by the decline in oil prices for the major part of the year, and a significant rise in gold exports. The current account deficit would decline to 9 percent, which is still above the pre-crisis level of about 8 percent. Terms of trade should improve in 2009, as gold prices continue to be strong and cotton prices recover (Table 2).
c
Figure 2. Competitiveness and Real Effective Exchange Rate
WAEMU REERs (Base year 2000 = 100)
REER Percentage Changes in WAEMU (2000-08)
90
100
110
120
130
140
2000 2001 2002 2003 2004 2005 2006 2007 2008
WAEMU avg. Burkina Faso
15
20
25
30
Benin BurkinaFaso
Côted'Ivoire
Guinea-Bissau
Mali Senegal Togo Niger WAMEUavg.
Sources: Burkinabè authorities and IMF staff estimates.
-20-15-10-505
10152025303540
Benin BurkinaFaso
Côted'Ivoire
Guinea-Bissau
Mali Senegal Togo Niger
Productivity Changes in WAEMU (Real GDP Per Capita, 2000-08, percent change )
-20
-15
-10
-5
0
5
10 15 20
2004 2005 2006 2007 2008
Capital and financial account
Overall
balance
Current account
Balance of Payments Indicators(Percent of GDP)
10
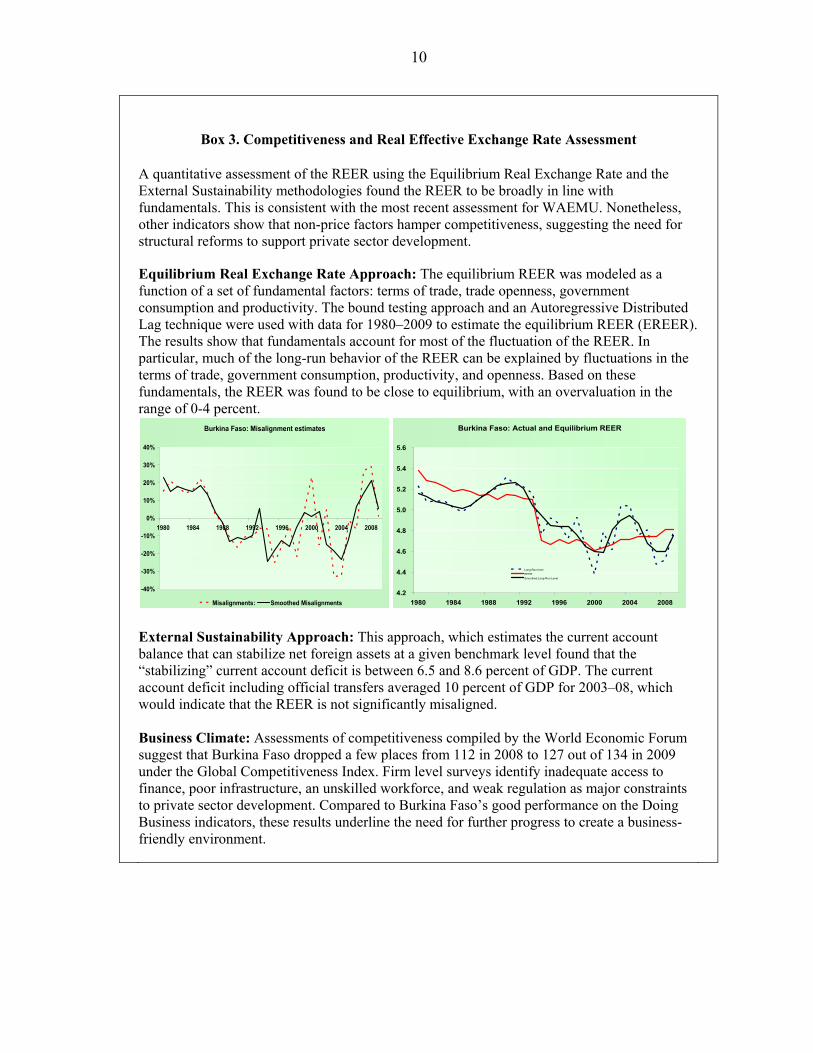
Box 3. Competitiveness and Real Effective Exchange Rate Assessment
A quantitative assessment of the REER using the Equilibrium Real Exchange Rate and the External Sustainability methodologies found the REER to be broadly in line with fundamentals. This is consistent with the most recent assessment for WAEMU. Nonetheless, other indicators show that non-price factors hamper competitiveness, suggesting the need for structural reforms to support private sector development.
Equilibrium Real Exchange Rate Approach: The equilibrium REER was modeled as a function of a set of fundamental factors: terms of trade, trade openness, government consumption and productivity. The bound testing approach and an Autoregressive Distributed Lag technique were used with data for 1980–2009 to estimate the equilibrium REER (EREER). The results show that fundamentals account for most of the fluctuation of the REER. In particular, much of the long-run behavior of the REER can be explained by fluctuations in the terms of trade, government consumption, productivity, and openness. Based on these fundamentals, the REER was found to be close to equilibrium, with an overvaluation in the range of 0-4 percent.
External Sustainability Approach: This approach, which estimates the current account balance that can stabilize net foreign assets at a given benchmark level found that the “stabilizing” current account deficit is between 6.5 and 8.6 percent of GDP. The current account deficit including official transfers averaged 10 percent of GDP for 2003–08, which would indicate that the REER is not significantly misaligned. Business Climate: Assessments of competitiveness compiled by the World Economic Forum suggest that Burkina Faso dropped a few places from 112 in 2008 to 127 out of 134 in 2009 under the Global Competitiveness Index. Firm level surveys identify inadequate access to finance, poor infrastructure, an unskilled workforce, and weak regulation as major constraints to private sector development. Compared to Burkina Faso’s good performance on the Doing Business indicators, these results underline the need for further progress to create a business-friendly environment.
Burkina Faso: Misalignment estimates
-40%
-30%
-20%
-10%
0%
10%
20%
30%
40%
1980 1984 1988 1992 1996 2000 2004 2008
Misalignments: Smoothed Misalignments
Burkina Faso: Actual and Equilibrium REER
4.2
4.4
4.6
4.8
5.0
5.2
5.4
5.6
1980 1984 1988 1992 1996 2000 2004 2008
Long-Run level
REER
Smoothed Long-Run Level
11
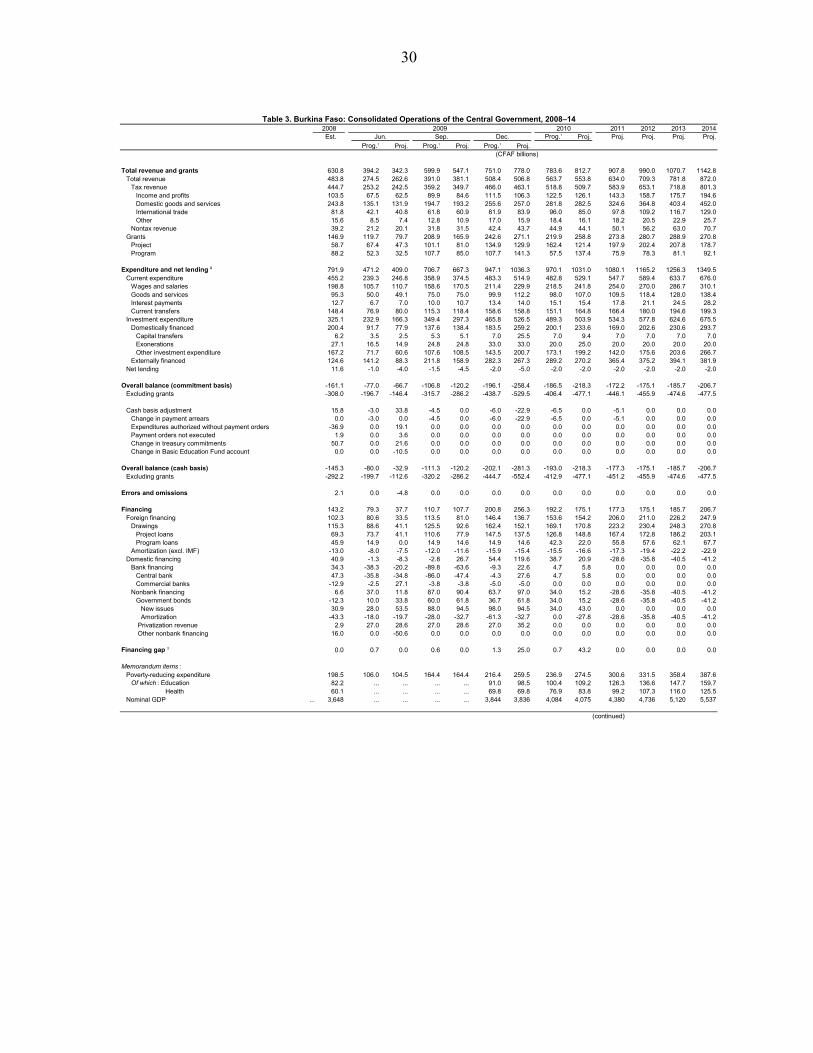
10. Fiscal performance in the first half of 2009 was mixed. Revenue was below target because tax revenue was negatively affected by the economic slowdown. Current expenditure was slightly above target, mostly because of higher wages and transfer payments. However, capital expenditure was lower than anticipated due to administrative delays linked to the strengthening of public procurement procedures. The overall budget deficit (excluding grants) stood at 3.8 percent of GDP through June 2009, compared to a full-year deficit of 5.1 percent in the program (Table 3).
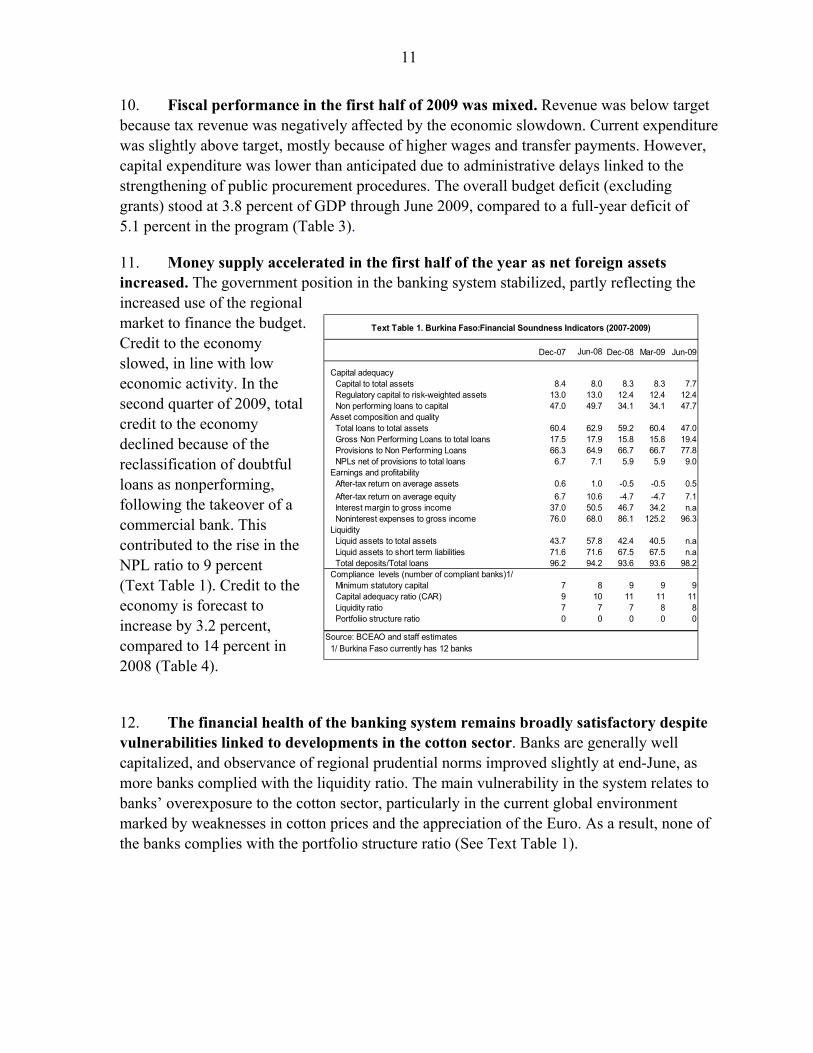
11. Money supply accelerated in the first half of the year as net foreign assets increased. The government position in the banking system stabilized, partly reflecting the increased use of the regional market to finance the budget. Credit to the economy slowed, in line with low economic activity. In the second quarter of 2009, total credit to the economy declined because of the reclassification of doubtful loans as nonperforming, following the takeover of a commercial bank. This contributed to the rise in the NPL ratio to 9 percent (Text Table 1). Credit to the economy is forecast to increase by 3.2 percent, compared to 14 percent in 2008 (Table 4).
12. The financial health of the banking system remains broadly satisfactory despite vulnerabilities linked to developments in the cotton sector. Banks are generally well capitalized, and observance of regional prudential norms improved slightly at end-June, as more banks complied with the liquidity ratio. The main vulnerability in the system relates to banks’ overexposure to the cotton sector, particularly in the current global environment marked by weaknesses in cotton prices and the appreciation of the Euro. As a result, none of the banks complies with the portfolio structure ratio (See Text Table 1).
Dec-07 Jun-08 Dec-08 Mar-09 Jun-09
Capital adequacyCapital to total assets 8.4 8.0 8.3 8.3 7.7Regulatory capital to risk-weighted assets 13.0 13.0 12.4 12.4 12.4Non performing loans to capital 47.0 49.7 34.1 34.1 47.7
Asset composition and qualityTotal loans to total assets 60.4 62.9 59.2 60.4 47.0Gross Non Performing Loans to total loans 17.5 17.9 15.8 15.8 19.4Provisions to Non Performing Loans 66.3 64.9 66.7 66.7 77.8NPLs net of provisions to total loans 6.7 7.1 5.9 5.9 9.0
Earnings and profitabilityAfter-tax return on average assets 0.6 1.0 -0.5 -0.5 0.5
After-tax return on average equity 6.7 10.6 -4.7 -4.7 7.1Interest margin to gross income 37.0 50.5 46.7 34.2 n.aNoninterest expenses to gross income 76.0 68.0 86.1 125.2 96.3
LiquidityLiquid assets to total assets 43.7 57.8 42.4 40.5 n.aLiquid assets to short term liabilities 71.6 71.6 67.5 67.5 n.aTotal deposits/Total loans 96.2 94.2 93.6 93.6 98.2
Compliance levels (number of compliant banks)1/Minimum statutory capital 7 8 9 9 9Capital adequacy ratio (CAR) 9 10 11 11 11Liquidity ratio 7 7 7 8 8Portfoliio structure ratio 0 0 0 0 0
Source: BCEAO and staff estimates1/ Burkina Faso currently has 12 banks
Text Table 1. Burkina Faso:Financial Soundness Indicators (2007-2009)
12
III. MEDIUM-TERM OUTLOOK
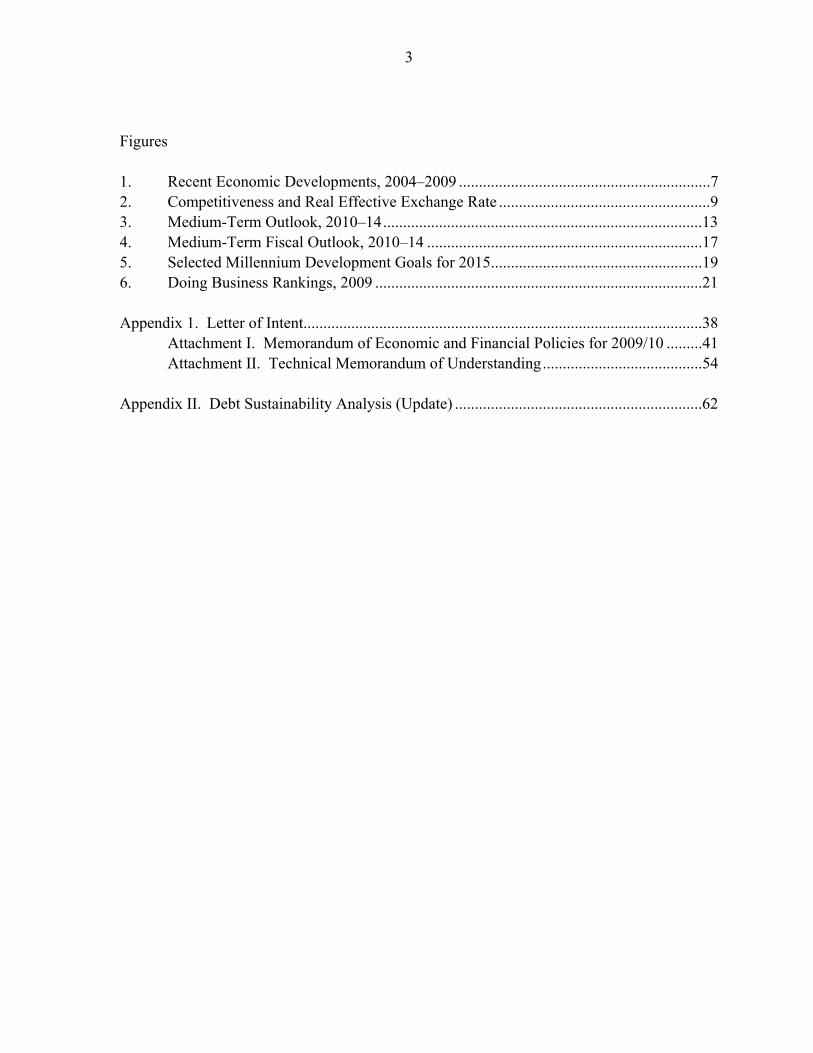
13. Prospects for 2010 are promising. Agricultural and mining production is expected to remain robust, and activity in the services sector should benefit from the anticipated rebound in the cotton sector. Public investment would remain strong given infrastructure and reconstruction needs. On this basis, growth is projected at 4.2 percent. Aided by increased supply of food crops, inflation is expected to remain below 3 percent, thus complying with the WAEMU convergence criterion. The external current account is expected to widen somewhat to 10.5 percent of GDP as imports increase, consistent with the expected economic recovery and higher oil prices (Table 5).
14. The medium-term forecast is for further improvement in the macroeconomic outlook. Growth would return to historical trends, nearing 6 percent on average, with low inflation. Supporting factors include higher investment in infrastructure, a recovery in credit to the private sector, an expansion in the mining sector, and favorable developments in the cotton sector. Despite an increase in growth-related imports, the external position would strengthen over the medium term, as the terms of trade stabilize, and cotton and gold exports expand (Figure 3).
IV. POLICY DISCUSSIONS
The challenge of addressing the impact of exogenous shocks, while preserving medium-term fiscal sustainability, and fostering economic growth guided the discussions.
A. Fiscal Policy: Addressing Exogenous Shocks and Sustainability Challenges
15. Adverse external shocks in 2008-09 had a significant impact on Burkina Faso’s fiscal position.
The global economic crisis triggered measures to support SOFITEX and cotton farmers to mitigate the impact of the significant decline in cotton prices, and the increase in the import price of cotton fertilizers. In particular, SOFITEX needs to be recapitalized by the end of 2009 to avoid bankruptcy. In addition, the authorities decided to address the impact of the global slowdown on the economy through accelerated payments of outstanding bills to utility companies.
To support economic activity, and taking advantage of the new SDR allocations, the authorities decided to clear domestic payments arrears outstanding at the end of 2008.
Heavy flooding in September 2009 added to pressure on expenditure, as the authorities had to provide emergency and humanitarian support to the displaced, and rehabilitate key infrastructure. Emergency and humanitarian spending cover temporary shelter and food for the homeless, the payment of a housing allowance, and the rehabilitation of roads, bridges, health care facilities, and schools.

13
The 2009 budget had to accommodate the lagged impact of the food and energy crisis. In this context, the authorities had to intensify social safety net programs introduced in 2008 in support of vulnerable groups through cash transfers in two major cities, and school lunches. They also intend to implement salary adjustments agreed upon with labor unions after the 2008 social unrest. The agreement covered a 4 percent salary increase and the clearance of overdue payments for past promotions.
GDP Growth and Inflation (Percent)
Fiscal Indicators(Percent of GDP)
Cotton and Gold Exports(millions of US dollars)
Figure 3. Medium-Term Outlook, 2010-14
Sources: Burkinabè authorities and IMF staff estimates.
0
1
2
3
4
5
6
7
2010 2011 2012 2013 2014
Real GDP growth Inflation
-15
-12
-9
-6
-3
2010 2011 2012 2013 2014
Overall balance (excl. grants)
Overall balance (incl. grants)
50
60
70
80
90
100
2010 2011 2012 2013 2014
-25
-20
-15
-10
-5
0
5
10
Current account balance (excl. grants, right axis)Terms of trade (left axis)
Current Account (percent of GDP),and Terms of Trade.
200
300
400
500
600
700
800
900
2010 2011 2012 2013 2014
Gold
Cotton
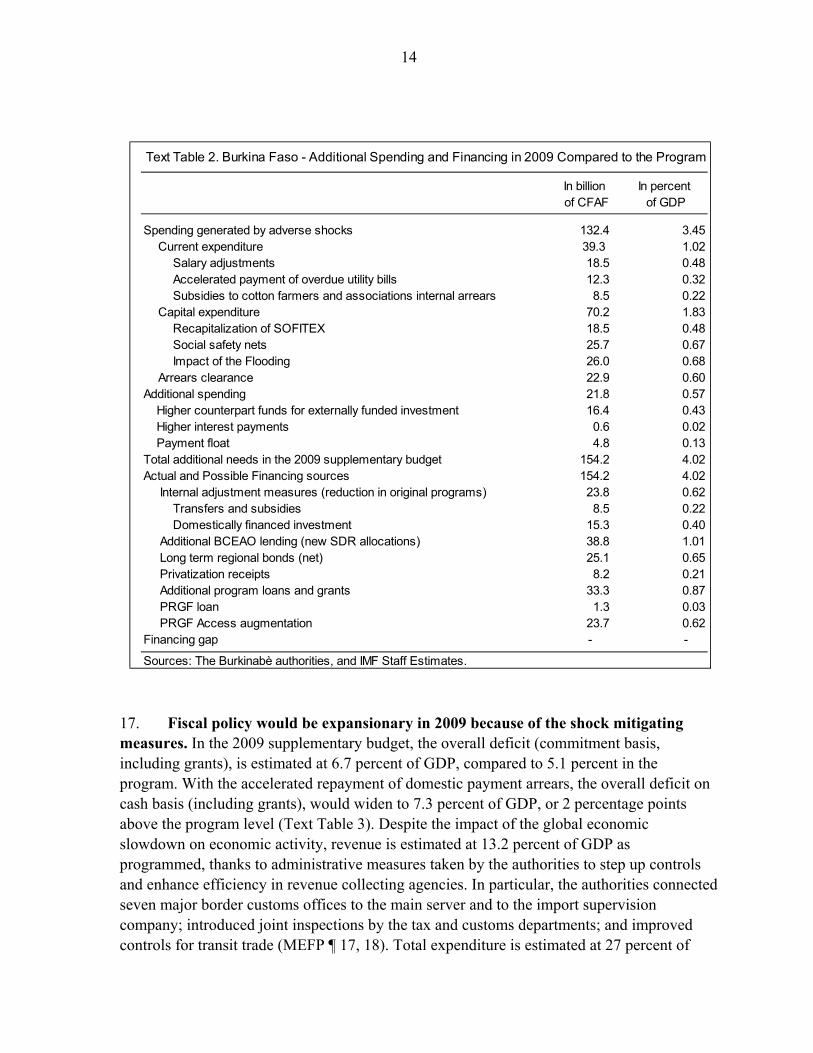
16. The authorities have estimated the cost of these measures at about 3½ percent of GDP1 (Text Table 2). In response to staff’s concerns on availability of financing, they agreed to reduce originally programmed transfers and domestically financed investment. The authorities insisted that implementing the fiscal stimulus and emergency measures in 2009 would help Burkina Faso address pressing needs, particularly in relation with the floods, and avoid a prolonged slowdown in economic activity.
1 The authorities decided to record expenditure linked to the flooding, the social impact of the global economic crisis, and the recapitalization of SOFITEX in domestically financed investment, which include capital transfers.
14
In billion In percent of CFAF of GDP
Spending generated by adverse shocks 132.4 3.45Current expenditure 39.3 1.02
Salary adjustments 18.5 0.48Accelerated payment of overdue utility bills 12.3 0.32Subsidies to cotton farmers and associations internal arrears 8.5 0.22
Capital expenditure 70.2 1.83Recapitalization of SOFITEX 18.5 0.48Social safety nets 25.7 0.67Impact of the Flooding 26.0 0.68
Arrears clearance 22.9 0.60Additional spending 21.8 0.57 Higher counterpart funds for externally funded investment 16.4 0.43 Higher interest payments 0.6 0.02 Payment float 4.8 0.13Total additional needs in the 2009 supplementary budget 154.2 4.02Actual and Possible Financing sources 154.2 4.02 Internal adjustment measures (reduction in original programs) 23.8 0.62 Transfers and subsidies 8.5 0.22 Domestically financed investment 15.3 0.40 Additional BCEAO lending (new SDR allocations) 38.8 1.01 Long term regional bonds (net) 25.1 0.65 Privatization receipts 8.2 0.21 Additional program loans and grants 33.3 0.87 PRGF loan 1.3 0.03 PRGF Access augmentation 23.7 0.62Financing gap - -
Sources: The Burkinabè authorities, and IMF Staff Estimates.
Text Table 2. Burkina Faso - Additional Spending and Financing in 2009 Compared to the Program
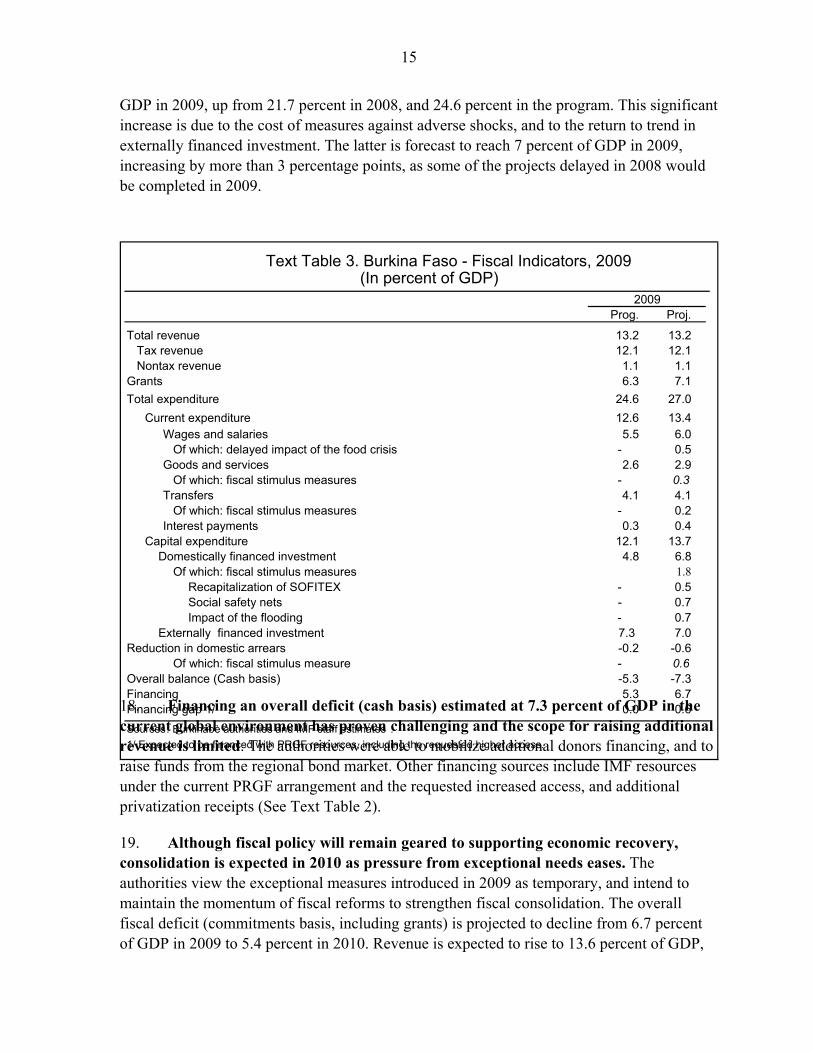
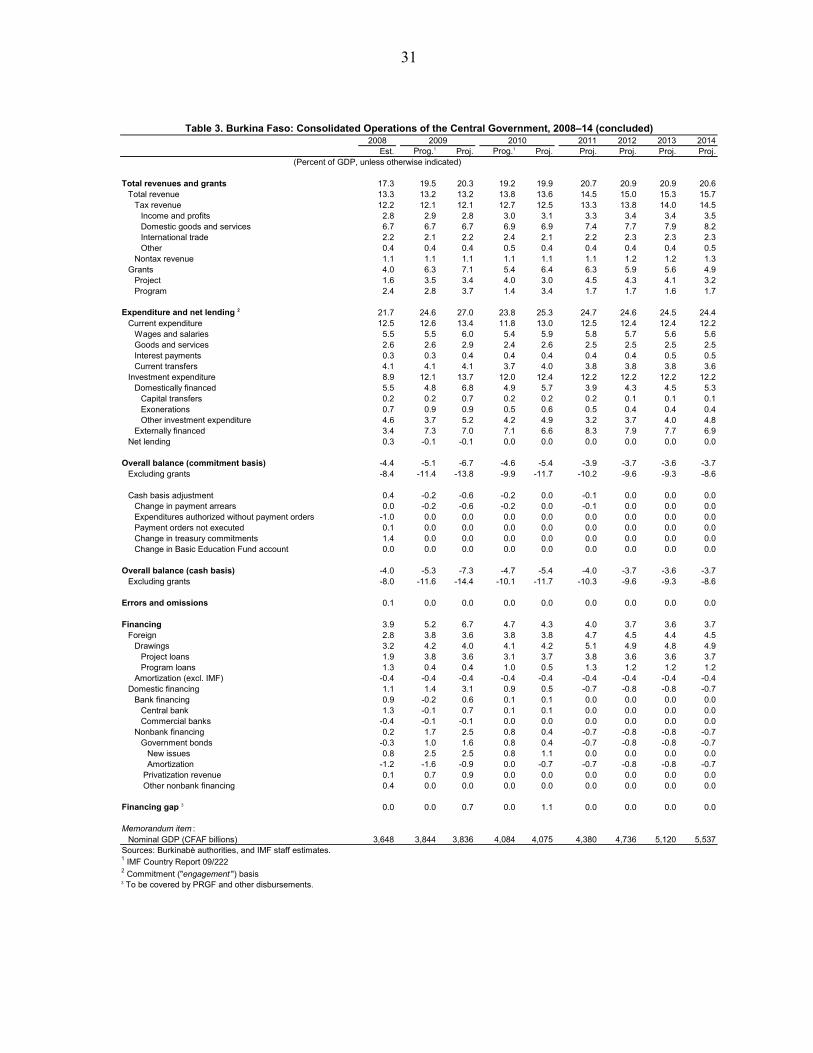
17. Fiscal policy would be expansionary in 2009 because of the shock mitigating measures. In the 2009 supplementary budget, the overall deficit (commitment basis, including grants), is estimated at 6.7 percent of GDP, compared to 5.1 percent in the program. With the accelerated repayment of domestic payment arrears, the overall deficit on cash basis (including grants), would widen to 7.3 percent of GDP, or 2 percentage points above the program level (Text Table 3). Despite the impact of the global economic slowdown on economic activity, revenue is estimated at 13.2 percent of GDP as programmed, thanks to administrative measures taken by the authorities to step up controls and enhance efficiency in revenue collecting agencies. In particular, the authorities connected seven major border customs offices to the main server and to the import supervision company; introduced joint inspections by the tax and customs departments; and improved controls for transit trade (MEFP ¶ 17, 18). Total expenditure is estimated at 27 percent of
15
GDP in 2009, up from 21.7 percent in 2008, and 24.6 percent in the program. This significant increase is due to the cost of measures against adverse shocks, and to the return to trend in externally financed investment. The latter is forecast to reach 7 percent of GDP in 2009, increasing by more than 3 percentage points, as some of the projects delayed in 2008 would be completed in 2009.
18. Financing an overall deficit (cash basis) estimated at 7.3 percent of GDP in the current global environment has proven challenging and the scope for raising additional revenue is limited. The authorities were able to mobilize additional donors financing, and to raise funds from the regional bond market. Other financing sources include IMF resources under the current PRGF arrangement and the requested increased access, and additional privatization receipts (See Text Table 2).
19. Although fiscal policy will remain geared to supporting economic recovery, consolidation is expected in 2010 as pressure from exceptional needs eases. The authorities view the exceptional measures introduced in 2009 as temporary, and intend to maintain the momentum of fiscal reforms to strengthen fiscal consolidation. The overall fiscal deficit (commitments basis, including grants) is projected to decline from 6.7 percent of GDP in 2009 to 5.4 percent in 2010. Revenue is expected to rise to 13.6 percent of GDP,
Prog. Proj.
Total revenue 13.2 13.2 Tax revenue 12.1 12.1 Nontax revenue 1.1 1.1Grants 6.3 7.1
Total expenditure 24.6 27.0
Current expenditure 12.6 13.4Wages and salaries 5.5 6.0 Of which: delayed impact of the food crisis - 0.5Goods and services 2.6 2.9 Of which: fiscal stimulus measures - 0.3Transfers 4.1 4.1 Of which: fiscal stimulus measures - 0.2Interest payments 0.3 0.4
Capital expenditure 12.1 13.7 Domestically financed investment 4.8 6.8
Of which: fiscal stimulus measures 1.8 Recapitalization of SOFITEX - 0.5 Social safety nets - 0.7 Impact of the flooding - 0.7 Externally financed investment 7.3 7.0
Reduction in domestic arrears -0.2 -0.6 Of which: fiscal stimulus measure - 0.6
Overall balance (Cash basis) -5.3 -7.3Financing 5.3 6.7Financing gap 1/ 0.0 0.6
Sources: Burkinabè authorities and IMF staff estimates .
Text Table 3. Burkina Faso - Fiscal Indicators, 2009 (In percent of GDP)
2009
1/ Expected to be financed with PRGF resources, including the requested higher access.

16
reflecting a gradual pick-up in economic activity, tax administration measures, and tax policy reforms (MEFP, ¶ ¶ 21, 22). Expenditure would decline to 25.3 percent of GDP, from the high level of 2009 that was due to exceptional needs. Priority outlays would remain high in 2010 (Table 8), while other expenditure would be at levels comparable to or slightly lower than in 2009. Current transfers would stabilize at 4 percent of GDP. They provide for a 3 percent increase for social safety nets and an allocation of some 0.3 percent of GDP for the organization of presidential elections planned for late 2010.
20. Financing constraints are likely to persist in 2010, and may limit the scope for fiscal support to economic recovery. Since revenue is projected to increase moderately, and domestic and external financing to decline, there is a financing gap of about 1 percent of GDP. The projected last PRGF disbursement will cover a small portion of the gap. The authorities indicated that the financing gap would also be filled with IMF resources from a new arrangement under the Extended Credit Facility (MEFP ¶ 25), and borrowing from the regional bond market. They also plan to mobilize financial support from other development partners. In case of a shortfall in budgetary resources, the authorities will scale back non priority expenditure.
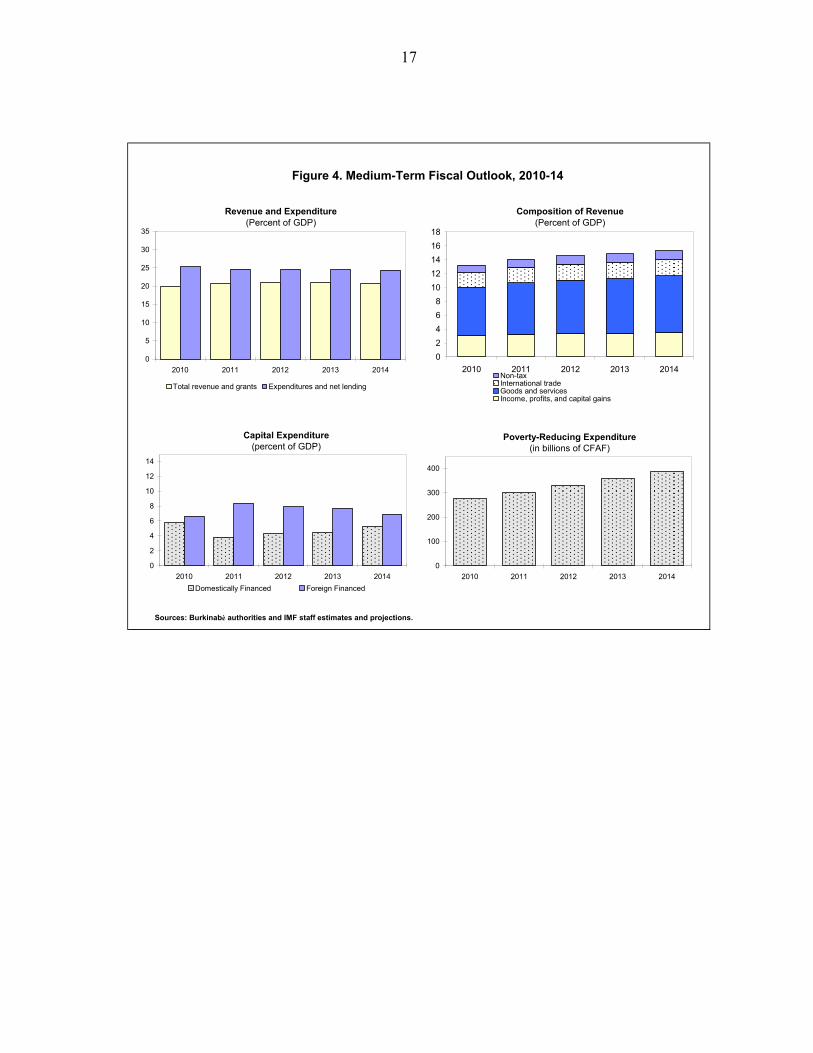
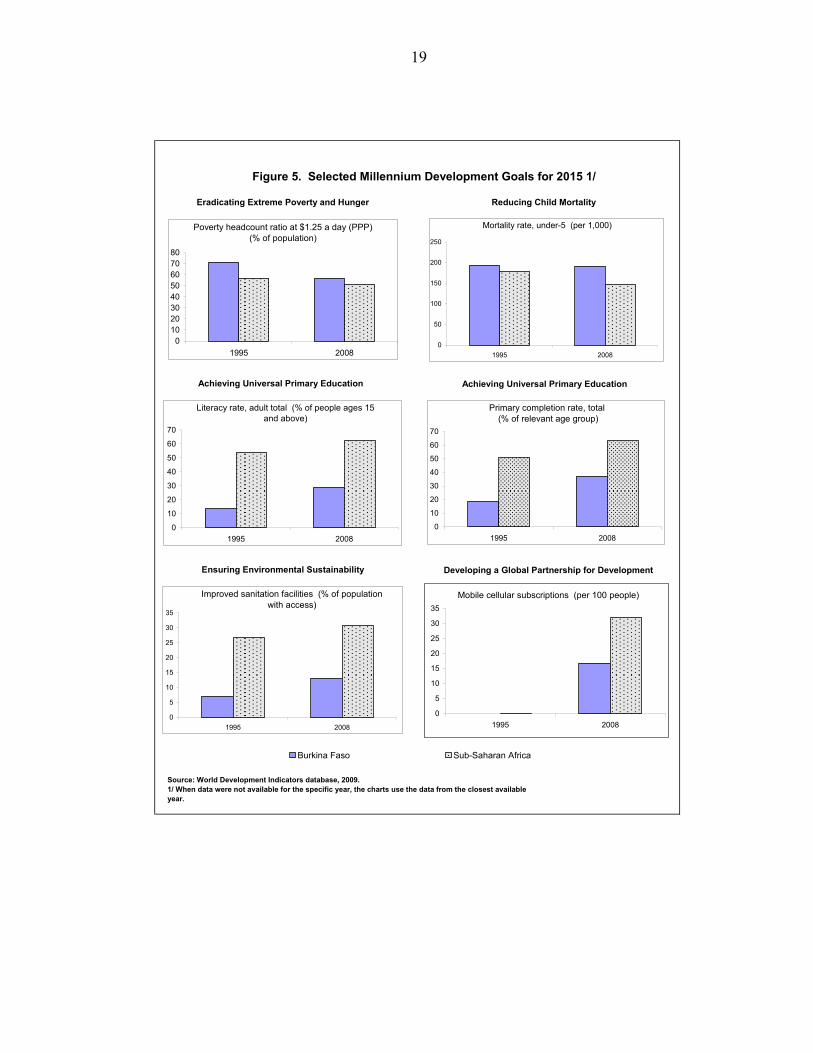
21. The medium-term fiscal strategy focuses on enhancing revenue performance, preserving growth-enhancing investments, and protecting poverty-reducing expenditure. The introduction of a comprehensive tax reform in 2010 (Box 4) and sustained efforts to strengthen tax administration and combat tax evasion are expected to boost revenue to 14.5 percent of GDP in 2011 which would help tighten the overall deficit to 3.9 percent of GDP. Expenditure is forecast to remain at about 24.5 percent of GDP for 2011–14 (Figure 4). Pro-poor spending will increase significantly, reflecting the authorities resolve to combat poverty and make progress on the Millennium Development Goals, where Burkina Faso lags behind comparator countries in several areas (Figure 5). The overall fiscal deficit (commitments basis, including grants) would therefore decline from 5.4 percent of GDP in 2010 to 3.7 percent in 2014.
22. Burkina Faso is at a high risk of debt distress. The debt sustainability analysis carried out by IMF and World Bank staff in June 2009 showed that, as a medium performer, Burkina Faso’s risk of debt distress was high because of the NPV of debt-to-exports ratio. Other debt indicators were below their policy-dependent thresholds, and the rate of external debt accumulation was projected to remain manageable. However, sensitivity tests revealed that the debt outlook was vulnerable to persistent large fiscal deficits, underscoring the need for fiscal consolidation and prudent borrowing policies over the medium term. During the discussions, staff reemphasized the need for Burkina Faso to continue seeking grants and highly concessional financing for infrastructure projects. Although the increase in domestic and external financing to cope with the impact of exogenous shocks in 2009, including additional Fund support, does not lead to a significant deterioration in debt indicators, staff insisted that debt sustainability should continue to guide the authorities’ expenditure policy, particularly its public investment program (See Appendix II for a DSA update).
17
Revenue and Expenditure(Percent of GDP)
Composition of Revenue(Percent of GDP)
0
5
10
15
20
25
30
35
2010 2011 2012 2013 2014
Total revenue and grants Expenditures and net lending
0
2
4
6
8
10
12
14
16
18
2010 2011 2012 2013 2014Non-taxInternational tradeGoods and servicesIncome, profits, and capital gains
Figure 4. Medium-Term Fiscal Outlook, 2010-14
Sources: Burkinabè authorities and IMF staff estimates and projections.
Capital Expenditure(percent of GDP)
0
2
4
6
8
10
12
14
2010 2011 2012 2013 2014
Domestically Financed Foreign Financed
0
100
200
300
400
2010 2011 2012 2013 2014
Poverty-Reducing Expenditure(in billions of CFAF)
18
Box 4. Fiscal Reforms for the Medium Term
The authorities intend to accelerate fiscal reforms in 2010 to strengthen revenue collection and reduce Burkina Faso’s high reliance on external budget support, and strengthen expenditure management. On the revenue side, a tax strategy was finalized in 2009 with technical assistance from the IMF and financial support from Switzerland. The strategy focuses on: (i) streamlining tax incentives; (ii) simplifying and modernizing tax legislation; and (iii) improving the management and yield of indirect taxes. Streamlined tax incentives. Amendments to the investment code will limit incentives
mainly to VAT and tariff exemptions. Moreover, eligibility for benefits under the investment code will change from CFAF 20 million and the creation of three jobs to at least CFAF 100 million and the creation of 30 jobs. Up to 50 percent of the investment amount will be deductible from taxable profits if it does not exceed 50 percent of taxable profits.
Simplified and modernized legislation: The reform introduces a corporate income tax
(IS) with a reduced rate of 25 percent in lieu of the schedule system previously in force. Besides improving the business climate, the introduction of the IS would generate efficiency gains in resource mobilization. Simulation results using reconstructed revenue data for a sample of corporate entities for 2006-07 show that the reform could increase revenue by 10-13 percent.
Improving management and performance of indirect taxes: The reform proposes
broadening the application of VAT by revising the list of exemptions and exclusions from deductibility, raising the threshold for the VAT credit refund from CFAF 250,000 to CFAF 1 million, simplifying VAT credit refunds and making them more secure, and eliminating the VAT withholding tax.
Public financial management reforms: will focus on meeting preconditions for the setting up of a program budgeting system, as well as measures to enhance expenditure and treasury cash flow management (MEFP, ¶ 26). Moreover, after granting a salary increase in 2009, the authorities have decided to get a better handle of the wage bill by enforcing the merit-based promotion system and accelerating civil service reform in 2010. A study for a 10-year plan to modernize the civil service is under preparation. It focuses on three areas: (i), enhancing human capital and increasing the productivity of civil servants; (ii) controlling the growth in the size of the wage bill, notably through an audit of the civil service that should be completed during the first half of 2010; and (iii) establishing a Disciplinary Council by end-2009 that will be responsible for taking sanctions against civil servants at fault and identifying ghost workers.
19
Achieving Universal Primary Education
Eradicating Extreme Poverty and Hunger Reducing Child Mortality
Ensuring Environmental Sustainability
Primary completion rate, total (% of relevant age group)
0
10
20
30
40
50
60
70
1995 2008
Poverty headcount ratio at $1.25 a day (PPP) (% of population)
01020304050607080
1995 2008
Mortality rate, under-5 (per 1,000)
0
50
100
150
200
250
1995 2008
Improved sanitation facilities (% of population with access)
0
5
10
15
20
25
30
35
1995 2008
Literacy rate, adult total (% of people ages 15 and above)
0
10
20
30
40
50
60
70
1995 2008
Mobile cellular subscriptions (per 100 people)
0
5
10
15
20
25
30
35
1995 2008
Burkina Faso Sub-Saharan Africa
Achieving Universal Primary Education
Developing a Global Partnership for Development
Figure 5. Selected Millennium Development Goals for 2015 1/
Source: World Development Indicators database, 2009.1/ When data were not available for the specific year, the charts use the data from the closest available year.
20
23. The authorities concurred with staff on the need to reconcile the twin objectives of accelerated growth and fiscal sustainability over the medium term. While agreeing that the scope for reducing expenditure was limited, staff emphasized that in light of the deteriorating debt-to-GDP ratio over the medium term, investment projects should be selected based on a clear positive economic rate of return. This would be key to ensure that higher indebtedness in the medium term would translate into faster growth and declining debt ratios over the long term.
B. Fostering Economic Growth
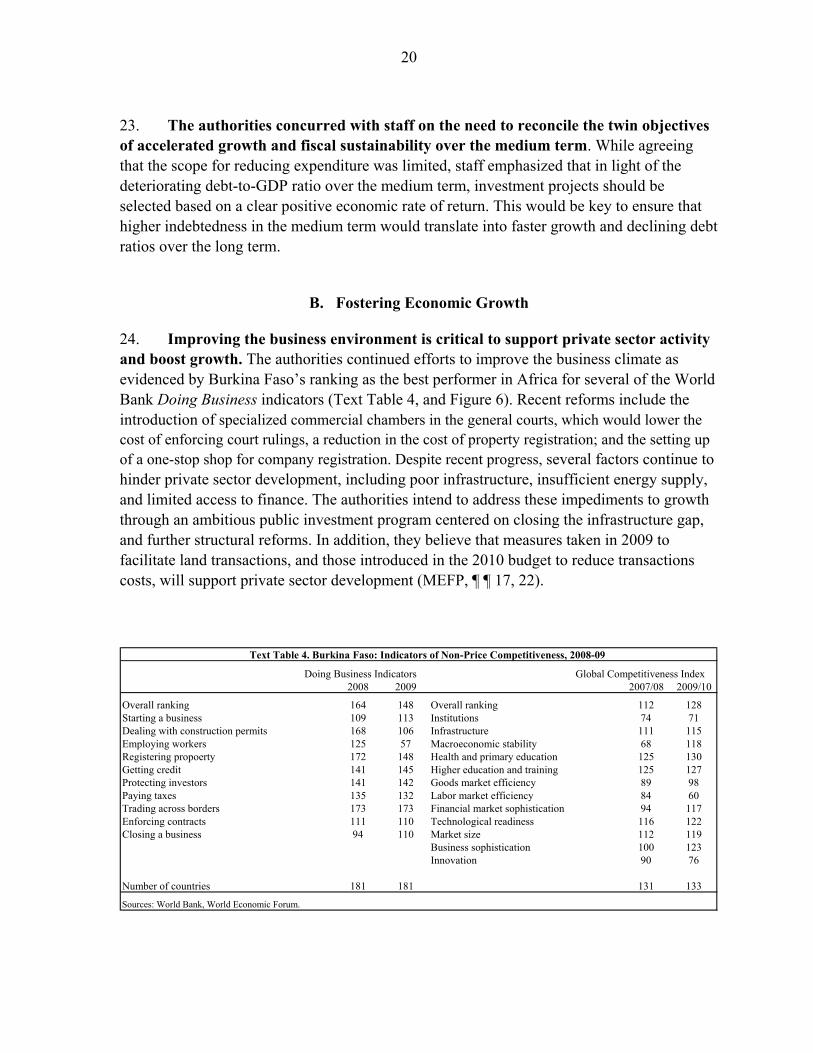
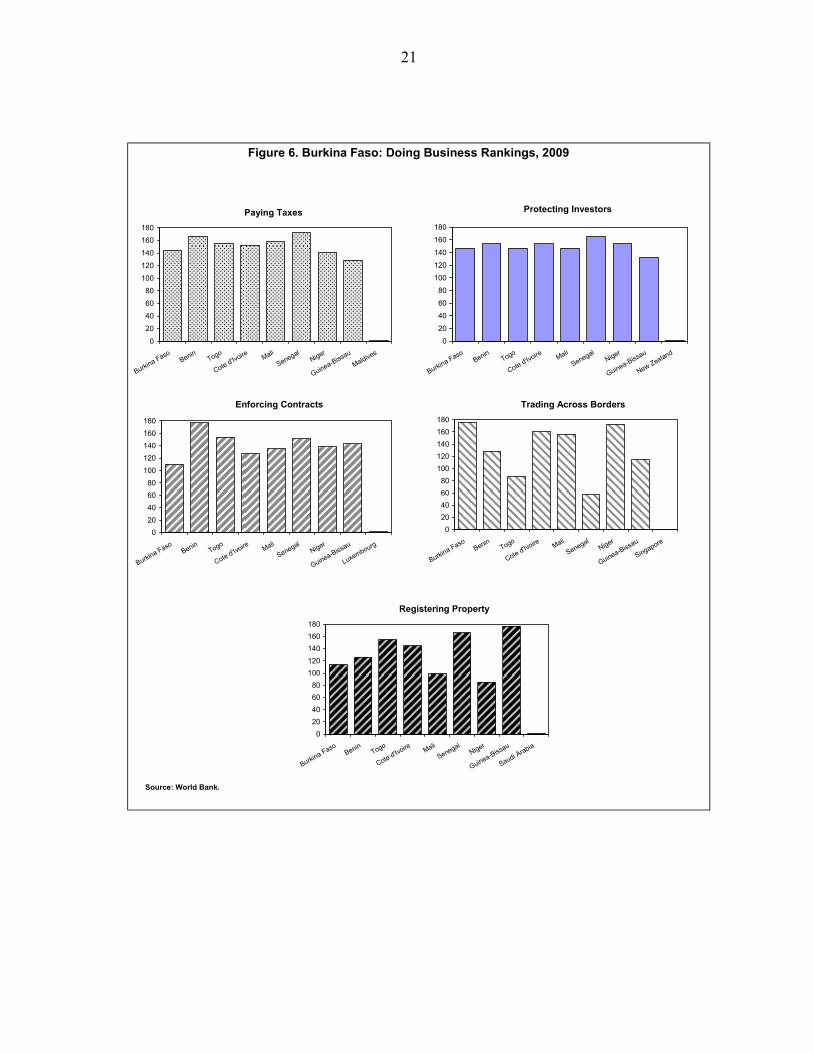
24. Improving the business environment is critical to support private sector activity and boost growth. The authorities continued efforts to improve the business climate as evidenced by Burkina Faso’s ranking as the best performer in Africa for several of the World Bank Doing Business indicators (Text Table 4, and Figure 6). Recent reforms include the introduction of specialized commercial chambers in the general courts, which would lower the cost of enforcing court rulings, a reduction in the cost of property registration; and the setting up of a one-stop shop for company registration. Despite recent progress, several factors continue to hinder private sector development, including poor infrastructure, insufficient energy supply, and limited access to finance. The authorities intend to address these impediments to growth through an ambitious public investment program centered on closing the infrastructure gap, and further structural reforms. In addition, they believe that measures taken in 2009 to facilitate land transactions, and those introduced in the 2010 budget to reduce transactions costs, will support private sector development (MEFP, ¶ ¶ 17, 22).
Text Table 4. Burkina Faso: Indicators of Non-Price Competitiveness, 2008-09 Doing Business Indicators Global Competitiveness Index
2008 2009 2007/08 2009/10
Overall ranking 164 148 Overall ranking 112 128Starting a business 109 113 Institutions 74 71Dealing with construction permits 168 106 Infrastructure 111 115Employing workers 125 57 Macroeconomic stability 68 118Registering propoerty 172 148 Health and primary education 125 130Getting credit 141 145 Higher education and training 125 127Protecting investors 141 142 Goods market efficiency 89 98Paying taxes 135 132 Labor market efficiency 84 60Trading across borders 173 173 Financial market sophistication 94 117Enforcing contracts 111 110 Technological readiness 116 122Closing a business 94 110 Market size 112 119
Business sophistication 100 123Innovation 90 76
Number of countries 181 181 131 133
Sources: World Bank, World Economic Forum.
21
Figure 6. Burkina Faso: Doing Business Rankings, 2009
Paying Taxes Protecting Investors
0
20
40
60
80
100
120
140
160
180
Burkina FasoBenin
Togo
Cote d'Ivoire Mali
SenegalNiger
Guinea-Bissau
New Zealand
Source: World Bank.
Trading Across BordersEnforcing Contracts
0
20
40
60
80
100
120
140
160
180
Burkina FasoBenin
Togo
Cote d'Ivoire Mali
SenegalNiger
Guinea-Bissau
Singapore
0
20
40
60
80
100
120
140
160
180
Burkina FasoBenin
Togo
Cote d'Ivoire Mali
SenegalNiger
Guinea-Bissau
Maldives
0
20
40
60
80
100
120
140
160
180
Burkina FasoBenin
Togo
Cote d'Ivoire Mali
SenegalNiger
Guinea-Bissau
Luxembourg
Registering Property
0
20
40
60
80
100
120
140
160
180
Burkina FasoBenin
Togo
Cote d'Ivoire Mali
SenegalNiger
Guinea-Bissau
Saudi Arabia
22
25. Raising public investment, particularly in infrastructure would support productivity gains. The authorities intend to accelerate implementation of the public investment program and plan to give priority to rebuilding road infrastructure damaged or destroyed by recent flooding. They also agreed with staff that extending the road network to facilitate access to markets for rural production would promote diversification while providing income-generating opportunities. They have initiated preparatory work and studies for the first stage of the Samendeni dam project which is expected to increase energy supply and agriculture production (Box 5).
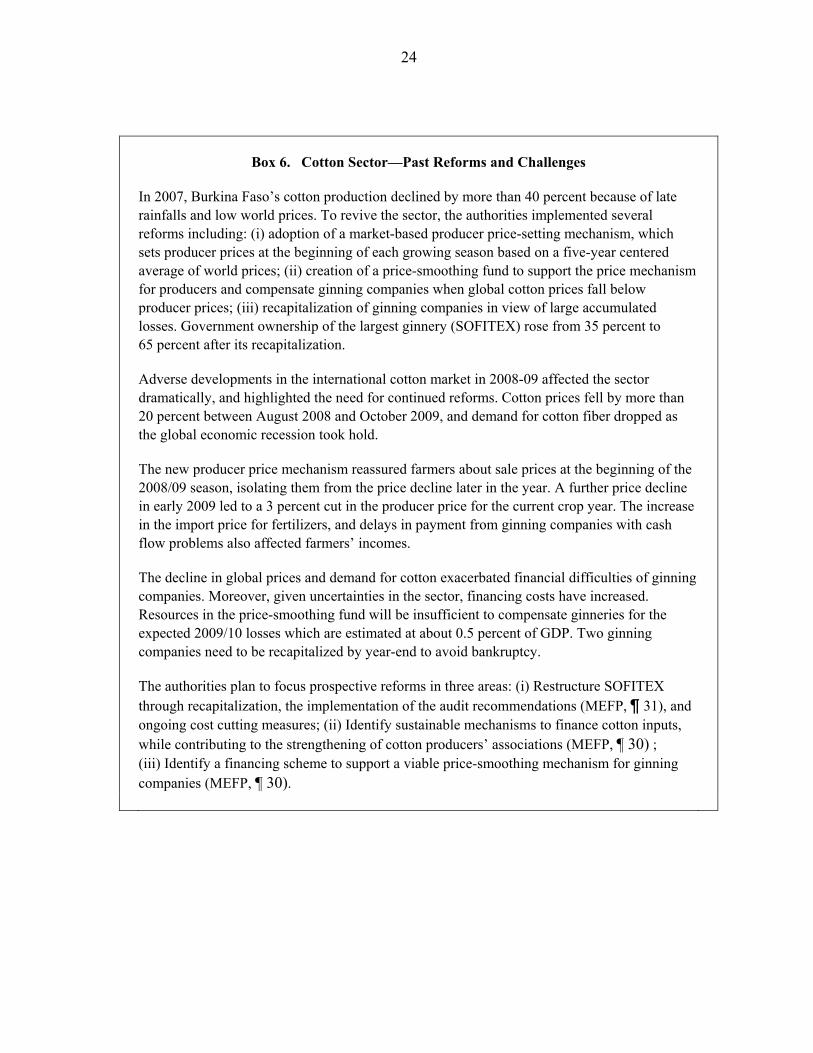
Box 5. The Samendeni Dam Project—Supporting Growth and Poverty Reduction The authorities are planning to build a dam in the Samendeni region of Burkina Faso, which they consider to have an important economic potential because it would generate the water needed to increase agricultural production and energy supply. The authorities expect the dam to facilitate their effort to improve food security, generate employment, and reduce poverty. The project cost is estimated at US$362 million, spread over several implementation phases. The first phase, the construction of the dam, would cost US$130 million, which the authorities are seeking to cover with donor financing. At the end of 2008, they had mobilized concessional financing from seven donors, most of them development banks. Considering Burkina Faso’s high debt vulnerability, the authorities agreed with staff to seek only concessional financing for the project. In the current financing framework, over 40 percent of the project would be financed with domestic resources, which may prove challenging. The 2010 budget provides for about US$12 million from domestic resources and US$16 million from external loans for the implementation of the project. Although it is already incorporated in current debt estimates, the impact of the project on Burkina Faso’s external debt indicators will be reassessed in the context of the next joint Bank/Fund DSA that is scheduled for the first half of 2010.
26. Economic diversification will support growth and help Burkina Faso reduce vulnerability to exogenous shocks. The authorities are hopeful that recent developments and prospects in the mining sector, notably for expanding gold production will bring some improvement. They also believe that agricultural diversification prospects will be stimulated by the land reform recently adopted by Parliament.
23
27. The authorities explained that the cotton sector is vital for growth and poverty reduction. Cotton accounts for 60 percent of exports, and the sector’s contribution to growth covers valued-added from cotton production and ginning, and from downstream activities, and banking services. Agricultural output also benefits from cotton production as farmers use cotton fertilizers for cereal production. An estimated 250,000 households derive their income from cotton production, and in several rural areas, the sale of cottonseeds is the main source of income. Against this backdrop, the authorities continue to support the sector while implementing needed structural reforms (Box 6).
28. Recent developments have increased vulnerabilities in the cotton sector, raising concerns for all stakeholders. Developments in 2008–09 showed the limits of past reforms. The sector remains vulnerable to price shocks and weather conditions; and ginning companies’ financial situation continues to be fragile, with an unsustainable level of losses. In addition, low productivity and the appreciation of the Euro against the US dollar are important hindrances to the sector’s recovery. In discussing prospective reforms for the sector (See Box 6), staff agreed with the areas of emphasis identified by the authorities, and cautioned them about the increasing weigh of the sector on the government budget.
29. The authorities agreed that limited access to finance is an important obstacle to growth. They prepared a strategy to develop the financial sector, building on the recommendations of the 2008 FSAP report. They have made progress in the preparation of the action plan for implementation of the strategy in early 2010. The strategy aims to: (i) enhance the stability and depth of the financial sector; (ii) boost competition among financial institutions; (iii) promote the insurance sector; (iv) improve access to financing in rural areas and for Small and Medium-sized Enterprises; (v) promote housing financing to facilitate access to home ownership; and (vi) enhance the legal and judicial framework for the financial sector (MEFP, ¶ 32).
V. FIFTH PROGRAM REVIEW, CAPACITY TO REPAY THE FUND AND PROGRAM
MONITORING
30. Performance under the program was satisfactory (MEFP, Tables 1 and 2). All quantitative benchmarks at end-June 2009 were met, as were all structural benchmarks through end-September, although one with a two-week delay. In particular, the performance criterion on the overall budget deficit was met, partly because of lower-than-programmed capital expenditure. The indicative target on fiscal revenue was missed by a small margin notably because of lower than anticipated corporate income tax receipts, due to the impact of the global economic slowdown. The indicative target on poverty-reducing spending was nearly on target, despite slower execution of domestically financed investment.
24
Box 6. Cotton Sector—Past Reforms and Challenges
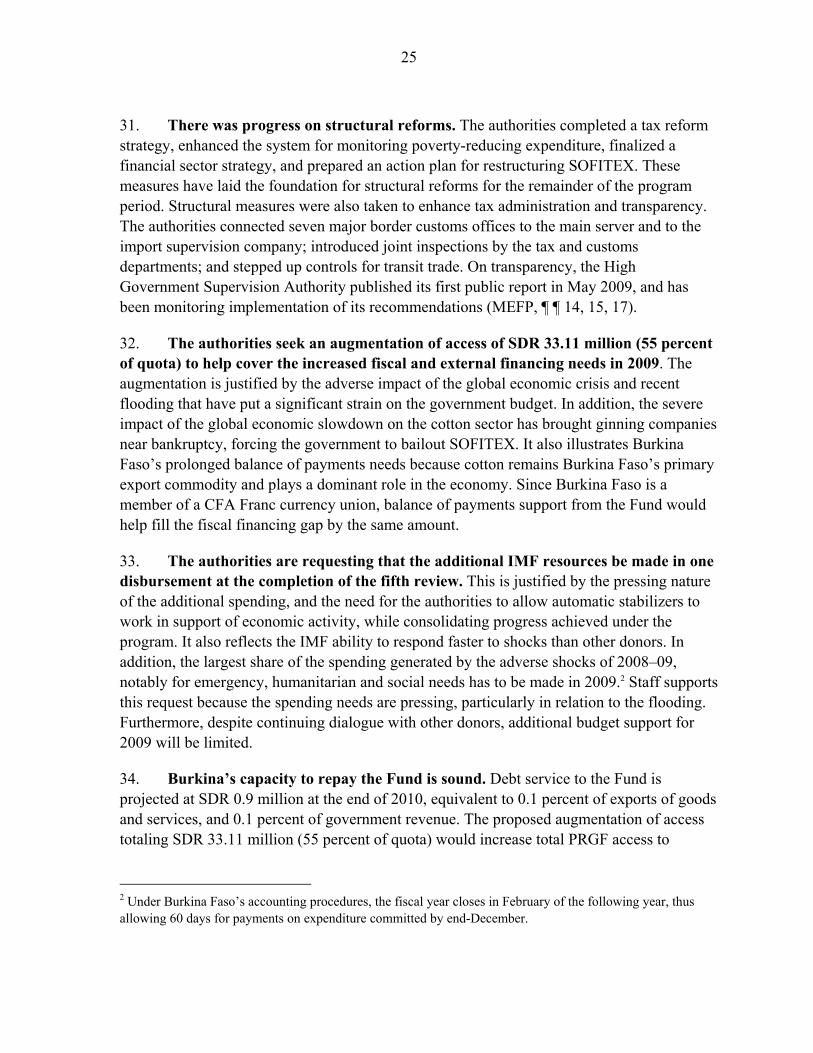
In 2007, Burkina Faso’s cotton production declined by more than 40 percent because of late rainfalls and low world prices. To revive the sector, the authorities implemented several reforms including: (i) adoption of a market-based producer price-setting mechanism, which sets producer prices at the beginning of each growing season based on a five-year centered average of world prices; (ii) creation of a price-smoothing fund to support the price mechanism for producers and compensate ginning companies when global cotton prices fall below producer prices; (iii) recapitalization of ginning companies in view of large accumulated losses. Government ownership of the largest ginnery (SOFITEX) rose from 35 percent to 65 percent after its recapitalization.
Adverse developments in the international cotton market in 2008-09 affected the sector dramatically, and highlighted the need for continued reforms. Cotton prices fell by more than 20 percent between August 2008 and October 2009, and demand for cotton fiber dropped as the global economic recession took hold.
The new producer price mechanism reassured farmers about sale prices at the beginning of the 2008/09 season, isolating them from the price decline later in the year. A further price decline in early 2009 led to a 3 percent cut in the producer price for the current crop year. The increase in the import price for fertilizers, and delays in payment from ginning companies with cash flow problems also affected farmers’ incomes.
The decline in global prices and demand for cotton exacerbated financial difficulties of ginning companies. Moreover, given uncertainties in the sector, financing costs have increased. Resources in the price-smoothing fund will be insufficient to compensate ginneries for the expected 2009/10 losses which are estimated at about 0.5 percent of GDP. Two ginning companies need to be recapitalized by year-end to avoid bankruptcy.
The authorities plan to focus prospective reforms in three areas: (i) Restructure SOFITEX through recapitalization, the implementation of the audit recommendations (MEFP, ¶ 31), and ongoing cost cutting measures; (ii) Identify sustainable mechanisms to finance cotton inputs, while contributing to the strengthening of cotton producers’ associations (MEFP, ¶ 30) ; (iii) Identify a financing scheme to support a viable price-smoothing mechanism for ginning companies (MEFP, ¶ 30).
25
31. There was progress on structural reforms. The authorities completed a tax reform strategy, enhanced the system for monitoring poverty-reducing expenditure, finalized a financial sector strategy, and prepared an action plan for restructuring SOFITEX. These measures have laid the foundation for structural reforms for the remainder of the program period. Structural measures were also taken to enhance tax administration and transparency. The authorities connected seven major border customs offices to the main server and to the import supervision company; introduced joint inspections by the tax and customs departments; and stepped up controls for transit trade. On transparency, the High Government Supervision Authority published its first public report in May 2009, and has been monitoring implementation of its recommendations (MEFP, ¶ ¶ 14, 15, 17).
32. The authorities seek an augmentation of access of SDR 33.11 million (55 percent of quota) to help cover the increased fiscal and external financing needs in 2009. The augmentation is justified by the adverse impact of the global economic crisis and recent flooding that have put a significant strain on the government budget. In addition, the severe impact of the global economic slowdown on the cotton sector has brought ginning companies near bankruptcy, forcing the government to bailout SOFITEX. It also illustrates Burkina Faso’s prolonged balance of payments needs because cotton remains Burkina Faso’s primary export commodity and plays a dominant role in the economy. Since Burkina Faso is a member of a CFA Franc currency union, balance of payments support from the Fund would help fill the fiscal financing gap by the same amount.
33. The authorities are requesting that the additional IMF resources be made in one disbursement at the completion of the fifth review. This is justified by the pressing nature of the additional spending, and the need for the authorities to allow automatic stabilizers to work in support of economic activity, while consolidating progress achieved under the program. It also reflects the IMF ability to respond faster to shocks than other donors. In addition, the largest share of the spending generated by the adverse shocks of 2008–09, notably for emergency, humanitarian and social needs has to be made in 2009.2 Staff supports this request because the spending needs are pressing, particularly in relation to the flooding. Furthermore, despite continuing dialogue with other donors, additional budget support for 2009 will be limited.
34. Burkina’s capacity to repay the Fund is sound. Debt service to the Fund is projected at SDR 0.9 million at the end of 2010, equivalent to 0.1 percent of exports of goods and services, and 0.1 percent of government revenue. The proposed augmentation of access totaling SDR 33.11 million (55 percent of quota) would increase total PRGF access to
2 Under Burkina Faso’s accounting procedures, the fiscal year closes in February of the following year, thus allowing 60 days for payments on expenditure committed by end-December.
26
80 percent of quota. This takes into account the country’s current indebtedness to the Fund and its excellent debt servicing record (Table 6).
35. Program monitoring will be based on quantitative and structural criteria agreed with the authorities (MEFP, Tables 1 and 2). Quantitative financial targets for end-December 2009 are performance criteria. The sixth PRGF review is expected to be completed by April 15, 2010.
VI. RISKS TO THE OUTLOOK
36. The economic outlook is subject to downside risks related to the uncertain external environment and domestic factors.
A slow recovery in the global economy and the corollary weakness in the cotton market could prevent the expected resumption of activity in the cotton sector, with repercussions for the banking sector, the government budget, and economic activity.
Slow progress in restructuring the cotton sector could also strain budgetary resources and hamper economic recovery.
Burkina Faso is highly dependent on external budget support. Failure to mobilize enough resources to finance the budget, and particularly the investment program may limit scope for fiscal support to economic growth.
Failure to improve revenue mobilization significantly could lead to excessive borrowing in the regional financial market.
VII. STAFF APPRAISAL
37. Major adverse shocks in 2008-09 affected Burkina Faso’s macroeconomic outlook and deteriorated social indicators. The compound effects of high energy and food prices, the global economic crisis and the heavy flooding in September have lowered growth prospects for 2009, undermined the fiscal position and deteriorated the population’s welfare.
38. Fiscal policy aims to address the resultant challenges, while consolidating the fiscal position. Staff commends the authorities for acting promptly in dealing with the impact of the flooding in Ouagadougou, and for the fiscal stimulus measures introduced in the 2009 supplementary budget. Their efforts to enhance revenue performance in 2009 through administrative measures, under difficult circumstances, are commendable. To consolidate the fiscal position further, the authorities need to maintain the momentum of fiscal reforms. Staff encourages them to proceed with tax reform and the additional efficiency gains measures planned for 2010. The authorities need to accelerate public
27
financial management reforms, and to reinforce the monitoring of pro-poor spending further. Their initiative to advance civil service reforms bodes well with the need to maintain a prudent wage policy.
39. Fiscal consolidation and prudent borrowing policies are critical to improve Burkina Faso’s medium-term debt outlook. As Burkina Faso is at a high risk of debt distress, staff recommends that the authorities continue to seek grants and highly concessional loans for their financing needs, particularly for infrastructure projects.
40. Addressing impediments to growth and reducing the economy’s vulnerability to shocks has become more pressing. Financial sector reforms will play an important role in this regard by supporting private sector development and diversification. Staff encourages the authorities to proceed with the implementation of the financial sector strategy in early 2010 as planned. Similarly, cotton sector reforms should remain a priority. With support from the World Bank and other donors, the authorities should continue to seek ways to protect farmers’ income, restructure SOFITEX, and identify sustainable mechanisms for financing the price-smoothing fund.
41. Quantitative assessments indicate that the real effective exchange rate is broadly in line with fundamentals. However, non-price factors continue to hamper competitiveness. Staff encourages the authorities to proceed with structural reforms needed to promote productivity and competitiveness gains, and foster private sector development.
42. Staff recommends completion of the fifth review of the PRGF arrangement. Despite a difficult environment in 2009, program performance was satisfactory, and the authorities have made commitments on the reform agenda through the end of the program in tax policy, public financial management, and the cotton and financial sectors.
43. Staff supports the authorities’ requests for an augmentation of PRGF access with a single disbursement at the completion of the fifth review. Higher Fund resources will help Burkina Faso finance additional expenditure generated by the adverse shocks of 2008–09, and support economic recovery. Making the additional resources available in one disbursement at the completion of the fifth review is justified because the largest share of the spending, notably for emergency, humanitarian and social needs has to be made in 2009.
44. It is proposed that the next Article IV consultation with Burkina Faso takes place in line with the July 15, 2002 decision on consultation cycles.
28
2011Est. Est. Prog.1 Proj. Prog.1 Proj. Proj.
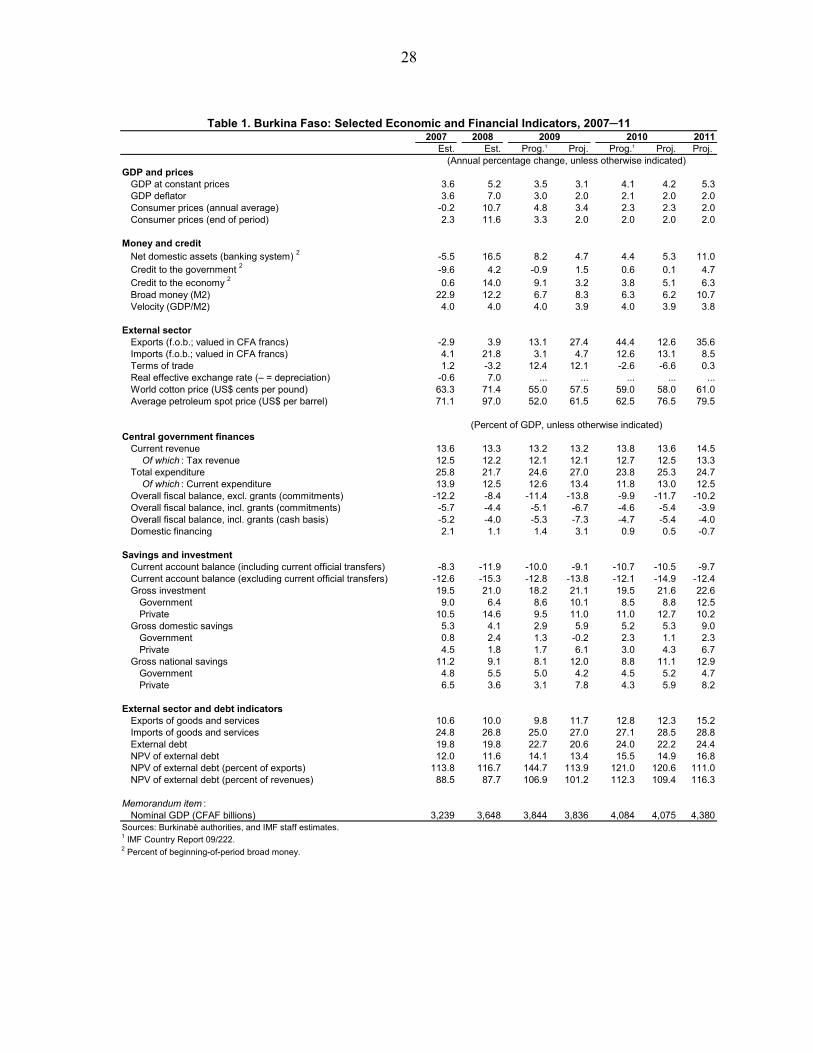
GDP and pricesGDP at constant prices 3.6 5.2 3.5 3.1 4.1 4.2 5.3GDP deflator 3.6 7.0 3.0 2.0 2.1 2.0 2.0Consumer prices (annual average) -0.2 10.7 4.8 3.4 2.3 2.3 2.0Consumer prices (end of period) 2.3 11.6 3.3 2.0 2.0 2.0 2.0
Money and creditNet domestic assets (banking system) 2 -5.5 16.5 8.2 4.7 4.4 5.3 11.0Credit to the government 2 -9.6 4.2 -0.9 1.5 0.6 0.1 4.7Credit to the economy 2 0.6 14.0 9.1 3.2 3.8 5.1 6.3Broad money (M2) 22.9 12.2 6.7 8.3 6.3 6.2 10.7Velocity (GDP/M2) 4.0 4.0 4.0 3.9 4.0 3.9 3.8
External sectorExports (f.o.b.; valued in CFA francs) -2.9 3.9 13.1 27.4 44.4 12.6 35.6Imports (f.o.b.; valued in CFA francs) 4.1 21.8 3.1 4.7 12.6 13.1 8.5Terms of trade 1.2 -3.2 12.4 12.1 -2.6 -6.6 0.3Real effective exchange rate (– = depreciation) -0.6 7.0 ... ... ... ... ...World cotton price (US$ cents per pound) 63.3 71.4 55.0 57.5 59.0 58.0 61.0Average petroleum spot price (US$ per barrel) 71.1 97.0 52.0 61.5 62.5 76.5 79.5
Central government financesCurrent revenue 13.6 13.3 13.2 13.2 13.8 13.6 14.5
Of which : Tax revenue 12.5 12.2 12.1 12.1 12.7 12.5 13.3Total expenditure 25.8 21.7 24.6 27.0 23.8 25.3 24.7
Of which : Current expenditure 13.9 12.5 12.6 13.4 11.8 13.0 12.5Overall fiscal balance, excl. grants (commitments) -12.2 -8.4 -11.4 -13.8 -9.9 -11.7 -10.2Overall fiscal balance, incl. grants (commitments) -5.7 -4.4 -5.1 -6.7 -4.6 -5.4 -3.9Overall fiscal balance, incl. grants (cash basis) -5.2 -4.0 -5.3 -7.3 -4.7 -5.4 -4.0Domestic financing 2.1 1.1 1.4 3.1 0.9 0.5 -0.7
Savings and investmentCurrent account balance (including current official transfers) -8.3 -11.9 -10.0 -9.1 -10.7 -10.5 -9.7Current account balance (excluding current official transfers) -12.6 -15.3 -12.8 -13.8 -12.1 -14.9 -12.4Gross investment 19.5 21.0 18.2 21.1 19.5 21.6 22.6
Government 9.0 6.4 8.6 10.1 8.5 8.8 12.5Private 10.5 14.6 9.5 11.0 11.0 12.7 10.2
Gross domestic savings 5.3 4.1 2.9 5.9 5.2 5.3 9.0Government 0.8 2.4 1.3 -0.2 2.3 1.1 2.3Private 4.5 1.8 1.7 6.1 3.0 4.3 6.7
Gross national savings 11.2 9.1 8.1 12.0 8.8 11.1 12.9Government 4.8 5.5 5.0 4.2 4.5 5.2 4.7Private 6.5 3.6 3.1 7.8 4.3 5.9 8.2
External sector and debt indicatorsExports of goods and services 10.6 10.0 9.8 11.7 12.8 12.3 15.2Imports of goods and services 24.8 26.8 25.0 27.0 27.1 28.5 28.8External debt 19.8 19.8 22.7 20.6 24.0 22.2 24.4NPV of external debt 12.0 11.6 14.1 13.4 15.5 14.9 16.8NPV of external debt (percent of exports) 113.8 116.7 144.7 113.9 121.0 120.6 111.0NPV of external debt (percent of revenues) 88.5 87.7 106.9 101.2 112.3 109.4 116.3
Memorandum item :Nominal GDP (CFAF billions) 3,239 3,648 3,844 3,836 4,084 4,075 4,380
Sources: Burkinabè authorities, and IMF staff estimates.1 IMF Country Report 09/222.2 Percent of beginning-of-period broad money.
(Annual percentage change, unless otherwise indicated)
(Percent of GDP, unless otherwise indicated)
Table 1. Burkina Faso: Selected Economic and Financial Indicators, 2007─112007 2008 2009 2010
29
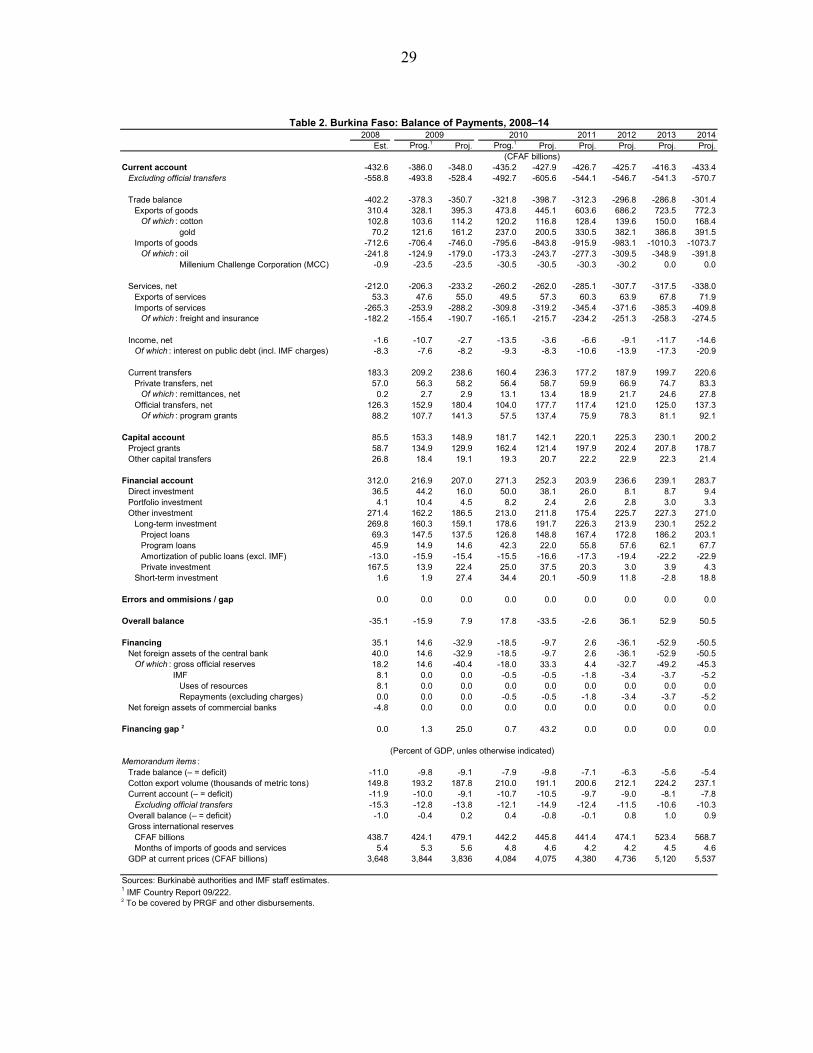
Table 2. Burkina Faso: Balance of Payments, 2008–14
2011 2012 2013 2014Est. Prog.1 Proj. Prog.1 Proj. Proj. Proj. Proj. Proj.
Current account -432.6 -386.0 -348.0 -435.2 -427.9 -426.7 -425.7 -416.3 -433.4Excluding official transfers -558.8 -493.8 -528.4 -492.7 -605.6 -544.1 -546.7 -541.3 -570.7
Trade balance -402.2 -378.3 -350.7 -321.8 -398.7 -312.3 -296.8 -286.8 -301.4Exports of goods 310.4 328.1 395.3 473.8 445.1 603.6 686.2 723.5 772.3
Of which : cotton 102.8 103.6 114.2 120.2 116.8 128.4 139.6 150.0 168.4gold 70.2 121.6 161.2 237.0 200.5 330.5 382.1 386.8 391.5
Imports of goods -712.6 -706.4 -746.0 -795.6 -843.8 -915.9 -983.1 -1010.3 -1073.7Of which : oil -241.8 -124.9 -179.0 -173.3 -243.7 -277.3 -309.5 -348.9 -391.8
Millenium Challenge Corporation (MCC) -0.9 -23.5 -23.5 -30.5 -30.5 -30.3 -30.2 0.0 0.0
Services, net -212.0 -206.3 -233.2 -260.2 -262.0 -285.1 -307.7 -317.5 -338.0Exports of services 53.3 47.6 55.0 49.5 57.3 60.3 63.9 67.8 71.9Imports of services -265.3 -253.9 -288.2 -309.8 -319.2 -345.4 -371.6 -385.3 -409.8
Of which : freight and insurance -182.2 -155.4 -190.7 -165.1 -215.7 -234.2 -251.3 -258.3 -274.5
Income, net -1.6 -10.7 -2.7 -13.5 -3.6 -6.6 -9.1 -11.7 -14.6Of which : interest on public debt (incl. IMF charges) -8.3 -7.6 -8.2 -9.3 -8.3 -10.6 -13.9 -17.3 -20.9
Current transfers 183.3 209.2 238.6 160.4 236.3 177.2 187.9 199.7 220.6Private transfers, net 57.0 56.3 58.2 56.4 58.7 59.9 66.9 74.7 83.3
Of which : remittances, net 0.2 2.7 2.9 13.1 13.4 18.9 21.7 24.6 27.8Official transfers, net 126.3 152.9 180.4 104.0 177.7 117.4 121.0 125.0 137.3
Of which : program grants 88.2 107.7 141.3 57.5 137.4 75.9 78.3 81.1 92.1
Capital account 85.5 153.3 148.9 181.7 142.1 220.1 225.3 230.1 200.2Project grants 58.7 134.9 129.9 162.4 121.4 197.9 202.4 207.8 178.7Other capital transfers 26.8 18.4 19.1 19.3 20.7 22.2 22.9 22.3 21.4
Financial account 312.0 216.9 207.0 271.3 252.3 203.9 236.6 239.1 283.7Direct investment 36.5 44.2 16.0 50.0 38.1 26.0 8.1 8.7 9.4Portfolio investment 4.1 10.4 4.5 8.2 2.4 2.6 2.8 3.0 3.3Other investment 271.4 162.2 186.5 213.0 211.8 175.4 225.7 227.3 271.0
Long-term investment 269.8 160.3 159.1 178.6 191.7 226.3 213.9 230.1 252.2Project loans 69.3 147.5 137.5 126.8 148.8 167.4 172.8 186.2 203.1Program loans 45.9 14.9 14.6 42.3 22.0 55.8 57.6 62.1 67.7Amortization of public loans (excl. IMF) -13.0 -15.9 -15.4 -15.5 -16.6 -17.3 -19.4 -22.2 -22.9Private investment 167.5 13.9 22.4 25.0 37.5 20.3 3.0 3.9 4.3
Short-term investment 1.6 1.9 27.4 34.4 20.1 -50.9 11.8 -2.8 18.8
Errors and ommisions / gap 0.0 0.0 0.0 0.0 0.0 0.0 0.0 0.0 0.0
Overall balance -35.1 -15.9 7.9 17.8 -33.5 -2.6 36.1 52.9 50.5
Financing 35.1 14.6 -32.9 -18.5 -9.7 2.6 -36.1 -52.9 -50.5Net foreign assets of the central bank 40.0 14.6 -32.9 -18.5 -9.7 2.6 -36.1 -52.9 -50.5
Of which : gross official reserves 18.2 14.6 -40.4 -18.0 33.3 4.4 -32.7 -49.2 -45.3IMF 8.1 0.0 0.0 -0.5 -0.5 -1.8 -3.4 -3.7 -5.2
Uses of resources 8.1 0.0 0.0 0.0 0.0 0.0 0.0 0.0 0.0Repayments (excluding charges) 0.0 0.0 0.0 -0.5 -0.5 -1.8 -3.4 -3.7 -5.2
Net foreign assets of commercial banks -4.8 0.0 0.0 0.0 0.0 0.0 0.0 0.0 0.0
Financing gap 2 0.0 1.3 25.0 0.7 43.2 0.0 0.0 0.0 0.0
Memorandum items :Trade balance (– = deficit) -11.0 -9.8 -9.1 -7.9 -9.8 -7.1 -6.3 -5.6 -5.4Cotton export volume (thousands of metric tons) 149.8 193.2 187.8 210.0 191.1 200.6 212.1 224.2 237.1Current account (– = deficit) -11.9 -10.0 -9.1 -10.7 -10.5 -9.7 -9.0 -8.1 -7.8
Excluding official transfers -15.3 -12.8 -13.8 -12.1 -14.9 -12.4 -11.5 -10.6 -10.3Overall balance (– = deficit) -1.0 -0.4 0.2 0.4 -0.8 -0.1 0.8 1.0 0.9Gross international reserves
CFAF billions 438.7 424.1 479.1 442.2 445.8 441.4 474.1 523.4 568.7Months of imports of goods and services 5.4 5.3 5.6 4.8 4.6 4.2 4.2 4.5 4.6
GDP at current prices (CFAF billions) 3,648 3,844 3,836 4,084 4,075 4,380 4,736 5,120 5,537
Sources: Burkinabè authorities and IMF staff estimates.
2 To be covered by PRGF and other disbursements.
(CFAF billions)
1 IMF Country Report 09/222.
2008 2009 2010
(Percent of GDP, unles otherwise indicated)
30
Table 3. Burkina Faso: Consolidated Operations of the Central Government, 2008–14
2011 2012 2013 2014Prog.1 Proj. Proj. Proj. Proj. Proj.
Prog.1 Proj. Prog.1 Proj. Prog.1 Proj.(CFAF billions)
Total revenue and grants 630.8 394.2 342.3 599.9 547.1 751.0 778.0 783.6 812.7 907.8 990.0 1070.7 1142.8Total revenue 483.8 274.5 262.6 391.0 381.1 508.4 506.8 563.7 553.8 634.0 709.3 781.8 872.0
Tax revenue 444.7 253.2 242.5 359.2 349.7 466.0 463.1 518.8 509.7 583.9 653.1 718.8 801.3Income and profits 103.5 67.5 62.5 89.9 84.6 111.5 106.3 122.5 126.1 143.3 158.7 175.7 194.6Domestic goods and services 243.8 135.1 131.9 194.7 193.2 255.6 257.0 281.8 282.5 324.6 364.8 403.4 452.0International trade 81.8 42.1 40.8 61.8 60.9 81.9 83.9 96.0 85.0 97.8 109.2 116.7 129.0Other 15.6 8.5 7.4 12.8 10.9 17.0 15.9 18.4 16.1 18.2 20.5 22.9 25.7
Nontax revenue 39.2 21.2 20.1 31.8 31.5 42.4 43.7 44.9 44.1 50.1 56.2 63.0 70.7Grants 146.9 119.7 79.7 208.9 165.9 242.6 271.1 219.9 258.8 273.8 280.7 288.9 270.8
Project 58.7 67.4 47.3 101.1 81.0 134.9 129.9 162.4 121.4 197.9 202.4 207.8 178.7Program 88.2 52.3 32.5 107.7 85.0 107.7 141.3 57.5 137.4 75.9 78.3 81.1 92.1
Expenditure and net lending 2 791.9 471.2 409.0 706.7 667.3 947.1 1036.3 970.1 1031.0 1080.1 1165.2 1256.3 1349.5Current expenditure 455.2 239.3 246.8 358.9 374.5 483.3 514.9 482.8 529.1 547.7 589.4 633.7 676.0
Wages and salaries 198.8 105.7 110.7 158.6 170.5 211.4 229.9 218.5 241.8 254.0 270.0 286.7 310.1Goods and services 95.3 50.0 49.1 75.0 75.0 99.9 112.2 98.0 107.0 109.5 118.4 128.0 138.4Interest payments 12.7 6.7 7.0 10.0 10.7 13.4 14.0 15.1 15.4 17.8 21.1 24.5 28.2Current transfers 148.4 76.9 80.0 115.3 118.4 158.6 158.8 151.1 164.8 166.4 180.0 194.6 199.3
Investment expenditure 325.1 232.9 166.3 349.4 297.3 465.8 526.5 489.3 503.9 534.3 577.8 624.6 675.5Domestically financed 200.4 91.7 77.9 137.6 138.4 183.5 259.2 200.1 233.6 169.0 202.6 230.6 293.7
Capital transfers 6.2 3.5 2.5 5.3 5.1 7.0 25.5 7.0 9.4 7.0 7.0 7.0 7.0Exonerations 27.1 16.5 14.9 24.8 24.8 33.0 33.0 20.0 25.0 20.0 20.0 20.0 20.0Other investment expenditure 167.2 71.7 60.6 107.6 108.5 143.5 200.7 173.1 199.2 142.0 175.6 203.6 266.7
Externally financed 124.6 141.2 88.3 211.8 158.9 282.3 267.3 289.2 270.2 365.4 375.2 394.1 381.9Net lending 11.6 -1.0 -4.0 -1.5 -4.5 -2.0 -5.0 -2.0 -2.0 -2.0 -2.0 -2.0 -2.0
Overall balance (commitment basis) -161.1 -77.0 -66.7 -106.8 -120.2 -196.1 -258.4 -186.5 -218.3 -172.2 -175.1 -185.7 -206.7Excluding grants -308.0 -196.7 -146.4 -315.7 -286.2 -438.7 -529.5 -406.4 -477.1 -446.1 -455.9 -474.6 -477.5
Cash basis adjustment 15.8 -3.0 33.8 -4.5 0.0 -6.0 -22.9 -6.5 0.0 -5.1 0.0 0.0 0.0Change in payment arrears 0.0 -3.0 0.0 -4.5 0.0 -6.0 -22.9 -6.5 0.0 -5.1 0.0 0.0 0.0Expenditures authorized without payment orders -36.9 0.0 19.1 0.0 0.0 0.0 0.0 0.0 0.0 0.0 0.0 0.0 0.0Payment orders not executed 1.9 0.0 3.6 0.0 0.0 0.0 0.0 0.0 0.0 0.0 0.0 0.0 0.0Change in treasury commitments 50.7 0.0 21.6 0.0 0.0 0.0 0.0 0.0 0.0 0.0 0.0 0.0 0.0Change in Basic Education Fund account 0.0 0.0 -10.5 0.0 0.0 0.0 0.0 0.0 0.0 0.0 0.0 0.0 0.0
Overall balance (cash basis) -145.3 -80.0 -32.9 -111.3 -120.2 -202.1 -281.3 -193.0 -218.3 -177.3 -175.1 -185.7 -206.7Excluding grants -292.2 -199.7 -112.6 -320.2 -286.2 -444.7 -552.4 -412.9 -477.1 -451.2 -455.9 -474.6 -477.5
Errors and omissions 2.1 0.0 -4.8 0.0 0.0 0.0 0.0 0.0 0.0 0.0 0.0 0.0 0.0
Financing 143.2 79.3 37.7 110.7 107.7 200.8 256.3 192.2 175.1 177.3 175.1 185.7 206.7Foreign financing 102.3 80.6 33.5 113.5 81.0 146.4 136.7 153.6 154.2 206.0 211.0 226.2 247.9
Drawings 115.3 88.6 41.1 125.5 92.6 162.4 152.1 169.1 170.8 223.2 230.4 248.3 270.8Project loans 69.3 73.7 41.1 110.6 77.9 147.5 137.5 126.8 148.8 167.4 172.8 186.2 203.1Program loans 45.9 14.9 0.0 14.9 14.6 14.9 14.6 42.3 22.0 55.8 57.6 62.1 67.7
Amortization (excl. IMF) -13.0 -8.0 -7.5 -12.0 -11.6 -15.9 -15.4 -15.5 -16.6 -17.3 -19.4 -22.2 -22.9Domestic financing 40.9 -1.3 -8.3 -2.8 26.7 54.4 119.6 38.7 20.9 -28.6 -35.8 -40.5 -41.2
Bank financing 34.3 -38.3 -20.2 -89.8 -63.6 -9.3 22.6 4.7 5.8 0.0 0.0 0.0 0.0Central bank 47.3 -35.8 -34.8 -86.0 -47.4 -4.3 27.6 4.7 5.8 0.0 0.0 0.0 0.0Commercial banks -12.9 -2.5 27.1 -3.8 -3.8 -5.0 -5.0 0.0 0.0 0.0 0.0 0.0 0.0
Nonbank financing 6.6 37.0 11.8 87.0 90.4 63.7 97.0 34.0 15.2 -28.6 -35.8 -40.5 -41.2Government bonds -12.3 10.0 33.8 60.0 61.8 36.7 61.8 34.0 15.2 -28.6 -35.8 -40.5 -41.2
New issues 30.9 28.0 53.5 88.0 94.5 98.0 94.5 34.0 43.0 0.0 0.0 0.0 0.0Amortization -43.3 -18.0 -19.7 -28.0 -32.7 -61.3 -32.7 0.0 -27.8 -28.6 -35.8 -40.5 -41.2
Privatization revenue 2.9 27.0 28.6 27.0 28.6 27.0 35.2 0.0 0.0 0.0 0.0 0.0 0.0 Other nonbank financing 16.0 0.0 -50.6 0.0 0.0 0.0 0.0 0.0 0.0 0.0 0.0 0.0 0.0
Financing gap 3 0.0 0.7 0.0 0.6 0.0 1.3 25.0 0.7 43.2 0.0 0.0 0.0 0.0
Memorandum items :Poverty-reducing expenditure 198.5 106.0 104.5 164.4 164.4 216.4 259.5 236.9 274.5 300.6 331.5 358.4 387.6
Of which : Education 82.2 ... ... ... ... 91.0 98.5 100.4 109.2 126.3 136.6 147.7 159.7Health 60.1 ... ... ... ... 69.8 69.8 76.9 83.8 99.2 107.3 116.0 125.5
Nominal GDP ... 3,648 ... ... ... ... 3,844 3,836 4,084 4,075 4,380 4,736 5,120 5,537
(continued)
2010Dec.
2008Jun. Sep.
2009Est.
31
Table 3. Burkina Faso: Consolidated Operations of the Central Government, 2008–14 (concluded)
2011 2012 2013 2014Est. Prog.1 Proj. Prog.1 Proj. Proj. Proj. Proj. Proj.
(Percent of GDP, unless otherwise indicated)
Total revenues and grants 17.3 19.5 20.3 19.2 19.9 20.7 20.9 20.9 20.6Total revenue 13.3 13.2 13.2 13.8 13.6 14.5 15.0 15.3 15.7
Tax revenue 12.2 12.1 12.1 12.7 12.5 13.3 13.8 14.0 14.5Income and profits 2.8 2.9 2.8 3.0 3.1 3.3 3.4 3.4 3.5Domestic goods and services 6.7 6.7 6.7 6.9 6.9 7.4 7.7 7.9 8.2International trade 2.2 2.1 2.2 2.4 2.1 2.2 2.3 2.3 2.3Other 0.4 0.4 0.4 0.5 0.4 0.4 0.4 0.4 0.5
Nontax revenue 1.1 1.1 1.1 1.1 1.1 1.1 1.2 1.2 1.3Grants 4.0 6.3 7.1 5.4 6.4 6.3 5.9 5.6 4.9
Project 1.6 3.5 3.4 4.0 3.0 4.5 4.3 4.1 3.2Program 2.4 2.8 3.7 1.4 3.4 1.7 1.7 1.6 1.7
Expenditure and net lending 2 21.7 24.6 27.0 23.8 25.3 24.7 24.6 24.5 24.4Current expenditure 12.5 12.6 13.4 11.8 13.0 12.5 12.4 12.4 12.2
Wages and salaries 5.5 5.5 6.0 5.4 5.9 5.8 5.7 5.6 5.6Goods and services 2.6 2.6 2.9 2.4 2.6 2.5 2.5 2.5 2.5Interest payments 0.3 0.3 0.4 0.4 0.4 0.4 0.4 0.5 0.5Current transfers 4.1 4.1 4.1 3.7 4.0 3.8 3.8 3.8 3.6
Investment expenditure 8.9 12.1 13.7 12.0 12.4 12.2 12.2 12.2 12.2Domestically financed 5.5 4.8 6.8 4.9 5.7 3.9 4.3 4.5 5.3
Capital transfers 0.2 0.2 0.7 0.2 0.2 0.2 0.1 0.1 0.1Exonerations 0.7 0.9 0.9 0.5 0.6 0.5 0.4 0.4 0.4Other investment expenditure 4.6 3.7 5.2 4.2 4.9 3.2 3.7 4.0 4.8
Externally financed 3.4 7.3 7.0 7.1 6.6 8.3 7.9 7.7 6.9Net lending 0.3 -0.1 -0.1 0.0 0.0 0.0 0.0 0.0 0.0
Overall balance (commitment basis) -4.4 -5.1 -6.7 -4.6 -5.4 -3.9 -3.7 -3.6 -3.7Excluding grants -8.4 -11.4 -13.8 -9.9 -11.7 -10.2 -9.6 -9.3 -8.6
Cash basis adjustment 0.4 -0.2 -0.6 -0.2 0.0 -0.1 0.0 0.0 0.0Change in payment arrears 0.0 -0.2 -0.6 -0.2 0.0 -0.1 0.0 0.0 0.0Expenditures authorized without payment orders -1.0 0.0 0.0 0.0 0.0 0.0 0.0 0.0 0.0Payment orders not executed 0.1 0.0 0.0 0.0 0.0 0.0 0.0 0.0 0.0Change in treasury commitments 1.4 0.0 0.0 0.0 0.0 0.0 0.0 0.0 0.0Change in Basic Education Fund account 0.0 0.0 0.0 0.0 0.0 0.0 0.0 0.0 0.0
Overall balance (cash basis) -4.0 -5.3 -7.3 -4.7 -5.4 -4.0 -3.7 -3.6 -3.7Excluding grants -8.0 -11.6 -14.4 -10.1 -11.7 -10.3 -9.6 -9.3 -8.6
Errors and omissions 0.1 0.0 0.0 0.0 0.0 0.0 0.0 0.0 0.0
Financing 3.9 5.2 6.7 4.7 4.3 4.0 3.7 3.6 3.7Foreign 2.8 3.8 3.6 3.8 3.8 4.7 4.5 4.4 4.5
Drawings 3.2 4.2 4.0 4.1 4.2 5.1 4.9 4.8 4.9Project loans 1.9 3.8 3.6 3.1 3.7 3.8 3.6 3.6 3.7Program loans 1.3 0.4 0.4 1.0 0.5 1.3 1.2 1.2 1.2
Amortization (excl. IMF) -0.4 -0.4 -0.4 -0.4 -0.4 -0.4 -0.4 -0.4 -0.4Domestic financing 1.1 1.4 3.1 0.9 0.5 -0.7 -0.8 -0.8 -0.7
Bank financing 0.9 -0.2 0.6 0.1 0.1 0.0 0.0 0.0 0.0Central bank 1.3 -0.1 0.7 0.1 0.1 0.0 0.0 0.0 0.0Commercial banks -0.4 -0.1 -0.1 0.0 0.0 0.0 0.0 0.0 0.0
Nonbank financing 0.2 1.7 2.5 0.8 0.4 -0.7 -0.8 -0.8 -0.7Government bonds -0.3 1.0 1.6 0.8 0.4 -0.7 -0.8 -0.8 -0.7
New issues 0.8 2.5 2.5 0.8 1.1 0.0 0.0 0.0 0.0Amortization -1.2 -1.6 -0.9 0.0 -0.7 -0.7 -0.8 -0.8 -0.7
Privatization revenue 0.1 0.7 0.9 0.0 0.0 0.0 0.0 0.0 0.0 Other nonbank financing 0.4 0.0 0.0 0.0 0.0 0.0 0.0 0.0 0.0
Financing gap 3 0.0 0.0 0.7 0.0 1.1 0.0 0.0 0.0 0.0
Memorandum item :Nominal GDP (CFAF billions) 3,648 3,844 3,836 4,084 4,075 4,380 4,736 5,120 5,537
Sources: Burkinabè authorities, and IMF staff estimates.1 IMF Country Report 09/2222 Commitment ("engagement ") basis3 To be covered by PRGF and other disbursements.
2009 20102008
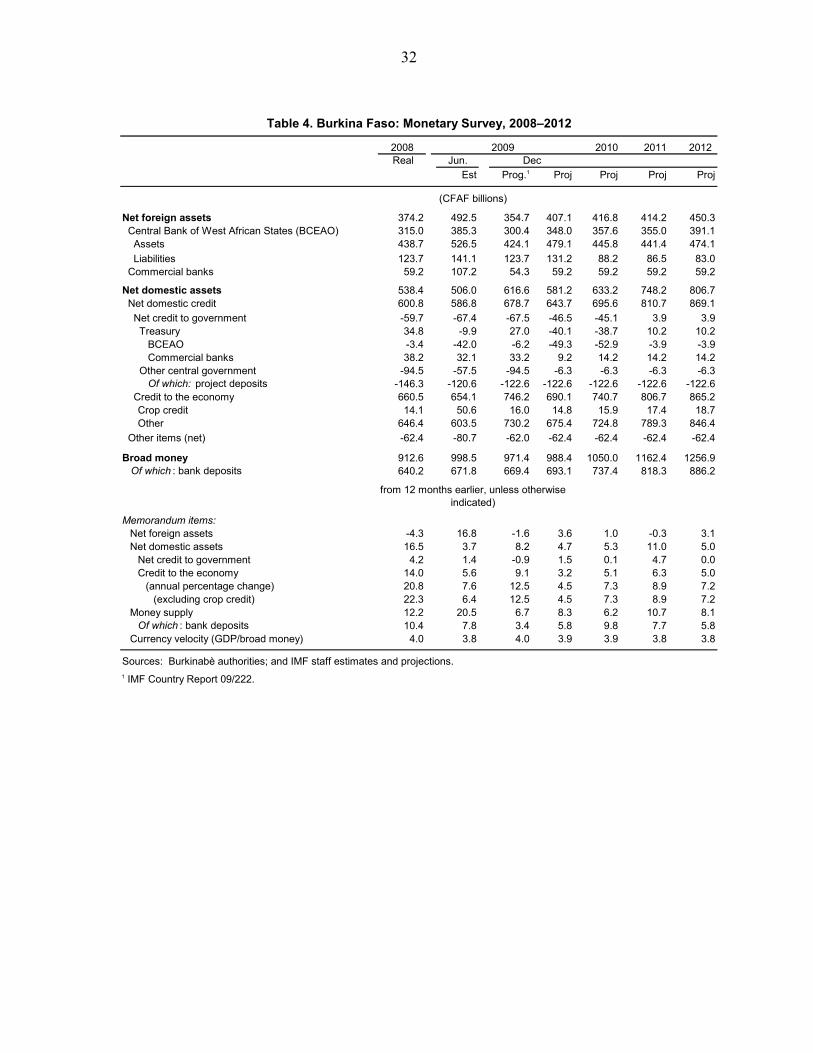
32
Table 4. Burkina Faso: Monetary Survey, 2008–2012
2010 2011 2012
Est Prog.1 Proj Proj Proj Proj
Net foreign assets 374.2 492.5 354.7 407.1 416.8 414.2 450.3 Central Bank of West African States (BCEAO) 315.0 385.3 300.4 348.0 357.6 355.0 391.1 Assets 438.7 526.5 424.1 479.1 445.8 441.4 474.1
Liabilities 123.7 141.1 123.7 131.2 88.2 86.5 83.0 Commercial banks 59.2 107.2 54.3 59.2 59.2 59.2 59.2
Net domestic assets 538.4 506.0 616.6 581.2 633.2 748.2 806.7 Net domestic credit 600.8 586.8 678.7 643.7 695.6 810.7 869.1
Net credit to government -59.7 -67.4 -67.5 -46.5 -45.1 3.9 3.9 Treasury 34.8 -9.9 27.0 -40.1 -38.7 10.2 10.2 BCEAO -3.4 -42.0 -6.2 -49.3 -52.9 -3.9 -3.9 Commercial banks 38.2 32.1 33.2 9.2 14.2 14.2 14.2 Other central government -94.5 -57.5 -94.5 -6.3 -6.3 -6.3 -6.3 Of which: project deposits -146.3 -120.6 -122.6 -122.6 -122.6 -122.6 -122.6 Credit to the economy 660.5 654.1 746.2 690.1 740.7 806.7 865.2
Crop credit 14.1 50.6 16.0 14.8 15.9 17.4 18.7Other 646.4 603.5 730.2 675.4 724.8 789.3 846.4
Other items (net) -62.4 -80.7 -62.0 -62.4 -62.4 -62.4 -62.4
Broad money 912.6 998.5 971.4 988.4 1050.0 1162.4 1256.9 Of which : bank deposits 640.2 671.8 669.4 693.1 737.4 818.3 886.2
Memorandum items:Net foreign assets -4.3 16.8 -1.6 3.6 1.0 -0.3 3.1Net domestic assets 16.5 3.7 8.2 4.7 5.3 11.0 5.0
Net credit to government 4.2 1.4 -0.9 1.5 0.1 4.7 0.0Credit to the economy 14.0 5.6 9.1 3.2 5.1 6.3 5.0
(annual percentage change) 20.8 7.6 12.5 4.5 7.3 8.9 7.2(excluding crop credit) 22.3 6.4 12.5 4.5 7.3 8.9 7.2
Money supply 12.2 20.5 6.7 8.3 6.2 10.7 8.1Of which : bank deposits 10.4 7.8 3.4 5.8 9.8 7.7 5.8
Currency velocity (GDP/broad money) 4.0 3.8 4.0 3.9 3.9 3.8 3.8
Sources: Burkinabè authorities; and IMF staff estimates and projections.
DecJun.2008Real
1 IMF Country Report 09/222.
2009
( g p yfrom 12 months earlier, unless otherwise
indicated)
(CFAF billions)
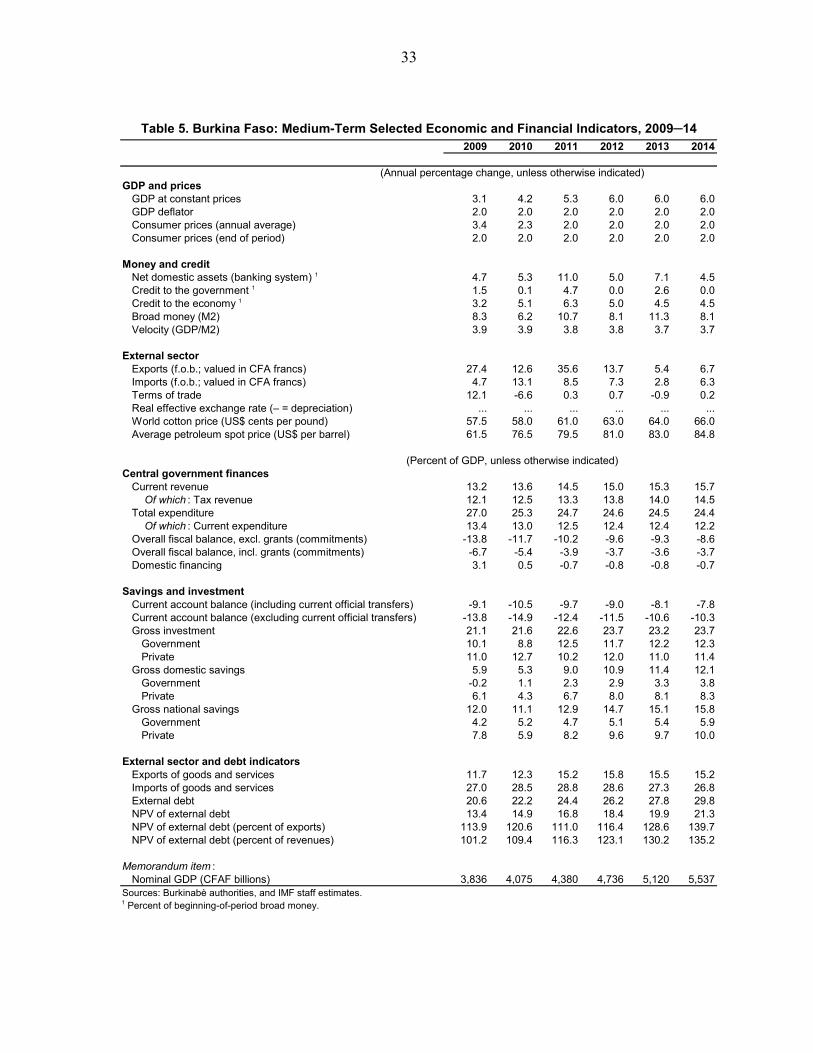
33
Table 5. Burkina Faso: Medium-Term Selected Economic and Financial Indicators, 2009─142009 2010 2011 2012 2013 2014
(Annual percentage change, unless otherwise indicated)GDP and prices
GDP at constant prices 3.1 4.2 5.3 6.0 6.0 6.0GDP deflator 2.0 2.0 2.0 2.0 2.0 2.0Consumer prices (annual average) 3.4 2.3 2.0 2.0 2.0 2.0Consumer prices (end of period) 2.0 2.0 2.0 2.0 2.0 2.0
Money and creditNet domestic assets (banking system) 1 4.7 5.3 11.0 5.0 7.1 4.5Credit to the government 1 1.5 0.1 4.7 0.0 2.6 0.0Credit to the economy 1 3.2 5.1 6.3 5.0 4.5 4.5Broad money (M2) 8.3 6.2 10.7 8.1 11.3 8.1Velocity (GDP/M2) 3.9 3.9 3.8 3.8 3.7 3.7
External sectorExports (f.o.b.; valued in CFA francs) 27.4 12.6 35.6 13.7 5.4 6.7Imports (f.o.b.; valued in CFA francs) 4.7 13.1 8.5 7.3 2.8 6.3Terms of trade 12.1 -6.6 0.3 0.7 -0.9 0.2Real effective exchange rate (– = depreciation) ... ... ... ... ... ...World cotton price (US$ cents per pound) 57.5 58.0 61.0 63.0 64.0 66.0Average petroleum spot price (US$ per barrel) 61.5 76.5 79.5 81.0 83.0 84.8
(Percent of GDP, unless otherwise indicated)Central government finances
Current revenue 13.2 13.6 14.5 15.0 15.3 15.7 Of which : Tax revenue 12.1 12.5 13.3 13.8 14.0 14.5
Total expenditure 27.0 25.3 24.7 24.6 24.5 24.4 Of which : Current expenditure 13.4 13.0 12.5 12.4 12.4 12.2
Overall fiscal balance, excl. grants (commitments) -13.8 -11.7 -10.2 -9.6 -9.3 -8.6Overall fiscal balance, incl. grants (commitments) -6.7 -5.4 -3.9 -3.7 -3.6 -3.7Domestic financing 3.1 0.5 -0.7 -0.8 -0.8 -0.7
Savings and investmentCurrent account balance (including current official transfers) -9.1 -10.5 -9.7 -9.0 -8.1 -7.8Current account balance (excluding current official transfers) -13.8 -14.9 -12.4 -11.5 -10.6 -10.3Gross investment 21.1 21.6 22.6 23.7 23.2 23.7
Government 10.1 8.8 12.5 11.7 12.2 12.3Private 11.0 12.7 10.2 12.0 11.0 11.4
Gross domestic savings 5.9 5.3 9.0 10.9 11.4 12.1Government -0.2 1.1 2.3 2.9 3.3 3.8Private 6.1 4.3 6.7 8.0 8.1 8.3
Gross national savings 12.0 11.1 12.9 14.7 15.1 15.8Government 4.2 5.2 4.7 5.1 5.4 5.9Private 7.8 5.9 8.2 9.6 9.7 10.0
External sector and debt indicatorsExports of goods and services 11.7 12.3 15.2 15.8 15.5 15.2Imports of goods and services 27.0 28.5 28.8 28.6 27.3 26.8External debt 20.6 22.2 24.4 26.2 27.8 29.8NPV of external debt 13.4 14.9 16.8 18.4 19.9 21.3NPV of external debt (percent of exports) 113.9 120.6 111.0 116.4 128.6 139.7NPV of external debt (percent of revenues) 101.2 109.4 116.3 123.1 130.2 135.2
Memorandum item :Nominal GDP (CFAF billions) 3,836 4,075 4,380 4,736 5,120 5,537
Sources: Burkinabè authorities, and IMF staff estimates.1 Percent of beginning-of-period broad money.

34
Table 6. Burkina Faso: Indicators of Capacity to Repay the Fund, 2008–15
2008 2009 2010 2011 2012 2013 2014 2015Actual Projections
Principal 0.0 0.0 0.7 2.4 4.7 5.1 7.2 6.6Charges and interest 0.4 0.1 0.2 0.2 0.2 0.2 0.1 0.1
Principal 0.0 0.0 0.7 2.4 4.7 5.1 7.2 13.2Charges and interest 0.4 0.1 0.4 0.4 0.4 0.3 0.3 0.3
SDR millions 0.4 0.1 1.1 2.8 5.0 5.4 7.4 13.4CFAF billions 0.3 0.1 0.7 1.9 3.4 3.7 5.1 9.2Percent of exports of goods and services 0.1 0.0 0.1 0.3 0.5 0.5 0.6 1.0Percent of debt service 1 1.4 0.3 2.8 6.5 9.5 8.7 10.5 17.0Percent of GDP 0.0 0.0 0.0 0.0 0.1 0.1 0.1 0.2Percent of Tax Revenue 0.1 0.0 0.1 0.3 0.5 0.5 0.6 1.0Percent of quota 0.7 0.2 1.8 4.6 8.4 9.0 12.4 22.3
Outstanding Fund creditSDR millions 35.3 69.4 68.7 66.3 61.6 56.5 49.3 36.2CFAF billions 24.3 47.5 46.9 45.2 41.9 38.5 33.6 24.6Percent of exports of goods and services 6.7 10.5 9.3 6.8 5.6 4.9 4.0 2.8Percent of debt service 1 117.3 198.8 182.0 154.0 115.5 90.5 69.8 45.8Percent of GDP 0.7 1.2 1.2 1.0 0.9 0.8 0.6 0.4Percent of Tax Revenue 5.5 10.2 9.2 7.7 6.4 5.4 4.2 2.8Percent of quota 58.6 115.2 114.1 110.1 102.3 93.8 82.0 60.0
Net use of Fund credit (SDR millions) 11.5 35.1 0.3 -2.4 -4.7 -5.1 -7.2 -13.2Disbursements 11.5 35.1 1.0 0.0 0.0 0.0 0.0 0.0Repayments and Repurchases 0.0 0.0 0.7 2.4 4.7 5.1 7.2 13.2
Memorandum items:Exports of goods and services (CFAF billions) 363.7 450.3 502.4 663.9 750.1 791.3 844.2 882.6Debt service (CFAF billions) 1 20.7 23.9 25.8 29.4 36.3 42.5 48.1 53.7Nominal GDP (CFAF billions) 3,648 3,836 4,075 4,380 4,736 5,120 5,537 5,988Tax Revenue (CFAF billions) 444.7 463.1 509.7 583.9 653.1 718.8 801.3 889.3Quota (SDR millions) 60.2 60.2 60.2 60.2 60.2 60.2 60.2 60.2
Sources: IMF staff estimates and projections.
Fund obligations based on existing credit(SDR millions)
Fund obligations based on existing and prospective credit(SDR millions)
1Total debt service includes IMF repurchases and repayments.
Total obligations based on existing and prospective credit
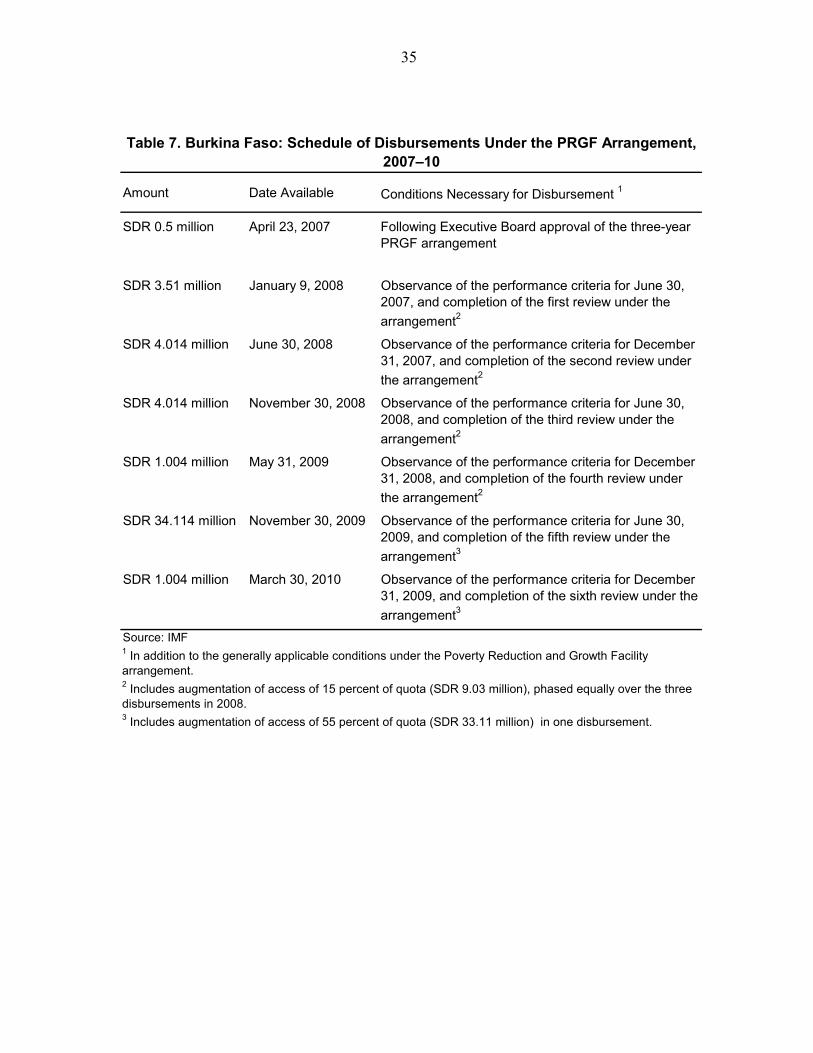
35
Amount Date Available Conditions Necessary for Disbursement 1
SDR 0.5 million April 23, 2007 Following Executive Board approval of the three-year PRGF arrangement
SDR 3.51 million January 9, 2008 Observance of the performance criteria for June 30, 2007, and completion of the first review under the
arrangement2
SDR 4.014 million June 30, 2008 Observance of the performance criteria for December 31, 2007, and completion of the second review under
the arrangement2
SDR 4.014 million November 30, 2008 Observance of the performance criteria for June 30, 2008, and completion of the third review under the
arrangement2
SDR 1.004 million May 31, 2009 Observance of the performance criteria for December 31, 2008, and completion of the fourth review under
the arrangement2
SDR 34.114 million November 30, 2009 Observance of the performance criteria for June 30, 2009, and completion of the fifth review under the
arrangement3
SDR 1.004 million March 30, 2010 Observance of the performance criteria for December 31, 2009, and completion of the sixth review under the
arrangement3
Source: IMF
Table 7. Burkina Faso: Schedule of Disbursements Under the PRGF Arrangement, 2007–10
3 Includes augmentation of access of 55 percent of quota (SDR 33.11 million) in one disbursement.
1 In addition to the generally applicable conditions under the Poverty Reduction and Growth Facility arrangement.2 Includes augmentation of access of 15 percent of quota (SDR 9.03 million), phased equally over the three disbursements in 2008.
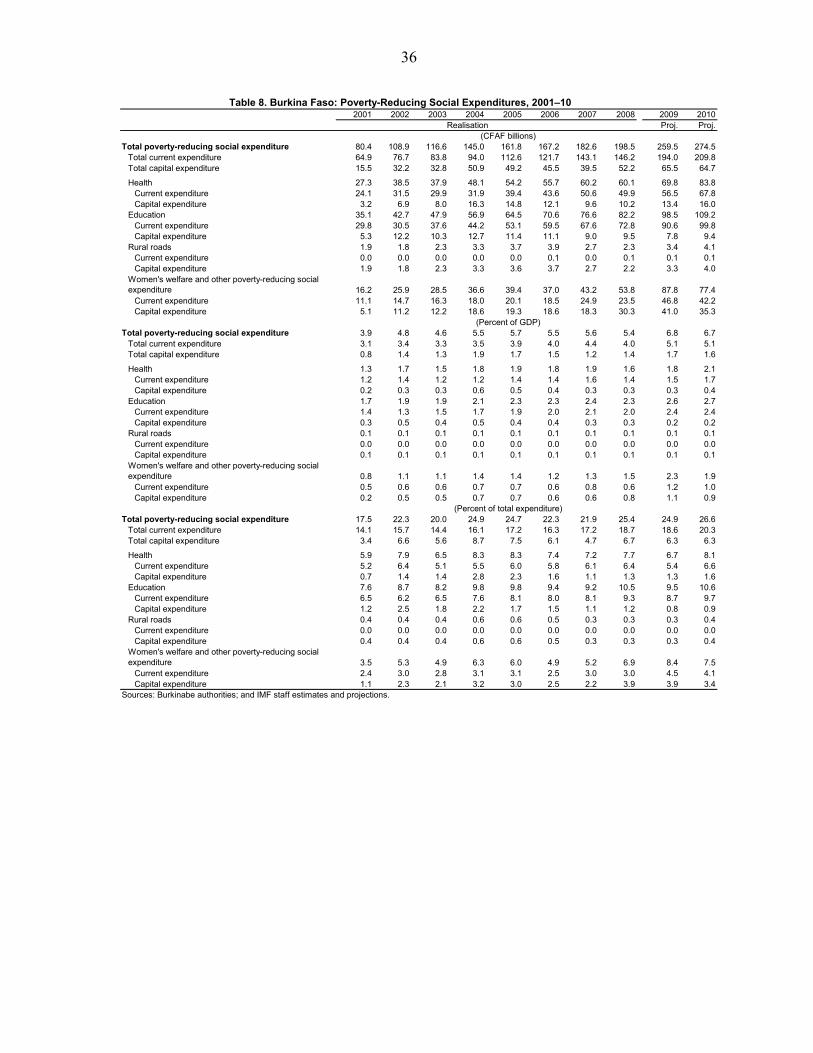
36
2001 2002 2003 2004 2005 2006 2007 2008 2009 2010Proj. Proj.
Total poverty-reducing social expenditure 80.4 108.9 116.6 145.0 161.8 167.2 182.6 198.5 259.5 274.5Total current expenditure 64.9 76.7 83.8 94.0 112.6 121.7 143.1 146.2 194.0 209.8Total capital expenditure 15.5 32.2 32.8 50.9 49.2 45.5 39.5 52.2 65.5 64.7
Health 27.3 38.5 37.9 48.1 54.2 55.7 60.2 60.1 69.8 83.8Current expenditure 24.1 31.5 29.9 31.9 39.4 43.6 50.6 49.9 56.5 67.8Capital expenditure 3.2 6.9 8.0 16.3 14.8 12.1 9.6 10.2 13.4 16.0
Education 35.1 42.7 47.9 56.9 64.5 70.6 76.6 82.2 98.5 109.2Current expenditure 29.8 30.5 37.6 44.2 53.1 59.5 67.6 72.8 90.6 99.8Capital expenditure 5.3 12.2 10.3 12.7 11.4 11.1 9.0 9.5 7.8 9.4
Rural roads 1.9 1.8 2.3 3.3 3.7 3.9 2.7 2.3 3.4 4.1Current expenditure 0.0 0.0 0.0 0.0 0.0 0.1 0.0 0.1 0.1 0.1Capital expenditure 1.9 1.8 2.3 3.3 3.6 3.7 2.7 2.2 3.3 4.0
Women's welfare and other poverty-reducing social expenditure 16.2 25.9 28.5 36.6 39.4 37.0 43.2 53.8 87.8 77.4
Current expenditure 11.1 14.7 16.3 18.0 20.1 18.5 24.9 23.5 46.8 42.2Capital expenditure 5.1 11.2 12.2 18.6 19.3 18.6 18.3 30.3 41.0 35.3
Total poverty-reducing social expenditure 3.9 4.8 4.6 5.5 5.7 5.5 5.6 5.4 6.8 6.7Total current expenditure 3.1 3.4 3.3 3.5 3.9 4.0 4.4 4.0 5.1 5.1Total capital expenditure 0.8 1.4 1.3 1.9 1.7 1.5 1.2 1.4 1.7 1.6
Health 1.3 1.7 1.5 1.8 1.9 1.8 1.9 1.6 1.8 2.1Current expenditure 1.2 1.4 1.2 1.2 1.4 1.4 1.6 1.4 1.5 1.7Capital expenditure 0.2 0.3 0.3 0.6 0.5 0.4 0.3 0.3 0.3 0.4
Education 1.7 1.9 1.9 2.1 2.3 2.3 2.4 2.3 2.6 2.7Current expenditure 1.4 1.3 1.5 1.7 1.9 2.0 2.1 2.0 2.4 2.4Capital expenditure 0.3 0.5 0.4 0.5 0.4 0.4 0.3 0.3 0.2 0.2
Rural roads 0.1 0.1 0.1 0.1 0.1 0.1 0.1 0.1 0.1 0.1Current expenditure 0.0 0.0 0.0 0.0 0.0 0.0 0.0 0.0 0.0 0.0Capital expenditure 0.1 0.1 0.1 0.1 0.1 0.1 0.1 0.1 0.1 0.1
Women's welfare and other poverty-reducing social expenditure 0.8 1.1 1.1 1.4 1.4 1.2 1.3 1.5 2.3 1.9
Current expenditure 0.5 0.6 0.6 0.7 0.7 0.6 0.8 0.6 1.2 1.0Capital expenditure 0.2 0.5 0.5 0.7 0.7 0.6 0.6 0.8 1.1 0.9
Total poverty-reducing social expenditure 17.5 22.3 20.0 24.9 24.7 22.3 21.9 25.4 24.9 26.6Total current expenditure 14.1 15.7 14.4 16.1 17.2 16.3 17.2 18.7 18.6 20.3Total capital expenditure 3.4 6.6 5.6 8.7 7.5 6.1 4.7 6.7 6.3 6.3
Health 5.9 7.9 6.5 8.3 8.3 7.4 7.2 7.7 6.7 8.1Current expenditure 5.2 6.4 5.1 5.5 6.0 5.8 6.1 6.4 5.4 6.6Capital expenditure 0.7 1.4 1.4 2.8 2.3 1.6 1.1 1.3 1.3 1.6
Education 7.6 8.7 8.2 9.8 9.8 9.4 9.2 10.5 9.5 10.6Current expenditure 6.5 6.2 6.5 7.6 8.1 8.0 8.1 9.3 8.7 9.7Capital expenditure 1.2 2.5 1.8 2.2 1.7 1.5 1.1 1.2 0.8 0.9
Rural roads 0.4 0.4 0.4 0.6 0.6 0.5 0.3 0.3 0.3 0.4Current expenditure 0.0 0.0 0.0 0.0 0.0 0.0 0.0 0.0 0.0 0.0Capital expenditure 0.4 0.4 0.4 0.6 0.6 0.5 0.3 0.3 0.3 0.4
Women's welfare and other poverty-reducing social expenditure 3.5 5.3 4.9 6.3 6.0 4.9 5.2 6.9 8.4 7.5
Current expenditure 2.4 3.0 2.8 3.1 3.1 2.5 3.0 3.0 4.5 4.1Capital expenditure 1.1 2.3 2.1 3.2 3.0 2.5 2.2 3.9 3.9 3.4
Sources: Burkinabe authorities; and IMF staff estimates and projections.
Table 8. Burkina Faso: Poverty-Reducing Social Expenditures, 2001–10
(CFAF billions)
(Percent of GDP)
(Percent of total expenditure)
Realisation
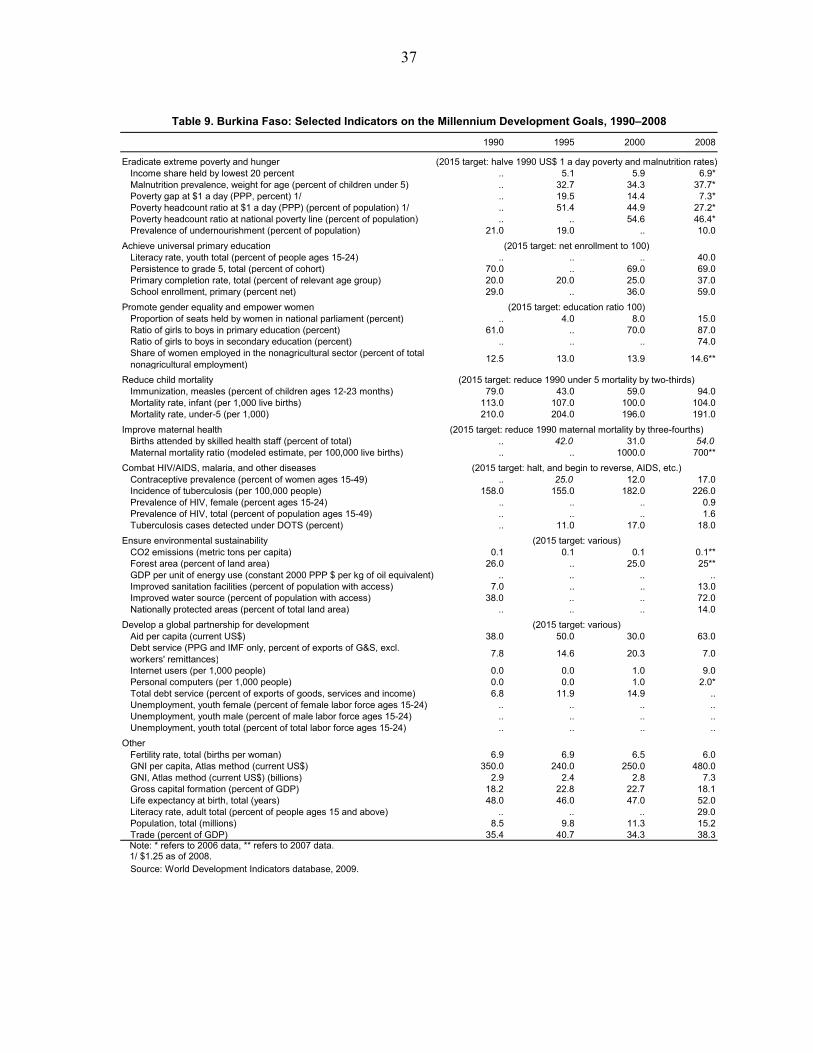
37
1990 1995 2000 2008
Eradicate extreme poverty and hungerIncome share held by lowest 20 percent .. 5.1 5.9 6.9*Malnutrition prevalence, weight for age (percent of children under 5) .. 32.7 34.3 37.7*Poverty gap at $1 a day (PPP, percent) 1/ .. 19.5 14.4 7.3*Poverty headcount ratio at $1 a day (PPP) (percent of population) 1/ .. 51.4 44.9 27.2*Poverty headcount ratio at national poverty line (percent of population) .. .. 54.6 46.4*Prevalence of undernourishment (percent of population) 21.0 19.0 .. 10.0
Achieve universal primary educationLiteracy rate, youth total (percent of people ages 15-24) .. .. .. 40.0Persistence to grade 5, total (percent of cohort) 70.0 .. 69.0 69.0Primary completion rate, total (percent of relevant age group) 20.0 20.0 25.0 37.0School enrollment, primary (percent net) 29.0 .. 36.0 59.0
Promote gender equality and empower womenProportion of seats held by women in national parliament (percent) .. 4.0 8.0 15.0Ratio of girls to boys in primary education (percent) 61.0 .. 70.0 87.0Ratio of girls to boys in secondary education (percent) .. .. .. 74.0Share of women employed in the nonagricultural sector (percent of total nonagricultural employment)
12.5 13.0 13.9 14.6**
Reduce child mortalityImmunization, measles (percent of children ages 12-23 months) 79.0 43.0 59.0 94.0Mortality rate, infant (per 1,000 live births) 113.0 107.0 100.0 104.0Mortality rate, under-5 (per 1,000) 210.0 204.0 196.0 191.0
Improve maternal healthBirths attended by skilled health staff (percent of total) .. 42.0 31.0 54.0Maternal mortality ratio (modeled estimate, per 100,000 live births) .. .. 1000.0 700**
Combat HIV/AIDS, malaria, and other diseasesContraceptive prevalence (percent of women ages 15-49) .. 25.0 12.0 17.0Incidence of tuberculosis (per 100,000 people) 158.0 155.0 182.0 226.0Prevalence of HIV, female (percent ages 15-24) .. .. .. 0.9Prevalence of HIV, total (percent of population ages 15-49) .. .. .. 1.6Tuberculosis cases detected under DOTS (percent) .. 11.0 17.0 18.0
Ensure environmental sustainabilityCO2 emissions (metric tons per capita) 0.1 0.1 0.1 0.1**Forest area (percent of land area) 26.0 .. 25.0 25**GDP per unit of energy use (constant 2000 PPP $ per kg of oil equivalent) .. .. .. ..Improved sanitation facilities (percent of population with access) 7.0 .. .. 13.0Improved water source (percent of population with access) 38.0 .. .. 72.0Nationally protected areas (percent of total land area) .. .. .. 14.0
Develop a global partnership for developmentAid per capita (current US$) 38.0 50.0 30.0 63.0Debt service (PPG and IMF only, percent of exports of G&S, excl. workers' remittances)
7.8 14.6 20.3 7.0
Internet users (per 1,000 people) 0.0 0.0 1.0 9.0Personal computers (per 1,000 people) 0.0 0.0 1.0 2.0*Total debt service (percent of exports of goods, services and income) 6.8 11.9 14.9 ..Unemployment, youth female (percent of female labor force ages 15-24) .. .. .. ..Unemployment, youth male (percent of male labor force ages 15-24) .. .. .. ..Unemployment, youth total (percent of total labor force ages 15-24) .. .. .. ..
OtherFertility rate, total (births per woman) 6.9 6.9 6.5 6.0GNI per capita, Atlas method (current US$) 350.0 240.0 250.0 480.0GNI, Atlas method (current US$) (billions) 2.9 2.4 2.8 7.3Gross capital formation (percent of GDP) 18.2 22.8 22.7 18.1Life expectancy at birth, total (years) 48.0 46.0 47.0 52.0Literacy rate, adult total (percent of people ages 15 and above) .. .. .. 29.0Population, total (millions) 8.5 9.8 11.3 15.2Trade (percent of GDP) 35.4 40.7 34.3 38.3
Note: * refers to 2006 data, ** refers to 2007 data. 1/ $1.25 as of 2008.
Source: World Development Indicators database, 2009.
Table 9. Burkina Faso: Selected Indicators on the Millennium Development Goals, 1990–2008
(2015 target: halve 1990 US$ 1 a day poverty and malnutrition rates)
(2015 target: net enrollment to 100)
(2015 target: education ratio 100)
(2015 target: various)
(2015 target: reduce 1990 under 5 mortality by two-thirds)
(2015 target: reduce 1990 maternal mortality by three-fourths)
(2015 target: halt, and begin to reverse, AIDS, etc.)
(2015 target: various)
38
APPENDIX I – LETTER OF INTENT
Ouagadougou, November 24, 2009
Dominique Strauss-Kahn Managing Director, International Monetary Fund 700 19th Street NW WASHINGTON, DC 20431 (USA) Dear Mr. Strauss-Kahn:
1. The fourth review of our economic and financial program, supported by the Poverty Reduction and Growth Facility (PRGF), was approved by the IMF Executive Board on June 22, 2009. 2. The attached Memorandum of Economic and Financial Policies (MEFP) reviews recent economic developments and progress made in the implementation of our program through end-June 2009. It also sets out the policies the government intends to pursue during the remainder of 2009 and in 2010. 3. In 2008-09, the Burkinabè economy suffered three major shocks: the energy and food crisis, the international financial and economic crisis, and a natural disaster in the form of torrential rains, which caused severe floods on September 1, 2009. These three shocks had an important impact on the external sector and on the fiscal position, and they affected the welfare of the population. They resulted in: (i) a decline in cotton prices, Burkina Faso’s primary export commodity; (ii) the increase in the oil bill and the cost of cotton fertilizers; (iii) the slowdown in economic growth; (iv) the decrease in certain categories of budget revenues; (v) the destruction of road and administrative infrastructure; (vi) a humanitarian crisis involving 180,000 people that the government had to cater, with the support of donors, humanitarian agencies, and the collective efforts of the population; and (vii) the destruction of critical biomedical equipment and health infrastructure. Based on initial estimates, the impact of the flooding amounts to about 2 percent of GDP. This challenging environment has put an important strain on the budget framework for 2009 and 2010. 4. In spite of the difficult economic environment, the government continued its reform and fiscal consolidation efforts. All quantitative objectives under the program for end-June were met. However, the indicative target for revenue could not be achieved because of the impact of exogenous shocks on economic activity. Some delays in expenditure execution also hampered the attainment of the indicative target for social spending. Structural benchmarks for end-September were observed, except for one that was met in mid-October.
39
5. Steady progress was made to enhance revenue performance. With respect to tax reform, detailed proposals were adopted by the Council of Ministers and forwarded to the National Assembly at end-October. They cover the introduction of the corporate tax, the rationalization of the investment code, and the strengthening of the VAT system. These proposals were prepared based on the guidelines for the comprehensive tax policy reform strategy, WAEMU directives, and IMF recommendations. They also reflect the findings of the tax policy simulations. 6. Despite the challenging environment, the government remains committed to achieving further fiscal consolidation, with the aim of safeguarding fiscal sustainability in the medium term, while strengthening the outlook for growth. In this context, as indicated in the attached MEFP, for 2010, the government intends to implement major tax reforms, strengthen the expenditure management, and pursue other structural reforms initiated in 2009 in the cotton and financial sectors. 7. In light of its overall performance and based on the policies set forth in the attached memorandum, the government requests the completion of the fifth review of the PRGF-supported program and the sixth disbursement, for SDR 1.004 million. 8. However, given the increase in budget financing needs in the aftermath of the exogenous shocks referred to above, the government—while exploring the possibilities for raising additional resources from Burkina Faso’s other development partners—is seeking additional resources from the IMF through an augmentation of access under the PRGF for SDR 33.11 million (55 percent of quota) to be made available in one disbursement at the completion of the fifth review; and the modification of the performance criterion on the overall fiscal deficit for the sixth review. 9. The government believes that the measures set forth in the attached MEFP will allow it to achieve the objectives of its program in a challenging economic environment, characterized by repercussions from the global economic and financial crisis compounded by the humanitarian and reconstruction challenges created by the September 1, 2009 the natural disaster. The government remains determined to take any other appropriate measures that may prove necessary to achieve the program objectives. Burkina Faso would then consult with the Fund before revising any of the policies contained in the attached MEFP, in accordance with the Fund’s policy on such consultation. 10. It is expected that the sixth review of the PRGF-supported program will be completed by April 15, 2010. 11. The government wishes to substitute the Extended Credit Facility (ECF) for the existing PRGF once the amendments to the PRGF-ESF Trust that create the ECF have been approved. A new three-year program under the ECF will serve to support the government’s
40
development efforts whose general principles, currently being reviewed, will be defined in a strategy for faster growth and sustainable development (Stratégie de croissance accélérée et de développement durable—SCADD), currently under preparation. 12. The government plans to make available to the public the content of this Letter of Intent and its attachments, i.e., the MEFP and the Technical Memorandum of Understanding, as well as the IMF staff report and annexes for information. Therefore, the government authorizes the IMF to publish these documents on the IMF website once the Executive Board completes its review.
Sincerely yours,
/s/
Lucien Marie Noël BEMBAMBA
Minister of Economy and Finance Officier de l’Ordre National
Attachments: Memorandum on Economic and Financial Policies, 2009-2010 Revised Technical Memorandum of Understanding
41
APPENDIX I―ATTACHMENT 1
MEMORANDUM ON ECONOMIC AND FINANCIAL POLICIES FOR 2009/10
I. INTRODUCTION
1. The economic recovery that began in 2008, slowed down in 2009, mostly because of the global economic and financial crisis. Economic growth reached 5.2 percent in 2008, after a slowdown in 2006-07, thanks to an expansion of agricultural production and an increase in investment in the mining sector. In 2009, economic growth is expected to decline to 3.1 percent, primarily reflecting the impact of the international financial crisis on the economy, particularly in the cotton and service sectors.
2. The agriculture sector performed well in 2008-09. Food production increased by 41 percent, while cottonseed production amounted to 447,100 tons, up by 26 percent. However, the collapse in international cotton prices led to a cumulative loss of CFAF 12.2 billion for the three cotton ginning companies. The 2009/10 crop year is taking place in a difficult economic environment marked on the one hand by difficulties for ginning companies to get sales contracts because of low demand for textile, which has caused delays in shipping out ginned cotton; and on the other hand by the late arrival of rains.
3. The mining sector expanded considerably in 2008-09. Three new mines became operational, while older ones increased their output. Therefore, overall gold production is expected to double, from 5.6 tons in 2008 to 11 tons in 2009.
4. Inflationary pressures have eased, helping to stabilize the real effective exchange rate. The slowdown in international food prices, coupled with a tax suspension on some basic consumption items and measures to boost agricultural production, have helped to bring down domestic prices. The inflation rate moved from 8½ percent in 2008 to 5.3 percent in August 2009. As a result, the inflation gap between Burkina Faso and its trading partners narrowed, mitigating the earlier appreciation of the real effective exchange rate.
5. Burkina Faso suffered another major exogenous shock in 2009. Torrential rains fell on several towns, with loss of human life and destroying or damaging roads, dams, government buildings, hospitals and health centers, and displacing some 180,000 individuals. Preliminary estimates put the cost of this natural disaster at around CFAF 82 billion.
6. The overall net external position, which had weakened in 2008, recovered in 2009, in spite of adverse developments in international markets. The decline in the price of cotton, combined with the surge in food and oil prices, led to a major deterioration in the trade balance, which moved from a deficit of 8.8 percent of GDP in 2007 to a deficit of 11 percent in 2008. In 2009, this deficit is expected to narrow to 9.1 percent, thanks to higher gold production. The current and financial accounts also recorded a downturn reflecting an increase in the cost of services, and a reduction in direct investment. The current account
42
deficit (including transfers) increased from 8.3 percent of GDP in 2007 to approximately 12 percent of GDP in 2008, and is forecast to narrow to 9.1 percent of GDP in 2009. Accordingly, the overall balance moved from a surplus of 5.8 percent of GDP in 2007 to a deficit of 1 percent in 2008, and is expected to approach equilibrium in 2009. As a result, international reserves moved from 6.8 months of imports in 2007 to 5.4 months of imports in 2008, and would improve in 2009.
7. Fiscal consolidation efforts have continued, despite the difficult context. The measures implemented in 2008 and 2009 to strengthen revenue collection had mixed results, partly on account of the adverse effects of the global economic and financial crisis on certain tax categories. Accordingly, revenue stabilized at about 13.3 percent of GDP in 2008-09, compared with 13.6 percent of GDP in 2007. Expenditure declined to 21.7 percent of GDP in 2008, compared to 25.8 percent of GDP in 2007, primarily reflecting the low execution rate of externally-funded investment.
8. In 2009, expenditure is programmed to increase significantly, reaching 27.0 percent of GDP. This increase reflects government’s measures to mitigate the impact of the global financial crisis, in particular on the cotton sector, as well as the impact of the September 1, 2009 floods. In its supplementary 2009 budget, the government decided to increase expenditure in several categories in order to: (i) ease the adverse effects of the financial crisis on the domestic economy; (ii) support the cotton sector through: higher subsidies for agricultural inputs to mitigate the impact of higher import prices on producers’ income and protect production, assistance to cotton producer associations to enable them to clear their cross-arrears, and recapitalization of the main ginning company, SOFITEX in an amount of CFAF 18.5 billion; (iii) stimulate economic activity through a more rapid reduction in audited domestic arrears; (iv) provide emergency assistance to those affected by the floods; and (v) finance the rebuilding of roads, government buildings, and health facilities destroyed or seriously damaged by the floods.
9. The overall budget deficit (payment order basis, excluding grants) is expected to reach 14.4 percent of GDP in 2009, compared with 8 percent of GDP in 2008. These estimates form the basis of the supplementary budget for 2009, which the government submitted to Parliament at end-September.
10. A new bond issue by the Public Treasury, and the use of the new SDR allocation provided additional financing. In 2009, two bond issues raised CFAF 80.7 billion, with maturities of 5-7 years, and an interest rate of 6.5 percent. Furthermore, reflecting a decision of the WAEMU Council of Ministers, the Central Bank of West African States (BCEAO) lent CFAF 38.8 billion to Burkina Faso, corresponding to the new SDR allocation granted by the IMF. In accordance with regional arrangements, these resources will help expedite repayment of the audited stock of domestic payments arrears, amounting to CFAF 22.9 billion.
43
11. In 2009, trends in the monetary sector were characterized by an increase in money supply in line with the increase in net foreign assets. Credit to the economy decelerated mainly because of lower economic activity. With stronger reliance upon the regional financial market, net credit to the government remained virtually unchanged in 2009. Although the financial position of banks remains sound overall, the slowdown in economic activity and the difficulties experienced by some economic operators have resulted in an increase in non-performing loans.
II. PROGRAM IMPLEMENTATION
12. The quantitative performance criteria for end-June, as well as the structural benchmarks for end-September were observed. In the fiscal area, the budget deficit ceiling (commitments basis and including grants) was respected, thanks to rigorous expenditure management, which helped offset revenue losses and a shortfall in program grants. Indeed, the floor for revenues could not be adhered to, because of the repercussions of the economic and financial crisis on the tax base, as well as the impact of a number of tax measures in 2008-09, in particular the decrease in the rate of the industrial and commercial profits tax (BIC), the elimination of withholding taxes and levies at source on large enterprises, and the authorization granted to banks and financial institutions to deduct provisions from the taxable base. The other quantitative targets were met, except for poverty-reducing expenditure, which was slightly lower than the target. Moreover, the structural benchmarks regarding the tax reform, tracking poverty-reducing expenditures, and cotton sector reform were observed (Tables 1 and 2), though the latter with a small delay.
13. Significant progress has been made with the implementation of other fiscal reforms. With respect to tax administration, the management of taxpayer files has improved, and the rollout of the computerized tax management system (SINTAX) at the tax divisions of the Regional Directorate of the Center was achieved. At the Large Taxpayer Office (LTO), the measures taken regarding (i) the issuance of the list of late filers and nonfilers in the case of the VAT, the BIC, and IUTS, and (ii) the sending of reminder letters for these various taxes, meant that the weighted average overall nonfiler rate at end-June 2009 stood at 4.75 percent (4 percent for the VAT and the IUTS, 5 percent and 6 percent respectively for the BIC PM and the BIC PP), against a target of 7 percent. With the aim of revamping the database of the LTO and the Medium Taxpayer Office (MTO), the government adopted legislation to deactivate non-active taxpayers.
14. Several measures to strengthen customs administration will enhance its efficiency. The connection of seven major border customs offices to the single server at the General Directorate of Customs is in place, as is the interconnection with the import supervision company. This will facilitate the cross-checking of data and thus enhance controls. The objective of assigning at least 40 percent of all customs declarations to the green and blue channels through the use of the ASYCUDA selectivity module was overachieved, with actual performance being 42.5 percent. Moreover, efforts to improve
44
customs controls are continuing through the introduction of joint customs/tax inspections, and through enhanced controls of final destinations of duty-free merchandise.
15. Enhancing fiscal transparency remains a major policy objective of the government. Accordingly, the government has engaged in outreach efforts on the 2009 budget, encompassing the media, civil society, and the country’s 13 regions. Similarly, the High Authority for State Oversight (Autorité Supérieure de Contrôle de l’Etat—ASCE) published its first report in May 2009, and conducted a wide-ranging campaign of education and outreach on corruption. After the adoption of the new procurement regulations in 2008, steps aimed at strengthening their implementation were undertaken in 2009, including their dissemination and the provision of training for various stakeholders. In addition, the regulatory framework was supplemented by the provision of the General Administrative Clauses (Cahiers des Clauses Administratives Générales—CCAG) and sets of standardized files pursuant to decrees and circulars issued in July 2009.
16. The second midterm budget review was carried out in May 2009. This exercise focused on the execution of the 2009 budget. It identified adjustment measures in response to (i) the international economic crisis, (ii) the revenue collection outturn, (iii) expenditure execution, and (iv) new financing needs. As a result, appropriations were re-affected to priority spending.
17. The government has continued its efforts to promote the private sector. To facilitate transfer of ownership, the government set up one-stop shops for land transactions (Guichets Uniques du Foncier—GUF) in Ouagadougou and Bobo-Dioulasso. These were launched in May and September 2009, respectively. To make the GUF operational, manuals were prepared and training exercises for revenue collectors and external stakeholders organized. The implementation of the Real Estate File Information System (système d’information du dossier du foncier—SIDOFO) is expected to help expedite the processing of applications submitted to the GUF.
18. The government’s economic and financial policies seek to promote growth and alleviate poverty. They are aligned with the strategic priorities as laid out in the Poverty Reduction and Strategy Paper (PRSP), namely: (i) to accelerate equitable growth; (ii) to increase the poor’s access to basic social services and social protection; (iii) to strengthen income generation activities; and (iv) to promote good governance. Moreover, the government’s program with the IMF included measures to increase poverty-reducing expenditure, and significantly improve the monitoring of such expenditure. The government also took measures to cushion the impact of the food and oil price shocks on the poor, such as subsidies to stimulate food production and establishing a cash transfer system for the urban poor. As a result of the program, growth–promoting structural reforms were implemented and macroeconomic stability was maintained, allowing for the creation of fiscal space for poverty-reducing expenditure, which increased from an average of 22 percent of
45
total expenditure and 5 percent of GDP between 2001 and 2006, to an average of 24 percent of total expenditure and 5.9 percent of GDP between 2007 and 2009.
III. ECONOMIC AND FINANCIAL POLICIES FOR 2010 AND MEDIUM-TERM OUTLOOK
A. Macroeconomic Framework
19. The government will pursue its efforts to support economic growth and to ease the impact of the 2008-09 crises and the floods. In an economic environment that will remain challenging in the aftermath of the successive crises that occurred in 2008-09, the government will continue its efforts to achieve fiscal consolidation, strengthen its social policies, and press ahead with the reforms necessary to enhance growth prospects while reducing poverty. Against this background, economic growth is projected at 4.2 percent in 2010, with inflation kept within limits compatible with WAEMU convergence criteria.
20. The government is mindful of several obstacles that could slow down medium-term growth. The government intends to enhance the effectiveness of its development policies through the new Strategy for Faster Growth and Sustainable Development (Stratégie de Croissance Accélérée et de Développement Durable—SCADD) under preparation. In this context, the government is determined to promote the diversification of the productive base to reduce dependency on cotton and vulnerability to exogenous shocks. Meanwhile, the government intends to improve the business climate further and to increase investment in infrastructure to support productivity gains in the private sector. Cotton sector reforms and the implementation of the financial sector strategy scheduled for 2010 are also expected to enhance growth prospects. In addition, the strong expansion anticipated in the mining sector would help speed up economic growth.
B. Fiscal Policy
21. Fiscal policy will primarily support economic recovery, while safeguarding medium-term fiscal and debt sustainability. Accordingly, reform measures to strengthen revenue and expenditure management will be continued and intensified. The fiscal stance will provide budgetary room for reconstructing infrastructure and delivering social assistance to those affected by the recent flooding, as well as to other vulnerable groups. However, the government will also take measures to avoid any slippages that could undermine continued fiscal consolidation. Consequently, budget revenue and expenditure are forecast to attain 13.6 percent of GDP and 25.3 percent of GDP respectively in 2010. Thus, the budget deficit (commitments basis and excluding grants) will reach 11.7 percent of GDP.
22. Revenue is expected to increase slightly in 2010, amounting to CFAF 556 billion, equivalent to 13.6 percent of GDP. They will benefit from the anticipated recovery of economic activity and mining receipts boosted by the higher gold production, and from administrative and tax reform measures introduced in 2009, particularly the agency-by-agency contracts with quantitative targets that has produced encouraging results since it was
46
introduced in early 2009. Revenue performance should further be enhanced by the tax reform strategy submitted to the National Assembly in October 2009, which encompasses the following main areas: improvement in the management and yield of indirect taxation, in particular the VAT; the creation of a corporate tax through the merger of the various schedules of taxes on the income of legal entities; and the streamlining of tax incentives granted under the various investment promotion codes. With respect to VAT reform, the proposals focus inter alia on eliminating the 20 percent withholding tax by way of advance payment (acompte), reviewing the refund mechanism through enhancing the transparency of procedures and expediting the pertinent operations, broadening the scope of the VAT to encompass goods previously exempt and extending the exclusion of the deduction entitlement to encompass particular goods, abolishing the principle of outright exemptions previously granted to NGOs, and raising from CFAF 50 to 100 million the thresholds for the simplified tax regimes (régimes simplifiés d’imposition (RSI)) for purchases/resales and from CFAF 25 to 50 million for other activities. However, those enterprises covered by the RSI system—whose yield is in the range of 4 to 5 billion per year (a comparatively substantial sum)—and which according to the analysis do not transfer deduction entitlements to enterprises covered by the standard taxation regime (réel normal d’imposition (RNI)), shall continue to be subject to the VAT. It is expected that these reform measures, coupled with more rapid economic growth, will help to bring revenue to a level of 15.7 percent of GDP by 2014.
23. The draft 2010 budget makes provisions for new tax measures, and was submitted to the National Assembly. These include a specific tax of 2 percent on access to or use of telecommunications networks. There are also plans to introduce tollbooths on paved roads to facilitate the collection of fees from users. Furthermore, in regard to improving the business climate, the draft budget for FY 2010 has made provision for lowering the registration duty on commercial leases from 10 to 5 percent; for reforming the rules governing mortgages by making the deletion process (radiation) non-mandatory; and for paying a fixed duty in lieu of the proportional duty in the case of deletion and mortgage renewal.
24. The pricing mechanism for petroleum products will be reviewed in 2010. The authorities have entrusted its management to an ad-hoc committee, independent of the national petroleum company (SONABHY). This committee will propose a reform agenda, with the aim of enhancing the transparency of the current system, and for taking account of the pricing formulae in neighboring countries. The automatic pass-through mechanism for pump prices of petroleum products was suspended in 2008, in response to the upsurge in international oil prices, which adversely affected SONABHY’s cash flow and tax collection on petroleum products. However, since pump prices have not been revised in the same magnitude as the recent decline in international oil prices, SONABHY should be in a position to recoup the losses before end-December 2009.
47
25. Total expenditure and net lending will total CFAF 1,036 billion, equivalent to 25.3 percent of GDP in 2010. Efforts to control expenditure will remain a major objective of the government. In particular, its wage policy will remain cautious in the context of the implementation of the merit-based system. The wage bill for 2010 will reflect the impact of the 4 percent pay increase and the catching up on payments for promotions granted in 2006 that were granted in 2009, recruitments in priority sectors, and the return to the merit-based system for promotions. In addition, the authorities have laid the ground for the implementation of the General Reform of the Civil Service (Réforme Globale de l’Administration Publique—RGAP). They also intend to prepare a plan to modernize the civil service and improve the payroll management system to ensure proper control over the wage bill, which currently amounts to over 40 percent of budget revenue. Efforts to support the population affected by the 2009 floods will continue, in the context of an overall increase in priority expenditures. Current expenditure and domestically financed capital expenditure will remain high, compared with pre-crisis levels, totaling 18.7 percent of GDP, down from 20.2 percent of GDP in 2009. This level also reflects expenditure in the education sector related to the Fast-Track Initiative, as well as investment in the water and sanitation sector, which will be financed through sectoral budgetary support from the government’s technical and financial partners. Overall, capital expenditure would reach 12.4 percent of GDP in 2010, compared to a projection of 13.7 percent of GDP for 2009, and approximately 8.9 percent of GDP in 2008.
26. In 2010, the overall budget deficit (commitments basis, excluding grants) is projected at 11.7 percent of GDP. It will be financed by budgetary assistance from Burkina Faso’s development partners, working together within the General Framework of Budgetary Support for Implementation of the Poverty Reduction Strategy Paper in Burkina Faso (CGAB/CSLP), and disbursements anticipated in the context of the IMF-supported program. The government also plans to carry out a bond issue on the regional financial market.
27. Efforts to strengthen expenditure management and the tracking of poverty-reducing expenditure will continue. Accordingly, the government will seek to reduce the lag between payment verification and actual payment from the current 72 days to 62 days—the goal as defined in the PFM framework for 2010. In this context, measures to streamline the review and verification of supporting documents will allow for less red tape and speed up overall expenditure execution. Since emergency outlays related to the 2009 floods will be phased out, expenditure in 2010 will follow the normal expenditure commitment and payment procedures, with emergency or treasury prepaid expenditure being regularized in full at the end of the 2009 budget cycle. The tracking of poverty-reducing spending will be fine-tuned in 2010 thanks to the new tracking system introduced in September 2009, and a quarterly report will be prepared. The first such report, covering poverty-reducing expenditure execution through end-December 2009, will be produced by end-March 2010 (structural benchmark).
48
C. Balance of Payments and External Debt
28. The external current account deficit (excluding official transfers) is expected to reach 14.9 percent in 2010, compared to 13.8 percent projected for 2009. This deterioration reflects mostly (i) moderate increase in exports because cotton prices are expected to remain stable; (ii) an increase in imports because of the expected increase in oil prices, the anticipated economic recovery, and increased investment, particularly in infrastructure. With the forecast level of project loans and grants, and the expected improvement in the financial account, the overall balance of payments should move into a surplus in 2011, allowing Burkina Faso to contribute to the regional reserve pool. In the medium term, the outlook for cotton prices is expected to improve, and exports of gold and other minerals should increase further. The external current account deficit (excluding official transfers) is expected to narrow to 10.3 percent of GDP by 2014.
29. The government is committed to continue with its prudent borrowing policy, to safeguard external debt sustainability. Furthermore, the government intends to remain selective regarding its investment projects, focusing on their impact on economic growth and on needed improvement to the quality of basic services, particularly for the most vulnerable segments of the population. Accordingly, the government has ultimately decided not to contract a loan, which had been under discussion with the Islamic Development Bank to finance the Samendeni dam project. Rather, the government intends to finance a part of this strategically important project by tapping into its own resources, while trying to identify additional concessional loans.
D. Structural Policies
Management of government expenditure
30. The pace of public finance reform will accelerate in 2010. A key focus of this reform will be to pave the way for program budgeting. Crucial measures in this regard include: (i) strengthening the medium-term budget framework and the sectoral medium-term expenditure frameworks; (ii) improving the expenditure execution process, particularly by ensuring capacity-building for the entities responsible for monitoring and auditing the budget; (iii) strengthening the capacity to mobilize resources and manage liquidity; and (iv) enhancing the transparency and reliability of budgetary and financial data. In order to overcome any delays in implementing these budgetary reforms, the authorities intend to give priority to the above-described measures during 2010. They will attach particular importance to preparing the medium-term expenditure frameworks at the six ministries initially considered, in line with the timetable agreed upon with the IMF technical assistance mission.
Reform of the cotton sector
31. Ensuring the viability of the cotton sector will remain a major policy goal for the authorities. In 2010, the reform agenda covers the restructuring of the cotton parastatal
49
SOFITEX, the reorganization of producer associations to prevent the resurgence of cross-arrears which creates cash flow problems between these associations, and measures to ensure the financing of inputs for producers, in particular through the setting up an input Fund, and a mechanism designed to provide adequate financing for the Price-Smoothing Fund (fonds de lissage).
32. The restructuring of SOFITEX will be based on the action plan adopted by the SOFITEX board of directors on October 16, 2009. This plan includes the following measures: (i) disseminating information on genetically modified cotton seeds throughout the SOFITEX zone; (ii) strengthening supervisory structures; (iii) reviewing the staffing plan and updating the procedures manual; (iv) optimizing the information system; and (v) lowering operating costs. The status of implementation of these key measures will be reviewed in a report at the end of the first quarter of 2010 (structural benchmark). In 2009, SOFITEX had already undertaken a number of adjustment measures, the most important of which focused on reducing costs, in particular, the wage bill.
Reform of the financial sector
33. Financial sector reform is designed to deepen the sector and improve access to financial services. Based on FSAP recommendations, a financial sector development strategy has been prepared, which is designed to promote the following objectives: (i) enhance the stability and depth of the financial sector; (ii) boost competition among financial institutions; (iii) promote the insurance sector; (iv) improve access to financing in rural areas and for Small-and-Medium-Sized Enterprises; (v) promote housing finance to facilitate access to real estate ownership; and (vi) enhance the legal and judicial framework. In the context of this strategy, the government—working in cooperation with its partners in the sub region and with assistance from the Bretton Woods Institutions—has prepared a comprehensive action plan. This plan will be implemented in 2010 following its adoption by the Council of Ministers by January 2010 (benchmark). It will take into account the impact of the financial crisis and will cover in detail the following areas: banking and insurance sectors, microfinance, retirement systems, postal finance, cash flow management, the legal environment, and access to financial services.
E. Program Monitoring
34. The program will continue to be monitored based on quantitative performance criteria and benchmarks, and structural benchmarks which have been agreed between the government and the IMF (Tables 1 and 2). The authorities will report to the IMF data needed to monitor the program in accordance with the definitions in the attached Technical Memorandum of Understanding. Furthermore, during the program period, the government will not introduce restrictions on payments and transfers on current international transactions, or tighten any such restrictions without first consulting the IMF; introduce or modify multiple currency practices; conclude bilateral payment agreements not compatible with
50
Article VIII of the IMF Articles of Agreement; or introduce restrictions on imports for balance of payments purposes.
35. The sixth review is expected to be completed by April 15, 2010. For this review, the quantitative financial objectives for end-December 2009 are performance criteria.
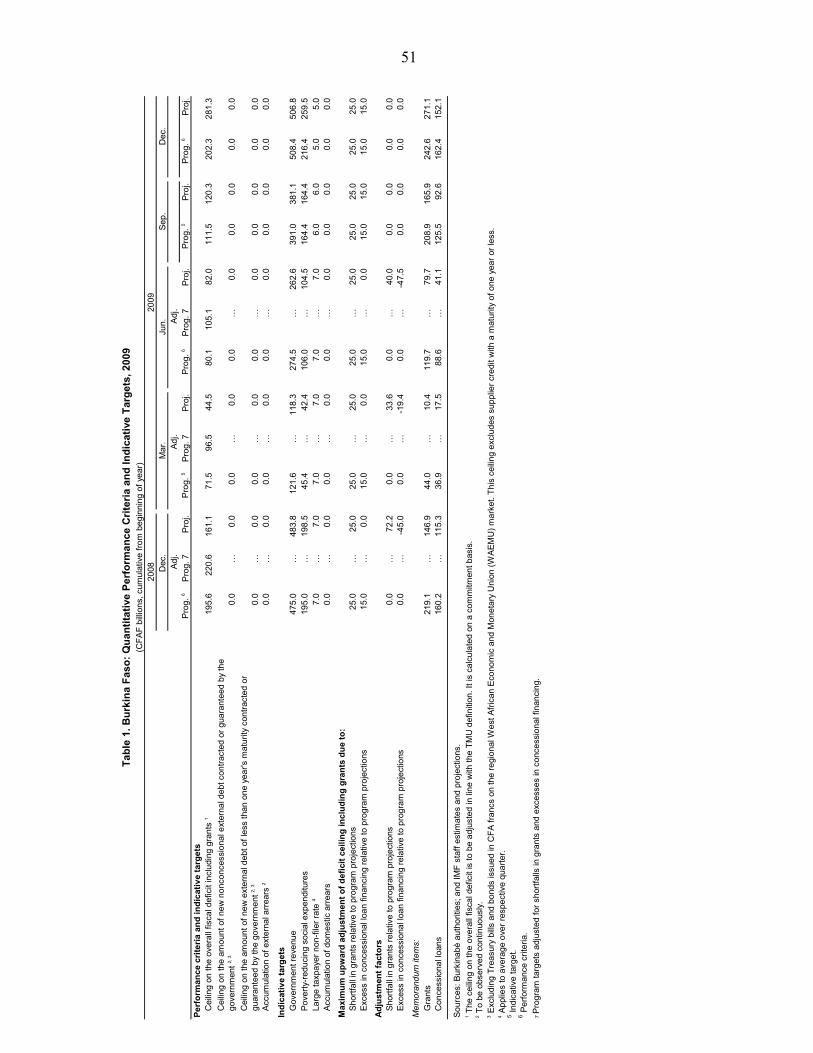
51
Dec
.A
dj.
Ad
j.A
dj.
Pro
g. 6
Pro
g. 7
Pro
j.P
rog.
5P
rog
. 7P
roj.
Pro
g. 6
Pro
g. 7
Pro
j.P
rog.
5P
roj.
Pro
g. 6
Pro
j.P
erf
orm
anc
e c
rite
ria
an
d in
dic
ativ
e ta
rge
tsC
eilin
g o
n th
e o
vera
ll fis
cal d
efic
it in
clu
ding
gra
nts
119
5.6
220
.616
1.1
71.5
96.
544
.58
0.1
105
.18
2.0
111.
512
0.3
202.
32
81.3
Cei
ling
on
the
am
oun
t of
ne
w n
onc
once
ssio
nal e
xter
nal d
ebt c
ontr
acte
d o
r gu
ara
ntee
d b
y th
e go
vern
men
t 2,
30.
0…
0.0
0.0
…0
.00.
0…
0.0
0.0
0.0
0.0
0.0
Cei
ling
on
the
am
oun
t of
ne
w e
xte
rnal
deb
t of
less
tha
n o
ne
yea
r's m
atu
rity
con
trac
ted
or
gua
rant
eed
by
the
gov
ernm
ent
2,
30.
0…
0.0
0.0
…0
.00.
0…
0.0
0.0
0.0
0.0
0.0
Acc
umu
latio
n o
f ex
tern
al a
rrea
rs 2
0.0
…0.
00.
0…
0.0
0.0
…0.
00.
00
.00.
00
.0
Ind
icat
ive
targ
ets
G
over
nme
nt r
eve
nue
475.
0…
483.
81
21.6
…1
18.3
274.
5…
262.
639
1.0
381
.150
8.4
506
.8P
ove
rty-
red
ucin
g so
cia
l exp
endi
ture
s19
5.0
…19
8.5
45.4
…42
.410
6.0
…10
4.5
164.
416
4.4
216.
42
59.5
Larg
e ta
xpay
er n
on-f
iler
rate
47.
0…
7.0
7.0
…7
.07.
0…
7.0
6.0
6.0
5.0
5.0
Acc
umu
latio
n o
f do
mes
tic a
rrea
rs0.
0…
0.0
0.0
…0
.00.
0…
0.0
0.0
0.0
0.0
0.0
Max
imu
m u
pw
ard
ad
just
me
nt
of
de
fici
t c
eili
ng
inc
lud
ing
gra
nts
du
e t
o:
Sh
ortf
all
in g
rant
s re
lativ
e to
pro
gra
m p
roje
ctio
ns2
5.0
…2
5.0
25.0
…25
.02
5.0
…2
5.0
25.
025
.02
5.0
25.0
Exc
ess
in c
onc
essi
ona
l loa
n fin
anc
ing
rela
tive
to p
rog
ram
pro
ject
ions
15.
0…
0.0
15.0
…0
.01
5.0
…0.
01
5.0
15.0
15.
015
.0
Ad
just
men
t fa
cto
rsS
hor
tfa
ll in
gra
nts
rela
tive
to p
rog
ram
pro
ject
ions
0.0
…7
2.2
0.0
…33
.60.
0…
40.
00.
00
.00.
00
.0E
xces
s in
co
nces
sio
nal l
oan
fina
ncin
g re
lativ
e to
pro
gra
m p
roje
ctio
ns0.
0…
-45.
00.
0…
-19
.40.
0…
-47.
50.
00
.00.
00
.0
Me
mo
rand
um it
ems:
Gra
nts
219.
1…
146.
944
.0…
10.4
119.
7…
79.
720
8.9
165
.924
2.6
271
.1C
once
ssio
nal l
oan
s16
0.2
…11
5.3
36.9
…17
.58
8.6
…4
1.1
125.
592
.616
2.4
152
.1
So
urce
s: B
urk
ina
bè a
uth
orit
ies;
and
IMF
sta
ff e
stim
ate
s an
d p
roje
ctio
ns.
Jun.
Se
p.D
ec.
5 In
dic
ativ
e ta
rge
t.
2 T
o be
obs
erv
ed
con
tinuo
usly
.3 E
xclu
ding
Tre
asu
ry b
ills
and
bo
nds
issu
ed in
CF
A f
ranc
s o
n th
e re
gion
al W
est
Afr
ican
Eco
nom
ic a
nd
Mon
eta
ry U
nion
(W
AE
MU
) m
ark
et. T
his
ceili
ng
exc
lud
es s
uppl
ier
cre
dit w
ith a
mat
urity
of o
ne y
ear
or le
ss.
1 T
he c
eilin
g o
n th
e o
vera
ll fis
cal d
efic
it is
to b
e a
djus
ted
in li
ne
with
the
TM
U d
efin
itio
n. I
t is
calc
ula
ted
on
a c
om
mitm
ent b
asis
.
7 P
rogr
am
targ
ets
adj
uste
d f
or
shor
tfal
ls in
gra
nts
an
d e
xce
sse
s in
con
cess
ion
al f
inan
cin
g.
4 A
ppl
ies
to a
vera
ge
ove
r re
spe
ctiv
e qu
art
er.
6 P
erf
orm
anc
e cr
iteri
a.
Ta
ble
1.
Bu
rkin
a F
aso
: Q
ua
nti
tati
ve P
erf
orm
an
ce
Cri
teri
a a
nd
In
dic
ativ
e T
arg
ets
, 2
00
9(C
FA
F b
illio
ns,
cum
ulat
ive
fro
m b
egi
nnin
g o
f ye
ar)
2008
Ma
r.20
09
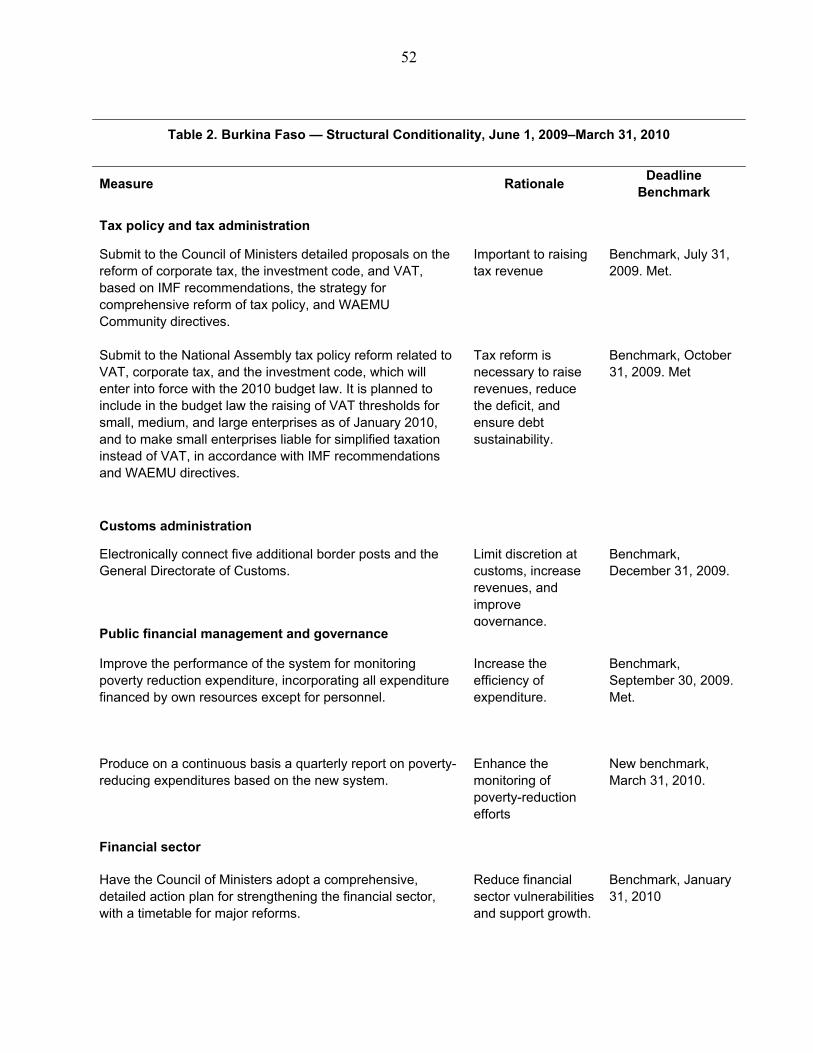
52
Table 2. Burkina Faso — Structural Conditionality, June 1, 2009–March 31, 2010
Measure Rationale Deadline
Benchmark
Tax policy and tax administration
Submit to the Council of Ministers detailed proposals on the reform of corporate tax, the investment code, and VAT, based on IMF recommendations, the strategy for comprehensive reform of tax policy, and WAEMU Community directives.
Important to raising tax revenue
Benchmark, July 31, 2009. Met.
Submit to the National Assembly tax policy reform related to VAT, corporate tax, and the investment code, which will enter into force with the 2010 budget law. It is planned to include in the budget law the raising of VAT thresholds for small, medium, and large enterprises as of January 2010, and to make small enterprises liable for simplified taxation instead of VAT, in accordance with IMF recommendations and WAEMU directives.
Tax reform is necessary to raise revenues, reduce the deficit, and ensure debt sustainability.
Benchmark, October 31, 2009. Met
Customs administration
Electronically connect five additional border posts and the General Directorate of Customs.
Limit discretion at customs, increase revenues, and improve governance.
Benchmark, December 31, 2009.
Public financial management and governance
Improve the performance of the system for monitoring poverty reduction expenditure, incorporating all expenditure financed by own resources except for personnel.
Increase the efficiency of expenditure.
Benchmark, September 30, 2009. Met.
Produce on a continuous basis a quarterly report on poverty-reducing expenditures based on the new system.
Enhance the monitoring of poverty-reduction efforts
New benchmark, March 31, 2010.
Financial sector
Have the Council of Ministers adopt a comprehensive, detailed action plan for strengthening the financial sector, with a timetable for major reforms.
Reduce financial sector vulnerabilities and support growth.
Benchmark, January 31, 2010
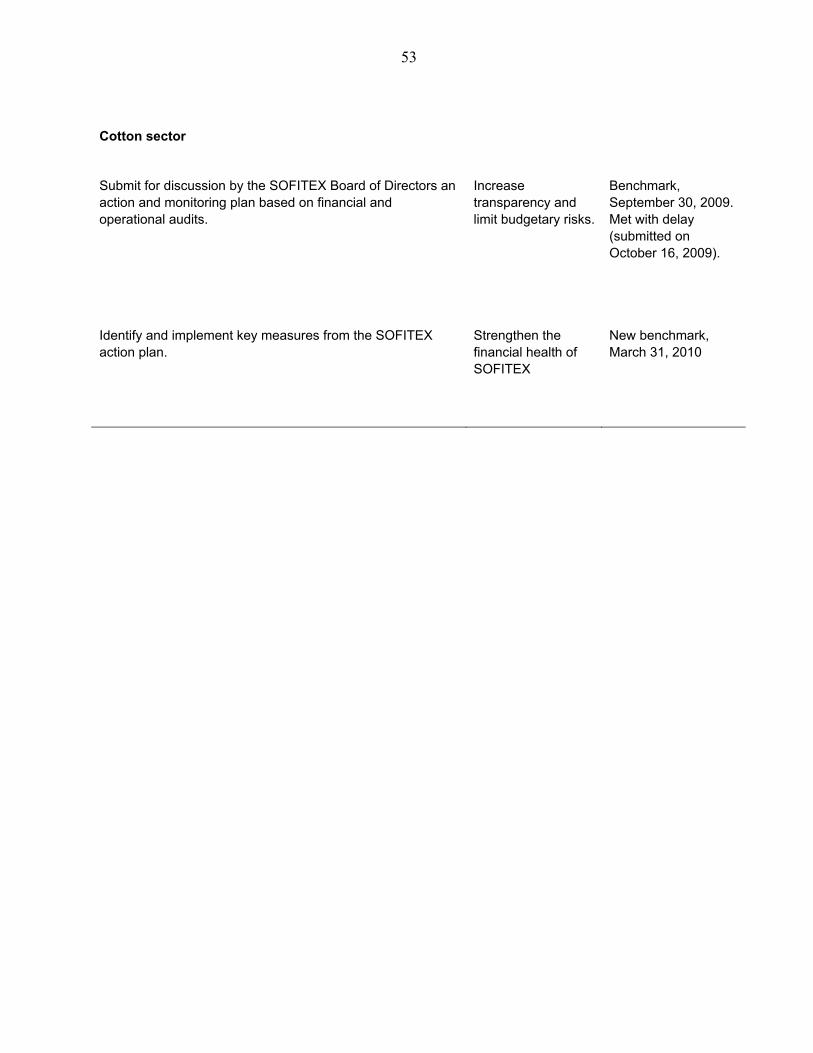
53
Cotton sector
Submit for discussion by the SOFITEX Board of Directors an action and monitoring plan based on financial and operational audits.
Increase transparency and limit budgetary risks.
Benchmark, September 30, 2009. Met with delay (submitted on October 16, 2009).
Identify and implement key measures from the SOFITEX action plan.
Strengthen the financial health of SOFITEX
New benchmark, March 31, 2010
54
APPENDIX I―ATTACHMENT II
TECHNICAL MEMORANDUM OF UNDERSTANDING
Ouagadougou, November 10, 2009
1. This memorandum defines the quantitative performance criteria and indicative targets for the program supported by the Poverty Reduction and Growth Facility (PRGF) of the International Monetary Fund (IMF). It also sets deadlines for reporting data to Fund staff to facilitate program monitoring.
I. DEFINITIONS
2. For the purposes of this memorandum, the following definitions of “debt,” “government,” “payments arrears,” and “government obligations” will be used:
● Debt, as specified in point 9 of the Guidelines on Performance Criteria with Respect to Foreign Debt adopted by the Executive Board of the IMF on August 24, 2000, will be understood to mean a current, not contingent, liability, created by contract through provision of value in the form of assets (including currency) or services, that requires the obligor to make one or more payments in the form of assets (including currency) or services, at one or more future points in time; these payments being made to discharge principal and interest liabilities incurred under the contract. Debts can take a number of forms, the primary ones being:
(i) loans, consisting of advances of money to the obligor (e.g., deposits, bonds, obligations, commercial loans, and buyers’ credits), who undertakes to repay the funds in the future, and temporary exchanges of assets that are equivalent to fully collateralized loans where the obligor is required to repay the funds, and usually pay interest, by repurchasing the collateral from the buyer in the future (e.g., repurchase agreements and official swap arrangements);
(ii) suppliers’ credits, which are contracts where the supplier lets the obligor defer payments until after the date on which the goods have been delivered or the services provided;
(iii) leases, which are arrangements in which property is provided for the use of the lessee for a specified period, usually shorter than the total expected life of the property, while the lessor retains title to the property. For purposes of this guideline, the debt is the present value at the inception of the lease of all lease payments expected to be made during the period of the agreement, except payments that cover the operation, repair, or maintenance of the property; and
55
(iv) Treasury bills and bonds issued in CFA francs on the WAEMU (West African Economic and Monetary Union) regional market are included in domestic debt for purposes of this memorandum.
● Government is defined as the central government of Burkina Faso and does not include any political subdivision, government-owned entity with a separate legal personality, or the central bank.
● External payments arrears are external payments due but unpaid. Domestic arrears are domestic payments due but unpaid after a 90-day grace period, unless the obligation specifies a different grace period.
● Government obligation is any financial obligation of the government accepted as such by the government (including any government debt).
II. QUANTITATIVE PERFORMANCE CRITERIA
3. The numerical values for quantitative performance criteria, indicative targets, and adjusters are set out in Table 3 of the attached Memorandum of Economic and Financial Policies (MEFP).
A. Overall Deficit Including Grants
Definition
4. For the program, the overall deficit including grants is valued on a commitment basis (base engagement). It is defined as the sum of foreign and domestic financing (net) of the government measured from the financing side plus cash basis adjustment. Net foreign financing is the sum of foreign borrowing and debt relief minus amortization. Net domestic financing is the sum of (i) net bank credit to the government, including both net bank credit to the treasury as defined below and other government claims on and debts to national banking institutions; (ii) unredeemed government bills and bonds held outside national commercial banks; and (iii) privatization receipts. Net bank credit to the treasury is the balance of the treasury’s claims and debts vis-à-vis national banking institutions. Treasury claims include the cash holdings of the Burkinabè Treasury, deposits with the central bank, deposits with commercial banks, secured obligations, and government deposits with the postal system (CCP). Treasury debt to the banking system includes funding from the central bank (including statutory advances, consolidated advances, IMF financing, and refinancing of secured obligations), government securities held by the central bank, funding from commercial banks (including government securities held by commercial banks), and CNE (Caisse Nationale d’Épargne Postale)/CCP securitized deposits. Net bank credit to the government is calculated by the Central Bank of West African States (BCEAO), whose figures are recognized as valid for program purposes. The stock of treasury bills and other government debt, as well as net foreign financing, is calculated by the Ministry of Finance.
56
Cash basis adjustment is the sum of (i) expenditure commitments not paid (engagées non-payées); and (ii) change in treasury deposits.
5. All these items are valued according to the statement of government budgetary execution established monthly in the central government’s financial operations table. This is prepared by the Permanent Secretariat for the Monitoring of Financial Policies and Programs (SP-PPF), in collaboration with the other directorates of the Ministry of Economy and Finance.
Adjustment
6. The overall deficit including grants is adjusted upward by the amount that grants fall short of what is programmed up to a maximum (see the MEFP, Table 3). It will not be adjusted if grants are higher than programmed.
7. The overall deficit including grants will also be adjusted upward by the amount that concessional loans exceed what is programmed up to a maximum (see the MEFP, Table 3).
Reporting deadlines
8. The ministry in charge of finance will forward data to the IMF on the overall deficit excluding grants within six weeks after the end of each quarter.
B. Nonaccumulation of External Arrears
Performance criterion
9. The government’s external debt is the stock of debt owed or guaranteed by the government. External arrears are external payments due but not paid on the due date. Under the program, the government undertakes not to accumulate arrears on its external debt, except those arising from government debt that is being renegotiated with creditors, including non-Paris Club bilateral creditors. Nonaccumulation of external arrears is a performance criterion, to be observed continuously.
Reporting deadlines
10. Data on outstanding balances, accumulation, and repayment of external arrears will be forwarded within six weeks after the end of each month.
C. Nonconcessional External Debt Contracted or Guaranteed by the Government
Performance criterion
11. The government undertakes not to contract or guarantee any external debt maturing in
57
one year or more that has a grant element of less than 35 percent (calculated using the interest reference rate for borrowed foreign currencies provided by the IMF) beyond the ceiling indicated in the MEFP (Table 3). This performance criterion applies not only to debt as defined in point 9 of the Guidelines (see ¶2), but also to all commitments contracted or guaranteed for which value has not been received. However, it does not apply to treasury bills and bonds issued in CFA francs on the WAEMU regional market. This performance criterion is to be observed continuously.
Reporting deadlines
12. Details on any loan (terms and creditors) to the government or guaranteed by the government must be reported within four weeks of the end of each month. The same requirement applies to guarantees granted by the government.
D. Government Short-Term External Debt
13. The government undertakes not to accumulate or guarantee any new external debt with a contractual maturity of less than one year. This performance criterion applies not only to debt as defined in point 9 of the Guidelines (see ¶2), but also to commitments contracted or guaranteed for which value has not been received. Excluded from this performance criterion are import- and export-related loans and treasury bills and bonds issued in CFA francs on the WAEMU regional market and normal short-term suppliers’ credits. This performance criterion is to be observed continuously. As of April 1, 2007, the government of Burkina Faso had no short-term external debt.
III. OTHER QUANTITATIVE INDICATIVE TARGETS
14. The program also includes indicative targets on total government revenue, poverty-reducing social expenditures, nonaccumulation of domestic arrears, and large taxpayer non-filer rates.
A. Total Government Revenue
Definition
15. Total government revenue is valued on a cash basis. It includes all tax and nontax revenue collected by the Directorate General of Taxation, the Directorate General of Customs, the Burkinabè Treasury, and revenue collection units at ministries and institutions, and it also includes revenue from treasury checks.
Reporting deadlines
16. Details on total revenue will be sent to IMF staff by the SP-PPF of the Ministry of Finance and Budget within six weeks after the end of each month.
58
B. Poverty-Reducing Social Expenditures
Definition
17. Poverty-reducing social expenditures are defined by the PRSP priority sector programs designed to accelerate the reduction of poverty. They cover all spending categories for the following ministries: Primary Education and Literacy; Health; Social Action and National Solidarity; Promotion of Women; Labor and Social Security; Employment and Youth; Agriculture, Water and Fishing Resources; Animal Resources; and Environment and Living Conditions. They also cover rural roads and HIPC resources (Category 5) for infrastructure spending and HIPC expenditures only for the Justice Ministry and the Ministry of Economy and Development. These expenditures are monitored directly through the budget.
Reporting deadlines
18. The government will report within six weeks after the end of each month the monthly data on poverty-reducing social expenditures.
C. Nonaccumulation of Domestic Arrears
Definition
19. The government will not accumulate any arrears on domestic government obligations during the program period. This is a benchmark to be observed continuously.
Reporting deadlines
20. Data on balances, accumulation, and repayment of arrears on domestic government obligations will be reported within four weeks after the end of each month.
D. Large Taxpayer Nonfiler Rate
Definition
21. The large taxpayer nonfiler rate is defined as the ratio of late and nonfilers in the Large Taxpayer Office (LTO) relative to the total number of taxpayers obligated to file in LTO. A late filer is anyone who files a tax return after the deadline. A nonfiler is anyone in the database who did not file taxes. The main tax categories are the VAT (TVA), the corporate income tax (BIC), and the tax on wage income (IUTS). Filing deadlines for the main tax categories are set in the tax code.
Reporting deadlines
22. The government will report within two weeks after the end of each quarter the total
59
number of late and nonfilers as well as the total number of taxpayers obligated to file in LTO for the main tax categories.
IV. STRUCTURAL BENCHMARKS
23. The program incorporates structural benchmarks (see the MEFP, Table 2).
V. ADDITIONAL PROGRAM MONITORING INFORMATION
A. Public Finance
24. The government will report the following to Fund staff:
The monthly government flow-of-funds table (TOFE) and the customary appendix tables, to be forwarded within six weeks after the end of each month; if data on actual investment financed by external grants and loans are not available in time, a linear implementation estimate based on the annual projections will be used.
Complete monthly data on domestic budgetary financing (net bank credit to the government and stock of unredeemed treasury bonds and bills), to be provided within six weeks after the end of each month.
Quarterly data on implementation of the public investment program, including details on financing sources, to be sent within six weeks after the end of each quarter.
Quarterly data on external debt stock, external debt service, signing of external loans, and disbursements of external loans, to be sent within six weeks after the end of each quarter.
Monthly data in the table on the monitoring of poverty-reducing expenditures that will be submitted with the same transmission delay as for the above-defined TOFE table.
Monthly data on prices and the taxation of petroleum products, including
(i) prices prevailing during the month; (ii) detailed calculation of the price structure, from the f.o.b.-MED price to the retail price; (iii) volumes purchased and made available for consumption by the petroleum distributor (SONABHY); and (iv) a breakdown of receipts from the taxation of petroleum products— customs duties, tax on petroleum products (TPP), and value-added tax (VAT)— and of subsidies, to be provided within four weeks after the end of each month.
A monthly statement of the status of accounts with the treasury, classified by major category (administrative services, state enterprises, mixed enterprises, public
60
administrative enterprises, international organizations, private depositors, and others), to be provided within six weeks after the end of each month.
Quarterly data for the large taxpayer office on (for TVA, BIC, IUTS) the numbers of:
registered taxpayers
declarations received on time
reminder letters sent to late and nonfilers.
These quarterly statistics are to be provided within two weeks after the end of each quarter. Similarly, quarterly data on the following are to be sent within 2 weeks of the end of the quarter:
total number of customs declarations
number of declarations selected by channel
number of declarations by channel subject to non-standard treatment.
B. Monetary Sector
25. The government will provide the following information within six weeks after the end of each month:
the consolidated balance sheet of monetary institutions
provisional data on the monetary survey provided six weeks after the end of each month (with final data provided ten weeks after the end of each month)
borrowing and lending interest rates
customary banking supervision indicators for bank and nonbank financial institutions, if necessary.
C. Balance of Payments
26. The government will report the following to Fund staff:
any revision of balance of payments data (including services, private transfers, official transfers, and capital transactions), as they occur
foreign trade statistics compiled by the National Statistics Institute, within three months after the end of the month concerned
61
preliminary annual balance of payments data within nine months after the end of the year concerned.
D. Real Sector
27. The government will report the following to Fund staff:
disaggregated monthly consumer price indices, within two weeks after the end of each month
provisional national accounts
any revision of the national accounts.
E. Structural Reforms and Other Data
28. The government will also report the following:
any study or official report on Burkina Faso’s economy, within two weeks after its publication
any decision, order, law, decree, ordinance, or circular that has economic or financial implications as soon as it is published or at the latest when it enters into force.
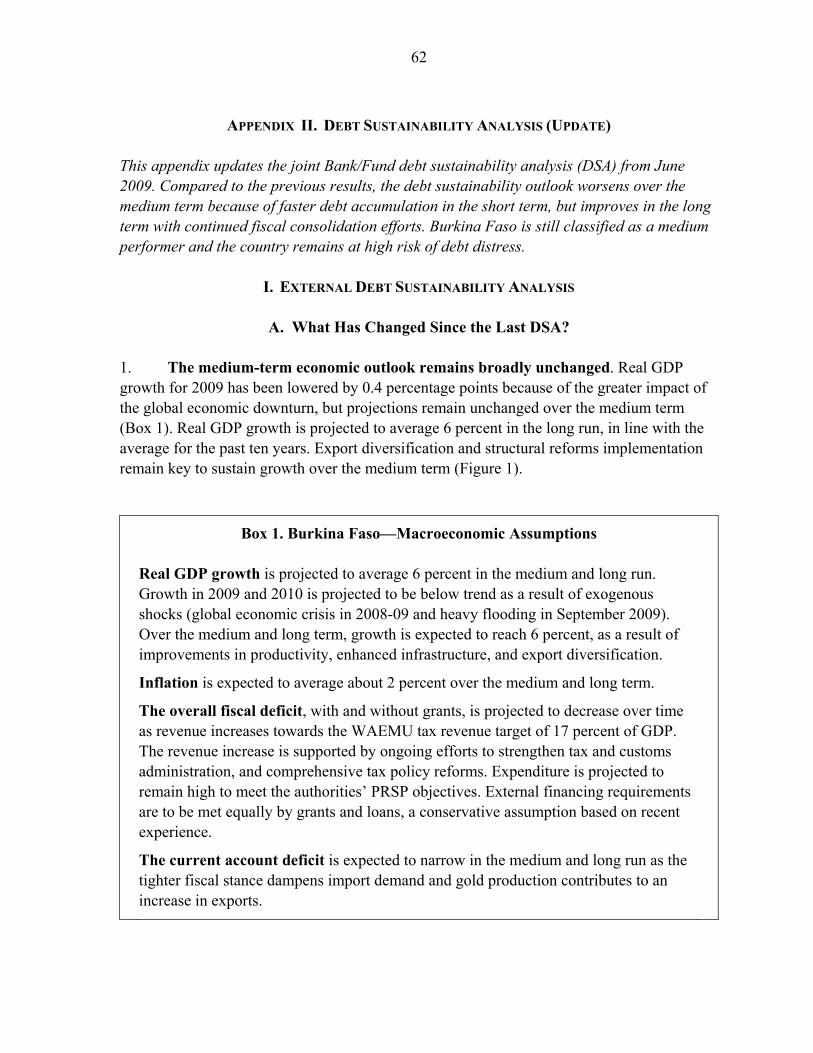
62
APPENDIX II. DEBT SUSTAINABILITY ANALYSIS (UPDATE)
This appendix updates the joint Bank/Fund debt sustainability analysis (DSA) from June 2009. Compared to the previous results, the debt sustainability outlook worsens over the medium term because of faster debt accumulation in the short term, but improves in the long term with continued fiscal consolidation efforts. Burkina Faso is still classified as a medium performer and the country remains at high risk of debt distress.
I. EXTERNAL DEBT SUSTAINABILITY ANALYSIS
A. What Has Changed Since the Last DSA?
1. The medium-term economic outlook remains broadly unchanged. Real GDP growth for 2009 has been lowered by 0.4 percentage points because of the greater impact of the global economic downturn, but projections remain unchanged over the medium term (Box 1). Real GDP growth is projected to average 6 percent in the long run, in line with the average for the past ten years. Export diversification and structural reforms implementation remain key to sustain growth over the medium term (Figure 1).
Box 1. Burkina Faso—Macroeconomic Assumptions
Real GDP growth is projected to average 6 percent in the medium and long run. Growth in 2009 and 2010 is projected to be below trend as a result of exogenous shocks (global economic crisis in 2008-09 and heavy flooding in September 2009). Over the medium and long term, growth is expected to reach 6 percent, as a result of improvements in productivity, enhanced infrastructure, and export diversification.
Inflation is expected to average about 2 percent over the medium and long term.
The overall fiscal deficit, with and without grants, is projected to decrease over time as revenue increases towards the WAEMU tax revenue target of 17 percent of GDP. The revenue increase is supported by ongoing efforts to strengthen tax and customs administration, and comprehensive tax policy reforms. Expenditure is projected to remain high to meet the authorities’ PRSP objectives. External financing requirements are to be met equally by grants and loans, a conservative assumption based on recent experience.
The current account deficit is expected to narrow in the medium and long run as the tighter fiscal stance dampens import demand and gold production contributes to an increase in exports.
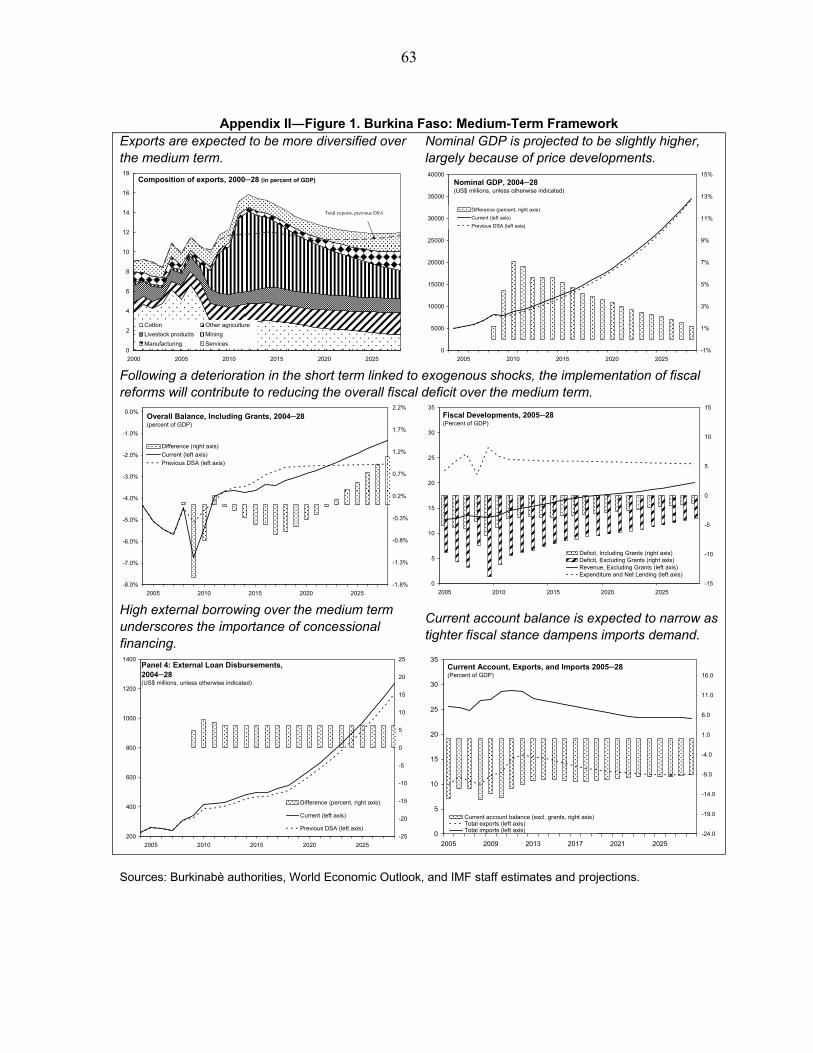
63
Appendix II―Figure 1. Burkina Faso: Medium-Term Framework
Exports are expected to be more diversified over the medium term.
Nominal GDP is projected to be slightly higher, largely because of price developments.
0
2
4
6
8
10
12
14
16
18
2000 2005 2010 2015 2020 2025
Cotton Other agriculture
Livestock products Mining
Manufacturing Services
Composition of exports, 2000─28 (in percent of GDP)
Total exports, previous DSA
0
5000
10000
15000
20000
25000
30000
35000
40000
2005 2010 2015 2020 2025
-1%
1%
3%
5%
7%
9%
11%
13%
15%
Difference (percent, right axis)
Current (left axis)
Previous DSA (left axis)
Nominal GDP, 2004─28(US$ millions, unless otherwise indicated)
Following a deterioration in the short term linked to exogenous shocks, the implementation of fiscal reforms will contribute to reducing the overall fiscal deficit over the medium term.
-8.0%
-7.0%
-6.0%
-5.0%
-4.0%
-3.0%
-2.0%
-1.0%
0.0%
2005 2010 2015 2020 2025
-1.8%
-1.3%
-0.8%
-0.3%
0.2%
0.7%
1.2%
1.7%
2.2%
Difference (right axis)
Current (left axis)Previous DSA (left axis)
Overall Balance, Including Grants, 2004─28(percent of GDP)
0
5
10
15
20
25
30
35
2005 2010 2015 2020 2025
-15
-10
-5
0
5
10
15
Deficit, Including Grants (right axis)Deficit, Excluding Grants (right axis)Revenue, Excluding Grants (left axis)Expenditure and Net Lending (left axis)
Fiscal Developments, 2005─28(Percent of GDP)
High external borrowing over the medium term underscores the importance of concessional financing.
Current account balance is expected to narrow as tighter fiscal stance dampens imports demand.
200
400
600
800
1000
1200
1400
2005 2010 2015 2020 2025
-25
-20
-15
-10
-5
0
5
10
15
20
25
Difference (percent, right axis)
Current (left axis)
Previous DSA (left axis)
Panel 4: External Loan Disbursements, 2004─28(US$ millions, unless otherwise indicated)
0
5
10
15
20
25
30
35
2005 2009 2013 2017 2021 2025
-24.0
-19.0
-14.0
-9.0
-4.0
1.0
6.0
11.0
16.0
Current account balance (excl. grants, right axis)Total exports (left axis)Total imports (left axis)
Current Account, Exports, and Imports 2005─28(Percent of GDP)
Sources: Burkinabè authorities, World Economic Outlook, and IMF staff estimates and projections.
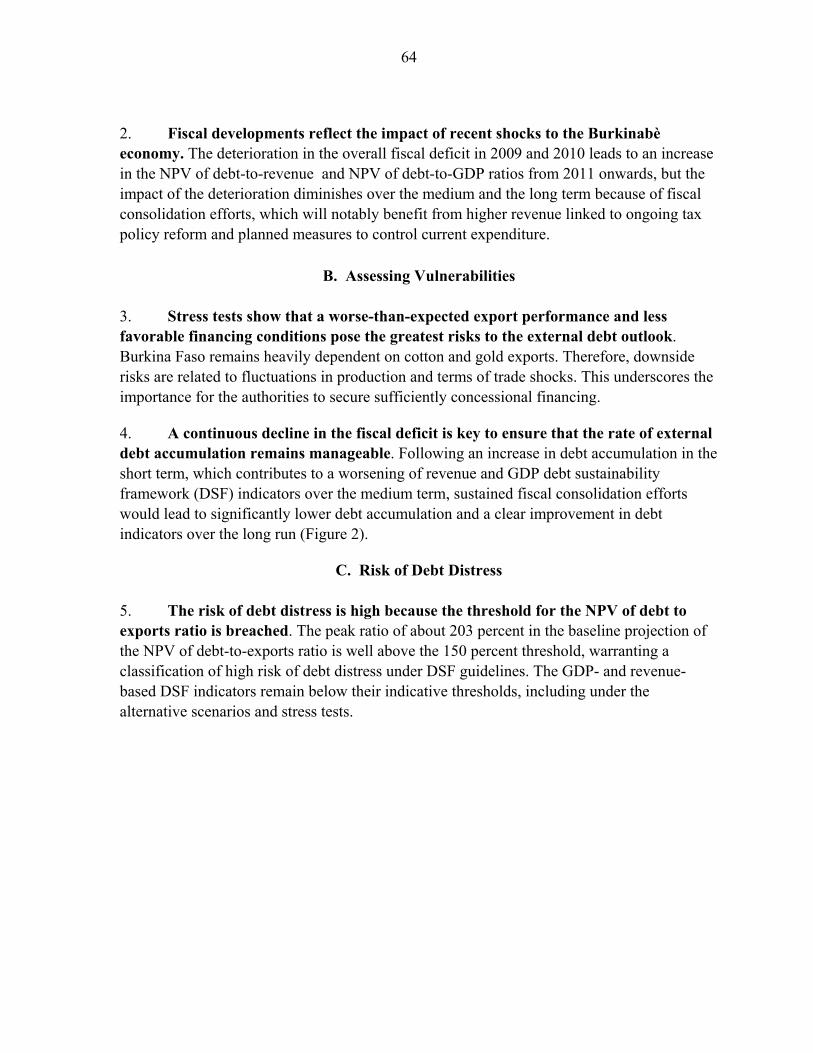
64
2. Fiscal developments reflect the impact of recent shocks to the Burkinabè economy. The deterioration in the overall fiscal deficit in 2009 and 2010 leads to an increase in the NPV of debt-to-revenue and NPV of debt-to-GDP ratios from 2011 onwards, but the impact of the deterioration diminishes over the medium and the long term because of fiscal consolidation efforts, which will notably benefit from higher revenue linked to ongoing tax policy reform and planned measures to control current expenditure.
B. Assessing Vulnerabilities
3. Stress tests show that a worse-than-expected export performance and less favorable financing conditions pose the greatest risks to the external debt outlook. Burkina Faso remains heavily dependent on cotton and gold exports. Therefore, downside risks are related to fluctuations in production and terms of trade shocks. This underscores the importance for the authorities to secure sufficiently concessional financing.
4. A continuous decline in the fiscal deficit is key to ensure that the rate of external debt accumulation remains manageable. Following an increase in debt accumulation in the short term, which contributes to a worsening of revenue and GDP debt sustainability framework (DSF) indicators over the medium term, sustained fiscal consolidation efforts would lead to significantly lower debt accumulation and a clear improvement in debt indicators over the long run (Figure 2).
C. Risk of Debt Distress
5. The risk of debt distress is high because the threshold for the NPV of debt to exports ratio is breached. The peak ratio of about 203 percent in the baseline projection of the NPV of debt-to-exports ratio is well above the 150 percent threshold, warranting a classification of high risk of debt distress under DSF guidelines. The GDP- and revenue-based DSF indicators remain below their indicative thresholds, including under the alternative scenarios and stress tests.
65
Appendix II―Figure 2. Burkina Faso: Current vs. Previous DSA3 The main risk remains the NPV of debt to exports ratio.
0
50
100
150
200
250
300
2007 2012 2017 2022 2027
NPV(Debt) / Exports
Threshold - Medium performer
Previous DSA
Baseline with previous denominator
Net present value of debt/exports, 2004─28(percent)
NPV of debt to GDP and revenue ratios increase over the medium term but remain below the indicative thresholds.
0
5
10
15
20
25
30
35
40
45
50
2007 2012 2017 2022 2027
NPV(Debt) / GDP
Threshold - Medium performer
Previous DSA
Baseline with previous denominator
Net present value of debt/GDP, 2004─28(percent)
0
50
100
150
200
250
300
2007 2012 2017 2022 2027
NPV(Debt) / Revenues
Threshold - Medium performer
Previous DSA
Baseline with previous denominator
Net present value of debt/revenue, 2004─28(percent)
Debt service ratios are well below thresholds.
0
5
10
15
20
25
2007 2012 2017 2022 2027
Debt service / Exports
Threshold - Medium performer
Previous DSA
Baseline with previous denominator
Debt-service/exports, 2004─28(percent)
0
5
10
15
20
25
30
35
2007 2012 2017 2022 2027
Debt service / Revenues
Threshold - Medium performer
Previous DSA
Baseline with previous denominator
Debt-service/revenue, 2004─28(percent)
Sources: Burkinabè authorities, World Economic Outlook, and IMF staff estimates and projections.
3 Previous DSA refers to the June 2009 joint Bank/Fund DSA.
66
II. PUBLIC DEBT SUSTAINABILITY ANALYSIS
6. The results for the fiscal DSA are similar to those of the external DSA. The domestic debt stock is low. Gross domestic debt is estimated at about 2.7 percent of GDP at end-2008, and the net debt at 1.3 percent of GDP. Although domestic debt increases in 2009 and 2010 because of increased financing needs triggered by exogenous shocks, it is assumed to decline over the projection period as the authorities seek to avoid more costly domestic financing of the fiscal deficit. Public debt dynamics are thus largely determined by the evolution of external debt. Stress tests and alternative scenarios show that failure to reduce the current fiscal deficits would lead to ever-increasing debt indicators, demonstrating the importance of fiscal consolidation efforts.
III. CONCLUSION
7. Burkina Faso’s risk of debt distress is high on account of the NPV of debt-to-exports ratio; all other debt indicators remain comfortably below their policy-dependent thresholds under the baseline scenario. Nevertheless, the high risk of debt distress and the accumulation of debt as a result of recent shocks underscore the importance of limiting external borrowing to concessional loans, implementing a prudent fiscal policy, and making continued efforts to diversify and increase exports. Moreover, the authorities should continue to improve their policy and institutional environment, which over time may result in a higher CPIA rating and higher debt thresholds.
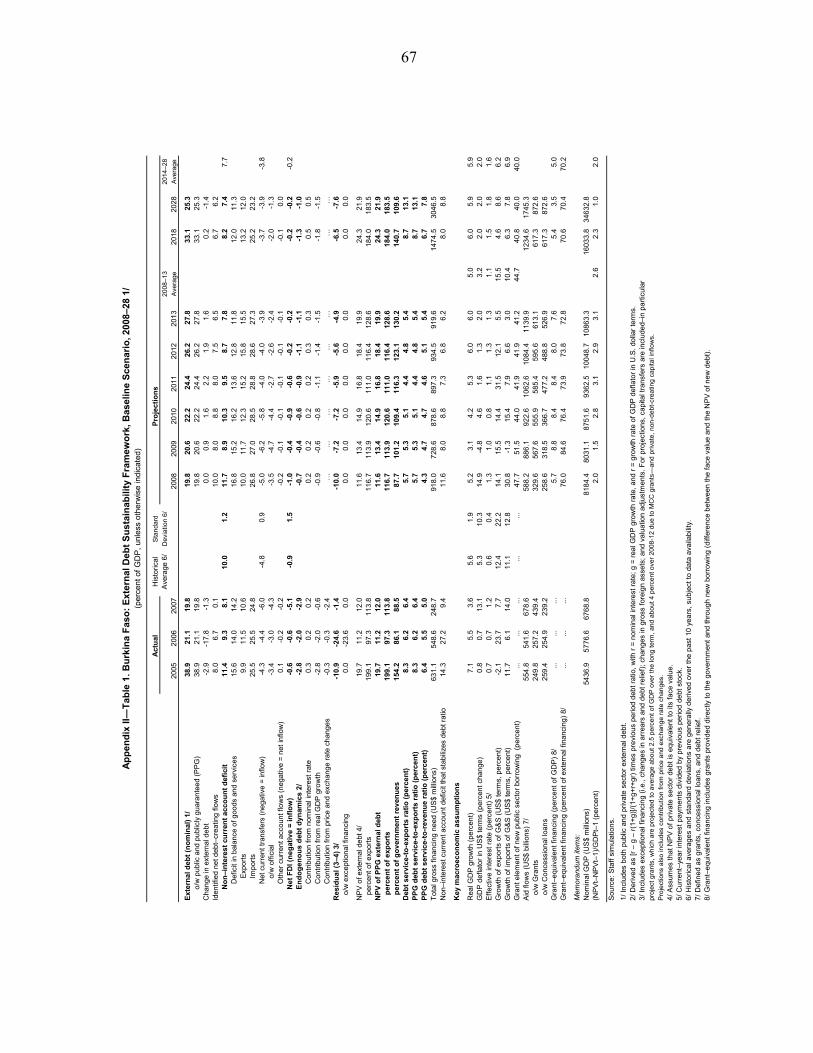
67
His
tori
cal
Sta
nda
rd
Ave
rage
6/
Dev
iatio
n 6/
2008
–13
2014
–28
2005
200
620
072
008
2009
201
020
112
012
201
3A
vera
ge2
018
2028
Ave
rage
Ex
tern
al
deb
t (n
om
inal
) 1
/38
.92
1.1
19.
81
9.8
20.6
22
.22
4.4
26.2
27.
83
3.1
25.3
o/w
pub
lic a
nd p
ubl
icly
gua
ran
tee
d (P
PG
)38
.92
1.1
19.
81
9.8
20.6
22
.22
4.4
26.2
27.
83
3.1
25.3
Cha
nge
in e
xte
rna
l de
bt
-2.9
-17.
8-1
.30.
00
.91
.62.
21
.91.
60.
2-1
.4Id
entif
ied
ne
t deb
t–cr
ea
ting
flo
ws
8.0
6.7
0.1
10.
08
.08
.88.
07
.56.
56.
76
.2N
on
–in
tere
st
curr
ent
acc
ou
nt
de
fici
t11
.49.
38.
110
.01.
21
1.7
8.9
10
.39.
58
.77.
88.
27
.47.
7D
efic
it in
bal
anc
e o
f goo
ds
and
se
rvic
es
15.6
14.
01
4.2
16.
815
.21
6.2
13.
612
.81
1.8
12.
011
.3E
xpo
rts
9.9
11.
51
0.6
10.
011
.71
2.3
15.
215
.81
5.5
13.
212
.0Im
por
ts
25.5
25.
52
4.8
26.
827
.02
8.5
28.
828
.62
7.3
25.
223
.2N
et c
urre
nt t
ran
sfe
rs (
nega
tive
= in
flow
)-4
.3-4
.4-6
.0-4
.80.
9-5
.0-6
.2-5
.8-4
.0-4
.0-3
.9-3
.7-3
.9-3
.8o/
w o
ffic
ial
-3.4
-3.0
-4.3
-3.5
-4.7
-4.4
-2.7
-2.6
-2.4
-2.0
-1.3
Oth
er c
urre
nt a
cco
unt f
low
s (n
egat
ive
= n
et in
flow
)0
.1-0
.2-0
.2-0
.2-0
.1-0
.1-0
.1-0
.1-0
.1-0
.10
.0N
et
FD
I (n
eg
ativ
e =
infl
ow
)-0
.6-0
.6-5
.1-0
.91.
5-1
.0-0
.4-0
.9-0
.6-0
.2-0
.2-0
.2-0
.2-0
.2E
nd
og
en
ou
s d
ebt
dyn
amic
s 2
/-2
.8-2
.0-2
.9-0
.7-0
.4-0
.6-0
.9-1
.1-1
.1-1
.3-1
.0C
ontr
ibu
tion
fro
m n
om
ina
l int
ere
st r
ate
0.3
0.2
0.2
0.2
0.2
0.2
0.2
0.3
0.3
0.5
0.5
Con
trib
utio
n fr
om
rea
l GD
P g
row
th
-2.8
-2.0
-0.6
-0.9
-0.6
-0.8
-1.1
-1.4
-1.5
-1.8
-1.5
Con
trib
utio
n fr
om
pri
ce a
nd
exc
hang
e ra
te c
han
ges
-0.3
-0.3
-2.4
……
……
……
……
Res
idu
al (
3–4
) 3/
-10
.9-2
4.6
-1.4
-10.
0-7
.2-7
.2-5
.9-5
.6-4
.9-6
.5-7
.6o
/w e
xcep
tiona
l fin
an
cin
g0
.0-2
3.6
0.0
0.0
0.0
0.0
0.0
0.0
0.0
0.0
0.0
NP
V o
f ext
ern
al d
ebt
4/
19.7
11.
21
2.0
11.
613
.41
4.9
16.
818
.41
9.9
24.
321
.9p
erce
nt o
f e
xpo
rts
199
.19
7.3
11
3.8
116.
71
13.9
120
.611
1.0
116
.412
8.6
184.
01
83.5
NP
V o
f P
PG
ex
tern
al d
eb
t19
.71
1.2
12.
01
1.6
13.4
14
.91
6.8
18.4
19.
92
4.3
21.9
pe
rce
nt
of
exp
ort
s
199
.19
7.3
11
3.8
116.
71
13.9
120
.611
1.0
116
.412
8.6
184.
01
83.5
pe
rce
nt
of
go
ver
nm
ent
rev
enu
es
154
.28
6.1
88.
58
7.7
101
.21
09.4
116.
31
23.1
130.
214
0.7
109
.6D
ebt
serv
ice
-to
-exp
ort
s r
ati
o (
per
cen
t)8
.36.
26.
45.
75
.35
.14.
44
.85.
48.
713
.1P
PG
deb
t s
erv
ice-
to-e
xp
ort
s ra
tio
(p
erc
ent)
8.3
6.2
6.4
5.7
5.3
5.1
4.4
4.8
5.4
8.7
13.1
PP
G d
ebt
ser
vic
e-to
-rev
en
ue
rati
o (
pe
rcen
t)6
.45.
55.
04.
34
.74
.74.
65
.15.
46.
77
.8T
ota
l gro
ss f
inan
cing
nee
d (U
S$
mill
ion
s)6
31.1
548.
62
48.
791
8.0
728
.68
78.6
897.
39
34.5
919.
61
474.
530
46.5
Non
–in
tere
st c
urre
nt
acco
unt
defic
it th
at s
tab
ilize
s de
bt r
atio
14
.32
7.2
9.4
11.
68
.08
.87.
36
.86.
28.
08
.8
Key
mac
roec
on
om
ic a
ssu
mp
tio
ns
Rea
l GD
P g
row
th (
perc
ent)
7.1
5.5
3.6
5.6
1.9
5.2
3.1
4.2
5.3
6.0
6.0
5.0
6.0
5.9
5.9
GD
P d
efla
tor
in U
S$
term
s (p
erce
nt c
han
ge)
0.8
0.7
13.
15
.31
0.3
14.
9-4
.84
.61.
61
.32.
03
.22.
02
.02.
0E
ffe
ctiv
e in
tere
st r
ate
(p
erce
nt)
5/
0.7
0.7
1.2
0.6
0.4
1.3
1.0
0.8
1.1
1.3
1.3
1.1
1.5
1.8
1.6
Gro
wth
of
expo
rts
of
G&
S (
US
$ te
rms,
pe
rcen
t)-2
.12
3.7
7.7
12.4
22.
21
4.1
15.5
14
.43
1.5
12.1
5.5
15.5
4.6
8.6
6.2
Gro
wth
of
impo
rts
of
G&
S (
US
$ te
rms,
per
cent
)11
.76.
11
4.0
11.1
12.
83
0.8
-1.3
15
.47.
96
.63.
010
.46.
37
.86.
9G
rant
ele
men
t of
ne
w p
ubl
ic s
ect
or
borr
owin
g (
per
cent
)...
...
...
......
47.
751
.54
4.0
41.
941
.94
1.2
44.7
40.
840
.04
0.0
Aid
flo
ws
(US
$ b
illio
ns)
7/
554
.854
1.6
67
8.6
588.
28
86.1
922
.61
062.
610
84.4
113
9.9
123
4.6
1745
.3o
/w G
rant
s2
49.8
257.
24
39.
432
9.6
567
.65
55.9
585.
45
95.6
613.
161
7.3
872
.6o
/w C
onc
ess
ion
al lo
ans
259
.425
4.9
23
9.2
258.
63
18.5
366
.747
7.2
488
.852
6.9
617.
38
72.6
Gra
nt–e
quiv
alen
t fin
anc
ing
(per
cent
of
GD
P)
8/...
...
...
5.7
8.8
8.4
8.4
8.0
7.6
5.4
3.5
5.0
Gra
nt–e
quiv
alen
t fin
anc
ing
(per
cent
of
ext
ern
al f
ina
ncin
g) 8
/...
...
...
76.
084
.67
6.4
73.
973
.87
2.8
70.
670
.47
0.2
Mem
ora
ndu
m it
ems:
Nom
inal
GD
P (
US
$ m
illio
ns)
54
36.9
577
6.6
676
8.8
818
4.4
8031
.18
751
.69
362.
51
0048
.710
863.
316
033.
83
4632
.8(N
PV
t–N
PV
t–1
)/G
DP
t–1
(pe
rcen
t)2.
01
.52
.83.
12
.93.
12
.62.
31
.02.
0
So
urc
e:
Sta
ff s
imul
atio
ns.
1/ I
ncl
udes
bo
th p
ublic
an
d pr
ivat
e s
ect
or
exte
rnal
deb
t.2
/ De
rive
d as
[r –
g –
r(1
+g
)]/(
1+g+
r+gr
) tim
es
pre
viou
s p
erio
d d
ebt r
atio
, w
ith r
= n
om
inal
inte
rest
ra
te; g
= r
eal G
DP
gro
wth
ra
te, a
nd r
= g
row
th r
ate
of
GD
P d
efla
tor
in U
.S.
dol
lar
term
s.
proj
ect
gra
nts,
wh
ich
are
proj
ecte
d to
ave
rage
abo
ut 2
.5 p
erc
ent
of G
DP
ove
r th
e lo
ng t
erm
, an
d ab
out
4 p
erce
nt o
ver
2008
-12
due
to M
CC
gra
nts—
and
priv
ate,
non
-deb
t-cr
eatin
g ca
pita
l in
flow
s.
Pro
ject
ions
als
o in
clud
es c
ontr
ibut
ion
fro
m p
rice
and
exc
hang
e ra
te c
han
ges.
4/ A
ssum
es
tha
t NP
V o
f priv
ate
se
cto
r de
bt is
equ
ival
ent
to
its f
ace
va
lue.
5/ C
urr
ent
–ye
ar
inte
rest
pay
me
nts
divi
ded
by
pre
vio
us p
erio
d de
bt s
tock
.
6/ H
isto
rica
l ave
rag
es
and
sta
ndar
d d
evia
tion
s a
re g
ener
ally
der
ived
ove
r th
e p
ast 1
0 y
ear
s, s
ubje
ct to
da
ta a
vaila
bili
ty.
7/ D
efin
ed
as g
ran
ts,
conc
ess
ion
al lo
ans,
an
d de
bt r
elie
f.8
/ Gra
nt–e
quiv
alen
t fin
anc
ing
incl
udes
gra
nts
pro
vide
d d
irect
ly to
the
gov
ern
me
nt a
nd
thro
ugh
new
bo
rro
win
g (
diff
ere
nce
bet
we
en th
e fa
ce v
alue
and
the
NP
V o
f n
ew d
ebt)
.
3/ I
ncl
udes
exc
eptio
nal
fin
anc
ing
(i.e
., ch
ang
es
in a
rrea
rs a
nd
debt
rel
ief)
; ch
ange
s in
gro
ss f
orei
gn
asse
ts;
and
val
uat
ion
adju
stm
ents
. F
or p
roje
ctio
ns,
cap
ital t
rans
fers
are
incl
ude
d–in
par
ticu
lar
Ac
tua
l
Ap
pen
dix
II―
Tab
le 1
. Bu
rkin
a F
aso
: E
xter
nal
Deb
t S
ust
ain
abili
ty F
ram
ewo
rk, B
asel
ine
Sce
nar
io, 2
008–
28 1
/(p
erce
nt o
f G
DP
, un
less
oth
erw
ise
indi
cate
d)
Pro
jec
tio
ns
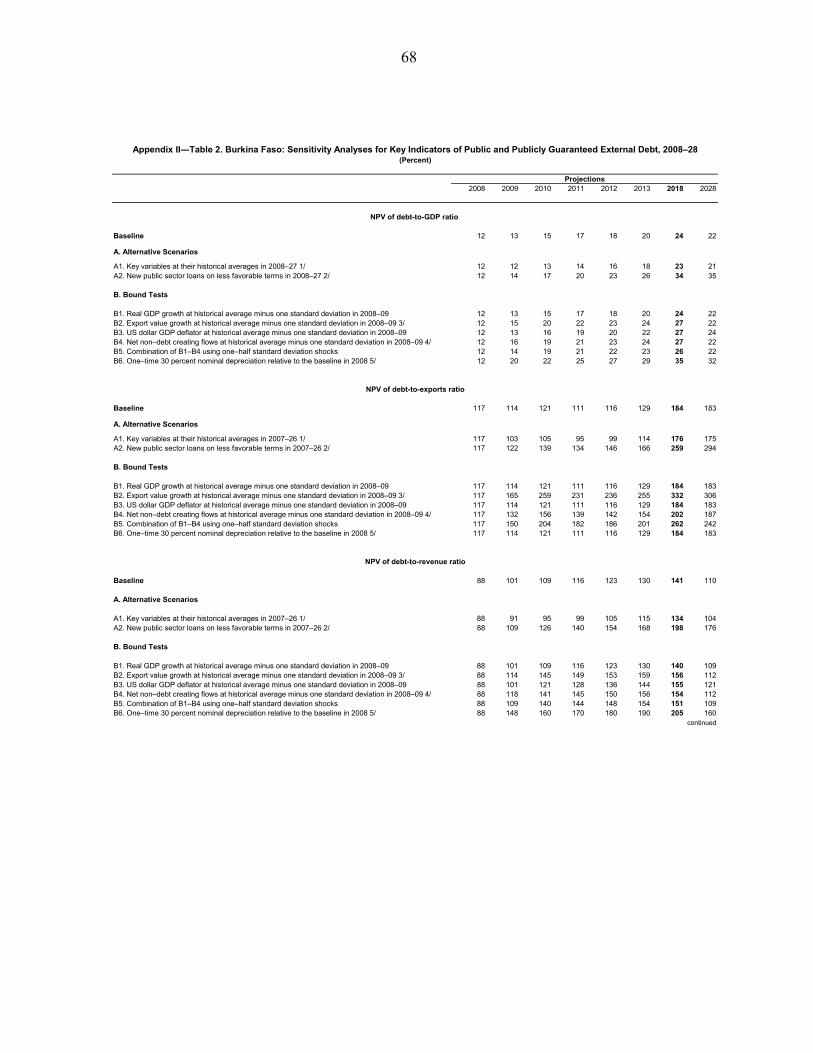
68
2008 2009 2010 2011 2012 2013 2018 2028
Baseline 12 13 15 17 18 20 24 22
A. Alternative Scenarios
A1. Key variables at their historical averages in 2008–27 1/ 12 12 13 14 16 18 23 21A2. New public sector loans on less favorable terms in 2008–27 2/ 12 14 17 20 23 26 34 35
B. Bound Tests
B1. Real GDP growth at historical average minus one standard deviation in 2008–09 12 13 15 17 18 20 24 22B2. Export value growth at historical average minus one standard deviation in 2008–09 3/ 12 15 20 22 23 24 27 22B3. US dollar GDP deflator at historical average minus one standard deviation in 2008–09 12 13 16 19 20 22 27 24B4. Net non–debt creating flows at historical average minus one standard deviation in 2008–09 4/ 12 16 19 21 23 24 27 22B5. Combination of B1–B4 using one–half standard deviation shocks 12 14 19 21 22 23 26 22B6. One–time 30 percent nominal depreciation relative to the baseline in 2008 5/ 12 20 22 25 27 29 35 32
Baseline 117 114 121 111 116 129 184 183
A. Alternative Scenarios
A1. Key variables at their historical averages in 2007–26 1/ 117 103 105 95 99 114 176 175A2. New public sector loans on less favorable terms in 2007–26 2/ 117 122 139 134 146 166 259 294
B. Bound Tests
B1. Real GDP growth at historical average minus one standard deviation in 2008–09 117 114 121 111 116 129 184 183B2. Export value growth at historical average minus one standard deviation in 2008–09 3/ 117 165 259 231 236 255 332 306B3. US dollar GDP deflator at historical average minus one standard deviation in 2008–09 117 114 121 111 116 129 184 183B4. Net non–debt creating flows at historical average minus one standard deviation in 2008–09 4/ 117 132 156 139 142 154 202 187B5. Combination of B1–B4 using one–half standard deviation shocks 117 150 204 182 186 201 262 242B6. One–time 30 percent nominal depreciation relative to the baseline in 2008 5/ 117 114 121 111 116 129 184 183
Baseline 88 101 109 116 123 130 141 110
A. Alternative Scenarios
A1. Key variables at their historical averages in 2007–26 1/ 88 91 95 99 105 115 134 104A2. New public sector loans on less favorable terms in 2007–26 2/ 88 109 126 140 154 168 198 176
B. Bound Tests
B1. Real GDP growth at historical average minus one standard deviation in 2008–09 88 101 109 116 123 130 140 109B2. Export value growth at historical average minus one standard deviation in 2008–09 3/ 88 114 145 149 153 159 156 112B3. US dollar GDP deflator at historical average minus one standard deviation in 2008–09 88 101 121 128 136 144 155 121B4. Net non–debt creating flows at historical average minus one standard deviation in 2008–09 4/ 88 118 141 145 150 156 154 112B5. Combination of B1–B4 using one–half standard deviation shocks 88 109 140 144 148 154 151 109B6. One–time 30 percent nominal depreciation relative to the baseline in 2008 5/ 88 148 160 170 180 190 205 160
NPV of debt-to-revenue ratio
continued
Appendix II―Table 2. Burkina Faso: Sensitivity Analyses for Key Indicators of Public and Publicly Guaranteed External Debt, 2008–28(Percent)
NPV of debt-to-GDP ratio
NPV of debt-to-exports ratio
Projections
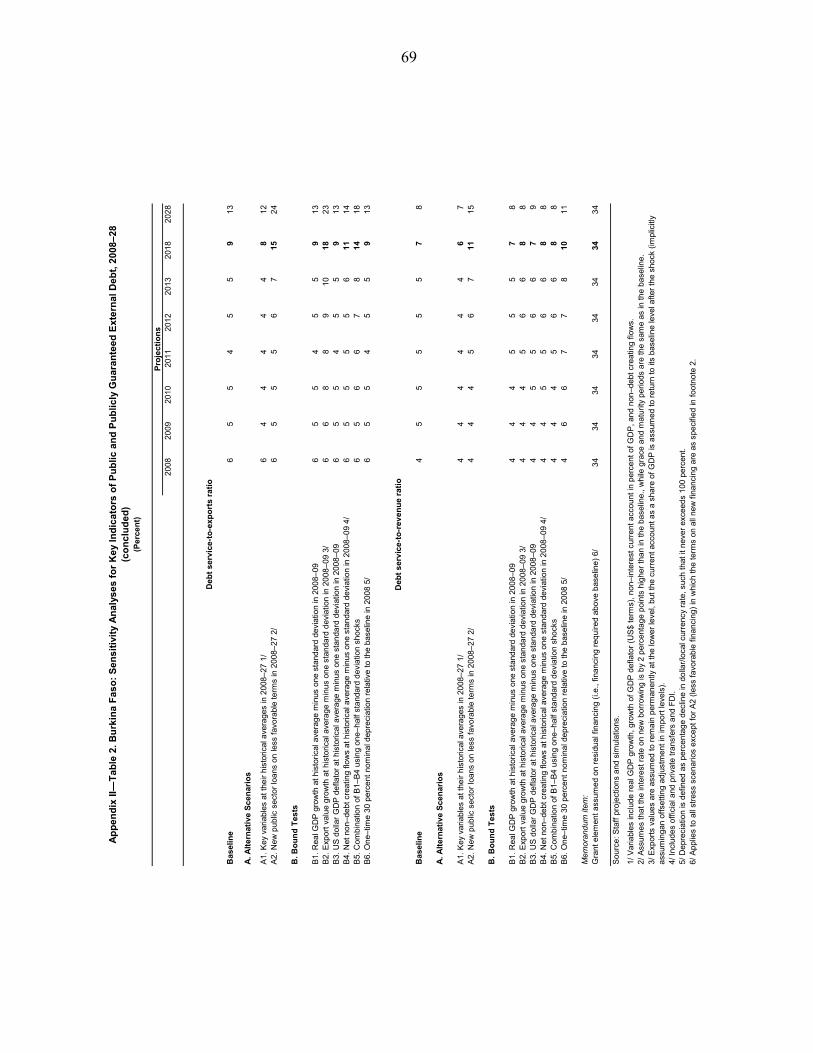
69
2008
2009
2010
2011
201
220
1320
1820
28
Bas
elin
e6
55
45
59
13
A. A
lter
nat
ive
Sce
nar
ios
A1.
Key
var
iabl
es a
t the
ir hi
stor
ical
ave
rage
s in
200
8–27
1/
64
44
44
81
2A
2. N
ew p
ublic
sec
tor
loan
s on
less
fav
orab
le te
rms
in 2
008–
27
2/6
55
56
715
24
B. B
ou
nd
Tes
ts
B1.
Rea
l GD
P g
row
th a
t his
toric
al a
vera
ge m
inus
one
sta
ndar
d de
viat
ion
in 2
008–
096
55
45
59
13
B2.
Exp
ort v
alue
gro
wth
at h
isto
rica
l ave
rag
e m
inus
one
sta
ndar
d de
viat
ion
in 2
008
–09
3/6
68
89
1018
23
B3.
US
dol
lar
GD
P d
efla
tor
at h
isto
rica
l ave
rage
min
us o
ne s
tan
dard
dev
iatio
n in
200
8–09
65
54
55
91
3B
4. N
et n
on–d
ebt c
reat
ing
flow
s at
his
toric
al a
vera
ge m
inus
one
sta
ndar
d d
evia
tion
in 2
008–
09 4
/6
55
55
611
14
B5.
Com
bina
tion
of B
1–B
4 u
sing
one
–ha
lf st
and
ard
devi
atio
n sh
ocks
6
56
67
814
18
B6.
One
–tim
e 30
per
cent
nom
inal
dep
reci
atio
n re
lativ
e to
the
base
line
in 2
008
5/6
55
45
59
13
Bas
elin
e4
55
55
57
8
A. A
lter
nat
ive
Sce
nar
ios
A1.
Key
var
iabl
es a
t the
ir hi
stor
ical
ave
rage
s in
200
8–27
1/
44
44
44
67
A2.
New
pub
lic s
ecto
r lo
ans
on le
ss f
avor
able
term
s in
200
8–2
7 2/
44
45
67
111
5
B. B
ou
nd
Tes
ts
B1.
Rea
l GD
P g
row
th a
t his
toric
al a
vera
ge m
inus
one
sta
ndar
d de
viat
ion
in 2
008–
094
44
55
57
8B
2. E
xpor
t val
ue g
row
th a
t his
tori
cal a
vera
ge
min
us o
ne s
tand
ard
devi
atio
n in
20
08–0
9 3/
44
45
66
88
B3.
US
dol
lar
GD
P d
efla
tor
at h
isto
rica
l ave
rage
min
us o
ne s
tan
dard
dev
iatio
n in
200
8–09
44
55
66
79
B4.
Net
non
–deb
t cre
atin
g flo
ws
at h
isto
rical
ave
rage
min
us o
ne s
tand
ard
dev
iatio
n in
200
8–09
4/
44
55
66
88
B5.
Com
bina
tion
of B
1–B
4 u
sing
one
–ha
lf st
and
ard
devi
atio
n sh
ocks
4
44
56
68
8B
6. O
ne–t
ime
30 p
erce
nt n
omin
al d
epre
ciat
ion
rela
tive
to th
e ba
selin
e in
200
8 5/
46
67
78
101
1
Mem
oran
dum
item
:G
rant
ele
men
t ass
umed
on
resi
dual
fin
anci
ng (
i.e.,
finan
cing
req
uire
d ab
ove
base
line)
6/
3434
3434
34
3434
34
Sou
rce:
Sta
ff p
roje
ctio
ns
and
sim
ulat
ion
s.
1/ V
aria
bles
incl
ude
real
GD
P g
row
th, g
row
th o
f G
DP
def
lato
r (U
S$
term
s), n
on–
inte
rest
cur
rent
acc
oun
t in
perc
ent
of
GD
P, a
nd n
on–d
ebt c
reat
ing
flow
s.
4/ I
nclu
des
offic
ial a
nd p
riva
te tr
ansf
ers
and
FD
I.5
/ Dep
reci
atio
n is
de
fined
as
perc
enta
ge d
eclin
e in
dol
lar/
loca
l cur
renc
y ra
te, s
uch
that
it n
ever
exc
eeds
100
per
cent
.6
/ App
lies
to a
ll st
ress
sce
nar
ios
exce
pt f
or
A2
(less
fav
orab
le f
ina
ncin
g) in
wh
ich
the
term
s on
all
new
fin
anci
ng a
re a
s sp
ecifi
ed in
foo
tno
te 2
.
3/ E
xpor
ts v
alue
s a
re a
ssu
med
to
rem
ain
perm
anen
tly a
t th
e lo
wer
leve
l, b
ut th
e cu
rren
t acc
ount
as
a sh
are
of G
DP
is a
ssum
ed to
ret
urn
to it
s ba
selin
e le
vel a
fter
the
shoc
k (im
plic
itly
ass
umin
gan
offs
ettin
g ad
just
men
t in
impo
rt le
vels
).
2/ A
ssum
es th
at th
e in
tere
st r
ate
on
new
bor
row
ing
is b
y 2
per
cent
age
poin
ts h
ighe
r th
an in
the
base
line.
, whi
le g
race
and
mat
urity
pe
riods
are
the
sam
e as
in th
e ba
selin
e.
Deb
t s
erv
ice-
to-r
even
ue
rati
o
Deb
t se
rvic
e-t
o-e
xpo
rts
rati
o
Ap
pen
dix
II―
Tab
le 2
. B
urk
ina
Fa
so:
Sen
sit
ivit
y A
nal
yses
fo
r K
ey In
dic
ato
rs o
f P
ub
lic a
nd
Pu
blic
ly G
uar
ante
ed E
xte
rnal
Deb
t, 2
008
–28
(c
on
clu
ded
)(P
erce
nt)
Pro
ject
ion
s
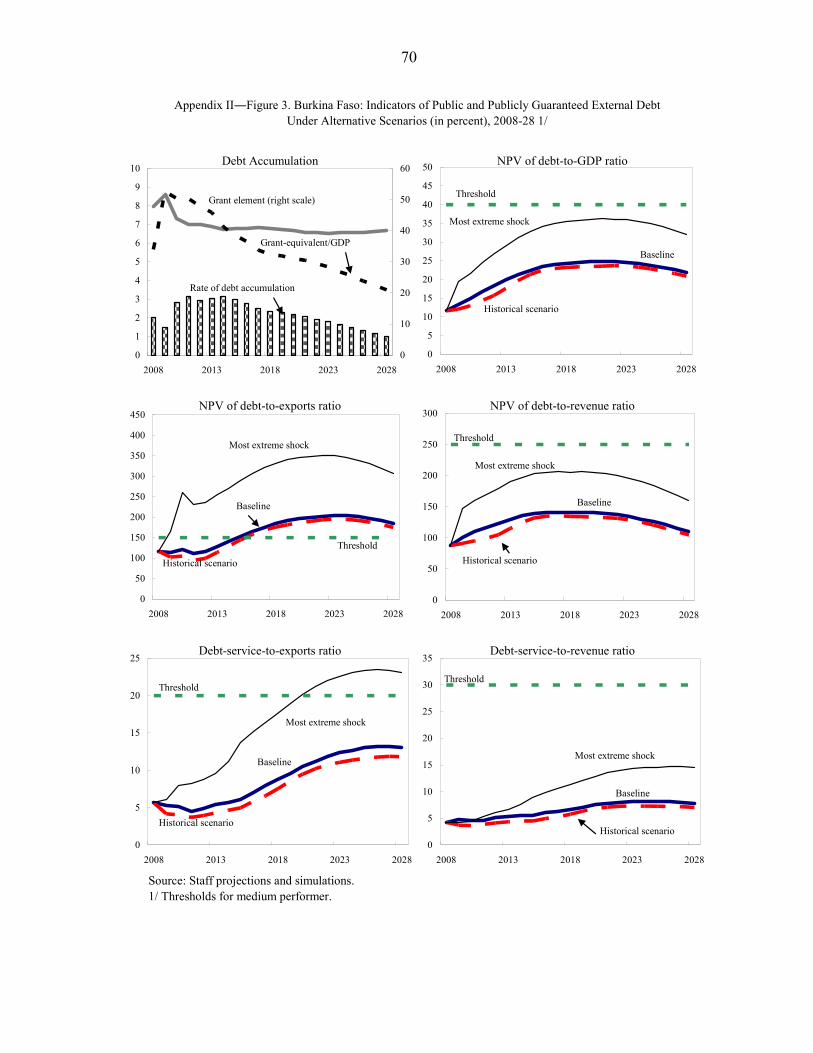
70
Appendix II―Figure 3. Burkina Faso: Indicators of Public and Publicly Guaranteed External Debt Under Alternative Scenarios (in percent), 2008-28 1/
Source: Staff projections and simulations.1/ Thresholds for medium performer.
Debt Accumulation
0
1
2
3
4
5
6
7
8
9
10
2008 2013 2018 2023 2028
0
10
20
30
40
50
60
Rate of debt accumulation
Grant element (right scale)
Grant-equivalent/GDP
NPV of debt-to-GDP ratio
0
5
10
15
20
25
30
35
40
45
50
2008 2013 2018 2023 2028
Baseline
Threshold
Historical scenario
Most extreme shock
NPV of debt-to-exports ratio
0
50
100
150
200
250
300
350
400
450
2008 2013 2018 2023 2028
Baseline
Threshold
Historical scenario
Most extreme shock
NPV of debt-to-revenue ratio
0
50
100
150
200
250
300
2008 2013 2018 2023 2028
Baseline
Threshold
Historical scenario
Most extreme shock
Debt-service-to-exports ratio
0
5
10
15
20
25
2008 2013 2018 2023 2028
Baseline
Threshold
Historical scenario
Most extreme shock
Debt-service-to-revenue ratio
0
5
10
15
20
25
30
35
2008 2013 2018 2023 2028
Baseline
Threshold
Historical scenario
Most extreme shock
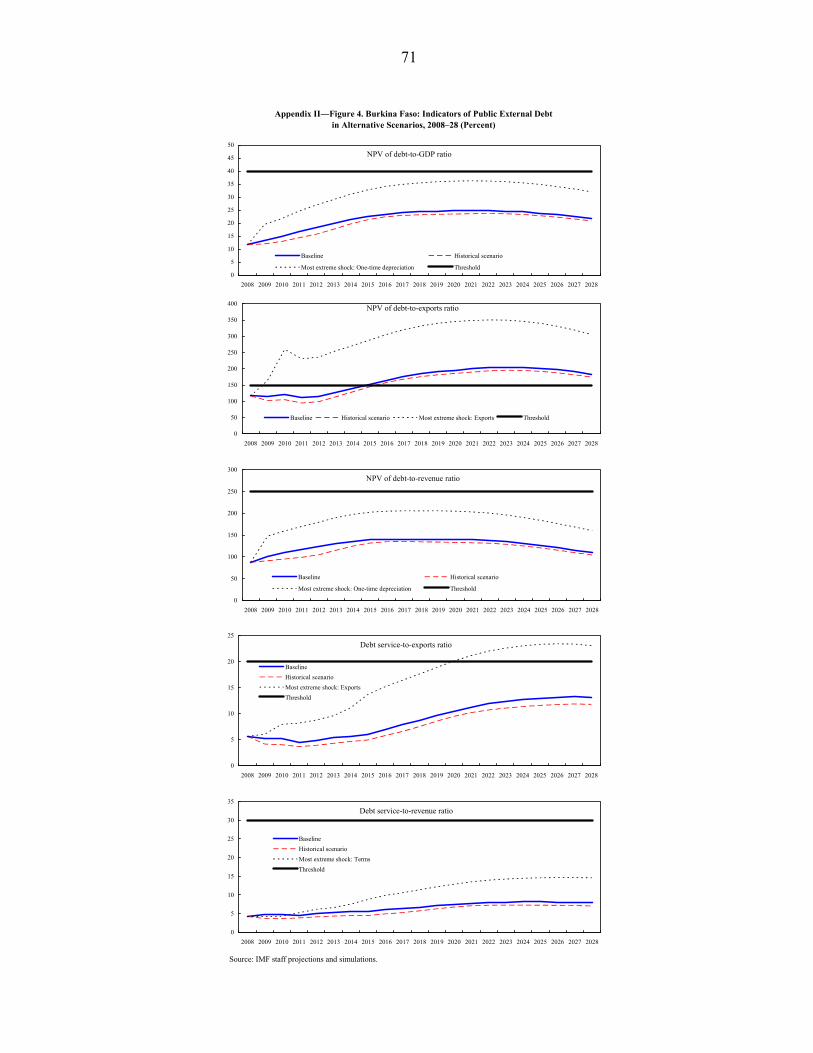
71
Appendix II―Figure 4. Burkina Faso: Indicators of Public External Debt
in Alternative Scenarios, 2008–28 (Percent)
Source: IMF staff projections and simulations.
NPV of debt-to-GDP ratio
0
5
10
15
20
25
30
35
40
45
50
2008 2009 2010 2011 2012 2013 2014 2015 2016 2017 2018 2019 2020 2021 2022 2023 2024 2025 2026 2027 2028
Baseline Historical scenario
Most extreme shock: One-time depreciation Threshold
NPV of debt-to-exports ratio
0
50
100
150
200
250
300
350
400
2008 2009 2010 2011 2012 2013 2014 2015 2016 2017 2018 2019 2020 2021 2022 2023 2024 2025 2026 2027 2028
Baseline Historical scenario Most extreme shock: Exports Threshold
Debt service-to-exports ratio
0
5
10
15
20
25
2008 2009 2010 2011 2012 2013 2014 2015 2016 2017 2018 2019 2020 2021 2022 2023 2024 2025 2026 2027 2028
Baseline
Historical scenario
Most extreme shock: Exports
Threshold
NPV of debt-to-revenue ratio
0
50
100
150
200
250
300
2008 2009 2010 2011 2012 2013 2014 2015 2016 2017 2018 2019 2020 2021 2022 2023 2024 2025 2026 2027 2028
Baseline Historical scenario
Most extreme shock: One-time depreciation Threshold
Debt service-to-revenue ratio
0
5
10
15
20
25
30
35
2008 2009 2010 2011 2012 2013 2014 2015 2016 2017 2018 2019 2020 2021 2022 2023 2024 2025 2026 2027 2028
Baseline
Historical scenario
Most extreme shock: Terms
Threshold
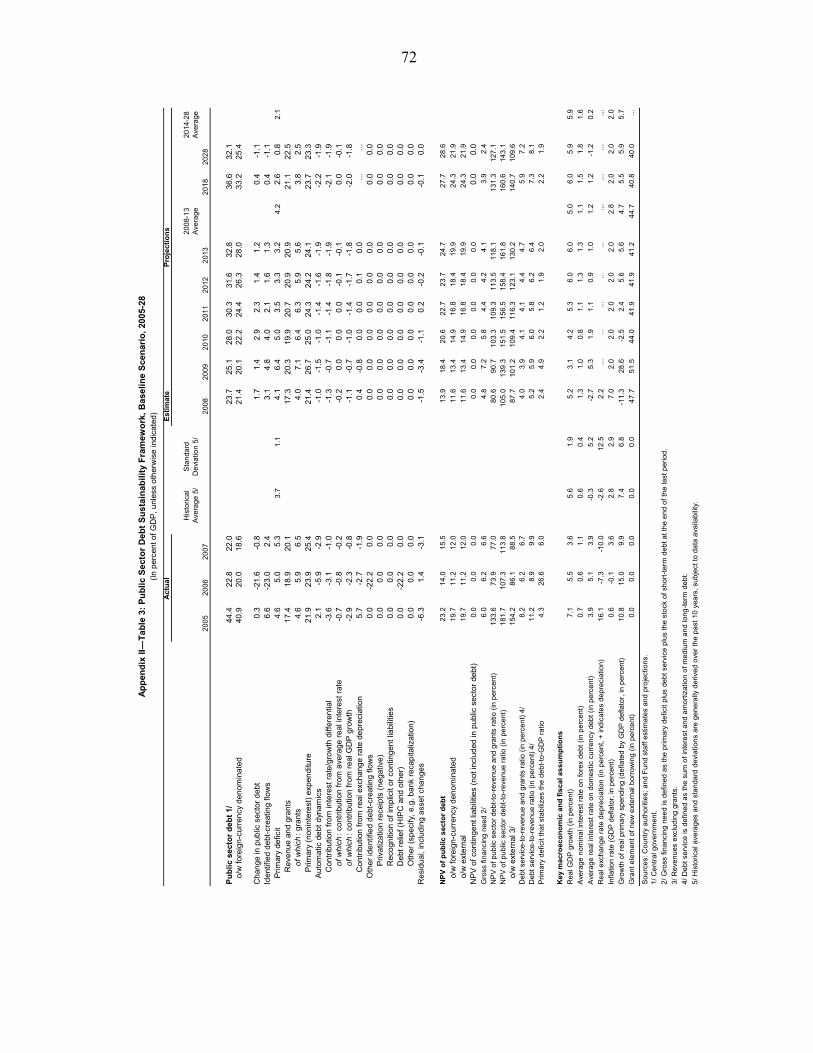
72
Es
tim
ate
20
05
20
06
20
07
His
tori
cal
Ave
rag
e 5
/S
tan
da
rd
De
via
tion
5/
20
08
20
092
010
201
12
012
20
13
20
08
-13
A
vera
ge
20
18
20
28
20
14-
28
Ave
rag
e
Pu
bli
c se
cto
r d
ebt
1/44
.422
.822
.023
.725
.128
.030
.331
.632
.836
.632
.1o/
w f
orei
gn-c
urre
ncy
deno
min
ated
40.9
20.0
18.6
21.4
20.1
22.2
24.4
26.3
28.0
33.2
25.4
Cha
nge
in p
ublic
sec
tor
debt
0.3
-21.
6-0
.81.
71.
42.
92.
31.
41.
20.
4-1
.1Id
entif
ied
debt
-cre
atin
g flo
ws
6.6
-23.
02.
43.
14.
84.
02.
11.
61.
30.
4-1
.1P
rim
ary
defic
it4.
65.
05.
33
.71
.14.
16.
45.
03.
53.
33.
24.
22.
60.
82
.1
Rev
enue
and
gra
nts
17.4
18.9
20.1
17.3
20.3
19.9
20.7
20.9
20.9
21.1
22.5
of w
hich
: gra
nts
4.6
5.9
6.5
4.0
7.1
6.4
6.3
5.9
5.6
3.8
2.5
Prim
ary
(non
inte
rest
) ex
pend
iture
21.9
23.9
25.4
21.4
26.7
25.0
24.3
24.2
24.1
23.7
23.3
Aut
omat
ic d
ebt d
ynam
ics
2.1
-5.9
-2.9
-1.0
-1.5
-1.0
-1.4
-1.6
-1.9
-2.2
-1.9
Con
trib
utio
n fr
om in
tere
st r
ate/
grow
th d
iffer
entia
l-3
.6-3
.1-1
.0-1
.3-0
.7-1
.1-1
.4-1
.8-1
.9-2
.1-1
.9of
whi
ch: c
ontr
ibut
ion
from
ave
rage
rea
l int
eres
t rat
e-0
.7-0
.8-0
.2-0
.20.
00.
00.
0-0
.1-0
.10.
0-0
.1of
whi
ch: c
ontr
ibut
ion
from
rea
l GD
P g
row
th-2
.9-2
.3-0
.8-1
.1-0
.7-1
.0-1
.4-1
.7-1
.8-2
.0-1
.8C
ontr
ibut
ion
from
rea
l exc
hang
e ra
te d
epre
ciat
ion
5.7
-2.7
-1.9
0.4
-0.8
0.0
0.0
0.1
0.0
......
Oth
er id
entif
ied
debt
-cre
atin
g flo
ws
0.0
-22.
20.
00.
00.
00.
00.
00.
00.
00.
00.
0P
rivat
izat
ion
rece
ipts
(ne
gativ
e)0.
00.
00.
00.
00.
00.
00.
00.
00.
00.
00.
0R
ecog
nitio
n of
impl
icit
or c
ontin
gent
liab
ilitie
s0.
00.
00.
00.
00.
00.
00.
00.
00.
00.
00.
0D
ebt r
elie
f (H
IPC
and
oth
er)
0.0
-22.
20.
00.
00.
00.
00.
00.
00.
00.
00.
0O
ther
(sp
ecify
, e.g
. ban
k re
capi
taliz
atio
n)0.
00.
00.
00.
00.
00.
00.
00.
00.
00.
00.
0R
esid
ual,
incl
udin
g as
set c
hang
es-6
.31.
4-3
.1-1
.5-3
.4-1
.10.
2-0
.2-0
.1-0
.10.
0
NP
V o
f p
ub
lic s
ect
or
de
bt
23
.21
4.0
15
.51
3.9
18
.42
0.6
22.
72
3.7
24
.72
7.7
28
.6
o/w
for
eign
-cur
renc
y de
nom
inat
ed1
9.7
11
.21
2.0
11
.61
3.4
14
.91
6.8
18
.41
9.9
24
.32
1.9
o/w
ext
erna
l1
9.7
11
.21
2.0
11
.61
3.4
14
.91
6.8
18
.41
9.9
24
.32
1.9
NP
V o
f co
ntin
gent
liab
ilitie
s (n
ot in
clud
ed in
pub
lic s
ecto
r de
bt)
0.0
0.0
0.0
0.0
0.0
0.0
0.0
0.0
0.0
0.0
0.0
Gro
ss fi
na
nci
ng
ne
ed
2/
6.0
6.2
6.6
4.8
7.2
5.8
4.4
4.2
4.1
3.9
2.4
NP
V o
f p
ubl
ic s
ect
or
de
bt-
to-r
eve
nu
e a
nd
gra
nts
ra
tio (
in p
erc
ent)
13
3.6
73
.97
7.0
80
.69
0.7
10
3.3
10
9.3
11
3.5
11
8.1
13
1.3
127
.1N
PV
of
pu
blic
se
cto
r d
eb
t-to
-re
ven
ue
ratio
(in
pe
rce
nt)
18
1.7
107
.31
13
.81
05
.01
39
.31
51
.51
56.
51
58
.41
61
.81
60
.614
3.1
o/w
ext
erna
l 3/
15
4.2
86
.18
8.5
87
.71
01
.21
09
.41
16.
31
23
.11
30
.21
40
.710
9.6
De
bt
serv
ice
-to
-re
ven
ue
an
d g
ran
ts r
atio
(in
pe
rce
nt)
4/
8.2
6.2
6.7
4.0
3.9
4.1
4.1
4.4
4.7
5.9
7.2
De
bt
serv
ice
-to
-re
ven
ue
ra
tio (
in p
erc
en
t) 4
/1
1.2
8.9
9.9
5.2
5.9
6.0
5.8
6.2
6.4
7.3
8.1
Prim
ary
de
ficit
tha
t st
ab
ilize
s th
e d
eb
t-to
-GD
P r
atio
4.3
26
.66
.02
.44
.92
.21.
21
.92
.02
.21
.9
Ke
y m
ac
roec
on
om
ic a
nd
fis
cal
as
su
mp
tio
ns
Re
al G
DP
gro
wth
(in
pe
rce
nt)
7.1
5.5
3.6
5.6
1.9
5.2
3.1
4.2
5.3
6.0
6.0
5.0
6.0
5.9
5.9
Ave
rag
e n
omin
al i
nte
rest
ra
te o
n fo
rex
deb
t (i
n p
erc
en
t)0
.70
.61
.10
.60
.41
.31
.00
.81.
11
.31
.31.
11
.51
.81
.6
Ave
rag
e r
ea
l in
tere
st r
ate
on
dom
est
ic c
urr
ency
deb
t (i
n p
erc
en
t)3
.95
.13
.9-0
.35
.2-2
.75
.31
.91.
10
.91
.01.
21
.2-1
.20
.2
Re
al e
xch
ang
e r
ate
de
pre
cia
tion
(in
pe
rce
nt,
+ in
dic
ate
s d
epre
cia
tion
)1
6.1
-7.3
-10
.0-2
.61
2.5
2.2
...
...
...
...
...
......
......
Infla
tion
ra
te (
GD
P d
efla
tor,
in p
erc
en
t)0
.6-0
.13
.62
.82
.97
.02
.02
.02.
02
.02
.02.
82
.02
.02
.0
Gro
wth
of
rea
l prim
ary
sp
end
ing
(d
efla
ted
by
GD
P d
efla
tor,
in p
erc
en
t)1
0.8
15
.09
.97
.46
.8-1
1.3
28
.6-2
.52.
45
.65
.64.
75
.55
.95
.7
Gra
nt
ele
me
nt o
f n
ew
ext
ern
al b
orr
ow
ing
(in
pe
rce
nt)
0.0
0.0
0.0
0.0
0.0
47
.75
1.5
44
.04
1.9
41
.94
1.2
44.
74
0.8
40
.0...
Sou
rce
s: C
ou
ntry
au
thor
itie
s; a
nd
Fu
nd
sta
ff e
stim
ate
s an
d p
roje
ctio
ns.
1/
Ce
ntr
al g
ove
rnm
en
t.
2/
Gro
ss f
inan
cin
g n
ee
d is
de
fine
d a
s th
e p
rima
ry d
efic
it p
lus
deb
t se
rvic
e p
lus
the
sto
ck o
f sh
ort
-te
rm d
eb
t a
t th
e e
nd
of
the
last
pe
riod
.
3/
Re
ven
ues
exc
lud
ing
gra
nts.
4/
De
bt
serv
ice
is d
efin
ed
as
the
su
m o
f in
tere
st a
nd
am
ort
iza
tion
of
me
diu
m a
nd
lon
g-t
erm
de
bt.
5/
His
toric
al a
vera
ges
an
d s
tan
da
rd d
evi
atio
ns
are
ge
ne
rally
de
rive
d o
ver
the
pa
st 1
0 y
ears
, su
bje
ct t
o d
ata
ava
ilabi
lity.
Ap
pen
dix
II―
Tab
le 3
: P
ub
lic
Sec
tor
Deb
t S
ust
ain
abil
ity
Fra
mew
ork
, B
asel
ine
Sce
nar
io,
2005
-28
(In
perc
ent o
f G
DP
, unl
ess
othe
rwis
e in
dica
ted)
Ac
tua
l P
roje
cti
on
s
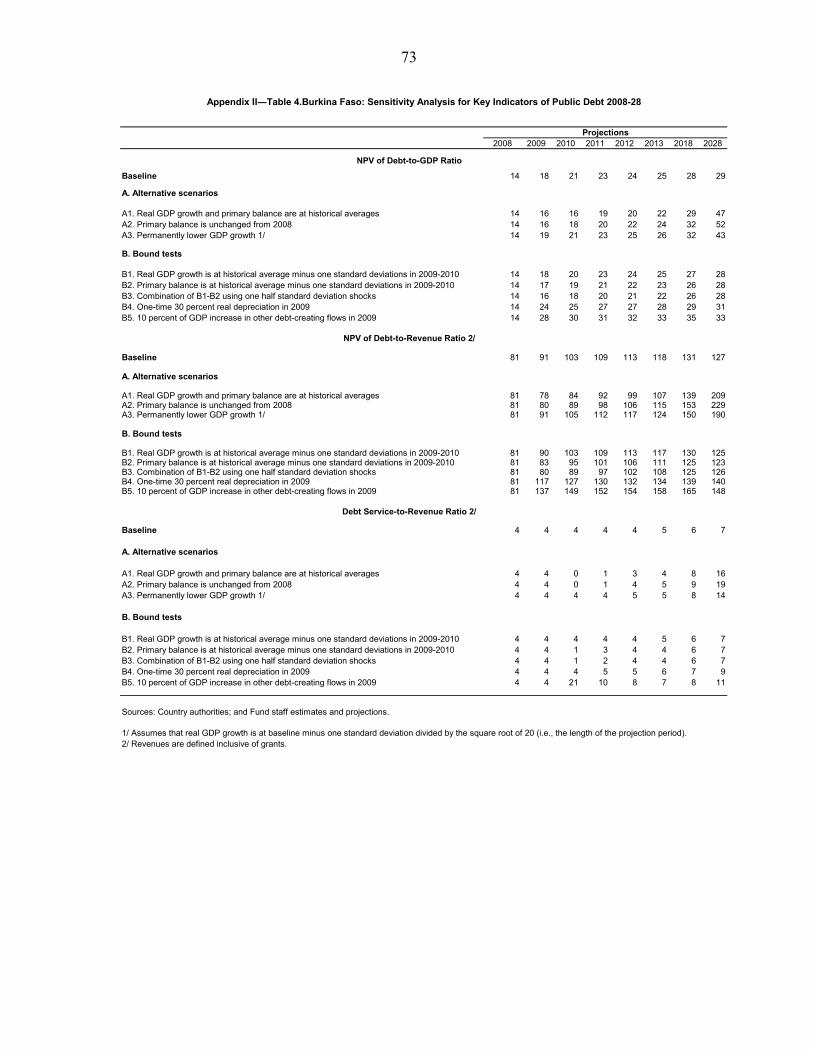
73
2008 2009 2010 2011 2012 2013 2018 2028
Baseline 14 18 21 23 24 25 28 29
A. Alternative scenarios
A1. Real GDP growth and primary balance are at historical averages 14 16 16 19 20 22 29 47A2. Primary balance is unchanged from 2008 14 16 18 20 22 24 32 52A3. Permanently lower GDP growth 1/ 14 19 21 23 25 26 32 43
B. Bound tests
B1. Real GDP growth is at historical average minus one standard deviations in 2009-2010 14 18 20 23 24 25 27 28B2. Primary balance is at historical average minus one standard deviations in 2009-2010 14 17 19 21 22 23 26 28B3. Combination of B1-B2 using one half standard deviation shocks 14 16 18 20 21 22 26 28B4. One-time 30 percent real depreciation in 2009 14 24 25 27 27 28 29 31B5. 10 percent of GDP increase in other debt-creating flows in 2009 14 28 30 31 32 33 35 33
Baseline 81 91 103 109 113 118 131 127
A. Alternative scenarios
A1. Real GDP growth and primary balance are at historical averages 81 78 84 92 99 107 139 209A2. Primary balance is unchanged from 2008 81 80 89 98 106 115 153 229A3. Permanently lower GDP growth 1/ 81 91 105 112 117 124 150 190
B. Bound tests
B1. Real GDP growth is at historical average minus one standard deviations in 2009-2010 81 90 103 109 113 117 130 125B2. Primary balance is at historical average minus one standard deviations in 2009-2010 81 83 95 101 106 111 125 123B3. Combination of B1-B2 using one half standard deviation shocks 81 80 89 97 102 108 125 126B4. One-time 30 percent real depreciation in 2009 81 117 127 130 132 134 139 140B5. 10 percent of GDP increase in other debt-creating flows in 2009 81 137 149 152 154 158 165 148
Baseline 4 4 4 4 4 5 6 7
A. Alternative scenarios
A1. Real GDP growth and primary balance are at historical averages 4 4 0 1 3 4 8 16A2. Primary balance is unchanged from 2008 4 4 0 1 4 5 9 19A3. Permanently lower GDP growth 1/ 4 4 4 4 5 5 8 14
B. Bound tests
B1. Real GDP growth is at historical average minus one standard deviations in 2009-2010 4 4 4 4 4 5 6 7B2. Primary balance is at historical average minus one standard deviations in 2009-2010 4 4 1 3 4 4 6 7B3. Combination of B1-B2 using one half standard deviation shocks 4 4 1 2 4 4 6 7B4. One-time 30 percent real depreciation in 2009 4 4 4 5 5 6 7 9B5. 10 percent of GDP increase in other debt-creating flows in 2009 4 4 21 10 8 7 8 11
Sources: Country authorities; and Fund staff estimates and projections.
2/ Revenues are defined inclusive of grants.1/ Assumes that real GDP growth is at baseline minus one standard deviation divided by the square root of 20 (i.e., the length of the projection period).
Appendix II―Table 4.Burkina Faso: Sensitivity Analysis for Key Indicators of Public Debt 2008-28
NPV of Debt-to-Revenue Ratio 2/
NPV of Debt-to-GDP Ratio
Debt Service-to-Revenue Ratio 2/
Projections
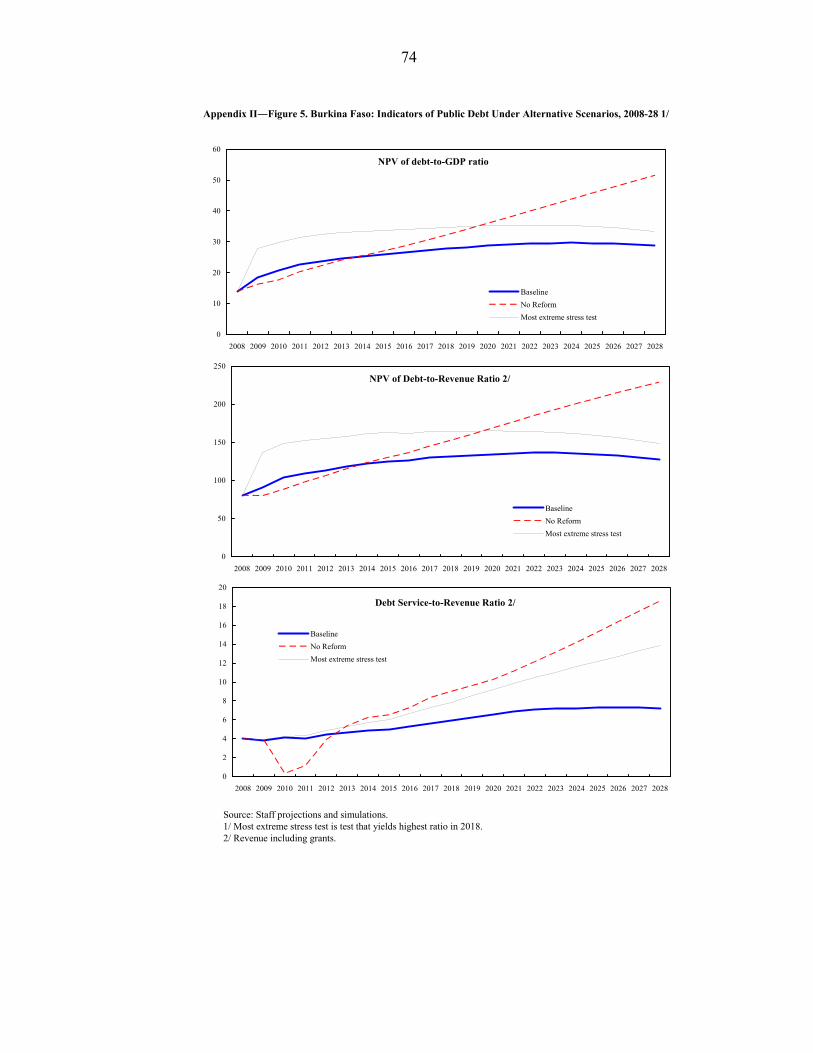
74
Appendix II―Figure 5. Burkina Faso: Indicators of Public Debt Under Alternative Scenarios, 2008-28 1/
Source: Staff projections and simulations.1/ Most extreme stress test is test that yields highest ratio in 2018.2/ Revenue including grants.
NPV of debt-to-GDP ratio
0
10
20
30
40
50
60
2008 2009 2010 2011 2012 2013 2014 2015 2016 2017 2018 2019 2020 2021 2022 2023 2024 2025 2026 2027 2028
Baseline
No Reform
Most extreme stress test
NPV of Debt-to-Revenue Ratio 2/
0
50
100
150
200
250
2008 2009 2010 2011 2012 2013 2014 2015 2016 2017 2018 2019 2020 2021 2022 2023 2024 2025 2026 2027 2028
Baseline
No Reform
Most extreme stress test
Debt Service-to-Revenue Ratio 2/
0
2
4
6
8
10
12
14
16
18
20
2008 2009 2010 2011 2012 2013 2014 2015 2016 2017 2018 2019 2020 2021 2022 2023 2024 2025 2026 2027 2028
Baseline
No Reform
Most extreme stress test
INTERNATIONAL MONETARY FUND
BURKINA FASO
Staff Report for the 2009 Article IV Consultation and Fifth Review Under the Three-Year Arrangement Under the Poverty Reduction and Growth Facility, and Requests for Augmentation of Access and Modification of Performance Criteria—
Informational Annex
Prepared by the African Department (In collaboration with other departments)
Approved by Mark Plant and Dominique Desruelle
November 30, 2009
Relations with the Fund. Describes financial and technical assistance from the Fund and provides information on the safeguards assessment and exchange rate system. Outstanding purchases and loans amounted to SDR 36.26 million (60.24 percent of quota) at end-September 2009.
JMAP Implementation. Describes Bank-Fund collaboration.
Statistical Issues. Assesses the quality of statistical data. Weaknesses in a broad range of economic statistics are hampering the analyses of economic developments in the country.
2
Contents Page
I. Relations with the Fund ...........................................................................................3 II. JMAP Implementation ...........................................................................................13 III. Statistical Issues .....................................................................................................14
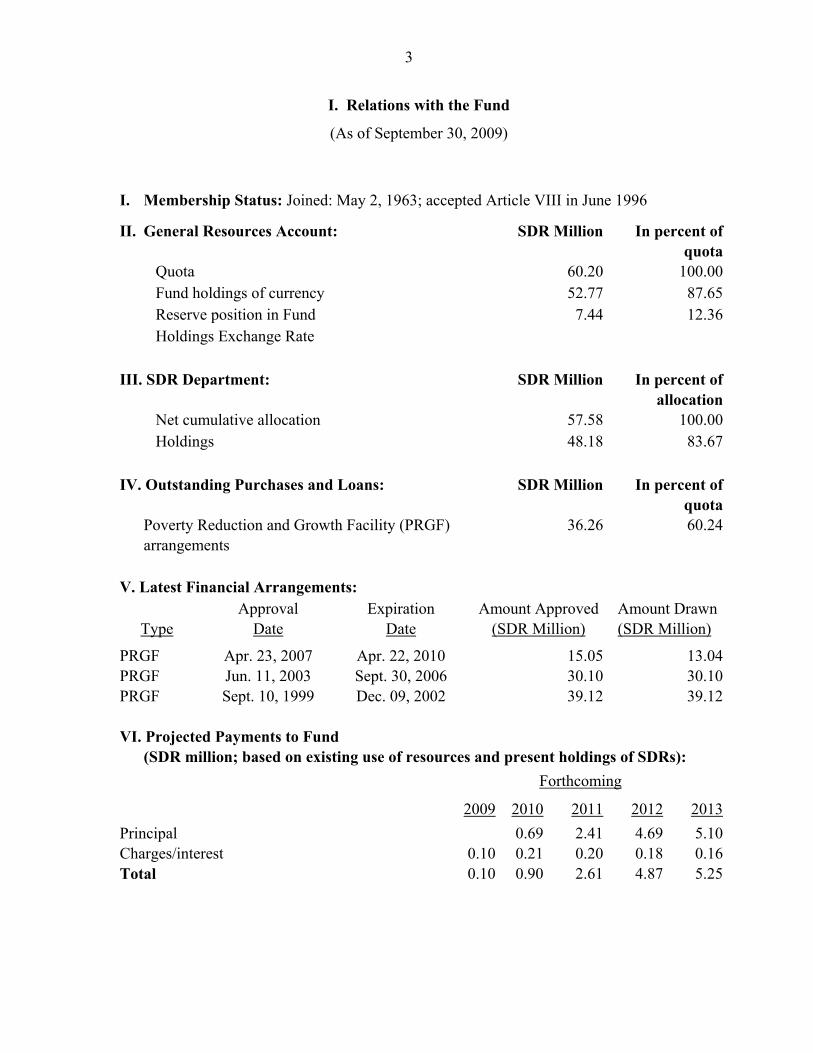
3
I. Relations with the Fund
(As of September 30, 2009)
I. Membership Status: Joined: May 2, 1963; accepted Article VIII in June 1996
II. General Resources Account: SDR Million In percent of quota
Quota 60.20 100.00 Fund holdings of currency 52.77 87.65 Reserve position in Fund 7.44 12.36 Holdings Exchange Rate III. SDR Department: SDR Million In percent of
allocation Net cumulative allocation 57.58 100.00 Holdings 48.18 83.67 IV. Outstanding Purchases and Loans: SDR Million In percent of
quota Poverty Reduction and Growth Facility (PRGF)
arrangements 36.26 60.24
V. Latest Financial Arrangements:
Type Approval
Date Expiration
Date Amount Approved
(SDR Million) Amount Drawn (SDR Million)
PRGF Apr. 23, 2007 Apr. 22, 2010 15.05 13.04PRGF Jun. 11, 2003 Sept. 30, 2006 30.10 30.10PRGF Sept. 10, 1999 Dec. 09, 2002 39.12 39.12 VI. Projected Payments to Fund (SDR million; based on existing use of resources and present holdings of SDRs): Forthcoming
2009 2010 2011 2012 2013
Principal 0.69 2.41 4.69 5.10Charges/interest 0.10 0.21 0.20 0.18 0.16Total 0.10 0.90 2.61 4.87 5.25
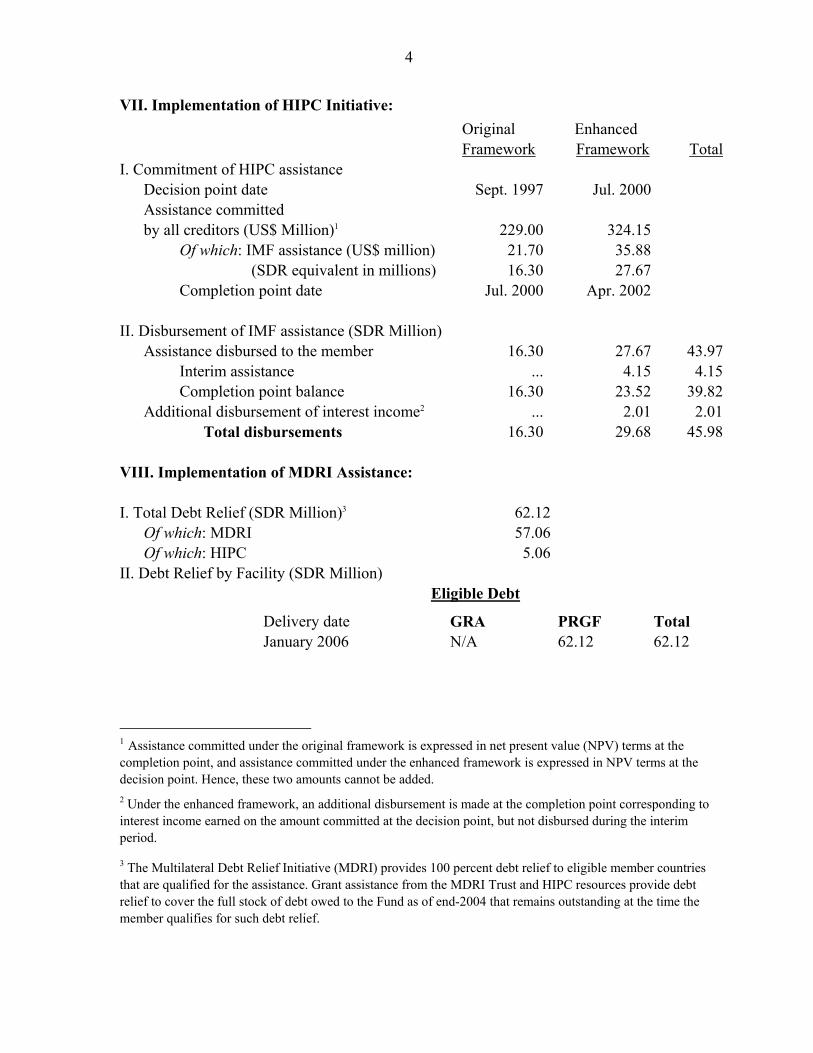
4
VII. Implementation of HIPC Initiative:
Original Framework
Enhanced Framework
Total
I. Commitment of HIPC assistance Decision point date Sept. 1997 Jul. 2000 Assistance committed by all creditors (US$ Million)1 229.00 324.15 Of which: IMF assistance (US$ million) 21.70 35.88
(SDR equivalent in millions) 16.30 27.67 Completion point date Jul. 2000 Apr. 2002 II. Disbursement of IMF assistance (SDR Million) Assistance disbursed to the member 16.30 27.67 43.97
Interim assistance ... 4.15 4.15 Completion point balance 16.30 23.52 39.82 Additional disbursement of interest income2 ... 2.01 2.01 Total disbursements 16.30 29.68 45.98 VIII. Implementation of MDRI Assistance: I. Total Debt Relief (SDR Million)3 62.12 Of which: MDRI 57.06 Of which: HIPC 5.06 II. Debt Relief by Facility (SDR Million) Eligible Debt
Delivery date GRA PRGF Total January 2006 N/A 62.12 62.12
1 Assistance committed under the original framework is expressed in net present value (NPV) terms at the completion point, and assistance committed under the enhanced framework is expressed in NPV terms at the decision point. Hence, these two amounts cannot be added. 2 Under the enhanced framework, an additional disbursement is made at the completion point corresponding to interest income earned on the amount committed at the decision point, but not disbursed during the interim period.
3 The Multilateral Debt Relief Initiative (MDRI) provides 100 percent debt relief to eligible member countries that are qualified for the assistance. Grant assistance from the MDRI Trust and HIPC resources provide debt relief to cover the full stock of debt owed to the Fund as of end-2004 that remains outstanding at the time the member qualifies for such debt relief.
5
IX. Safeguards Assessments:
The Central Bank of West African States (BCEAO) is the common central bank of the countries of the West African Economic and Monetary Union, which includes Burkina Faso. The most recent safeguards assessment of the BCEAO was completed on November 4, 2005. The assessment indicated progress has been made in strengthening the bank's safeguards framework since the 2002 assessment and identified some areas where further steps would help solidify it. The BCEAO now publishes a full set of audited financial statements and improvements have been made to move financial reporting closer to International Financial Reporting Standards (IFRS). Furthermore, an internal audit charter has been put in place, mechanisms for improving risk management have been established, and follow-up on internal and external audit recommendations has been strengthened. The results of continuous safeguards monitoring indicate that while certain vulnerabilities remain in internal control systems and legal structure, there has been some progress in other areas, including through: (i) improving the external audit process by adopting a multi-year audit program; (ii) establishing an audit committee; (iii) expanding disclosures on financial positions of WAEMU countries with the Fund in the notes to the annual financial statements; and (iv) further strengthening of the effectiveness of the internal audit function.
X. Exchange Rate Arrangement:
Burkina Faso is a member of the West African Economic and Monetary Union (WAEMU) and has no separate legal tender. The union’s common currency, the CFA franc, is pegged to the euro at a rate of CFAF 655.957 = EUR 1, consistent with the official conversions rate of the French franc to the Euro and the previous fixed rate of the CFA franc to the French franc of CFAF 100= F 1. On November 10, 2009, the rate of the CFA franc in terms of SDR was CFAF 702.03 = SDR 1.0. Effective January 1, 2007, the exchange arrangement of the WAEMU countries has been reclassified to the category of conventional pegged arrangement from the category of exchange arrangement with no separate legal tender. The new classification is based on the behavior of the common currency, whereas the previous classification was based on the lack of a separate legal tender. The new classification thus only reflects a definitional change, and is not based on a judgment that there has been a substantive change in the exchange regime or other policies of the currency union or its member. The exchange system is free of restrictions on the making of payments and transfers on current international transactions. XI. Article IV Consultations:
The periodicity of Burkina Faso’s Article IV consultation is set in accordance with the July 15, 2002 Executive Board Decision on consultation cycles. Discussions on the 2007
6
Article IV consultation and first review under the Poverty Reduction and Growth Facility (PRGF) were held during the period September 19–October 4, 2007 in Ouagadougou. The staff report and the Selected Issues and Informational Annex were considered by the Executive Board on January 9, 2008. The next article IV consultation is scheduled for September 2011.
XII. ROSC/AAP:
An FAD mission visited Ouagadougou during May 7–18, 2001 to assist the authorities undertake a draft fiscal module of a Report on the Observance of Standards and Codes (ROSC). The final report, which was issued in July 2002, found that Burkina Faso was making good progress in a number of areas to increase the transparency and accountability of government. Additional efforts are needed to bring a number of improvements to the point of implementation, particularly with regard to expenditure tracking at the local level and external audit functions. Initial discussions indicated that the authorities broadly concurred with the mission assessment. On July 31, 2002, the authorities formally adopted an action plan based on the recommendations of the final ROSC.
An STA mission during May 8–21, 2003 assisted the authorities in preparing a data ROSC. The report was published in March 2004. The mission found that most of the methodologies used in the compilation of macroeconomic statistics are in broad conformity with internationally accepted guidelines. However, most datasets are affected by limited or impaired source data arising from irregularity in the conduct of surveys (national accounts), use of outdated weights (CPI), or low response rate to surveys (balance of payments). For CPI and government finance statistics, data dissemination meets the SDDS requirement, but for other macroeconomic datasets, timeliness falls short of GDDS recommendations. The authorities broadly concurred with the main findings of the mission as well as the recommendations made to address them.
The team, jointly with World Bank staff, also discussed a HIPC Initiative Assessment and Action Plan (AAP) with the authorities. The aim was to assess the capacity of the public expenditure management system to track poverty-reducing public expenditures under the HIPC Initiative and the need for technical assistance to enhance that capacity. The mission secured the officials’ approval of the jointly prepared preliminary assessment; identified the main needs for technical assistance on upgrading the capacity to track such expenditures; and drew up a draft outline action plan. This plan identifies the main needs for further technical assistance to improve tracking of poverty-reducing expenditures. The AAP has been endorsed by the authorities.
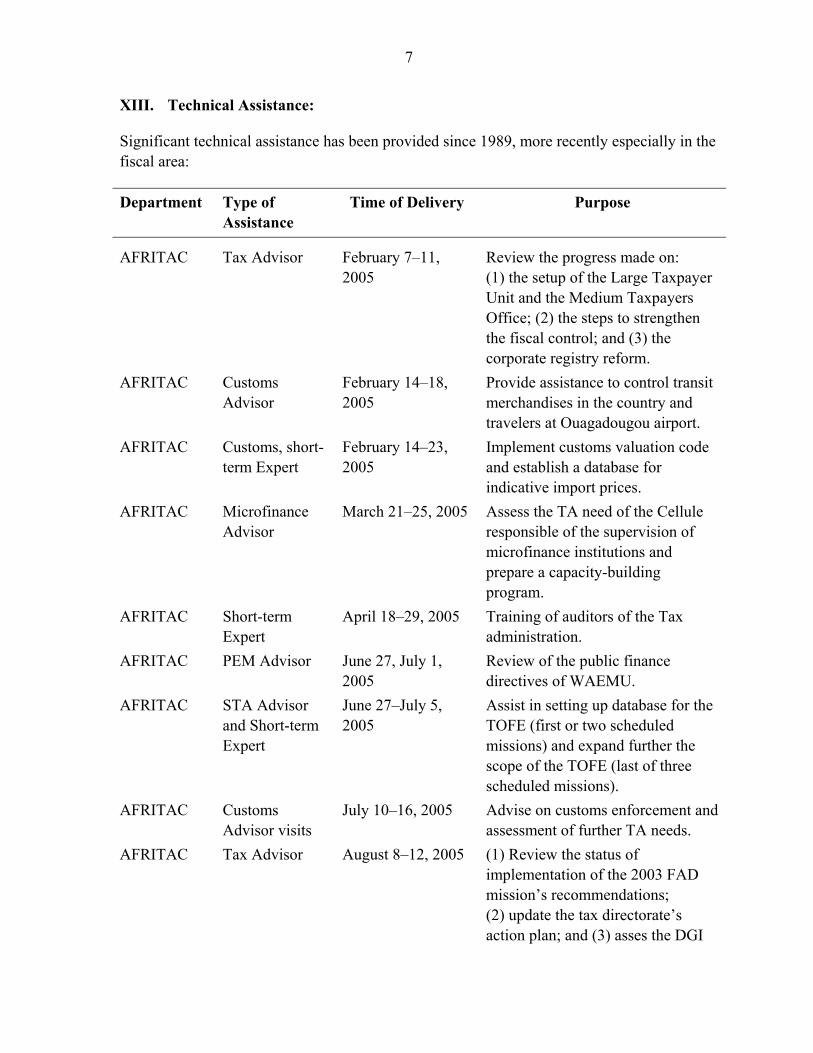
7
XIII. Technical Assistance:
Significant technical assistance has been provided since 1989, more recently especially in the fiscal area:
Department Type of Assistance
Time of Delivery Purpose
AFRITAC Tax Advisor February 7–11, 2005
Review the progress made on: (1) the setup of the Large Taxpayer Unit and the Medium Taxpayers Office; (2) the steps to strengthen the fiscal control; and (3) the corporate registry reform.
AFRITAC Customs Advisor
February 14–18, 2005
Provide assistance to control transit merchandises in the country and travelers at Ouagadougou airport.
AFRITAC
Customs, short-term Expert
February 14–23, 2005
Implement customs valuation code and establish a database for indicative import prices.
AFRITAC Microfinance Advisor
March 21–25, 2005 Assess the TA need of the Cellule responsible of the supervision of microfinance institutions and prepare a capacity-building program.
AFRITAC Short-term Expert
April 18–29, 2005 Training of auditors of the Tax administration.
AFRITAC
PEM Advisor June 27, July 1, 2005
Review of the public finance directives of WAEMU.
AFRITAC STA Advisor and Short-term Expert
June 27–July 5, 2005
Assist in setting up database for the TOFE (first or two scheduled missions) and expand further the scope of the TOFE (last of three scheduled missions).
AFRITAC Customs Advisor visits
July 10–16, 2005 Advise on customs enforcement and assessment of further TA needs.
AFRITAC Tax Advisor August 8–12, 2005 (1) Review the status of implementation of the 2003 FAD mission’s recommendations; (2) update the tax directorate’s action plan; and (3) asses the DGI
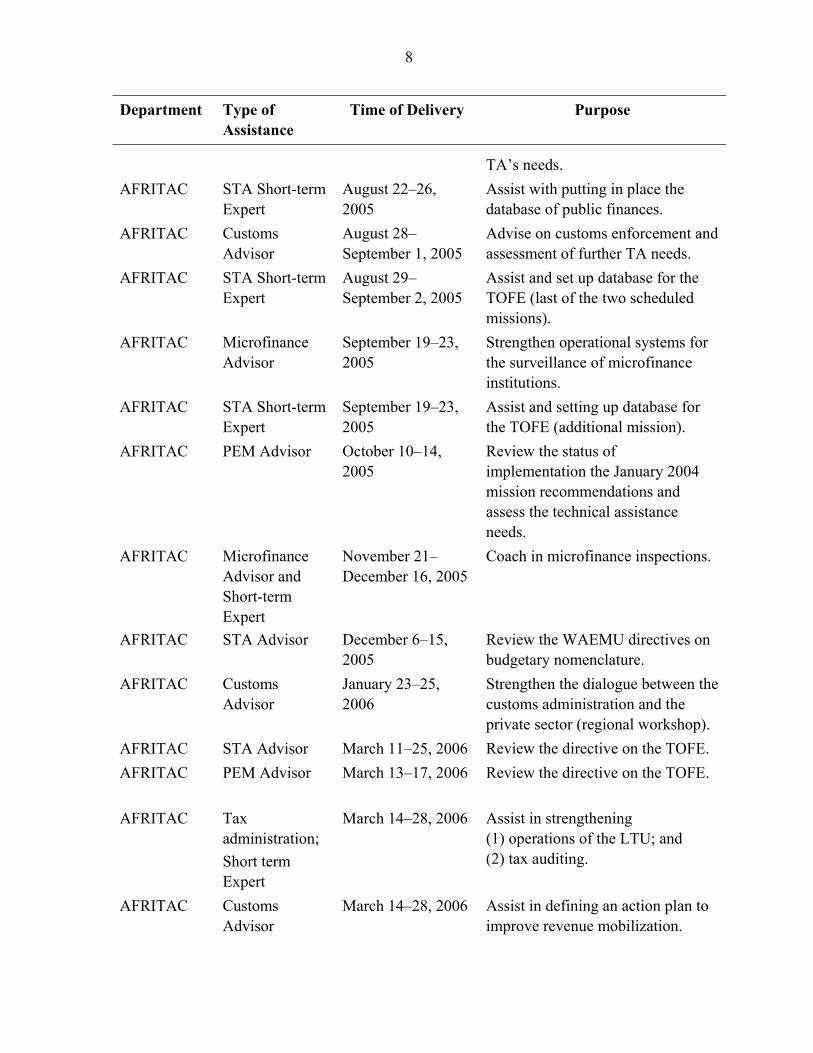
8
Department Type of Assistance
Time of Delivery Purpose
TA’s needs.
AFRITAC STA Short-term Expert
August 22–26, 2005
Assist with putting in place the database of public finances.
AFRITAC Customs Advisor
August 28–September 1, 2005
Advise on customs enforcement and assessment of further TA needs.
AFRITAC STA Short-term Expert
August 29–September 2, 2005
Assist and set up database for the TOFE (last of the two scheduled missions).
AFRITAC Microfinance Advisor
September 19–23, 2005
Strengthen operational systems for the surveillance of microfinance institutions.
AFRITAC STA Short-term Expert
September 19–23, 2005
Assist and setting up database for the TOFE (additional mission).
AFRITAC
PEM Advisor October 10–14, 2005
Review the status of implementation the January 2004 mission recommendations and assess the technical assistance needs.
AFRITAC Microfinance Advisor and Short-term Expert
November 21–December 16, 2005
Coach in microfinance inspections.
AFRITAC STA Advisor December 6–15, 2005
Review the WAEMU directives on budgetary nomenclature.
AFRITAC Customs Advisor
January 23–25, 2006
Strengthen the dialogue between the customs administration and the private sector (regional workshop).
AFRITAC STA Advisor March 11–25, 2006 Review the directive on the TOFE.
AFRITAC
PEM Advisor March 13–17, 2006 Review the directive on the TOFE.
AFRITAC Tax administration;
Short term Expert
March 14–28, 2006 Assist in strengthening (1) operations of the LTU; and (2) tax auditing.
AFRITAC Customs Advisor
March 14–28, 2006 Assist in defining an action plan to improve revenue mobilization.
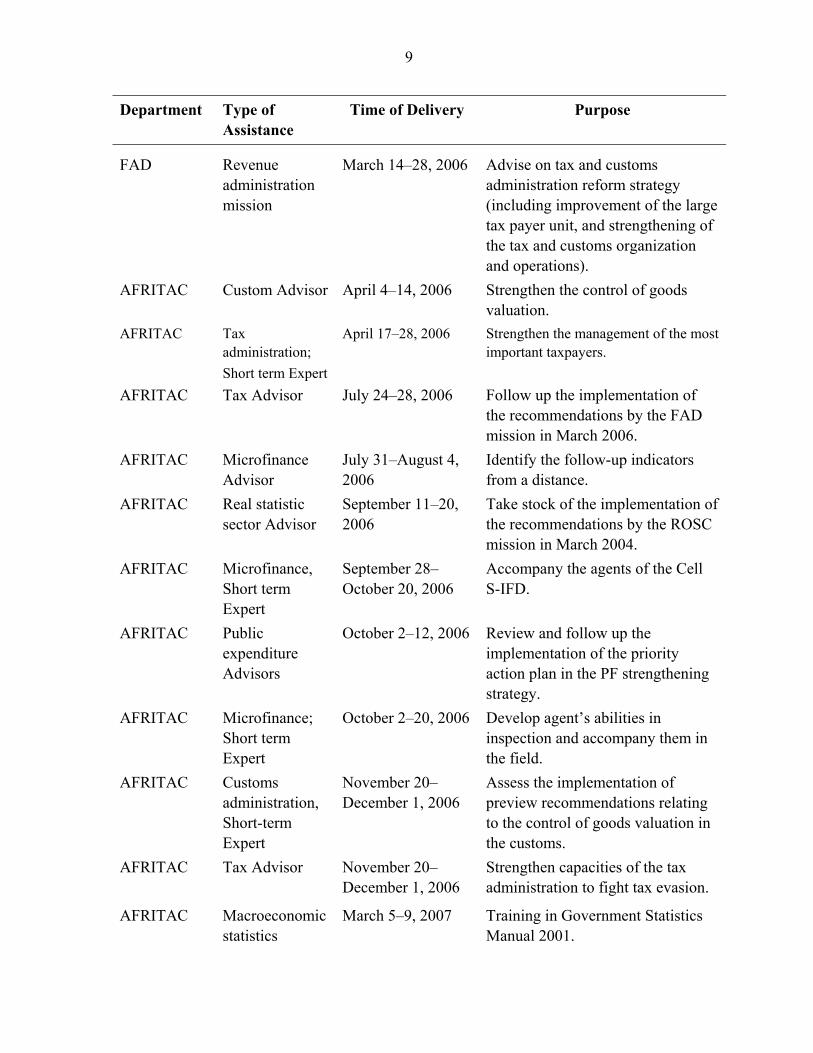
9
Department Type of Assistance
Time of Delivery Purpose
FAD Revenue administration mission
March 14–28, 2006 Advise on tax and customs administration reform strategy (including improvement of the large tax payer unit, and strengthening of the tax and customs organization and operations).
AFRITAC Custom Advisor April 4–14, 2006 Strengthen the control of goods valuation.
AFRITAC Tax administration;
Short term Expert
April 17–28, 2006 Strengthen the management of the most important taxpayers.
AFRITAC Tax Advisor July 24–28, 2006 Follow up the implementation of the recommendations by the FAD mission in March 2006.
AFRITAC Microfinance Advisor
July 31–August 4, 2006
Identify the follow-up indicators from a distance.
AFRITAC Real statistic sector Advisor
September 11–20, 2006
Take stock of the implementation of the recommendations by the ROSC mission in March 2004.
AFRITAC Microfinance, Short term Expert
September 28–October 20, 2006
Accompany the agents of the Cell S-IFD.
AFRITAC Public expenditure Advisors
October 2–12, 2006 Review and follow up the implementation of the priority action plan in the PF strengthening strategy.
AFRITAC Microfinance; Short term Expert
October 2–20, 2006 Develop agent’s abilities in inspection and accompany them in the field.
AFRITAC Customs administration, Short-term Expert
November 20–December 1, 2006
Assess the implementation of preview recommendations relating to the control of goods valuation in the customs.
AFRITAC
Tax Advisor November 20–December 1, 2006
Strengthen capacities of the tax administration to fight tax evasion.
AFRITAC Macroeconomic statistics
March 5–9, 2007 Training in Government Statistics Manual 2001.
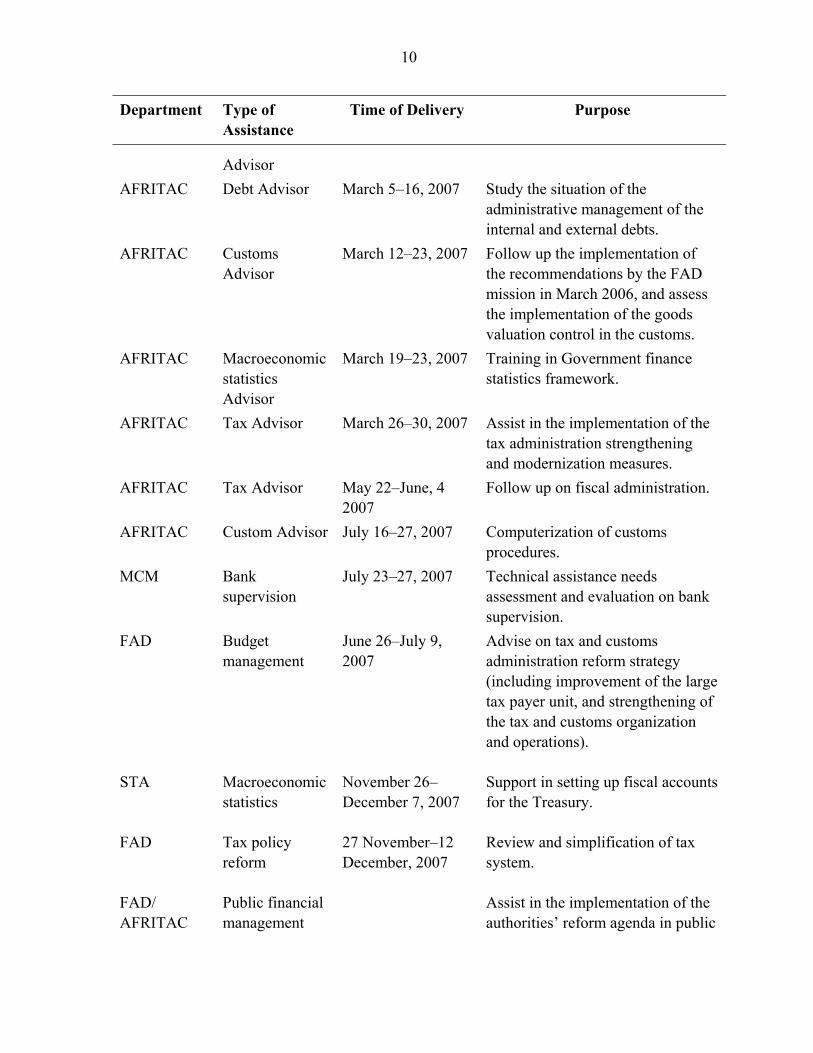
10
Department Type of Assistance
Time of Delivery Purpose
Advisor
AFRITAC Debt Advisor March 5–16, 2007 Study the situation of the administrative management of the internal and external debts.
AFRITAC Customs Advisor
March 12–23, 2007 Follow up the implementation of the recommendations by the FAD mission in March 2006, and assess the implementation of the goods valuation control in the customs.
AFRITAC Macroeconomic statistics Advisor
March 19–23, 2007 Training in Government finance statistics framework.
AFRITAC Tax Advisor March 26–30, 2007 Assist in the implementation of the tax administration strengthening and modernization measures.
AFRITAC Tax Advisor May 22–June, 4 2007
Follow up on fiscal administration.
AFRITAC Custom Advisor July 16–27, 2007 Computerization of customs procedures.
MCM Bank supervision
July 23–27, 2007 Technical assistance needs assessment and evaluation on bank supervision.
FAD Budget management
June 26–July 9, 2007
Advise on tax and customs administration reform strategy (including improvement of the large tax payer unit, and strengthening of the tax and customs organization and operations).
STA Macroeconomic statistics
November 26–December 7, 2007
Support in setting up fiscal accounts for the Treasury.
FAD Tax policy reform
27 November–12 December, 2007
Review and simplification of tax system.
FAD/ AFRITAC
Public financial management
Assist in the implementation of the authorities’ reform agenda in public
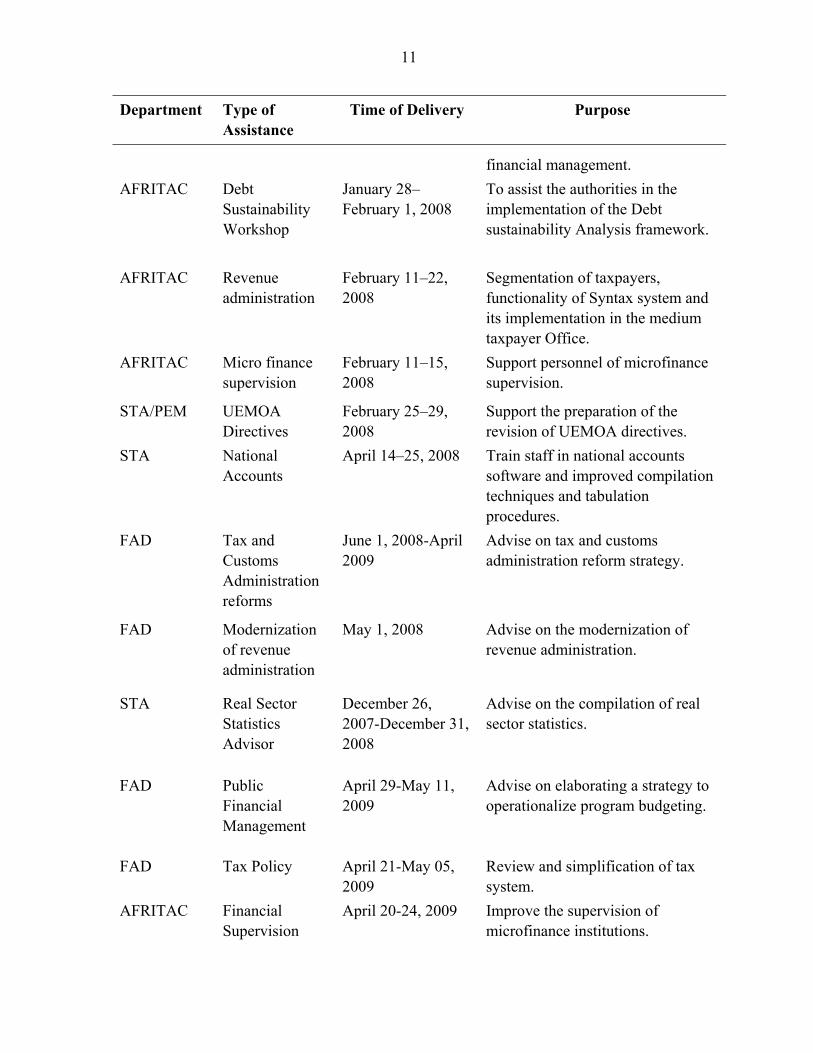
11
Department Type of Assistance
Time of Delivery Purpose
financial management.
AFRITAC Debt Sustainability Workshop
January 28–February 1, 2008
To assist the authorities in the implementation of the Debt sustainability Analysis framework.
AFRITAC Revenue administration
February 11–22, 2008
Segmentation of taxpayers, functionality of Syntax system and its implementation in the medium taxpayer Office.
AFRITAC Micro finance supervision
February 11–15, 2008
Support personnel of microfinance supervision.
STA/PEM UEMOA Directives
February 25–29, 2008
Support the preparation of the revision of UEMOA directives.
STA National Accounts
April 14–25, 2008 Train staff in national accounts software and improved compilation techniques and tabulation procedures.
FAD Tax and Customs Administration reforms
June 1, 2008-April 2009
Advise on tax and customs administration reform strategy.
FAD Modernization of revenue administration
May 1, 2008
Advise on the modernization of revenue administration.
STA Real Sector Statistics Advisor
December 26, 2007-December 31, 2008
Advise on the compilation of real sector statistics.
FAD Public Financial Management
April 29-May 11, 2009
Advise on elaborating a strategy to operationalize program budgeting.
FAD Tax Policy
April 21-May 05, 2009
Review and simplification of tax system.
AFRITAC Financial Supervision
April 20-24, 2009 Improve the supervision of microfinance institutions.
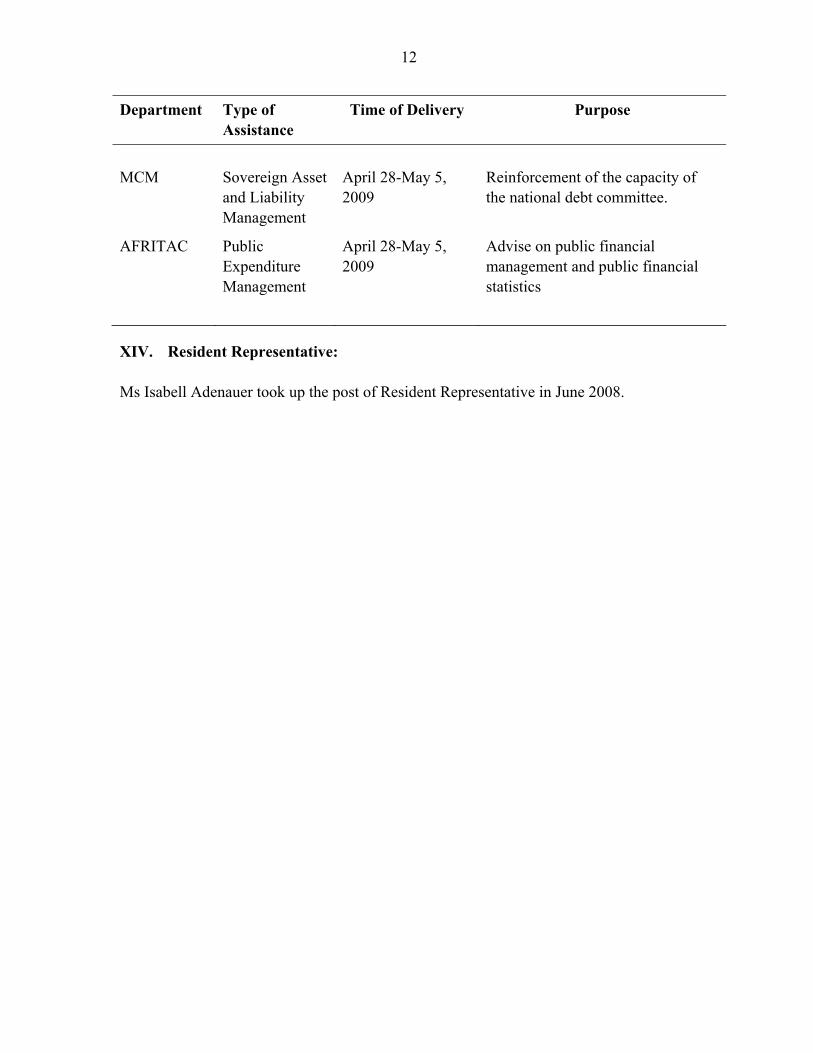
12
Department Type of Assistance
Time of Delivery Purpose
MCM Sovereign Asset and Liability Management
April 28-May 5, 2009
Reinforcement of the capacity of the national debt committee.
AFRITAC Public Expenditure Management
April 28-May 5, 2009
Advise on public financial management and public financial statistics
XIV. Resident Representative: Ms Isabell Adenauer took up the post of Resident Representative in June 2008.
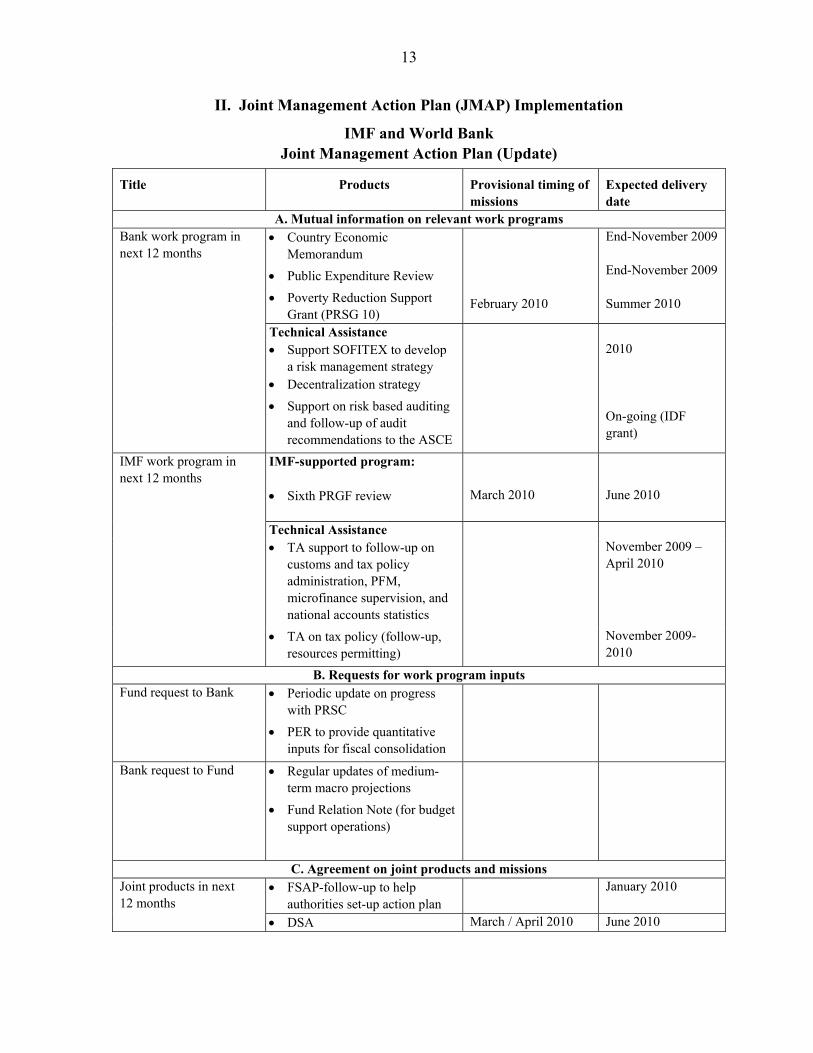
13
II. Joint Management Action Plan (JMAP) Implementation
IMF and World Bank Joint Management Action Plan (Update)
Title Products Provisional timing of missions
Expected delivery date
A. Mutual information on relevant work programs Bank work program in next 12 months
Country Economic Memorandum
Public Expenditure Review
Poverty Reduction Support Grant (PRSG 10)
February 2010
End-November 2009 End-November 2009 Summer 2010
Technical Assistance Support SOFITEX to develop
a risk management strategy Decentralization strategy
Support on risk based auditing and follow-up of audit recommendations to the ASCE
2010 On-going (IDF grant)
IMF work program in next 12 months
IMF-supported program:
Sixth PRGF review March 2010 June 2010
Technical Assistance TA support to follow-up on
customs and tax policy administration, PFM, microfinance supervision, and national accounts statistics
November 2009 – April 2010
TA on tax policy (follow-up, resources permitting)
November 2009-2010
B. Requests for work program inputs Fund request to Bank Periodic update on progress
with PRSC
PER to provide quantitative inputs for fiscal consolidation
Bank request to Fund Regular updates of medium-term macro projections
Fund Relation Note (for budget support operations)
C. Agreement on joint products and missions Joint products in next 12 months
FSAP-follow-up to help authorities set-up action plan
January 2010
DSA March / April 2010 June 2010
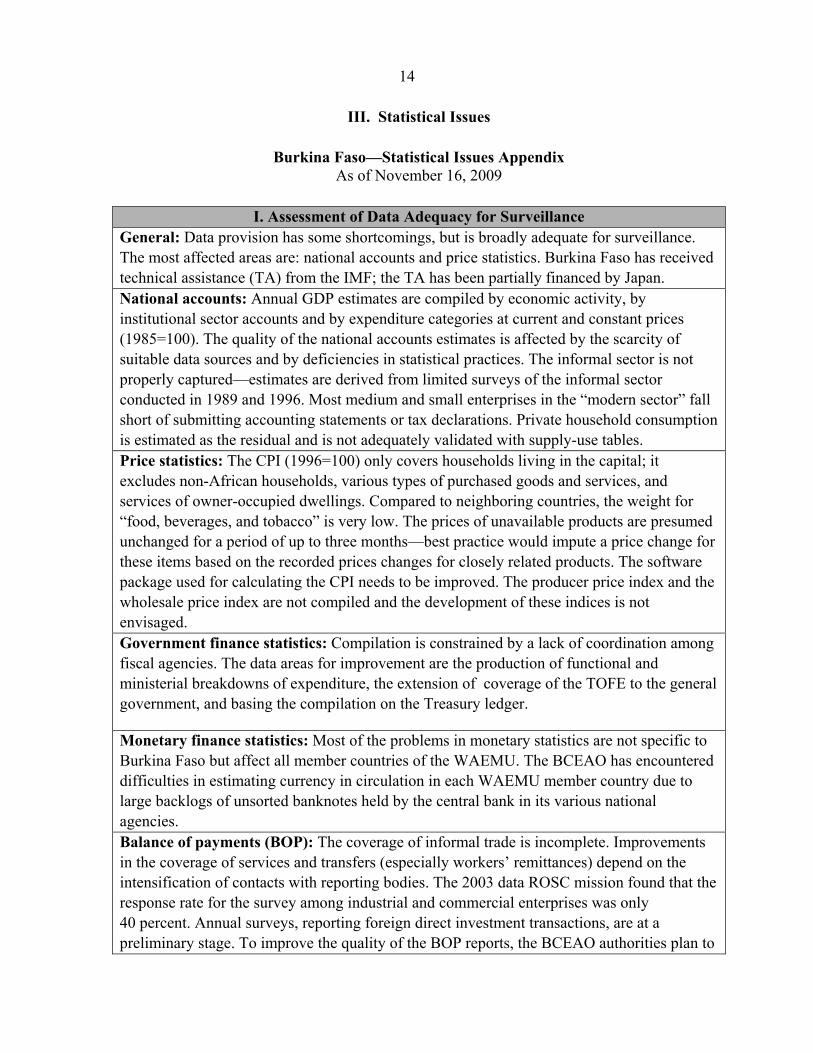
14
III. Statistical Issues
Burkina Faso—Statistical Issues Appendix As of November 16, 2009
I. Assessment of Data Adequacy for Surveillance
General: Data provision has some shortcomings, but is broadly adequate for surveillance. The most affected areas are: national accounts and price statistics. Burkina Faso has received technical assistance (TA) from the IMF; the TA has been partially financed by Japan. National accounts: Annual GDP estimates are compiled by economic activity, by institutional sector accounts and by expenditure categories at current and constant prices (1985=100). The quality of the national accounts estimates is affected by the scarcity of suitable data sources and by deficiencies in statistical practices. The informal sector is not properly captured—estimates are derived from limited surveys of the informal sector conducted in 1989 and 1996. Most medium and small enterprises in the “modern sector” fall short of submitting accounting statements or tax declarations. Private household consumption is estimated as the residual and is not adequately validated with supply-use tables. Price statistics: The CPI (1996=100) only covers households living in the capital; it excludes non-African households, various types of purchased goods and services, and services of owner-occupied dwellings. Compared to neighboring countries, the weight for “food, beverages, and tobacco” is very low. The prices of unavailable products are presumed unchanged for a period of up to three months—best practice would impute a price change for these items based on the recorded prices changes for closely related products. The software package used for calculating the CPI needs to be improved. The producer price index and the wholesale price index are not compiled and the development of these indices is not envisaged. Government finance statistics: Compilation is constrained by a lack of coordination among fiscal agencies. The data areas for improvement are the production of functional and ministerial breakdowns of expenditure, the extension of coverage of the TOFE to the general government, and basing the compilation on the Treasury ledger.
Monetary finance statistics: Most of the problems in monetary statistics are not specific to Burkina Faso but affect all member countries of the WAEMU. The BCEAO has encountered difficulties in estimating currency in circulation in each WAEMU member country due to large backlogs of unsorted banknotes held by the central bank in its various national agencies. Balance of payments (BOP): The coverage of informal trade is incomplete. Improvements in the coverage of services and transfers (especially workers’ remittances) depend on the intensification of contacts with reporting bodies. The 2003 data ROSC mission found that the response rate for the survey among industrial and commercial enterprises was only 40 percent. Annual surveys, reporting foreign direct investment transactions, are at a preliminary stage. To improve the quality of the BOP reports, the BCEAO authorities plan to
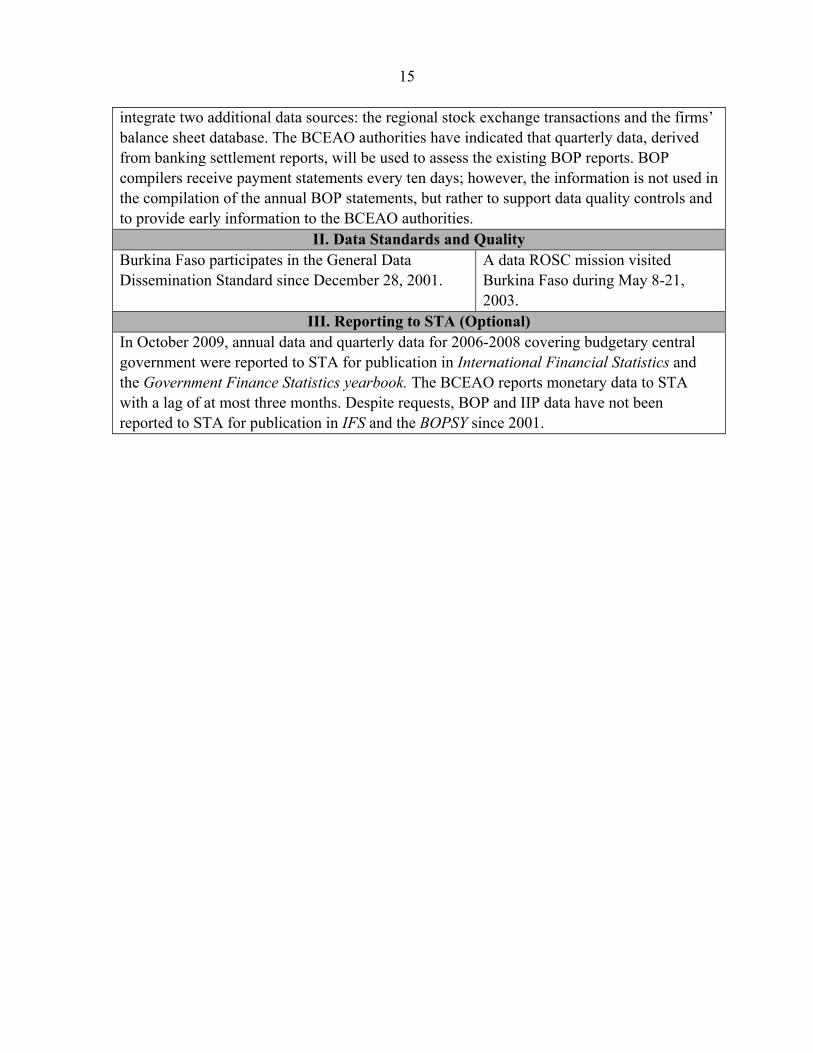
15
integrate two additional data sources: the regional stock exchange transactions and the firms’ balance sheet database. The BCEAO authorities have indicated that quarterly data, derived from banking settlement reports, will be used to assess the existing BOP reports. BOP compilers receive payment statements every ten days; however, the information is not used in the compilation of the annual BOP statements, but rather to support data quality controls and to provide early information to the BCEAO authorities.
II. Data Standards and Quality Burkina Faso participates in the General Data Dissemination Standard since December 28, 2001.
A data ROSC mission visited Burkina Faso during May 8-21, 2003.
III. Reporting to STA (Optional) In October 2009, annual data and quarterly data for 2006-2008 covering budgetary central government were reported to STA for publication in International Financial Statistics and the Government Finance Statistics yearbook. The BCEAO reports monetary data to STA with a lag of at most three months. Despite requests, BOP and IIP data have not been reported to STA for publication in IFS and the BOPSY since 2001.
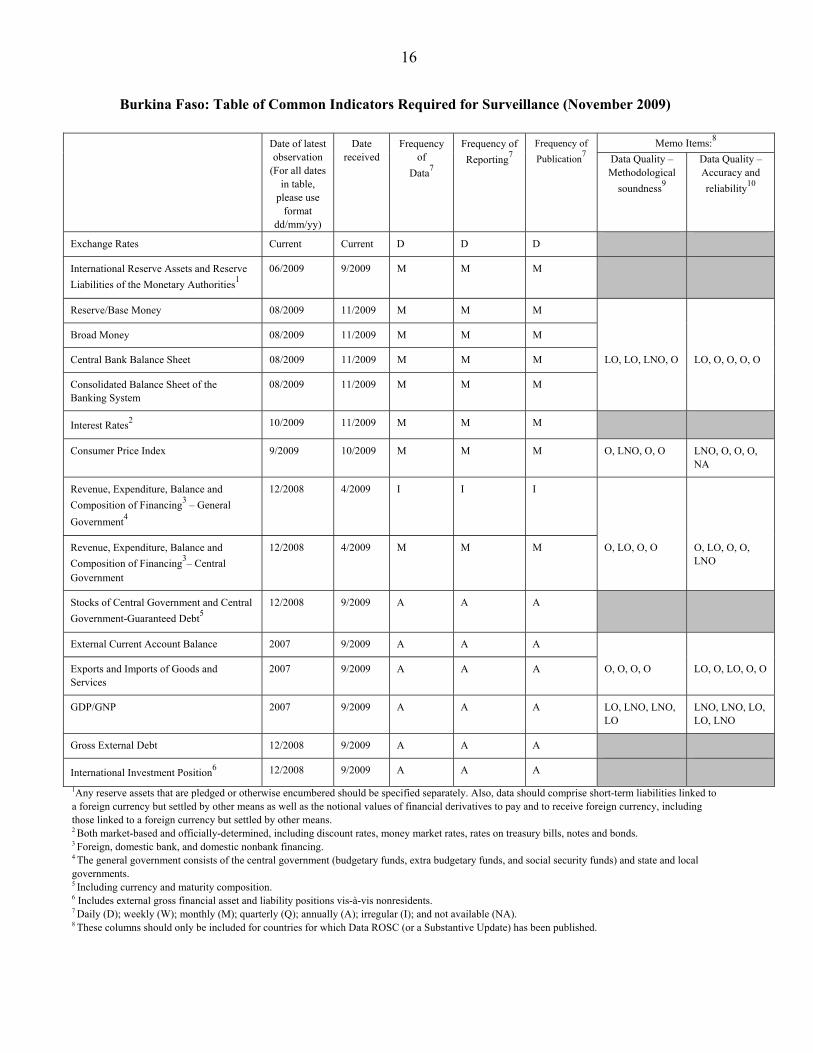
16
Burkina Faso: Table of Common Indicators Required for Surveillance (November 2009)
1Any reserve assets that are pledged or otherwise encumbered should be specified separately. Also, data should comprise short-term liabilities linked to a foreign currency but settled by other means as well as the notional values of financial derivatives to pay and to receive foreign currency, including those linked to a foreign currency but settled by other means. 2 Both market-based and officially-determined, including discount rates, money market rates, rates on treasury bills, notes and bonds. 3 Foreign, domestic bank, and domestic nonbank financing. 4 The general government consists of the central government (budgetary funds, extra budgetary funds, and social security funds) and state and local governments. 5 Including currency and maturity composition. 6 Includes external gross financial asset and liability positions vis-à-vis nonresidents. 7 Daily (D); weekly (W); monthly (M); quarterly (Q); annually (A); irregular (I); and not available (NA). 8 These columns should only be included for countries for which Data ROSC (or a Substantive Update) has been published.
Date of latest observation
(For all dates in table,
please use format
dd/mm/yy)
Date received
Frequency of
Data7
Frequency of
Reporting7
Frequency of
Publication7
Memo Items:8
Data Quality – Methodological
soundness9
Data Quality – Accuracy and
reliability10
Exchange Rates Current Current D D D
International Reserve Assets and Reserve
Liabilities of the Monetary Authorities1
06/2009 9/2009 M M M
Reserve/Base Money 08/2009 11/2009 M M M
Broad Money 08/2009 11/2009 M M M
Central Bank Balance Sheet 08/2009 11/2009 M M M LO, LO, LNO, O LO, O, O, O, O
Consolidated Balance Sheet of the Banking System
08/2009 11/2009 M M M
Interest Rates2 10/2009 11/2009 M M M
Consumer Price Index 9/2009 10/2009 M M M O, LNO, O, O LNO, O, O, O, NA
Revenue, Expenditure, Balance and
Composition of Financing3 – General
Government4
12/2008 4/2009 I I I
Revenue, Expenditure, Balance and
Composition of Financing3– Central
Government
12/2008 4/2009 M M M O, LO, O, O O, LO, O, O, LNO
Stocks of Central Government and Central
Government-Guaranteed Debt5
12/2008 9/2009 A A A
External Current Account Balance 2007 9/2009 A A A
Exports and Imports of Goods and Services
2007 9/2009 A A A O, O, O, O LO, O, LO, O, O
GDP/GNP 2007 9/2009 A A A LO, LNO, LNO, LO
LNO, LNO, LO, LO, LNO
Gross External Debt 12/2008 9/2009 A A A
International Investment Position6 12/2008 9/2009 A A A
17
9 Reflects the assessment provided in the data ROSC or the Substantive Update (published on March 10, 2004, and based on the findings of the mission that took place during May 8-21, 2003) for the dataset corresponding to the variable in each row. The assessment indicates whether international standards concerning concepts and definitions, scope, classification/sectorization, and basis for recording, respectively, are fully observed (O); largely observed (LO); largely not observed (LNO); not observed (NO); and not available (NA). 10 Same as footnote 9, except referring to international standards concerning, respectively, source data, assessment of source data, statistical techniques, assessment and validation of intermediate data and statistical outputs, and revision studies.
Public Information Notice (PIN) No. 09/138 FOR IMMEDIATE RELEASE December 17, 2009
IMF Executive Board Concludes 2009 Article IV Consultation with Burkina Faso
On December 14, 2009, the Executive Board of the International Monetary Fund concluded the Article IV consultation with Burkina Faso.1 The Executive Board also completed the fifth review of Burkina Faso’s performance under its Poverty Reduction and Growth Facility (PRGF) supported program. Background The 2009 Article IV assessment follows a decade of generally good macroeconomic performance in Burkina Faso, with real gross domestic product (GDP) growth of 5.5 percent and inflation of 2.7 percent annually on average. Macroeconomic stability provided a favorable environment for reducing poverty, which declined from about 55 percent of the population in 2000 to about 46 percent in 2006. Notwithstanding this generally good performance, reaching the Millennium Development Goals will prove challenging in several areas, including education and health. In 2008-09, economic activity was negatively affected by the increase in global food and fuel prices, the global economic and financial crisis, and heavy flooding in Ouagadougou in September 2009. These shocks are estimated to have contributed to a deterioration in poverty indicators. Following 5.2 percent real GDP growth in 2008, led by a rebound in agricultural
1 Under Article IV of the IMF's Articles of Agreement, the IMF holds bilateral discussions with members, usually every year. A staff team visits the country, collects economic and financial information, and discusses with officials the country's economic developments and policies. On return to headquarters, the staff prepares a report, which forms the basis for discussion by the Executive Board. At the conclusion of the discussion, the Managing Director, as Chairman of the Board, summarizes the views of Executive Directors, and this summary is transmitted to the country's authorities. An explanation of any qualifiers used in summings up can be found here: http://www.imf.org/external/np/sec/misc/qualifiers.htm
International Monetary Fund 700 19th Street, NW Washington, D. C. 20431 USA
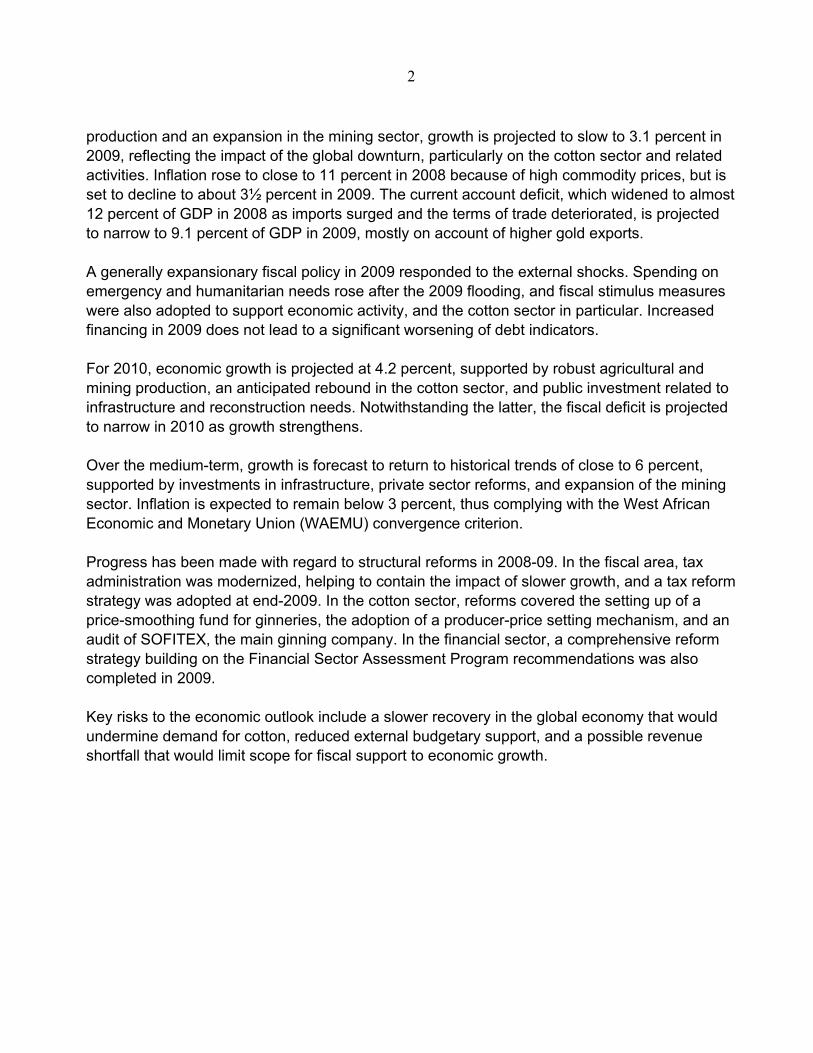
2
production and an expansion in the mining sector, growth is projected to slow to 3.1 percent in 2009, reflecting the impact of the global downturn, particularly on the cotton sector and related activities. Inflation rose to close to 11 percent in 2008 because of high commodity prices, but is set to decline to about 3½ percent in 2009. The current account deficit, which widened to almost 12 percent of GDP in 2008 as imports surged and the terms of trade deteriorated, is projected to narrow to 9.1 percent of GDP in 2009, mostly on account of higher gold exports. A generally expansionary fiscal policy in 2009 responded to the external shocks. Spending on emergency and humanitarian needs rose after the 2009 flooding, and fiscal stimulus measures were also adopted to support economic activity, and the cotton sector in particular. Increased financing in 2009 does not lead to a significant worsening of debt indicators. For 2010, economic growth is projected at 4.2 percent, supported by robust agricultural and mining production, an anticipated rebound in the cotton sector, and public investment related to infrastructure and reconstruction needs. Notwithstanding the latter, the fiscal deficit is projected to narrow in 2010 as growth strengthens. Over the medium-term, growth is forecast to return to historical trends of close to 6 percent, supported by investments in infrastructure, private sector reforms, and expansion of the mining sector. Inflation is expected to remain below 3 percent, thus complying with the West African Economic and Monetary Union (WAEMU) convergence criterion. Progress has been made with regard to structural reforms in 2008-09. In the fiscal area, tax administration was modernized, helping to contain the impact of slower growth, and a tax reform strategy was adopted at end-2009. In the cotton sector, reforms covered the setting up of a price-smoothing fund for ginneries, the adoption of a producer-price setting mechanism, and an audit of SOFITEX, the main ginning company. In the financial sector, a comprehensive reform strategy building on the Financial Sector Assessment Program recommendations was also completed in 2009. Key risks to the economic outlook include a slower recovery in the global economy that would undermine demand for cotton, reduced external budgetary support, and a possible revenue shortfall that would limit scope for fiscal support to economic growth.
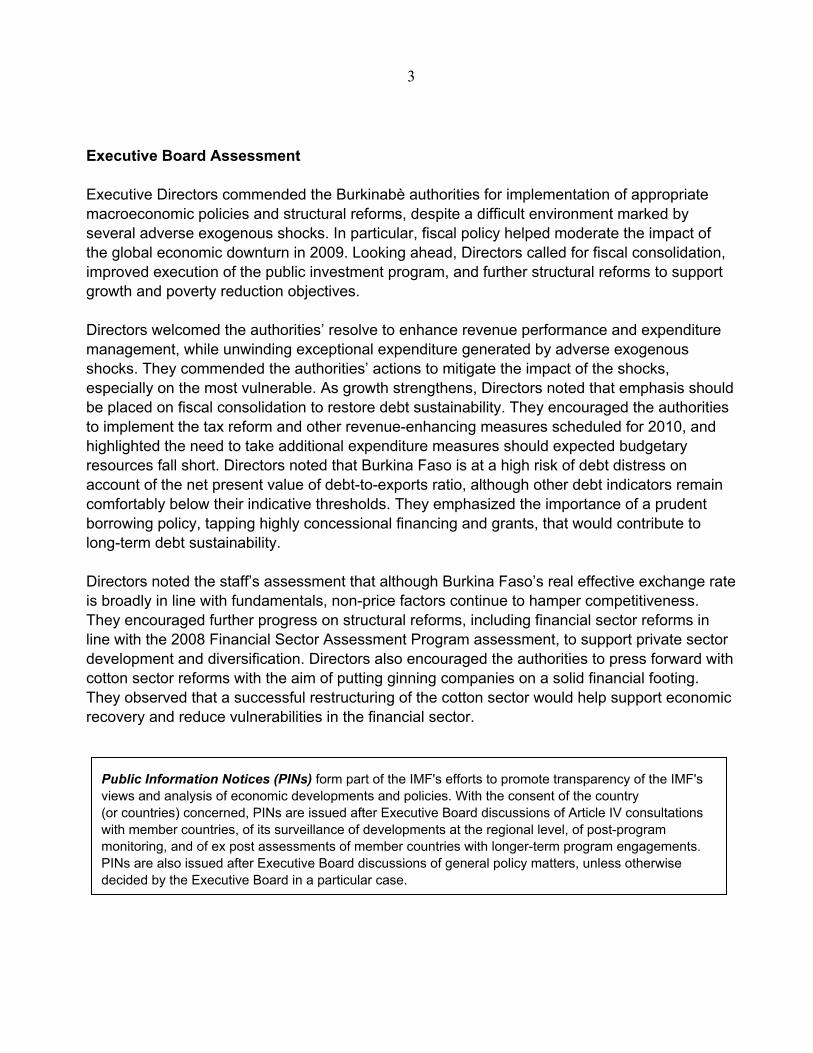
3
Executive Board Assessment Executive Directors commended the Burkinabè authorities for implementation of appropriate macroeconomic policies and structural reforms, despite a difficult environment marked by several adverse exogenous shocks. In particular, fiscal policy helped moderate the impact of the global economic downturn in 2009. Looking ahead, Directors called for fiscal consolidation, improved execution of the public investment program, and further structural reforms to support growth and poverty reduction objectives. Directors welcomed the authorities’ resolve to enhance revenue performance and expenditure management, while unwinding exceptional expenditure generated by adverse exogenous shocks. They commended the authorities’ actions to mitigate the impact of the shocks, especially on the most vulnerable. As growth strengthens, Directors noted that emphasis should be placed on fiscal consolidation to restore debt sustainability. They encouraged the authorities to implement the tax reform and other revenue-enhancing measures scheduled for 2010, and highlighted the need to take additional expenditure measures should expected budgetary resources fall short. Directors noted that Burkina Faso is at a high risk of debt distress on account of the net present value of debt-to-exports ratio, although other debt indicators remain comfortably below their indicative thresholds. They emphasized the importance of a prudent borrowing policy, tapping highly concessional financing and grants, that would contribute to long-term debt sustainability. Directors noted the staff’s assessment that although Burkina Faso’s real effective exchange rate is broadly in line with fundamentals, non-price factors continue to hamper competitiveness. They encouraged further progress on structural reforms, including financial sector reforms in line with the 2008 Financial Sector Assessment Program assessment, to support private sector development and diversification. Directors also encouraged the authorities to press forward with cotton sector reforms with the aim of putting ginning companies on a solid financial footing. They observed that a successful restructuring of the cotton sector would help support economic recovery and reduce vulnerabilities in the financial sector.
Public Information Notices (PINs) form part of the IMF's efforts to promote transparency of the IMF's views and analysis of economic developments and policies. With the consent of the country (or countries) concerned, PINs are issued after Executive Board discussions of Article IV consultations with member countries, of its surveillance of developments at the regional level, of post-program monitoring, and of ex post assessments of member countries with longer-term program engagements. PINs are also issued after Executive Board discussions of general policy matters, unless otherwise decided by the Executive Board in a particular case.
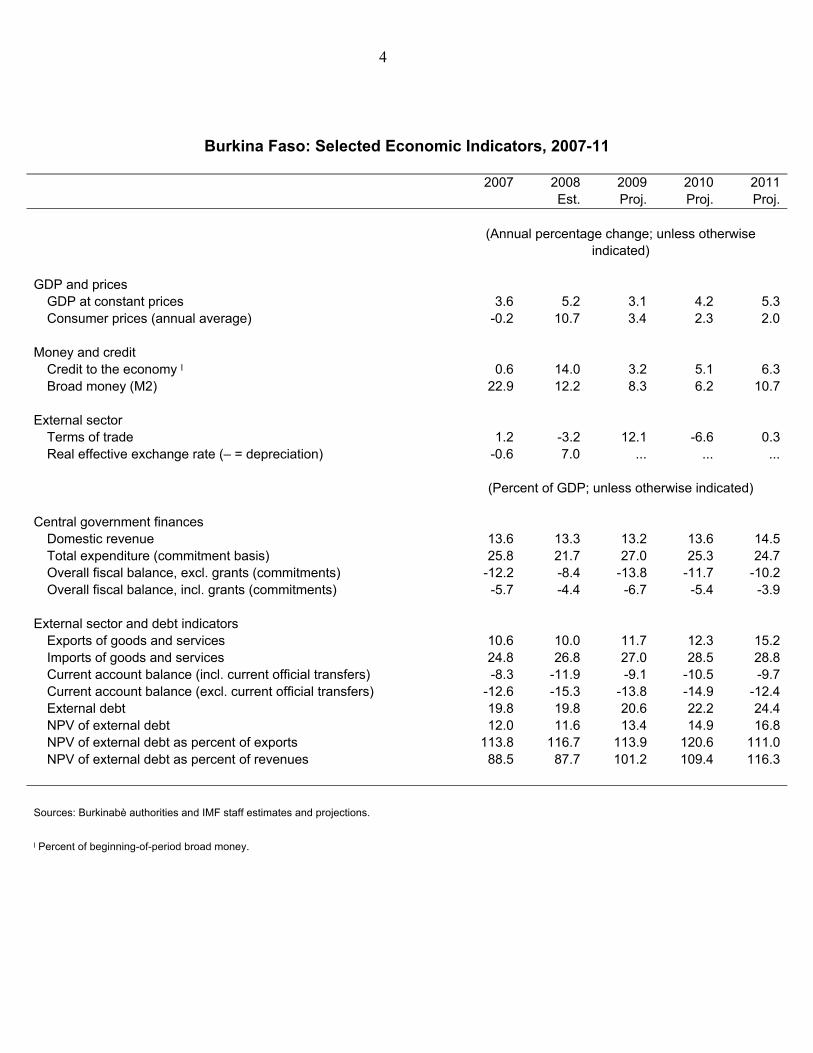
4
Burkina Faso: Selected Economic Indicators, 2007-11
2007 2008 2009 2010 2011 Est. Proj. Proj. Proj.
(Annual percentage change; unless otherwise indicated)
GDP and prices GDP at constant prices 3.6 5.2 3.1 4.2 5.3Consumer prices (annual average) -0.2 10.7 3.4 2.3 2.0
Money and credit Credit to the economy ˡ 0.6 14.0 3.2 5.1 6.3Broad money (M2) 22.9 12.2 8.3 6.2 10.7
External sector Terms of trade 1.2 -3.2 12.1 -6.6 0.3Real effective exchange rate (– = depreciation) -0.6 7.0 ... ... ...
(Percent of GDP; unless otherwise indicated)
Central government finances Domestic revenue 13.6 13.3 13.2 13.6 14.5Total expenditure (commitment basis) 25.8 21.7 27.0 25.3 24.7Overall fiscal balance, excl. grants (commitments) -12.2 -8.4 -13.8 -11.7 -10.2Overall fiscal balance, incl. grants (commitments) -5.7 -4.4 -6.7 -5.4 -3.9
External sector and debt indicators Exports of goods and services 10.6 10.0 11.7 12.3 15.2Imports of goods and services 24.8 26.8 27.0 28.5 28.8Current account balance (incl. current official transfers) -8.3 -11.9 -9.1 -10.5 -9.7Current account balance (excl. current official transfers) -12.6 -15.3 -13.8 -14.9 -12.4External debt 19.8 19.8 20.6 22.2 24.4NPV of external debt 12.0 11.6 13.4 14.9 16.8NPV of external debt as percent of exports 113.8 116.7 113.9 120.6 111.0NPV of external debt as percent of revenues 88.5 87.7 101.2 109.4 116.3
Sources: Burkinabè authorities and IMF staff estimates and projections.
ˡ Percent of beginning-of-period broad money.
Press Release No. 09/459 FOR IMMEDIATE RELEASE December 14, 2009
IMF Executive Board Completes Fifth Review Under PRGF with Burkina Faso and Approves US$54 Million Disbursement
The Executive Board of the International Monetary Fund (IMF) today completed the fifth review of Burkina Faso’s performance under an economic program supported by a Poverty Reduction and Growth Facility (PRGF) arrangement. The Executive Board also approved an augmentation of access of SDR 33.11 million (about US$ 52.52 million; and 55 percent of quota) to help cushion the adverse impact of the global economic crisis and recent flooding that have put a significant strain on the government budget. The completion of the review enables the disbursement of SDR 34.114 million (about US$54.11 million), bringing total disbursements under the program so far to about SDR 47.156 million (about US$74.80 million). The PRGF arrangement for Burkina Faso was approved on April 23, 2007 (see Press Release No. 07/77) to support the government's economic reform program for 2007-10. The augmentation approved today will bring the total financial support under the PRGF arrangement to SDR 48.16 million (about US$76.40 million). On January 9, 2008, the Executive Board already approved an increase in access to help Burkina Faso address the impact of higher oil prices and the adverse shock to the cotton sector (see Press Release No. 08/04). The Executive Board today also concluded the 2009 Article IV consultation with Burkina Faso. A Public Information Notice and the staff report will be published in due course. Following the Executive Board's discussion on Burkina Faso, Mr. Murilo Portugal, Deputy Managing Director and Acting Chair, stated:
International Monetary Fund Washington, D.C. 20431 USA
2
“The Burkinabè authorities are to be commended for good macroeconomic management in a challenging external environment, with the program supported by the PRGF arrangement implemented in line with expectations. “An expansionary fiscal policy stance responded to the challenges posed by the economic downturn and the heavy flooding in Ouagadougou in September. The increase in public expenditure in 2009 has helped minimize the negative impact of shocks on the most vulnerable segments of the population while providing for reconstruction needs and growth-enhancing investment outlays. Consequently, notwithstanding the authorities’ continued efforts to enhance revenue collection and to contain non-priority spending, the overall fiscal deficit has risen compared to the originally-envisaged level. “Looking ahead, the Burkinabè authorities recognize the importance of fiscal consolidation to safeguard long term debt sustainability. The fiscal deficit is projected to decline in 2010 as the economy recovers and pressure from exceptional needs eases. Revenue mobilization efforts will benefit from the continued strengthening of the tax and customs administrations, and the implementation of a tax reform strategy covering an overhaul of corporate taxation, the streamlining of tax incentives, and the improved management of indirect taxes. In addition, the authorities’ plans to improve expenditure and treasury cash management and accelerate civil service reform are welcome steps to enhance public financial management. “Structural reforms will be key to accelerating economic growth and strengthening the resilience of the Burkinabè economy. In 2010, efforts will focus on the implementation of the recently completed financial sector reform strategy and on improving management of the largest cotton ginning company. In conjunction with ongoing diversification efforts and improvements to the business environment, these reforms will help place Burkina Faso on a sustainable growth path generating the additional resources required for poverty reduction,” Mr. Portugal said.
Statement by Laurean Rutayisire, Executive Director for Burkina Faso
December 14, 2009 On behalf of Burkina Faso’s authorities, I would like to thank the Executive Board and Management for the Fund’s continued support to Burkina Faso. I would also like to thank Staff for the close and constructive policy dialogue during the discussions held recently in Ouagadougou in the context of the fifth review of the PRGF arrangement and the 2009 Article IV consultation. Burkina Faso has been beset by a succession of adverse exogenous shocks including the fuel and basic commodities price increases, deteriorations in terms of trade, the global economic and financial crisis, and recently massive flooding which directly impacted major cities, including the capital city in particular. The flooding which were of an unprecedented scale in a country usually stricken by drought, led to losses of lives and created a humanitarian crisis with an estimated 180,000 persons left without a shelter, disruptions in economic activities, and damaged critical infrastructures, including medical and pharmaceutical facilities, dams and roads. My authorities are appreciative of the strong support they have received from the International Community in the wake of the natural disaster. The IMF in particular responded swiftly by sending a mission to Burkina which has been helpful in designing an appropriate policy response to the crisis. Although faced with a succession of severe exogenous shocks, Burkina Faso’s authorities steadfastly implemented their economic program under the PRGF arrangement which aims at reducing poverty, fostering growth while preserving macroeconomic stability. They realized all the quantitative performance criteria. They also met all structural benchmarks, although one benchmark was met with slight delay. Notwithstanding the progress achieved, my authorities are fully cognizant of the challenges ahead as they seek to meet their development objectives. They are committed to adhere to sound policies going forward and would appreciate continued Fund support of their reform agenda. To that regard, they are requesting completion of the fifth review under the PRGF, and the 2009 Article IV consultation. They also request an augmentation of access to help meet additional financing needs stemming from the exogenous shocks, and the natural disaster in particular, and modification of performance criteria.
I. RECENT ECONOMIC PERFORMANCE Reflecting the impact of the shocks, Burkina Faso’s growth prospects deteriorated, with real GDP growth projected to decline to 3.1 percent in 2009. Inflation declined, following oil prices decreases. The current account position is projected to improve as oil prices decline and exports prices recover.
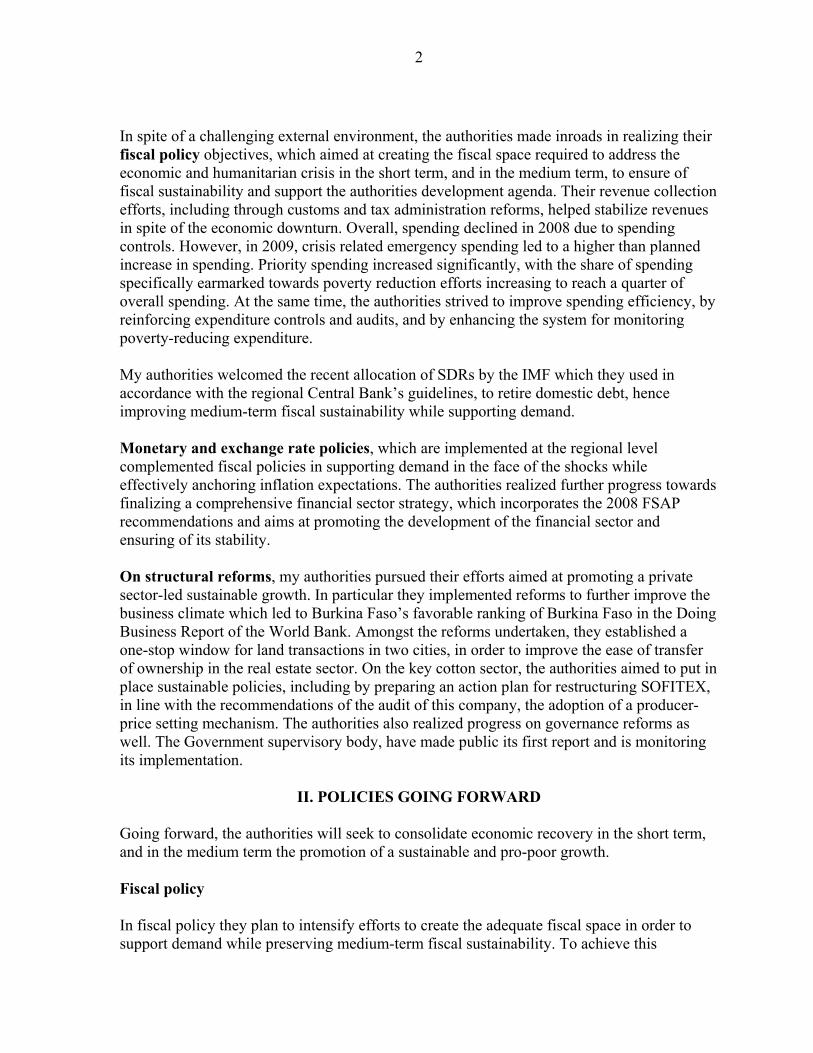
2
In spite of a challenging external environment, the authorities made inroads in realizing their fiscal policy objectives, which aimed at creating the fiscal space required to address the economic and humanitarian crisis in the short term, and in the medium term, to ensure of fiscal sustainability and support the authorities development agenda. Their revenue collection efforts, including through customs and tax administration reforms, helped stabilize revenues in spite of the economic downturn. Overall, spending declined in 2008 due to spending controls. However, in 2009, crisis related emergency spending led to a higher than planned increase in spending. Priority spending increased significantly, with the share of spending specifically earmarked towards poverty reduction efforts increasing to reach a quarter of overall spending. At the same time, the authorities strived to improve spending efficiency, by reinforcing expenditure controls and audits, and by enhancing the system for monitoring poverty-reducing expenditure. My authorities welcomed the recent allocation of SDRs by the IMF which they used in accordance with the regional Central Bank’s guidelines, to retire domestic debt, hence improving medium-term fiscal sustainability while supporting demand. Monetary and exchange rate policies, which are implemented at the regional level complemented fiscal policies in supporting demand in the face of the shocks while effectively anchoring inflation expectations. The authorities realized further progress towards finalizing a comprehensive financial sector strategy, which incorporates the 2008 FSAP recommendations and aims at promoting the development of the financial sector and ensuring of its stability. On structural reforms, my authorities pursued their efforts aimed at promoting a private sector-led sustainable growth. In particular they implemented reforms to further improve the business climate which led to Burkina Faso’s favorable ranking of Burkina Faso in the Doing Business Report of the World Bank. Amongst the reforms undertaken, they established a one-stop window for land transactions in two cities, in order to improve the ease of transfer of ownership in the real estate sector. On the key cotton sector, the authorities aimed to put in place sustainable policies, including by preparing an action plan for restructuring SOFITEX, in line with the recommendations of the audit of this company, the adoption of a producer-price setting mechanism. The authorities also realized progress on governance reforms as well. The Government supervisory body, have made public its first report and is monitoring its implementation.
II. POLICIES GOING FORWARD Going forward, the authorities will seek to consolidate economic recovery in the short term, and in the medium term the promotion of a sustainable and pro-poor growth. Fiscal policy In fiscal policy they plan to intensify efforts to create the adequate fiscal space in order to support demand while preserving medium-term fiscal sustainability. To achieve this
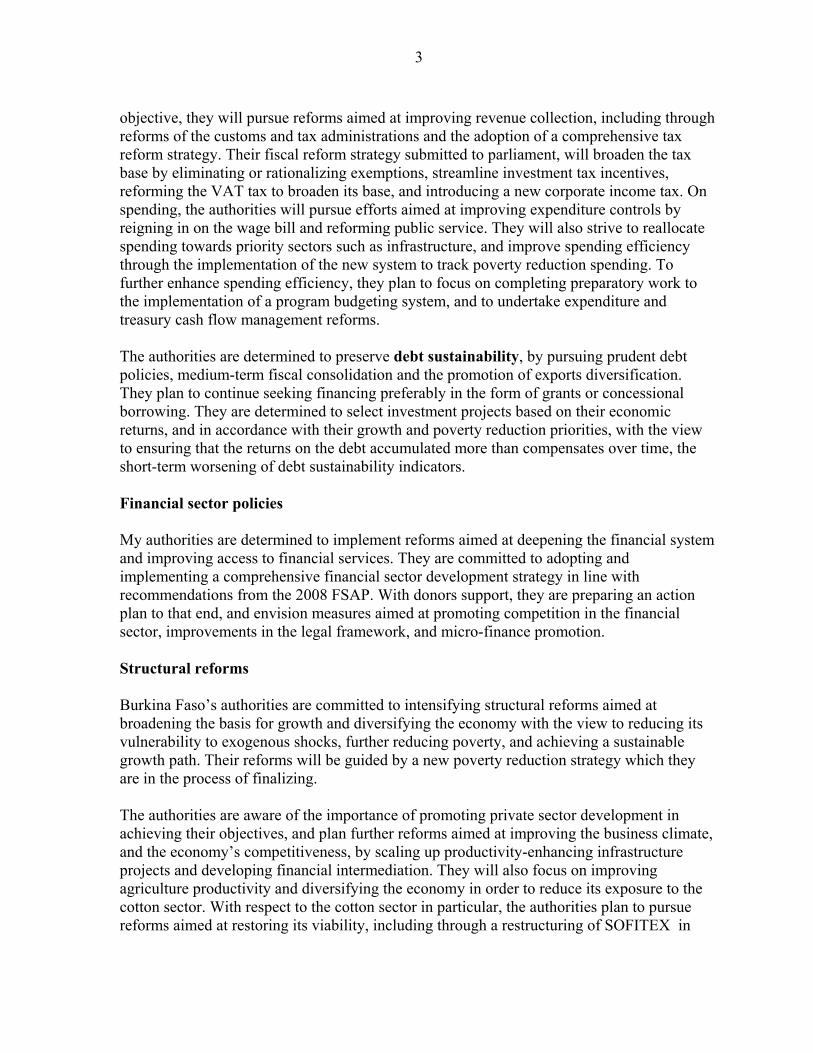
3
objective, they will pursue reforms aimed at improving revenue collection, including through reforms of the customs and tax administrations and the adoption of a comprehensive tax reform strategy. Their fiscal reform strategy submitted to parliament, will broaden the tax base by eliminating or rationalizing exemptions, streamline investment tax incentives, reforming the VAT tax to broaden its base, and introducing a new corporate income tax. On spending, the authorities will pursue efforts aimed at improving expenditure controls by reigning in on the wage bill and reforming public service. They will also strive to reallocate spending towards priority sectors such as infrastructure, and improve spending efficiency through the implementation of the new system to track poverty reduction spending. To further enhance spending efficiency, they plan to focus on completing preparatory work to the implementation of a program budgeting system, and to undertake expenditure and treasury cash flow management reforms. The authorities are determined to preserve debt sustainability, by pursuing prudent debt policies, medium-term fiscal consolidation and the promotion of exports diversification. They plan to continue seeking financing preferably in the form of grants or concessional borrowing. They are determined to select investment projects based on their economic returns, and in accordance with their growth and poverty reduction priorities, with the view to ensuring that the returns on the debt accumulated more than compensates over time, the short-term worsening of debt sustainability indicators. Financial sector policies My authorities are determined to implement reforms aimed at deepening the financial system and improving access to financial services. They are committed to adopting and implementing a comprehensive financial sector development strategy in line with recommendations from the 2008 FSAP. With donors support, they are preparing an action plan to that end, and envision measures aimed at promoting competition in the financial sector, improvements in the legal framework, and micro-finance promotion. Structural reforms Burkina Faso’s authorities are committed to intensifying structural reforms aimed at broadening the basis for growth and diversifying the economy with the view to reducing its vulnerability to exogenous shocks, further reducing poverty, and achieving a sustainable growth path. Their reforms will be guided by a new poverty reduction strategy which they are in the process of finalizing. The authorities are aware of the importance of promoting private sector development in achieving their objectives, and plan further reforms aimed at improving the business climate, and the economy’s competitiveness, by scaling up productivity-enhancing infrastructure projects and developing financial intermediation. They will also focus on improving agriculture productivity and diversifying the economy in order to reduce its exposure to the cotton sector. With respect to the cotton sector in particular, the authorities plan to pursue reforms aimed at restoring its viability, including through a restructuring of SOFITEX in
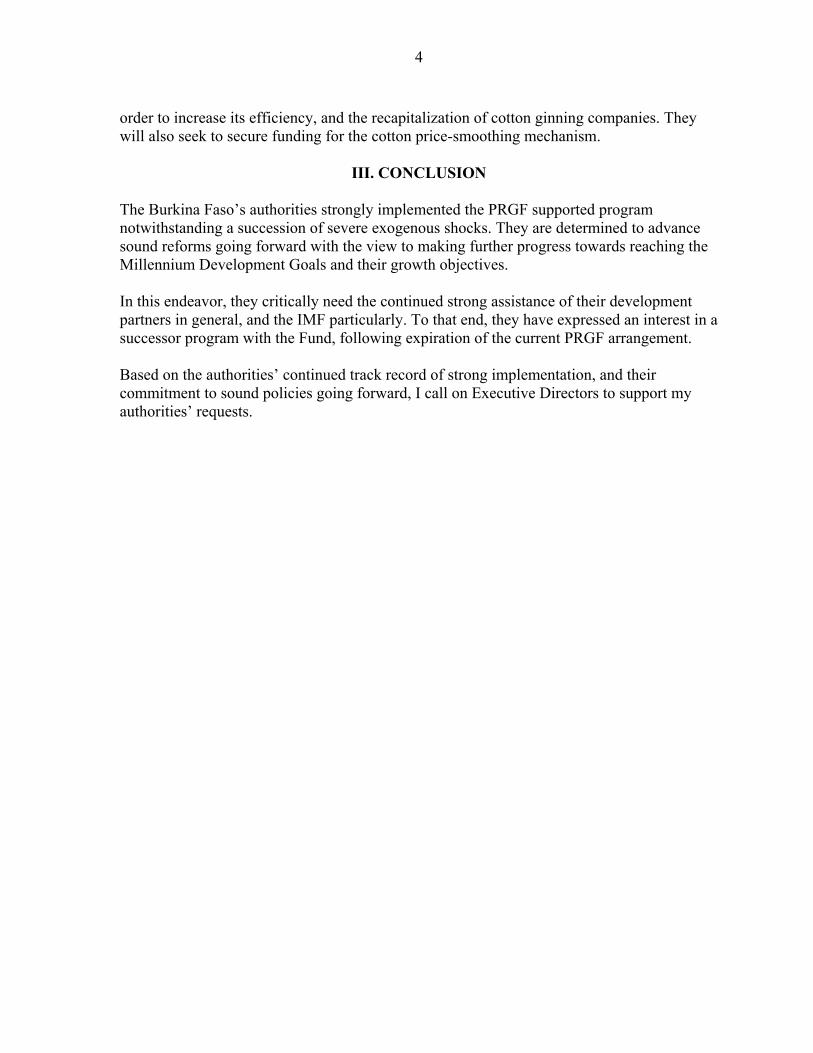
4
order to increase its efficiency, and the recapitalization of cotton ginning companies. They will also seek to secure funding for the cotton price-smoothing mechanism.
III. CONCLUSION The Burkina Faso’s authorities strongly implemented the PRGF supported program notwithstanding a succession of severe exogenous shocks. They are determined to advance sound reforms going forward with the view to making further progress towards reaching the Millennium Development Goals and their growth objectives. In this endeavor, they critically need the continued strong assistance of their development partners in general, and the IMF particularly. To that end, they have expressed an interest in a successor program with the Fund, following expiration of the current PRGF arrangement. Based on the authorities’ continued track record of strong implementation, and their commitment to sound policies going forward, I call on Executive Directors to support my authorities’ requests.