nicaragua: staff report for the 2012 article iv ... · staff report for the 2012 article iv...
TRANSCRIPT

IMF Country Report No. 12/256
NICARAGUA 2012 ARTICLE IV CONSULTATION 2011 July 29, 2011 Under Article IV of the IMF’s Articles of Agreement, the IMF holds bilateral discussions with members, usually every year. In the context of the 2012 Article IV consultation with Nicaragua, the following documents have been released and are included in this package: Staff report for the 2012 Article IV consultation, prepared by a staff team of the IMF,
following discussions that ended on May 11, 2012, with the officials of Nicaragua on economic developments and policies. Based on information available at the time of these discussions, the staff report was completed on June 12, 2012. The views expressed in the staff report are those of the staff team and do not necessarily reflect the views of the Executive Board of the IMF.
Informational Annex
Public Information Notice (PIN) summarizing the views of the Executive Board.
A statement by the Executive Director for Nicaragua
The documents listed below have been or will be separately released.
Ex Post Assessment of Longer-Term Program Engagement Selected Issues Paper
The policy of publication of staff reports and other documents allows for the deletion of market-sensitive information.
Copies of this report are available to the public from
International Monetary Fund Publication Services 700 19th Street, N.W. Washington, D.C. 20431
Telephone: (202) 623-7430 Telefax: (202) 623-7201 E-mail: [email protected] Internet: http://www.imf.org
International Monetary Fund Washington, D.C.
September, 2012
ndley
NICARAGUA STAFF REPORT FOR THE 2012 ARTICLE IV CONSULTATION
KEY ISSUES
Context. Nicaragua’s performance on the growth and fiscal fronts in 2011 was better than
anticipated in the last review of the ECF-supported program. President Ortega was re-
elected in November. Municipal elections are scheduled for November 2012.
Near-term prospects and risks. Output growth is projected to moderate in 2012 as the
global economy remains weak. Oil price increases are significant risks to the near-term
outlook given Nicaragua’s large oil import bill. Tax revenue collections are expected to
remain strong but expenditure pressures are building up. Key fiscal risks for 2012 are higher
electricity subsidies and other increases in current expenditures, including the absorption of
the wage bonus (granted since 2010) into the wage bill.
Medium-term challenges and staff recommendations. Under current policies, economic
growth may stabilize at about 4 percent, which would not result in large reductions in
poverty. Attaining a much higher growth rate, sustained by large increases in productivity, is
Nicaragua’s overarching challenge. Reducing fiscal and external vulnerabilities is another
significant challenge. Reforming the social security system, establishing a sustainable
financial framework for the electricity sector, improving business conditions, and continuing
the momentum in tax reforms would be critical to overcome these challenges. A growth-
enhancing fiscal consolidation path (anchored on controlling current expenditure and
broadening the tax base), a higher international reserves buffer, and a steady strategy to
lower the dependence on oil imports are key staff recommendations.
June 12, 2012
2012 ARTICLE IV REPORT NICARAGUA
2 INTERNATIONAL MONETARY FUND
Approved By Miguel Savastano (WHD) and Dhaneshwar Ghura (SPR)
Discussions took place in Managua during May 2–May 11, 2012. The Team comprised M. Estevão (head), I. Samake, C. Johnson (all WHD), R. Fenochietto (FAD), J. Bersch (SPR) and G. Di Bella (Resident Representative). Staff met with the Vice President, the Economic Cabinet, the Superintendent of Banks, the Attorney General, the Comptroller General, the Minister of Energy, the Economic Commission of the National Assembly, other government representatives, the business community, labor unions, civil society organizations, and international donors. L. Consenza (OED) participated in policy meetings.
Contents Page
BACKGROUND .................................................................................................................................. 4
RECENT ECONOMIC DEVELOPMENTS ............................................................................................ 5
OUTLOOK AND RISKS .................................................................................................................... 10
POLICY DISCUSSION ....................................................................................................................... 12
A. Near-Term Policies .................................................................................................................................... 14
B. Medium-Term Challenges ...................................................................................................................... 15
STATISTICAL ISSUES ....................................................................................................................... 25
STAFF APPRAISAL ........................................................................................................................... 25
TABLES
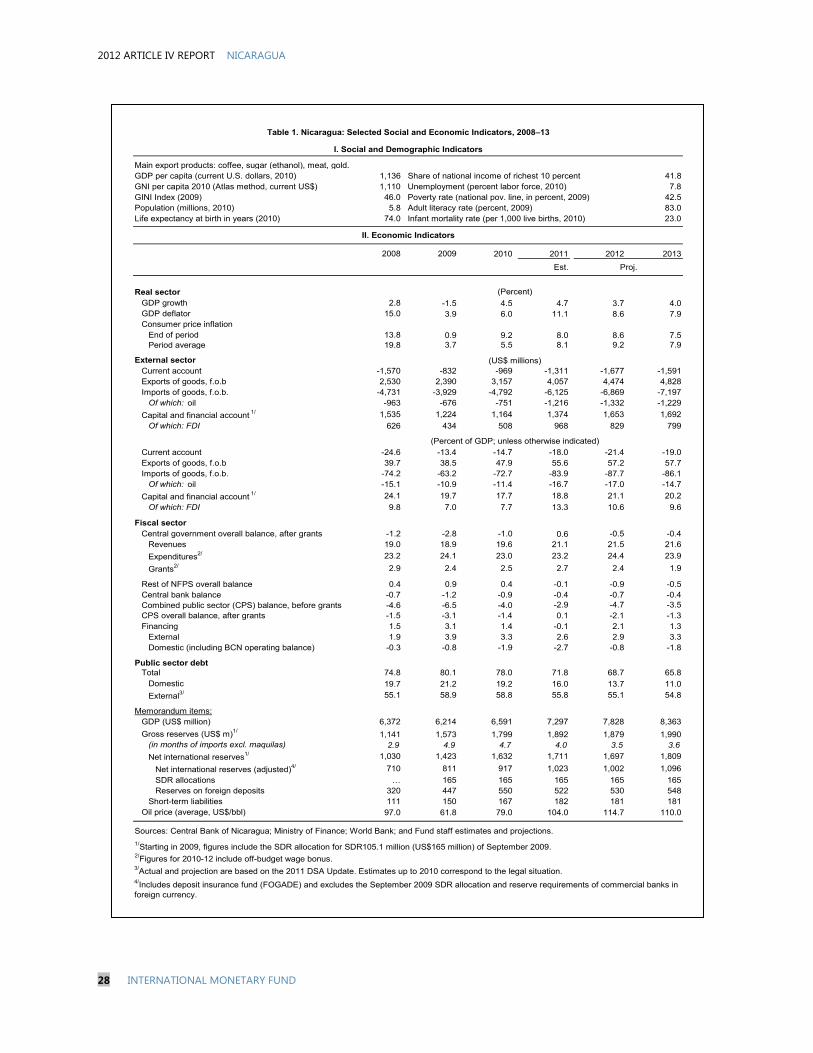
1. Selected Social and Economic Indicators, 2008–13 ...................................................................................... 28
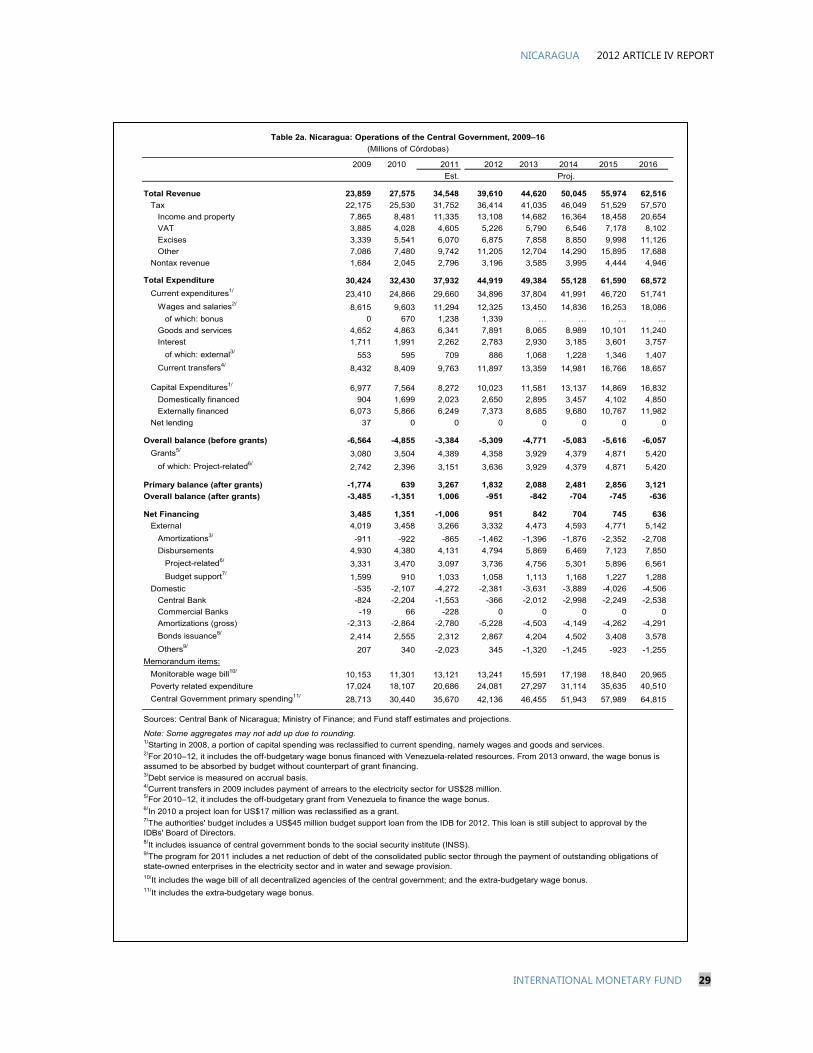
2a. Operations of the Central Government, 2009–16 (millions of córdobas) .......................................... 29
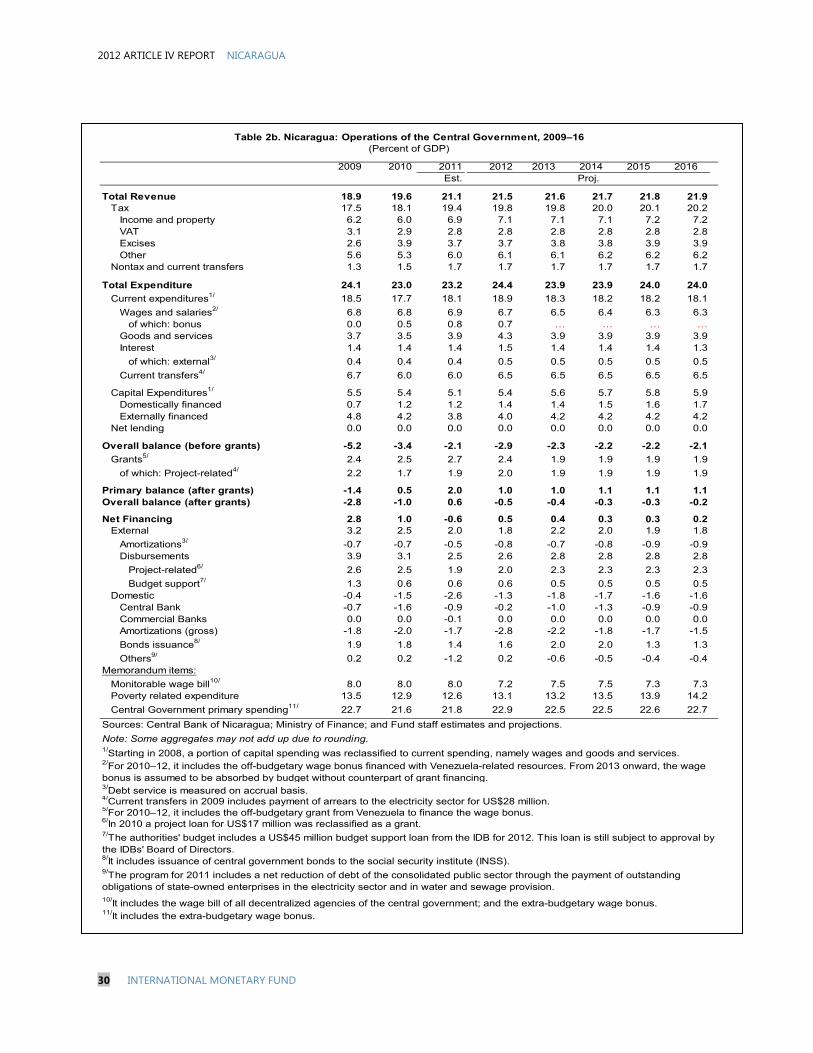
2b. Operations of the Central Government, 2009–16 (percent of GDP) ................................................... 30
3a. Operations of the Combined Public Sector, 2009–16 (millions of córdobas) .................................. 31
3b. Operations of the Combined Public Sector, 2009–16 (percent of GDP) ............................................ 32
4. Summary Accounts of the Central Bank, 2008–13 ........................................................................................ 33
5. Summary Accounts of Deposit Banks and the Financial System, 2008–13 ......................................... 34
6. Medium-Term Balance of Payments, 2008–17 ............................................................................................... 35
7. Medium-Term Macroeconomic Framework, 2008–16 ................................................................................ 36
8. Statement of Operations of the Central Government (GFSM 2001) – Preliminary, 2009–16 ....... 37
9. Financial Soundness Indicators, 2008–11 ......................................................................................................... 38
10. Millennium Development Goals, 1990–2010 ................................................................................................ 39
FIGURES
1. Recent Economic Developments ............................................................................................................................ 6
2. Selected Fiscal Indicators ........................................................................................................................................... 8
NICARAGUA 2012 ARTICLE IV REPORT
INTERNATIONAL MONETARY FUND 3
3. External Sector Developments ................................................................................................................................. 9
4. Monetary and Financial Sector Developments ............................................................................................... 11
5. Medium-Term Challenges ...................................................................................................................................... 13
6. Labor Market Informality, 2010Q4 ...................................................................................................................... 18
BOXES
1. Informality in Nicaragua’s Labor Market .......................................................................................................... 17
2. The Benefits of a New Tax Reform ...................................................................................................................... 21
3. Exchange Rate Assessment and External Competitiveness ....................................................................... 23

2012 ARTICLE IV REPORT NICARAGUA
4 INTERNATIONAL MONETARY FUND
BACKGROUND
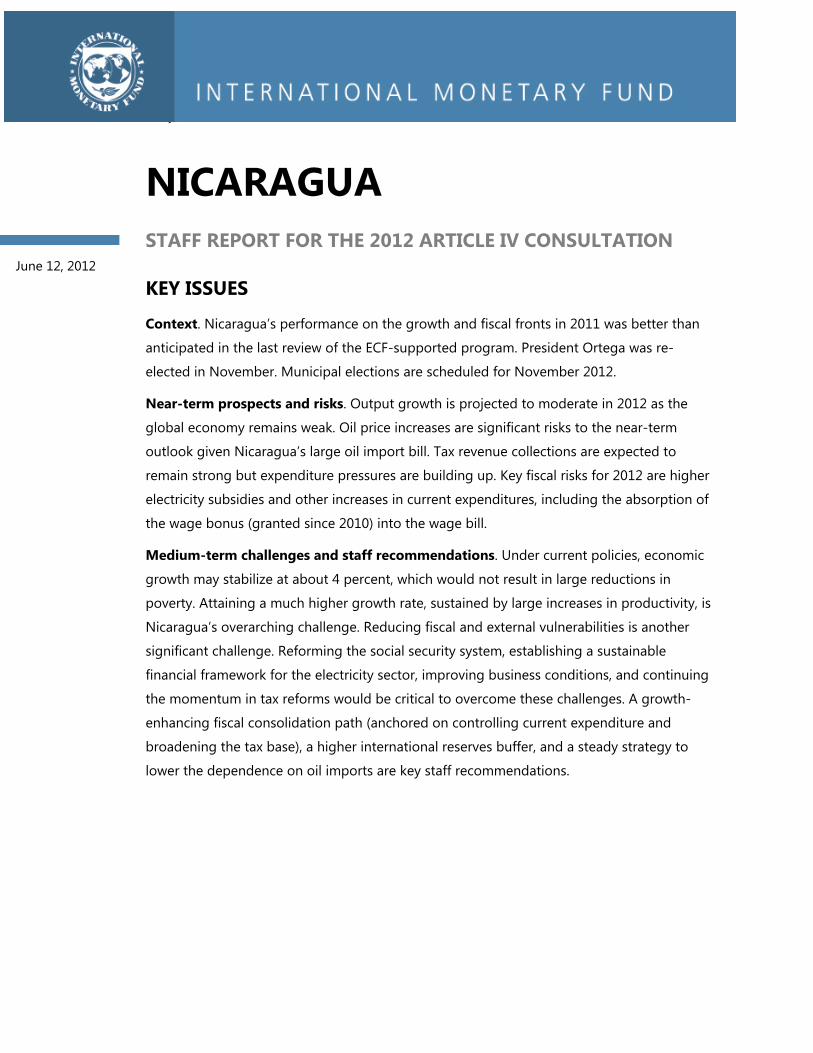
1. Despite moderate growth since
the mid 1990s, Nicaragua’s per capita
GDP is still well below its 1977 peak.
Sources: Nicaraguan authorities; and Fund staff calculations.
GDP per capita collapsed at the end of the
1970s and in the 1980s, as war and
inadequate economic policies took their
toll. Following a peaceful democratic
transition in 1990, economic growth
resumed, but at moderate rates. More
recently, the Nicaraguan economy has
shown signs of strength amid difficulties in
advanced economies, as adequate
macroeconomic policies (supported by the
Fund), favorable export prices, and
transfers from abroad helped maintain
economic stability. The implementation of
key structural reforms—including in tax
policy, and in the electricity and financial
sectors—also helped increase resilience.
2. Boosting growth to reduce
widespread poverty remains
Nicaragua’s key challenge. Despite a
steady growth performance in the last
decade and increased spending in social
and poverty-reducing policies,1 Nicaragua
remains one of the poorest countries in
the Western Hemisphere. Poverty rates
have declined from 48.3 percent of the
population in 2005 to 42.5 percent in
2009—still well above the Latin American
average (27 percent). Rural areas have
seen the largest poverty declines, but 63
percent of their population remained
below the poverty line in 2009. Extreme
poverty declined by only 3 percentage
points during the same period, resting at
15 percent of the population in 2009
(27 percent in rural areas).
1Poverty Reduction Strategy Paper (PRSP) update at http://www.imf.org/external/pubs/cat/longres.aspx?sk=25353.0
NICARAGUA 2012 ARTICLE IV REPORT
INTERNATIONAL MONETARY FUND 5
Sources: WEO; and Fund staff calculations. 1/Brazil, Chile, Colombia, Mexico, and Peru.
3. Economic and political
vulnerabilities are non-negligible.
External financial flows remain critical to
finance very large trade and current
account deficits. This makes resources
from foreign donors and IFIs particularly
important for Nicaragua’s external viability.
On the political front, President Ortega
was reelected for another term in
November 2011 amid critical reports on
the electoral process by international
observers; the President’s party now has a
comfortable majority in Congress and a
strong influence on other decision bodies,
including the judiciary. Most donors and
international observers insist on the need
of reforming the electoral system before
the municipal elections, currently
scheduled for November 2012.2
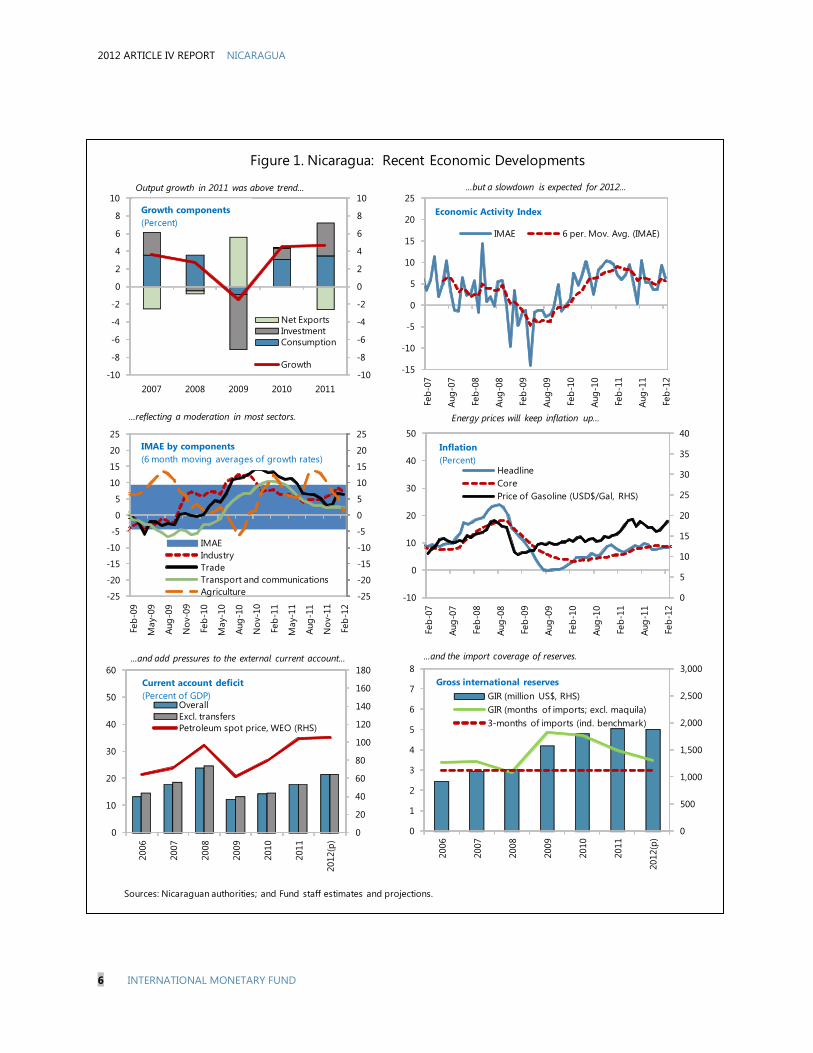
RECENT ECONOMIC DEVELOPMENTS 4. Economic performance in 2011
was stronger than previously envisaged
(Figure 1). Real GDP grew 4.7 percent in
2011 (compared to a 4-percent projection
at the time of the final review of the ECF
arrangement).³ Robust consumption and
investment were the key growth drivers on
the demand side, while construction and
manufacturing performed strongly on the
supply side. This said, supply-side
indicators showed some deceleration in
activity at the turn of the year. Inflationary
2 Budget support from traditional donors and the World Bank was suspended following reports of irregularities in the 2008 municipal elections.
pressures abated somewhat to 8 percent
by end 2011, as world commodity prices
eased. The exchange rate crawl remained
at 5 percent per year. 3
5. The fiscal outturn was
substantially stronger than anticipated
in September 2011. At the central
government level, the over performance
was explained by larger-than-projected
restraint in current spending and public
investment as a ratio to GDP. As a result,
3 IMF Country Report No. 11/322 (http://www.imf.org/external/pubs/cat/longres.aspx?sk=25352.0).
02,0004,0006,0008,000
10,00012,00014,00016,000
Nic
arag
ua
Hon
dura
s
Gua
tem
ala
El S
alva
dor
Dom
inic
an R
epub
lic
Cost
a Ri
ca
LA5
1/
Pana
ma
GDP per capita, 2011(Purchasing-power-parity dollars)
2012 ARTICLE IV REPORT NICARAGUA
6 INTERNATIONAL MONETARY FUND
Figure 1. Nicaragua: Recent Economic Developments
Sources: Nicaraguan authorities; and Fund staff estimates and projections.
-10
-8
-6
-4
-2
0
2
4
6
8
10
-10
-8
-6
-4
-2
0
2
4
6
8
10
2007 2008 2009 2010 2011
Net ExportsInvestmentConsumption
Growth
Growth components(Percent)
-15
-10
-5
0
5
10
15
20
25
Feb-
07
Aug-
07
Feb-
08
Aug-
08
Feb-
09
Aug-
09
Feb-
10
Aug-
10
Feb-
11
Aug-
11
Feb-
12
IMAE 6 per. Mov. Avg. (IMAE)
-25
-20
-15
-10
-5
0
5
10
15
20
25
-25
-20
-15
-10
-5
0
5
10
15
20
25
Feb-
09
May
-09
Aug-
09
Nov
-09
Feb-
10
May
-10
Aug-
10
Nov
-10
Feb-
11
May
-11
Aug-
11
Nov
-11
Feb-
12
IMAEIndustryTradeTransport and communicationsAgriculture
IMAE by components(6 month moving averages of growth rates)
0
20
40
60
80
100
120
140
160
180
0
10
20
30
40
50
60
2006
2007
2008
2009
2010
2011
2012
(p)
OverallExcl. transfersPetroleum spot price, WEO (RHS)
0
500
1,000
1,500
2,000
2,500
3,000
0
1
2
3
4
5
6
7
8
2006
2007
2008
2009
2010
2011
2012
(p)
GIR (million US$, RHS)GIR (months of imports; excl. maquila)3-months of imports (ind. benchmark)
Gross international reserves
...but a slowdown is expected for 2012...
...reflecting a moderation in most sectors. Energy prices will keep inflation up...
Output growth in 2011 was above trend...
...and add pressures to the external current account... ...and the import coverage of reserves.
Current account deficit (Percent of GDP)
0
5
10
15
20
25
30
35
40
-10
0
10
20
30
40
50Fe
b-07
Aug-
07
Feb-
08
Aug-
08
Feb-
09
Aug-
09
Feb-
10
Aug-
10
Feb-
11
Aug-
11
Feb-
12
HeadlineCorePrice of Gasoline (USD$/Gal, RHS)
Economic Activity Index
Inflation(Percent)
NICARAGUA 2012 ARTICLE IV REPORT
INTERNATIONAL MONETARY FUND 7
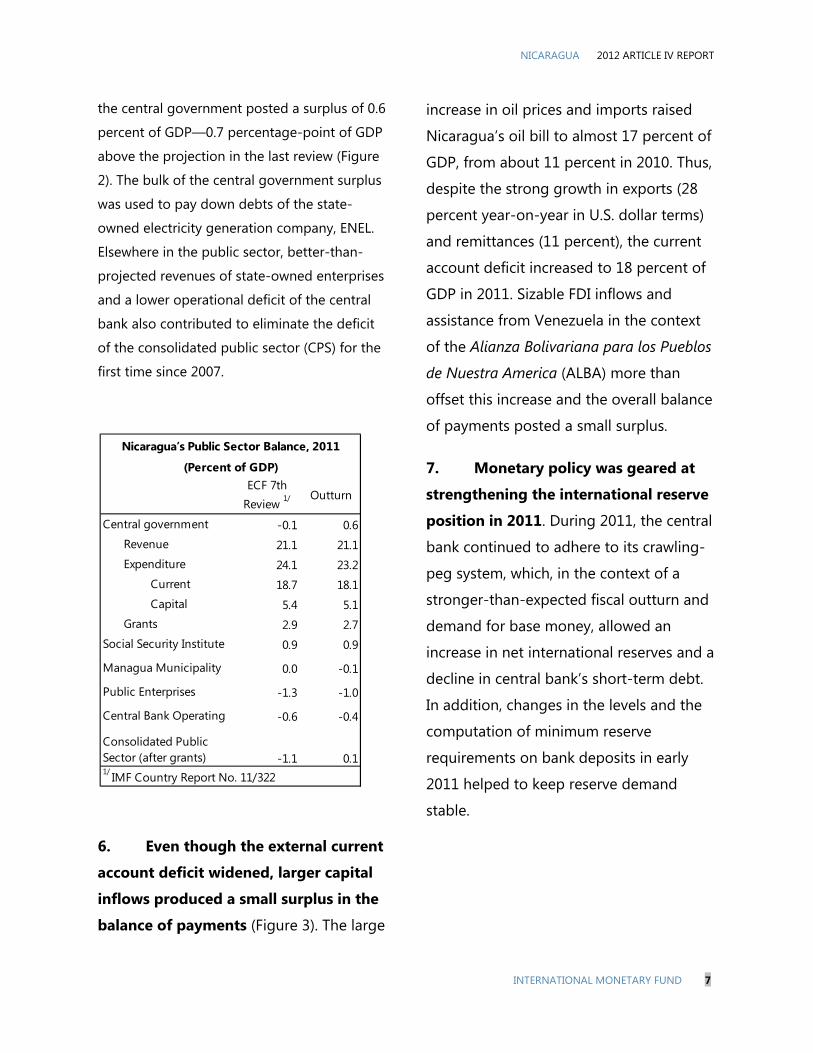
the central government posted a surplus of 0.6
percent of GDP—0.7 percentage-point of GDP
above the projection in the last review (Figure
2). The bulk of the central government surplus
was used to pay down debts of the state-
owned electricity generation company, ENEL.
Elsewhere in the public sector, better-than-
projected revenues of state-owned enterprises
and a lower operational deficit of the central
bank also contributed to eliminate the deficit
of the consolidated public sector (CPS) for the
first time since 2007.
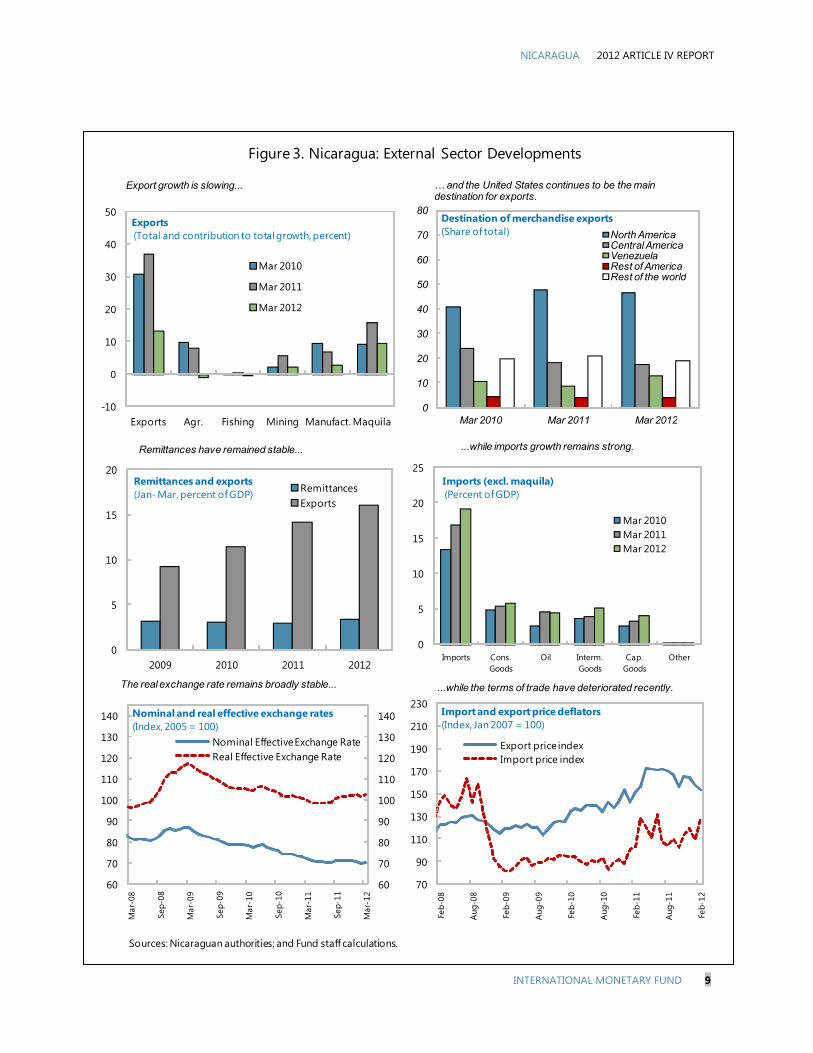
6. Even though the external current
account deficit widened, larger capital
inflows produced a small surplus in the
balance of payments (Figure 3). The large
increase in oil prices and imports raised
Nicaragua’s oil bill to almost 17 percent of
GDP, from about 11 percent in 2010. Thus,
despite the strong growth in exports (28
percent year-on-year in U.S. dollar terms)
and remittances (11 percent), the current
account deficit increased to 18 percent of
GDP in 2011. Sizable FDI inflows and
assistance from Venezuela in the context
of the Alianza Bolivariana para los Pueblos
de Nuestra America (ALBA) more than
offset this increase and the overall balance
of payments posted a small surplus.
7. Monetary policy was geared at
strengthening the international reserve
position in 2011. During 2011, the central
bank continued to adhere to its crawling-
peg system, which, in the context of a
stronger-than-expected fiscal outturn and
demand for base money, allowed an
increase in net international reserves and a
decline in central bank’s short-term debt.
In addition, changes in the levels and the
computation of minimum reserve
requirements on bank deposits in early
2011 helped to keep reserve demand
stable.
Central government -0.1 0.6 Revenue 21.1 21.1 Expenditure 24.1 23.2 Current 18.7 18.1 Capital 5.4 5.1 Grants 2.9 2.7Social Security Institute 0.9 0.9
Managua Municipality 0.0 -0.1
Public Enterprises -1.3 -1.0
Central Bank Operating -0.6 -0.4
Consolidated Public Sector (after grants) -1.1 0.11/ IMF Country Report No. 11/322
ECF 7th Review 1/ Outturn
(Percent of GDP)
Nicaragua’s Public Sector Balance, 2011

2012 ARTICLE IV REPORT NICARAGUA
8 INTERNATIONAL MONETARY FUND
Figure 2. Nicaragua: Selected Fiscal Indicators
Sources: Nicaraguan Authorities; and Fund staff estimates and projections.1/Includes the wage bonus of 2010-2012.2/The series reflect a transfer of salaries of teachers and service from municipalities to the central government budget that took place in 2007.
-7
-5
-3
-1
1
3
5
2007 2008 2009 2010 2011 2012(p)
After grants Before grants
Consolidated Public Sector Balance(Percent of GDP) 1/
0
20
40
60
80
100
120
140
160
2005 2006 2007 2008 2009 2010 2011 2012(p)
External Domestic
Public Debt(Percent of GDP)
0
1
2
3
4
5
6
7
2007 2008 2009 2010 2011 2012(p)
Capital expenditures
Operating expenditures
Revenue
Public Enterprises Revenue and Expenditure(Percent of GDP)
4
5
6
7
8
9
26
31
36
41
46
51
2007 2008 2009 2010 2011 2012(p)
Percent of GDP (RHS)
Percent of current expenditures
Central Government Wages and Salaries (Incl. wage bonus) 2/
-4
-3
-2
-1
0
1
2
3
4
5
20
21
22
23
24
25
26
27
28
29
30
2007 2008 2009 2010 2011 2012(p)
Revenue and grantsExpendituresOverall balance (after grants) (RHS)
Central Government Balance(Percent of GDP)
The central government balance after grants has returned to pre-crisis levels...
...and so has the overall fiscal balance.
Investment in the energy sector will increase public enterprises deficit...
...although the share of wages and salaries in total spending is declining.
The 2012 budget envisages a rise in current expenditures...
...but the public debt ratio will continue its gradual decline.
4
5
6
7
8
9
10
11
12
20
21
22
23
24
25
26
27
28
2007 2008 2009 2010 2011 2012(p)
Primary expendituresTotalCapital expenditure (RHS)
Central Government Expenditures(Percent of GDP) 1/
NICARAGUA 2012 ARTICLE IV REPORT
INTERNATIONAL MONETARY FUND 9
Figure 3. Nicaragua: External Sector Developments
Sources: Nicaraguan authorities; and Fund staff calculations.
-10
0
10
20
30
40
50
Exports Agr. Fishing Mining Manufact. Maquila
Exports (Total and contribution to total growth, percent)
Mar 2010
Mar 2011
Mar 2012
0
10
20
30
40
50
60
70
80
Mar 2010 Mar 2011 Mar 2012
Destination of merchandise exports(Share of total) North America
Central AmericaVenezuelaRest of AmericaRest of the world
0
5
10
15
20
2009 2010 2011 2012
Remittances and exports (Jan- Mar, percent of GDP) Remittances
Exports
0
5
10
15
20
25
Imports Cons. Goods
Oil Interm. Goods
Cap. Goods
Other
Imports (excl. maquila)(Percent of GDP)
Mar 2010Mar 2011Mar 2012
60
70
80
90
100
110
120
130
140
60
70
80
90
100
110
120
130
140
Mar
-08
Sep-
08
Mar
-09
Sep-
09
Mar
-10
Sep-
10
Mar
-11
Sep-
11
Mar
-12
Nominal and real effective exchange rates(Index, 2005 = 100)
Nominal Effective Exchange RateReal Effective Exchange Rate
Export growth is slowing... … and the United States continues to be the main destination for exports.
Remittances have remained stable... ...while imports growth remains strong.
The real exchange rate remains broadly stable... ...while the terms of trade have deteriorated recently.
70
90
110
130
150
170
190
210
230
Feb-
08
Aug
-08
Feb-
09
Aug
-09
Feb-
10
Aug
-10
Feb-
11
Aug
-11
Feb-
12Import and export price deflators(Index, Jan 2007 = 100)
Export price indexImport price index
2012 ARTICLE IV REPORT NICARAGUA
10 INTERNATIONAL MONETARY FUND
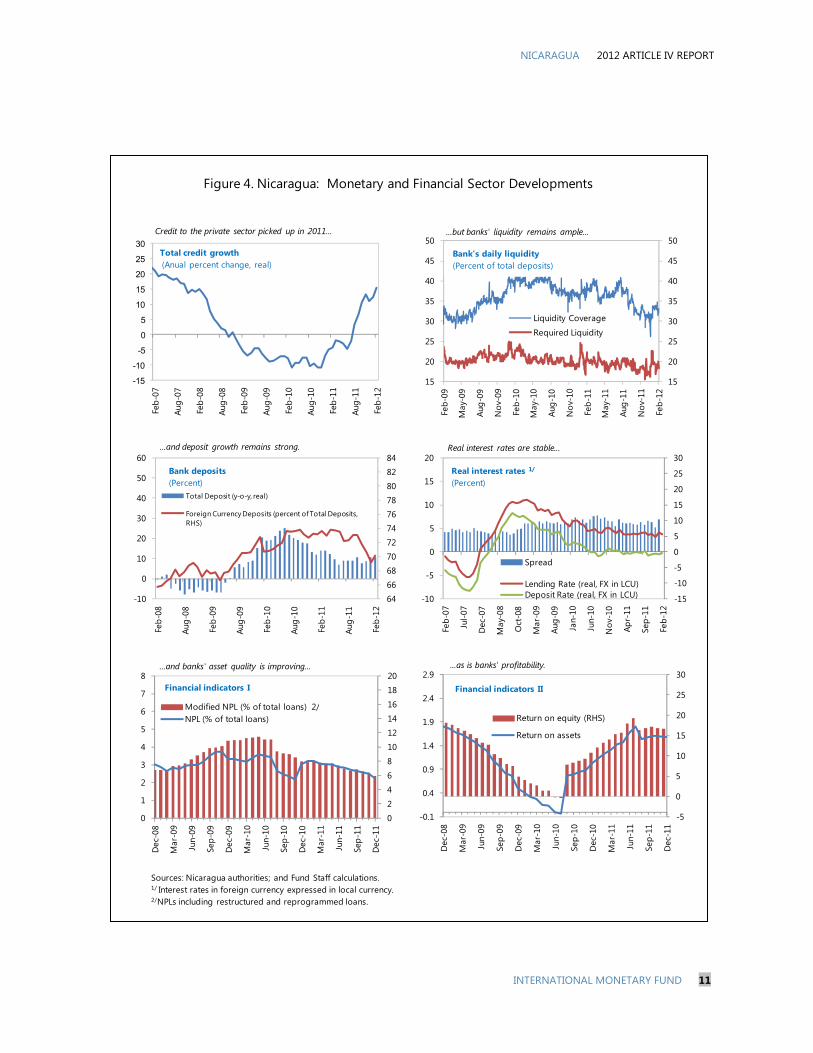
8. Banks’ balance sheets continued
to strengthen while credit growth
picked up (Figure 4). Nonperforming
loans ratios declined as banks’ profitability
improved and deposits (in local and
foreign currency) continued to rise. At the
same time, bank lending, especially to
trade and agriculture, picked up
significantly towards the end of the year.
OUTLOOK AND RISKS
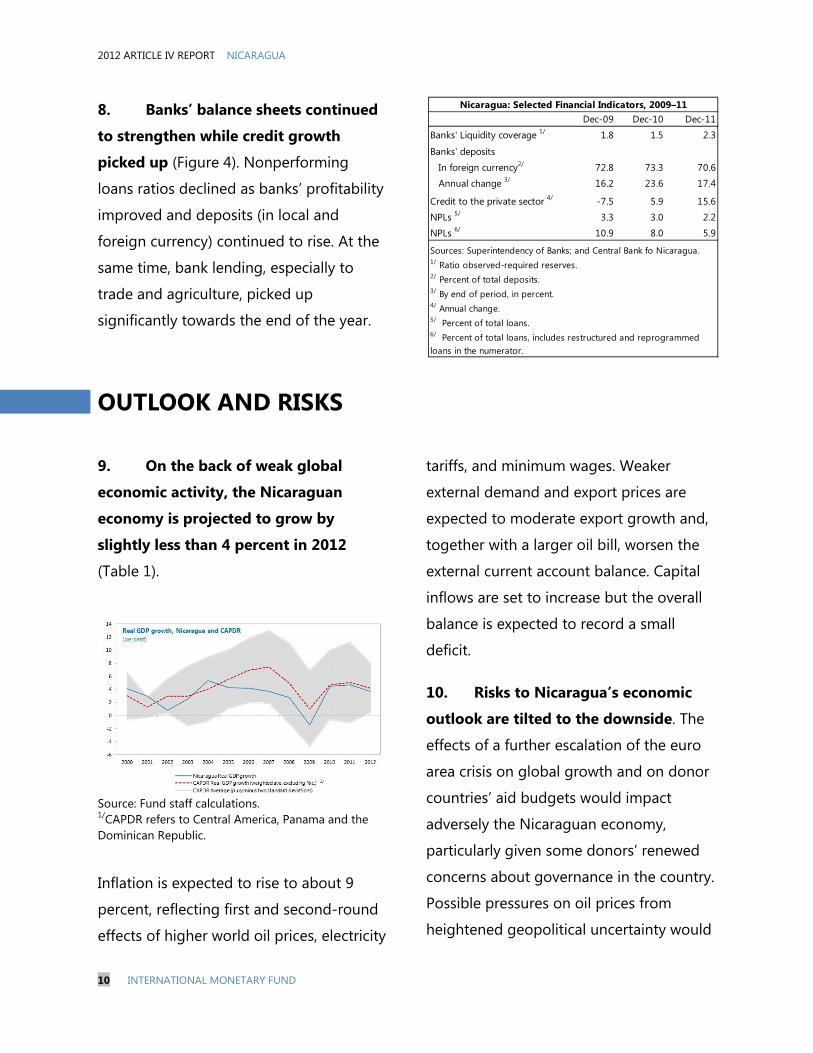
9. On the back of weak global
economic activity, the Nicaraguan
economy is projected to grow by
slightly less than 4 percent in 2012
(Table 1).
Source: Fund staff calculations. 1/CAPDR refers to Central America, Panama and the Dominican Republic.
Inflation is expected to rise to about 9
percent, reflecting first and second-round
effects of higher world oil prices, electricity
tariffs, and minimum wages. Weaker
external demand and export prices are
expected to moderate export growth and,
together with a larger oil bill, worsen the
external current account balance. Capital
inflows are set to increase but the overall
balance is expected to record a small
deficit.
10. Risks to Nicaragua’s economic
outlook are tilted to the downside. The
effects of a further escalation of the euro
area crisis on global growth and on donor
countries’ aid budgets would impact
adversely the Nicaraguan economy,
particularly given some donors’ renewed
concerns about governance in the country.
Possible pressures on oil prices from
heightened geopolitical uncertainty would
Dec-09 Dec-10 Dec-11
Banks' Liquidity coverage 1/ 1.8 1.5 2.3
Banks' deposits
In foreign currency2/ 72.8 73.3 70.6
Annual change 3/ 16.2 23.6 17.4
Credit to the private sector 4/ -7.5 5.9 15.6
NPLs 5/ 3.3 3.0 2.2
NPLs 6/ 10.9 8.0 5.9
Sources: Superintendency of Banks; and Central Bank fo Nicaragua. 1/ Ratio observed-required reserves.2/ Percent of total deposits.3/ By end of period, in percent.4/ Annual change.5/ Percent of total loans.
Nicaragua: Selected Financial Indicators, 2009–11
6/ Percent of total loans, includes restructured and reprogrammed loans in the numerator.
NICARAGUA 2012 ARTICLE IV REPORT
INTERNATIONAL MONETARY FUND 11
Figure 4. Nicaragua: Monetary and Financial Sector Developments
Sources: Nicaragua authorities; and Fund Staff calculations.1/ Interest rates in foreign currency expressed in local currency.2/NPLs including restructured and reprogrammed loans.
-15
-10
-5
0
5
10
15
20
25
30
Feb-
07
Aug-
07
Feb-
08
Aug-
08
Feb-
09
Aug-
09
Feb-
10
Aug-
10
Feb-
11
Aug-
11
Feb-
12
Total credit growth(Anual percent change, real)
Credit to the private sector picked up in 2011...
15
20
25
30
35
40
45
50
15
20
25
30
35
40
45
50
Feb-
09
May
-09
Aug-
09
Nov
-09
Feb-
10
May
-10
Aug-
10
Nov
-10
Feb-
11
May
-11
Aug-
11
Nov
-11
Feb-
12
...but banks' liquidity remains ample...
Liquidity Coverage
Required Liquidity
64
66
6870
72
7476
78
80
8284
-10
0
10
20
30
40
50
60
Feb-
08
Aug-
08
Feb-
09
Aug-
09
Feb-
10
Aug-
10
Feb-
11
Aug-
11
Feb-
12
...and deposit growth remains strong.
Total Deposit (y-o-y, real)
Foreign Currency Deposits (percent of Total Deposits, RHS)
Bank deposits(Percent)
-15
-10
-5
0
5
10
15
20
25
30
-10
-5
0
5
10
15
20Fe
b-07
Jul-0
7
Dec
-07
May
-08
Oct
-08
Mar
-09
Aug-
09
Jan-
10
Jun-
10
Nov
-10
Apr-
11
Sep-
11
Feb-
12
Real interest rates are stable...
Spread
Lending Rate (real, FX in LCU)Deposit Rate (real, FX in LCU)
Real interest rates 1/
(Percent)
-5
0
5
10
15
20
25
30
-0.1
0.4
0.9
1.4
1.9
2.4
2.9
Dec
-08
Mar
-09
Jun-
09
Sep-
09
Dec
-09
Mar
-10
Jun-
10
Sep-
10
Dec
-10
Mar
-11
Jun-
11
Sep-
11
Dec
-11
...as is banks' profitability.
Return on equity (RHS)
Return on assets
Bank's daily liquidity (Percent of total deposits)
0
2
4
6
8
10
12
14
16
18
20
0
1
2
3
4
5
6
7
8
Dec
-08
Mar
-09
Jun-
09
Sep-
09
Dec
-09
Mar
-10
Jun-
10
Sep-
10
Dec
-10
Mar
-11
Jun-
11
Sep-
11
Dec
-11
...and banks' asset quality is improving...
Modified NPL (% of total loans) 2/NPL (% of total loans)
Financial indicators I Financial indicators II
2012 ARTICLE IV REPORT NICARAGUA
12 INTERNATIONAL MONETARY FUND
also have a severe impact on the external
accounts. In addition, the magnitude and
nature of the oil-collaboration flows from
Venezuela could be affected following that
country’s presidential elections in October
2012.
11. Over the medium term, large
external current account deficits will
remain a key source of vulnerability.
Recent staff work gives support to the
view that Nicaragua’s potential output
growth rate is about 4 percent a year
under current policies (Selected Issues
Paper, Chapter 1). Given the high oil
dependency of the Nicaraguan economy,
this scenario implies large current account
deficits in the medium term, as planned
investment projects to move Nicaragua’s
energy matrix towards renewable fuel
sources will mature slowly (Table 6).
Sizable external inflows, including FDI, will
be necessary to finance those deficits and
to keep broadly adequate international
reserve buffers. Assuming the oil
cooperation scheme with Venezuela does
not change significantly, the ratio of
international reserves to imports is
expected to decline slowly until savings
from oil-substituting investments are large
enough to reverse this trend, which would
happen well after 5 years.
POLICY DISCUSSION
12. Discussions focused on policies and reforms to contain fiscal and external vulnerabilities, boost medium-term growth, and reduce poverty (Figure 5). The main recommendations of the previous Article IV Consultation (June 2010) included: (i) securing public debt sustainability by addressing pressures from the social security system and further broadening the tax base; (ii) reforming the financial framework for the energy sector; (iii) strengthening governance, including by providing greater oversight to the
micro-finance sector and enhancing the accountability of public institutions; and (iv) continuing to improve bank supervision and regulation, in particular risk-based and consolidated cross-border supervision. Since then, reform options for the pension and tax systems have been discussed with key stakeholders. In addition, the authorities enacted a law regulating the micro-finance sector,

NICARAGUA 2012 ARTICLE IV REPORT
INTERNATIONAL MONETARY FUND 13
0
2
4
6
8
10
12
0
2
4
6
8
10
12
El Salvador Panama Costa Rica Jamaica Mexico Guatemala Honduras Nicaragua Guyana
Improve quality of electricity supply.
Power outages in firms in a typical month (number)
0
5
10
15
20
25
30
35
0
5
10
15
20
25
30
35
Mexico Costa Rica Dominican Republic
Latin America & Caribbean
Panama El Salvador Honduras Nicaragua
Reduce poverty.
Poverty headcount ratio at $2 per day in PPP (Percent of population)
0
10
20
30
40
50
60
70
NIC Region NIC Region NIC Region NIC Region NIC Region NIC Region
Voice and Accountability
Political Stability
Government Effectiveness
Regulatory Quality
Rule of Law Control of Corruption
Improve governance and reduce corruption.
2010 Country's percentile rank (0-100)5/
0
1
2
3
4
5
6
7
8
Nicaragua Costa Rica El Savador Guatemala Mexico
Increase productivity.
Capital Labor TFPGrowth Decomposition2/
(Percent)
0
0.1
0.2
0.3
0.4
0.5
0.6
0.7
0.8
CHL URY BRA VEN ARG SLV LAC COL MEX GTM ECU NIC PER PRY BOL
Reduce labor market informality.
Sources: World Development Indicators; World Bank Governance Indicators; and Fund staff calculations.1/ Latest data available as of 2009-2010.2/ Average 1998-2006, Table 4 in Harberger, A., 2007, The Nicaraguan Economy: Situation and Prospects, manuscript.3/ Latest available figures from the countries' debt sustainability analysis exercise. 4/ Perry, G, O. Arias, and, P. Fajnzylber, 2010, Informality, Exit and Exclusion: World Bank, Washington, DC. 5/ Region: Costa Rica, Dominican Republic, El Salvador, Guatemala, Honduras and Panama.
Figure 5. Nicaragua: Medium-Term Challenges1/
0
10
20
30
40
50
60
70
Nicaragua Guyana Ghana Tanzania Bolivia Uganda Honduras
Present Value of public sector debt3/
(Percent of GDP)
Lower government debt.
Labor market informality4/
(Percent of urban employment)

2012 ARTICLE IV REPORT NICARAGUA
14 INTERNATIONAL MONETARY FUND
worked on guidelines to improve the administration of civil servants, and initiated bank stress testing. However, little has been done to reform the financial framework for the electricity sector, address critical governance problems, and reduce budget rigidities. Discussions
during the 2012 consultation revolved around similar themes, with a focus on how to move toward reform implementation in all key areas. A baseline medium-term macroeconomic framework prepared by the staff served as the basis for those discussions (Table 7).
A. Near-Term Policies
13. It was agreed that the overall public sector balance would deteriorate in 2012. At the central government level, revenues are expected to increase by 0.4 percent of GDP on the back of improvements in tax administration and a one-off court-mandated payment of overdue taxes by a large private sector company (0.2 percent of GDP). However, the central government balance will switch to a deficit of ½ percent of GDP reflecting higher expenditures on subsidies to electricity consumption (0.6 percent of GDP), on the government’s own electricity bill, and on public investment. In addition, the staff’s projection assumes that the wage bonus (so far financed by foreign grants) will be absorbed by the budget in the second half of the year (0.3 percent of GDP). Elsewhere in the public sector, lower income from investments of the social security institute is projected to reduce the social security surplus; higher spending in infrastructure and electricity will raise the
deficit of state-owned enterprises; and the central bank operating balance will worsen.
14. Staff noted that there are significant risks to the 2012 fiscal outlook. The authorities judged the risks to be balanced and indicated that they are preparing a 5-year fiscal plan reflecting the new government priorities. Changes to current budget allocations are still uncertain, but pressures for higher spending from the education, health and law enforcement sectors are significant. Ongoing negotiations to ensure the medium-term solvency of the electricity sector also may require higher-than-projected government transfers. Staff strongly recommended keeping the central government deficit at or below ½ percent of GDP in 2012, in particular by controlling spending on goods and services. The authorities agreed and indicated that the supplementary budget

NICARAGUA 2012 ARTICLE IV REPORT
INTERNATIONAL MONETARY FUND 15
that they will prepare by the middle of the year will be consistent with a small central government deficit in 2012.
15. Staff noted that monetary policy has contributed to protect the external position but cautioned about a fast weakening of reserve coverage. It was noted that Nicaragua’s crawling-peg regime had been successful at keeping
inflation rates at levels similar to those in other countries of the region and avoided large losses of international reserves.5 Moreover, the country’s price competitiveness has improved (Selected Issues Paper, Chapter 2). Staff noted, though, that the projected decline in reserve coverage for 2012 is a reason for concern going forward.
B. Medium-Term Challenges
Boosting output growth to reduce poverty 16. Staff noted that without a decisive reform effort, Nicaragua’s output growth is likely to remain dependent on low-productivity activities, which would be insufficient to reduce poverty significantly. With population expected to grow by 1½ percent a year through 2020, a real GDP growth rate of 4 percent would raise income per capita by only 2½ percent a year, which would translate into very slow poverty reduction. Moreover, Nicaragua’s growth performance has been underpinned by relatively robust investment rates but low productivity—a feature also noted by the authorities—suggesting there is room for improving
growth outturns (Selected Issues Paper, Chapter 1).
17. Staff argued that stronger institutions would yield productivity gains. Indicators suggest that Nicaragua lags behind its peers in terms of government accountability and effectiveness, regulatory quality, the rule of law, and the control of corruption (Figure 5 and Selected Issues Paper, Chapter 2). Key domestic stakeholders shared this assessment. The authorities agreed that there is room for improvement in a number of areas, but stressed that the sharp increase in FDI observed in recent years is a sign of improved business
4The crawling peg system has been in place since the mid-1990s. As fiscal consolidation evolved and the economy stabilized, the rate of crawl was progressively reduced.

2012 ARTICLE IV REPORT NICARAGUA
16 INTERNATIONAL MONETARY FUND
conditions and harbinger of future productivity gains. On the issue of accountability, the President and the Vice-President of the Council of Comptrollers pointed to difficulties in bringing cases against misuse of public resources to completion in the judicial system. On the issue of property rights, the Attorney General reported good progress toward regularizing land titles. Staff noted that decisive action to improve government accountability and effectiveness, punish the misuse of public resources, and strengthen property rights would improve perceptions about the quality of governance in the country, with positive effects on investment and growth.
18. Staff stressed that reforming the financial framework for the electricity sector is crucial for unleashing higher growth. Oil-based power plants produce about 70 percent of Nicaragua’s electricity, and tariffs to final consumers have been trailing fast-rising oil costs. Even after a 9-percent tariff increase in January 2012, staff estimates that a further 16 percent increase would be needed to close the gap with marginal costs. Staff argued that developing a tariff-setting framework that ensures the solvency of the electricity sector was critical to boost output growth. Such a framework would have to take into account medium-term costs, electricity losses during distribution, and transfers to poorer households (Selected Issues Paper,
Chapter 3). The authorities noted that negotiations with all stakeholders were underway, and they were confident that a multi-year framework for the sector would be agreed soon.
19. High labor and product market informality and low labor force skills are steep obstacles to productivity growth. Only about 25 percent of the Nicaraguan labor force is part of the social security system and the economy is populated by many small, low-productivity firms (Box 1). Those firms have little incentives (or means) to either grow or leave the informal sector, hence hindering economic growth. Staff welcomed the recent improvements in electronic filing of taxes and business licensing procedures, which will increase incentives to join the formal sector. In addition, it argued that creating more flexible social security schemes for segments of the workforce (with lower contribution rates but also lower benefits), could increase incentives to formal labor agreements. Low education levels and reported mismatches between university-level graduates and the needs of the marketplace also hurt productivity. Staff stressed that enhancing the coverage and quality of education would involve allocating more resources to primary, secondary, and technical education.
NICARAGUA 2012 ARTICLE IV REPORT
INTERNATIONAL MONETARY FUND 17
Box 1. Informality in Nicaragua’s Labor Market
Labor market informality is quite high in Nicaragua but follows a pattern observed in all Latin America. One definition of an informal worker is someone who does not contribute to the social security system. Data from the 2010 Permanent Household Survey show that informal workers in Nicaragua are prevalent (i) in smaller firms or in firms without formal book keeping; (ii) among the self-employed; and (iii) in rural areas (Figure 6). Informal labor arrangements also are more prevalent among women and younger workers. While these patterns are present in other Latin American countries, in Nicaragua informal employment accounts for more than 70 percent of urban employment—much higher than the 54 percent average in the Latin American region (Perry et al, 2010).1
Low income per capita is likely a key reason for the high proportion of informal workers in Nicaragua. Academic work has typified informality as either a “barrier” or a “choice” for workers. According to the “barrier” interpretation, informal workers are excluded from government benefits and the modern economy, either as a result of labor market segmentation or burdensome regulations (de Soto, 2000).2 According to the “choice”
hypothesis, workers choose to exit or not enter into formal arrangements following a cost-benefit analysis about the quality of government services and benefits, and the extent of institutional enforcement (Perry et al, 2010). Because an informal worker costs less to a firm, employers accept informality when the chances of detection are low. Both factors seem to be present in Nicaragua, as enforcement capacity is relatively weak, and the quality of government benefits is low. The high incidence of informality in Nicaragua is also consistent with its standing as the second-poorest country in the Western Hemisphere. Large levels of informality result in low productivity and create policy challenges. For instance, informality can be a barrier to firm growth, as employers try to avoid detection, thus preventing the full realization of economies of scale. Moreover, informality creates dual labor markets and a less equitable society. As in other places, reducing informality in Nicaragua should be a long-term goal and would require, inter alia, revamping the benefits of belonging to the formal workforce, reducing costs of doing business (including by simplifying the tax system), facilitating compliance and strengthening enforcement, enhancing government effectiveness and legitimacy, enforcing property rights, and improving the quality of education .
_________________________________________________
1/ Perry, G, O. Arias, and, P. Fajnzylber, 2010, Informality, Exit and Exclusion: World Bank, Washington, DC.
2/ De Soto, H., 2000, The Mystery of Capital: Basic Books, New York.

2012 ARTICLE IV REPORT NICARAGUA
18 INTERNATIONAL MONETARY FUND
Figure 6. Nicaragua: Labor Market Informality, 2010Q4 (Ratio of total employment)
Sources: Nicaraguan Statistical Institute (INIDE); and Fund staff calculations.
0.70
0.75
0.80
0.85
0.90
0.95
1.00
Urban Rural Male Female
Informality by sex and location
0.70
0.75
0.80
0.85
0.90
0.95
1.00
15-24 25-34 35-44 45-54 55-64 65+
Informality by age group
0.70
0.75
0.80
0.85
0.90
0.95
1.00
Low Income Medium-Income High-Income Very High-Income
Informality by income level
0.4
0.5
0.6
0.7
0.8
0.9
1.0
None Primary Secondary Technical University +
Informality by educational attainment
0.70
0.75
0.80
0.85
0.90
0.95
1.00
Yearly Occasional Seasonal Other Unknown
Informality by work tenure
0.1
0.3
0.5
0.7
0.9
1 2 - 5 6 - 9 10 -20 21 -50 51 -100 101 +Unknown
Informality by firm size (number of employees)
0.0
0.2
0.4
0.6
0.8
1.0
Written Permanent
Written Temporary
Oral Permanent
Oral Temporary
Unknown
Informality by type of labor contract
0.20.30.40.50.60.70.80.91.0
Accountant Informal Books
None Unknown
Informality by type of book-keeping
NICARAGUA 2012 ARTICLE IV REPORT
INTERNATIONAL MONETARY FUND 19
Staying the course of fiscal consolidation
20. It was agreed that medium-term fiscal consolidation is crucial to create policy space to mitigate the adverse effects of shocks. Staff discussed a scenario where the central government deficit declines to about 0.2 percent of GDP in the medium term, even after assuming that the wage bonus would be fully funded by the public budget. Central government investment is projected to edge up to 5.9 percent of GDP by 2016 to underpin the 4 percent growth projection. The projected tax revenue path reflects ongoing tax administration efforts to improve revenue collections. Overall, the assumed adjustment strategy (based on controlling current spending and improving tax administration without raising marginal taxes) would have limited negative effects on growth (Selected Issues Paper, Chapter 4). Outside the central government, the consolidation projection assumes gradual reductions in the deficit of state-owned enterprises and the central bank, while the social security system would put continued pressure on the fiscal accounts.
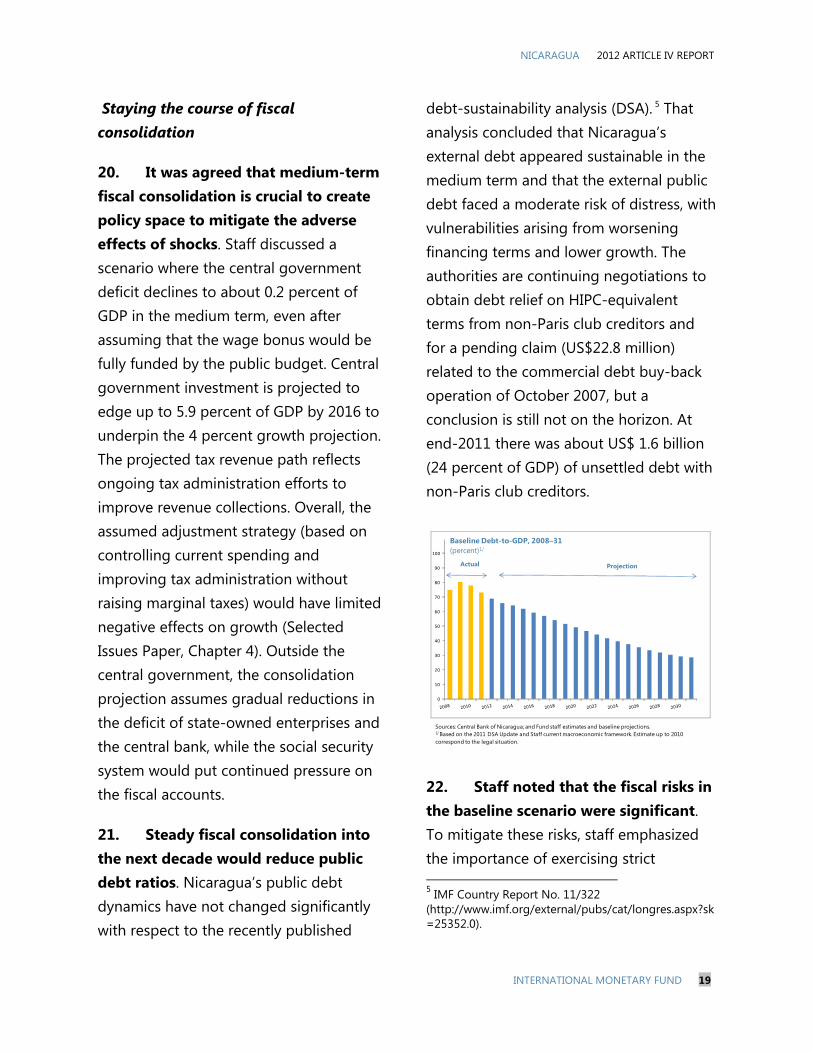
21. Steady fiscal consolidation into the next decade would reduce public debt ratios. Nicaragua’s public debt dynamics have not changed significantly with respect to the recently published
debt-sustainability analysis (DSA). 5 That analysis concluded that Nicaragua’s external debt appeared sustainable in the medium term and that the external public debt faced a moderate risk of distress, with vulnerabilities arising from worsening financing terms and lower growth. The authorities are continuing negotiations to obtain debt relief on HIPC-equivalent terms from non-Paris club creditors and for a pending claim (US$22.8 million) related to the commercial debt buy-back operation of October 2007, but a conclusion is still not on the horizon. At end-2011 there was about US$ 1.6 billion (24 percent of GDP) of unsettled debt with non-Paris club creditors.
22. Staff noted that the fiscal risks in the baseline scenario were significant. To mitigate these risks, staff emphasized the importance of exercising strict 5 IMF Country Report No. 11/322 (http://www.imf.org/external/pubs/cat/longres.aspx?sk=25352.0).
0
10
20
30
40
50
60
70
80
90
100
Baseline Debt-to-GDP, 2008–31 (percent)1/
ProjectionActual
Sources: Central Bank of Nicaragua; and Fund staff estimates and baseline projections.1/ Based on the 2011 DSA Update and Staff current macroeconomic framework. Estimate up to 2010 correspond to the legal situation.
2012 ARTICLE IV REPORT NICARAGUA
20 INTERNATIONAL MONETARY FUND
discipline in public enterprises and other public sector entities. Staff also noted that the size of municipal legislatures had greatly expanded, implying potential pressures on central government transfers. The authorities indicated that transfers to municipalities are capped by law at 10 percent of total tax revenues, out of which only 30 percent can be used for current spending. Staff stressed the fiscal risks associated with a possible sudden interruption in the oil-cooperation flows from Venezuela, given the social costs of ending the programs funded by them. The authorities remarked that the history of cooperation between the two countries did not justify considering this a serious risk.6
23. Further improvements in the tax system could generate additional revenues (Box 2). Staff advised the authorities to use the momentum created by the 2009 reform to make the tax system more equitable and efficient, in particular by eliminating remaining VAT exemptions. The authorities confirmed their intention of continuing negotiations with unions and private sector employers toward a
6The stock of debt resulting from the Venezuelan oil cooperation flows was contracted by a private sector cooperative (CARUNA). The authorities and CARUNA representatives noted that there are no government guarantees on this debt. According to CARUNA representatives, if their ability to service these loans is in jeopardy, CARUNA’s investment strategy would be reevaluated.
new set of reforms by the end of the year. Staff advised the authorities to use the direct tax system to protect vulnerable segments of society from a possible de facto increase in indirect taxes.
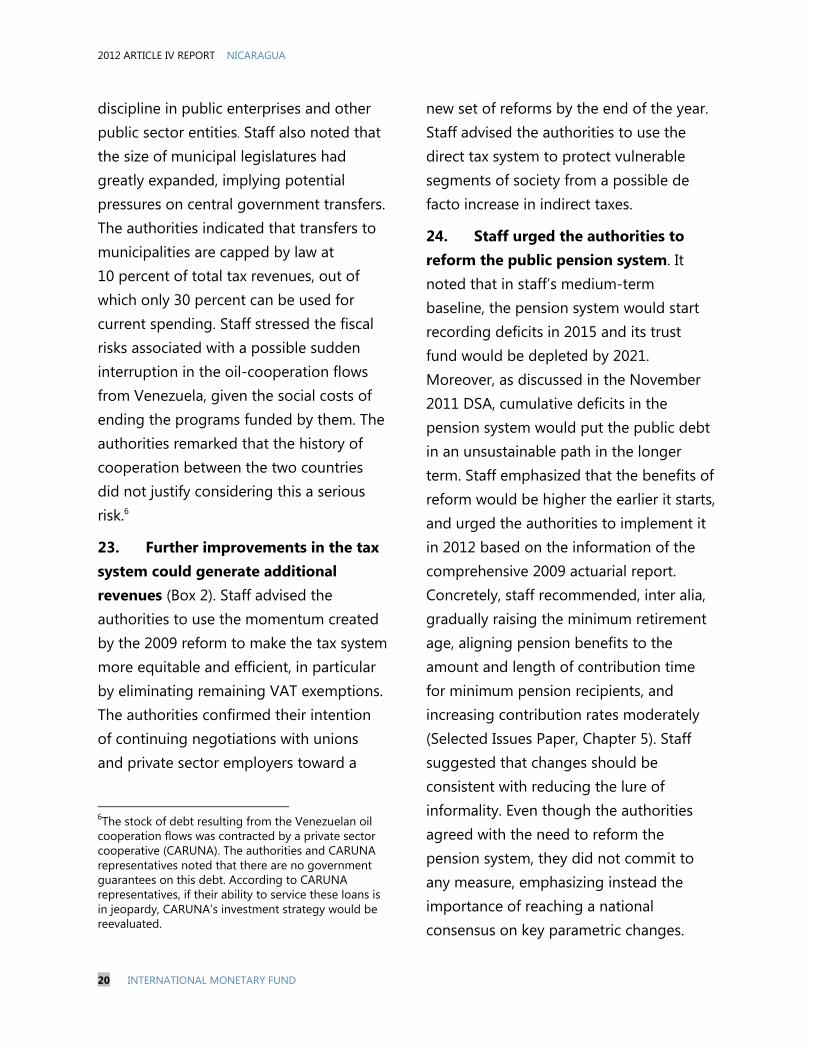
24. Staff urged the authorities to reform the public pension system. It noted that in staff’s medium-term baseline, the pension system would start recording deficits in 2015 and its trust fund would be depleted by 2021. Moreover, as discussed in the November 2011 DSA, cumulative deficits in the pension system would put the public debt in an unsustainable path in the longer term. Staff emphasized that the benefits of reform would be higher the earlier it starts, and urged the authorities to implement it in 2012 based on the information of the comprehensive 2009 actuarial report. Concretely, staff recommended, inter alia, gradually raising the minimum retirement age, aligning pension benefits to the amount and length of contribution time for minimum pension recipients, and increasing contribution rates moderately (Selected Issues Paper, Chapter 5). Staff suggested that changes should be consistent with reducing the lure of informality. Even though the authorities agreed with the need to reform the pension system, they did not commit to any measure, emphasizing instead the importance of reaching a national consensus on key parametric changes.

NICARAGUA 2012 ARTICLE IV REPORT
INTERNATIONAL MONETARY FUND 21
Box 2. The Benefits of a New Tax Reform
Recent reforms have improved the efficiency and equity of the tax system, and raised revenues. In November 2009, the Nicaraguan government sent to Congress a project of tax reform aiming at reducing exemptions and modernizing the tax system (through the introduction of a dual income tax system and rules to deal with transfer pricing and thin capitalization). The portion of the project that was approved, included the elimination of exemptions to excises, the broadening of the income tax base, and the introduction of a 1 percent minimum income tax on gross income. The reform was expected to increase tax revenues by over 1 percent of GDP. However, its greatest virtue was to improve the efficiency and equity of the tax system by eliminating exemptions without increasing tax rates.
Despite this progress, the Nicaraguan tax system continues to be plagued by a large number of loopholes, particularly in value-added (VAT) and corporate income (CIT) taxes. The continued granting of exemptions and tax preferences has narrowed both tax bases. Tax expenditures (which measure in a point in time how much revenue would be collected if all exemptions, benefits, and loopholes were eliminated) were estimated at 7.6 percent of GDP in 2010—one of the highest in Latin America.
The authorities are considering a new tax reform. The reform would aim at streamlining exemptions,
simplifying the tax system, and protecting the CIT base. The authorities plan to consult with different stakeholders before sending a proposal to Congress.
The key components of this new reform would yield important revenue gains. Tax revenues could increase by about 0.4 percent of GDP if exemptions of VAT on goods and services are reduced (including domestic airline tickets—which are taxed in most countries in the region—the consumption of potable water over a threshold, clothing, meat, fruits, and other foodstuff). Transfers through the direct tax system could alleviate the impact on the poor from ending some of these exemptions.
Additional measures could include (i) ending the differential tax treatment of interest income for companies; (ii) increasing withholding rates on payments to nonresidents; (iii) raising the personal income tax minimum exemption; (iv) introducing rules to address transfer pricing and thin capitalization; and (v) gradually lowering sectoral tax incentives. Authorities also could start taxing dividends from companies operating in free trade zones and exempted activities (as it is done in other countries of the region) to allow revenue-neutral reductions in current CIT rates. The tax system could also be simplified by replacing the very complex scheme for small businesses and reducing the number of goods and services subject to excises.
2012 ARTICLE IV REPORT NICARAGUA
22 INTERNATIONAL MONETARY FUND
Source: Fund staff calculations.
Strengthening the international reserves position
25. Staff argued that Nicaragua’s
balance of payments remained a key
source of vulnerability. Staff noted that
even if oil prices and concessional flows
remain broadly in line with its baseline
assumptions, the ratio of international
reserves to imports would trend down,
although the real exchange rate would be
broadly appropriate (Box 3 and Selected
Issues Paper, Chapter 2). However, if
concessional flows were substantially
lower and/or oil prices significantly higher,
Nicaragua’s balance of payments would be
under severe pressure. The authorities
recognized the vulnerability of the
Nicaraguan economy to increases in oil
prices but they did not see risks of a large
decline in concessional inflows. At the
same time, they agreed that a higher
reserve coverage accompanied by
structural reforms aimed at reducing the
economy’s dependency on oil imports and
concessional flows should be the
cornerstone of a strategy to ensure
medium-term external sustainability. Staff
noted that recurring increases in public
sector wages and minimum wages could
undermine competitiveness and
compromise external sustainability.
Alternative scenario
26. A scenario where reforms in the tax system, social security, and the financial framework for the electricity sector resulted in higher growth rates and lower fiscal and external vulnerabilities was discussed with the authorities. The scenario assumed that the additional revenues from the tax reforms currently under discussion would be channeled to public investment to boost growth. Electricity sector reform would lower central government transfers (thus, reducing the fiscal deficit) and raise incentives for oil-saving investment in the sector (hence, mitigating external risks). The social security reform would eliminate the main source of long-term fiscal pressure, and deepen considerably the medium-term fiscal adjustment. The scenario would generate higher medium-term growth of about ½ percentage point. Staff argued that a larger increase in growth rates would necessitate institutional reforms including improving
-20
-15
-10
-5
0
5
10
15
20
2011 2012 2013 2014 2015 2016 2017 2018 2019 2020 2021 2022 2023 2024 2025 2026 2027 2028 2029 2030 2031
Pension System Balance: Alternative Scenario(Percent of GDP)
Reform Scenario: Fund at Year's End
Reform Scenario: Pension System Balance
Current System: Fund at Year's End
Current System: Pension System Balance

NICARAGUA 2012 ARTICLE IV REPORT
INTERNATIONAL MONETARY FUND 23
Box 3. Exchange Rate Assessment and External Competitiveness
Nicaragua’s external competitiveness has improved steadily since the early 2000s. Nicaraguan exports have increased as a share of trading partners’ non-oil imports. In addition, the
share of maquila exports in the U.S. market has risen significantly—largely a result of the sector’s dynamism. Despite these competitiveness gains, Nicaragua has continued to post large current account deficits. In large part, those deficits are the result of the country’s extreme dependency on oil imports. Over the medium term, the projected increase in
alternative sources of energy is expected to reduce oil imports and gradually lower the external current account deficit. Until these improvements in energy generation materialize, dependence on external financing poses a risk to Nicaragua’s balance of payments. The high degree of dollarization of Nicaragua’s banking system is an additional risk.
Non-price competitiveness indicators are not that favorable. Nicaragua ranks at the bottom half of assessed countries in surveys of the cost of doing business and other structural conditions, and its score are generally lower than those of its neighbors. However, the country’s ranking in some key aspects has improved recently (Selected Issues Paper, Chapter 2). Under the staff’s baseline assumptions for oil prices and official assistance flows, Nicaragua's real exchange rate seems broadly in line with fundamentals (Selected Issues Paper, Chapter 2). The macroeconomic balance approach suggests an overvaluation of about 3 percent, while the external sustainability approach suggests that a depreciation of about 5 percent would be needed to stabilize the net foreign asset position of the country at its current, relatively high, negative level. These estimates need to be treated with caution as the staff’s baseline projects substantial structural changes beyond the time horizon considered in the standard CGER methodology. Real exchange rate movements are highly correlated with terms-of-trade fluctuations. Estimation of a simple cointegrating relationship between the two variables suggests that the real exchange rate is broadly in line with this fundamental.
-60
-50
-40
-30
-20
-10
0
10
20
30
40
-60
-50
-40
-30
-20
-10
0
10
20
30
40
2001 2002 2003 2004 2005 2006 2007 2008 2009 2010 2011
Current account balance and main components (in percent of GDP)
Private transfers (mainly remittances) Services & income balance
Trade balance Current account balance
4.4
4.5
4.6
4.7
4.8
4.9
2000Q2 2002Q3 2004Q4 2007Q1 2009Q2 2011Q3
Terms of Trade and the Real Effective Exchange Rate
Equilibrium real exchange rate based on cointegrating relation with Terms of Trade (in log)Real effective exchange rate (in log)
60
70
80
90
100
110
120
130
140
150
2000 2001 2002 2003 2004 2005 2006 2007 2008 2009 2010 2011
Market share and real effective exchange rate (Index, 2000 = 100)
Real exports over trading partners' real imports excl. oil
Real effective exchange rate (+ = appreciation)
2012 ARTICLE IV REPORT NICARAGUA
24 INTERNATIONAL MONETARY FUND
the quality of government services and institutions. The authorities agreed with using some of the additional resources from reforms to increase capital spending, while controlling current spending and deepening the fiscal adjustment.
Containing financial sector
vulnerabilities
27. Staff noted that Nicaragua’s financial system remains resilient but pockets of vulnerability had to be addressed. Nicaraguan banks have large liquidity buffers and—according to recent stress tests conducted jointly with Fund staff—hold sufficient capital to withstand unexpected declines in loan quality. However, deposits linked to Venezuela’s assistance programs are increasingly large and potentially volatile. The authorities noted that these dollar deposits are matched by liquid investments abroad, and pose little risk to the system. Staff welcomed the close coordination between the central bank and the superintendency of banks in conducting and evaluating stress tests, as well as in the context of the Committee for Crisis Resolution. Staff also welcomed the new on-site bank monitoring system and encouraged coordination across Central American bank supervisors to strengthen the supervision of domestic banks with a regional presence.
28. There has been progress in financial regulation and supervision. The new supervisory agency for micro-financial institutions has received budget resources to start operations and large financial cooperatives are expected to report their balance sheets on a comparable basis in the second half of 2012. Also, the authorities are discussing with key stakeholders a draft law creating a Financial Intelligence Unit (FIU), which would be in charge of preventing and combating anti-money laundering and the financing of terrorism (AML/CFT). Staff welcomed the initiative and the broad debate on the subject, but advised the authorities to use this opportunity to improve the AML/CFT framework in line with the Financial Action Task Force (FATF) standards, and the recommendations of the 2009 Caribbean Financial Action Task Force (CFATF) mutual evaluation report.
29. Staff recommended improving the infrastructure for monetary operations and the payments system, which would help deepening Nicaragua’s inter-bank market. Staff welcomed recent improvements in liquidity projections and the planned transition to weekly (from monthly) cash-flow transactions, in the context of an enhanced coordination between the central bank and the ministry of finance. Plans to improve the efficiency of Nicaragua’s payments system, including by

NICARAGUA 2012 ARTICLE IV REPORT
INTERNATIONAL MONETARY FUND 25
designating the central bank as its sole supervisor and regulator, defining rules and responsibilities for market participants, and developing a system for money transfers in real time were also welcomed. Staff noted that these
measures would help develop Nicaragua’s inter-bank market, thus helping to lower the large levels of liquidity in the banking system.
STATISTICAL ISSUES
30. An ongoing national accounts revision points to significantly higher GDP levels. This work, supported by technical assistance from CAPTAC–DR, uses improved source surveys and statistical procedures (including in the areas of labor market statistics, balance of payments, and monetary accounts) and a new base year (2006). Preliminary results show that nominal GDP for 2006 will be revised up significantly, suggesting that the fiscal and external ratios of recent years could be markedly lower than currently estimated. Staff strongly welcomed the methodological
improvements in the measurement of GDP and urged the authorities to publish a complete series with data up to 2011 as soon as possible.
31. Data for the consolidated public sector do not encompass all state-owned enterprises and public agencies. Staff noted that the current CPS definition excluded some large state-owned enterprises, which hampered a comprehensive analysis of government accounts. The authorities agreed that the CPS concept should be expanded.
STAFF APPRAISAL
32. Prudent economic management and some important reforms have helped Nicaragua establish a record of macroeconomic stability and growth in recent years. Helped by favorable export prices, resilient concessional assistance,
and strong FDI, the Nicaraguan economy rebounded rapidly from the 2008-09 crisis. Tax revenues surged following a well-conceived tax reform and, with the help of expenditure restraint, turned fiscal deficits into a surplus in 2011. In addition, inflation
2012 ARTICLE IV REPORT NICARAGUA
26 INTERNATIONAL MONETARY FUND
has remained stable and international reserves have increased.
33. Renewed public spending pressures should be contained. Adding the Venezuela-financed wage bonus to the government wage bill would materialize a fiscal risk flagged by staff in the past, and subsequently acknowledged by the authorities. Higher transfers to the electricity sector (including protecting the poor) and other spending pressures are also important risks. The authorities should resist accommodating all extra spending pressures, which would jeopardize their resolution to produce a central government deficit at or below ½ percent of GDP in 2012.
34. Attaining higher rates of growth to reduce poverty would require strengthening institutions, raising the effectiveness of public spending, and reducing labor market informality. Better auditing and supervision of government agencies, and further strengthening property rights would improve perceptions about institutions in the country. Reducing budget rigidities and earmarking is key to enhancing the efficiency and effectiveness of public spending (including in education). Continuing supervision of labor relations, reducing red tape for small and medium-sized firms, and introducing flexible social security schemes, would help reducing informality, thus raising incentives for
human capital accumulation and firms’ growth.
35. Improving infrastructure is fundamental to boost Nicaragua’s productive potential. On the electricity sector, developing a tariff-setting framework that takes into account medium-term costs, electricity losses during distribution, and transfers to the poor is urgently needed to bring long-term sustainability to the sector and attract new investments. More broadly, it is necessary to increase infrastructure investment, including with public-private partnerships.
36. Fiscal consolidation should be the cornerstone of the government’s economic policy. Given the large public investment needs, consolidation should be anchored on current spending restraint and broadening of the tax base. Staff urges the authorities to keep the momentum of recent tax reforms and work on eliminating remaining tax exemptions, reforming aspects of the corporate income tax, and reducing the complexity of the tax scheme for small businesses. The revenues obtained from these reforms could be used to raise public investment in infrastructure.
37. Reforming the pension system is necessary for fiscal sustainability. Changes in the pension benefits formula and gradual increases in retirement age should be adopted as early as possible.
NICARAGUA 2012 ARTICLE IV REPORT
INTERNATIONAL MONETARY FUND 27
More broadly, the reform should avoid increasing incentives for informality.
38. Reducing external vulnerabilities is another fundamental challenge. Plans to lower Nicaragua’s dependence on oil imports should be given high priority. Building higher international reserves buffers to increase protection against shocks to the balance of payments should be a key monetary policy objective. Containing minimum wage increases and enacting productivity-boosting reforms would help safeguarding external competitiveness.
39. The financial sector has been resilient, but remaining vulnerabilities should be addressed. Staff welcomes the progress in developing and implementing stress-testing models for the banking system. Improving regional collaboration across national supervisors would further
limit chances of banking stress. Staff welcomes current and planned measures to enhance Nicaragua’s payments system, which will help to develop an inter-bank market in the country. Staff also welcomes the progress in setting up the supervisor of microfinance corporations and the broad discussion on the creation of a FIU. Staff recommends carefully reviewing and revising the draft law creating this unit to ensure that the intended improvements are made in accordance with the FATF standards and the recommendations of the 2009 CFATF report. The publication of comparable balance sheets for large financial cooperatives will improve the transparency of the use of concessional flows, including those from Venezuela.
40. Staff recommends that the next Article IV consultation takes place on the standard 12-month cycle.
2012 ARTICLE IV REPORT NICARAGUA
28 INTERNATIONAL MONETARY FUND
Main export products: coffee, sugar (ethanol), meat, gold.GDP per capita (current U.S. dollars, 2010) 1,136 Share of national income of richest 10 percent 41.8GNI per capita 2010 (Atlas method, current US$) 1,110 Unemployment (percent labor force, 2010) 7.8GINI Index (2009) 46.0 Poverty rate (national pov. line, in percent, 2009) 42.5Population (millions, 2010) 5.8 Adult literacy rate (percent, 2009) 83.0Life expectancy at birth in years (2010) 74.0 Infant mortality rate (per 1,000 live births, 2010) 23.0
2013
Est.
Real sectorGDP growth 2.8 -1.5 4.5 4.7 3.7 4.0GDP deflator 15.0 3.9 6.0 11.1 8.6 7.9Consumer price inflation
End of period 13.8 0.9 9.2 8.0 8.6 7.5Period average 19.8 3.7 5.5 8.1 9.2 7.9
External sectorCurrent account -1,570 -832 -969 -1,311 -1,677 -1,591Exports of goods, f.o.b 2,530 2,390 3,157 4,057 4,474 4,828Imports of goods, f.o.b. -4,731 -3,929 -4,792 -6,125 -6,869 -7,197
Of which: oil -963 -676 -751 -1,216 -1,332 -1,229
Capital and financial account 1/ 1,535 1,224 1,164 1,374 1,653 1,692
Of which: FDI 626 434 508 968 829 799
Current account -24.6 -13.4 -14.7 -18.0 -21.4 -19.0Exports of goods, f.o.b 39.7 38.5 47.9 55.6 57.2 57.7Imports of goods, f.o.b. -74.2 -63.2 -72.7 -83.9 -87.7 -86.1
Of which: oil -15.1 -10.9 -11.4 -16.7 -17.0 -14.7
Capital and financial account 1/ 24.1 19.7 17.7 18.8 21.1 20.2
Of which: FDI 9.8 7.0 7.7 13.3 10.6 9.6
Fiscal sectorCentral government overall balance, after grants -1.2 -2.8 -1.0 0.6 -0.5 -0.4
Revenues 19.0 18.9 19.6 21.1 21.5 21.6
Expenditures2/ 23.2 24.1 23.0 23.2 24.4 23.9
Grants2/ 2.9 2.4 2.5 2.7 2.4 1.9
Rest of NFPS overall balance 0.4 0.9 0.4 -0.1 -0.9 -0.5Central bank balance -0.7 -1.2 -0.9 -0.4 -0.7 -0.4Combined public sector (CPS) balance, before grants -4.6 -6.5 -4.0 -2.9 -4.7 -3.5CPS overall balance, after grants -1.5 -3.1 -1.4 0.1 -2.1 -1.3Financing 1.5 3.1 1.4 -0.1 2.1 1.3
External 1.9 3.9 3.3 2.6 2.9 3.3Domestic (including BCN operating balance) -0.3 -0.8 -1.9 -2.7 -0.8 -1.8
Public sector debtTotal 74.8 80.1 78.0 71.8 68.7 65.8
Domestic 19.7 21.2 19.2 16.0 13.7 11.0
External3/ 55.1 58.9 58.8 55.8 55.1 54.8
Memorandum items:GDP (US$ million) 6,372 6,214 6,591 7,297 7,828 8,363
Gross reserves (US$ m)1/1,141 1,573 1,799 1,892 1,879 1,990
(in months of imports excl. maquilas) 2.9 4.9 4.7 4.0 3.5 3.6
Net international reserves1/ 1,030 1,423 1,632 1,711 1,697 1,809
Net international reserves (adjusted)4/ 710 811 917 1,023 1,002 1,096
SDR allocations … 165 165 165 165 165Reserves on foreign deposits 320 447 550 522 530 548
Short-term liabilities 111 150 167 182 181 181Oil price (average, US$/bbl) 97.0 61.8 79.0 104.0 114.7 110.0
Sources: Central Bank of Nicaragua; Ministry of Finance; World Bank; and Fund staff estimates and projections.
1/Starting in 2009, figures include the SDR allocation for SDR105.1 million (US$165 million) of September 2009.
3/Actual and projection are based on the 2011 DSA Update. Estimates up to 2010 correspond to the legal situation. 4/Includes deposit insurance fund (FOGADE) and excludes the September 2009 SDR allocation and reserve requirements of commercial banks in foreign currency.
2/Figures for 2010-12 include off-budget wage bonus.
(US$ millions)
(Percent of GDP; unless otherwise indicated)
Table 1. Nicaragua: Selected Social and Economic Indicators, 2008–13
I. Social and Demographic Indicators
II. Economic Indicators
(Percent)
2008 2009 20112010 2012
Proj.
NICARAGUA 2012 ARTICLE IV REPORT
INTERNATIONAL MONETARY FUND 29
2013 2014 2015 2016
Est.
Total Revenue 23,859 27,575 34,548 39,610 44,620 50,045 55,974 62,516
Tax 22,175 25,530 31,752 36,414 41,035 46,049 51,529 57,570
Income and property 7,865 8,481 11,335 13,108 14,682 16,364 18,458 20,654
VAT 3,885 4,028 4,605 5,226 5,790 6,546 7,178 8,102
Excises 3,339 5,541 6,070 6,875 7,858 8,850 9,998 11,126
Other 7,086 7,480 9,742 11,205 12,704 14,290 15,895 17,688
Nontax revenue 1,684 2,045 2,796 3,196 3,585 3,995 4,444 4,946
Total Expenditure 30,424 32,430 37,932 44,919 49,384 55,128 61,590 68,572
Current expenditures1/23,410 24,866 29,660 34,896 37,804 41,991 46,720 51,741
Wages and salaries2/8,615 9,603 11,294 12,325 13,450 14,836 16,253 18,086
of which: bonus 0 670 1,238 1,339 … … … …
Goods and services 4,652 4,863 6,341 7,891 8,065 8,989 10,101 11,240
Interest 1,711 1,991 2,262 2,783 2,930 3,185 3,601 3,757
of which: external3/553 595 709 886 1,068 1,228 1,346 1,407
Current transfers4/8,432 8,409 9,763 11,897 13,359 14,981 16,766 18,657
Capital Expenditures1/6,977 7,564 8,272 10,023 11,581 13,137 14,869 16,832
Domestically financed 904 1,699 2,023 2,650 2,895 3,457 4,102 4,850
Externally financed 6,073 5,866 6,249 7,373 8,685 9,680 10,767 11,982
Net lending 37 0 0 0 0 0 0 0
Overall balance (before grants) -6,564 -4,855 -3,384 -5,309 -4,771 -5,083 -5,616 -6,057
Grants5/3,080 3,504 4,389 4,358 3,929 4,379 4,871 5,420
of which: Project-related6/2,742 2,396 3,151 3,636 3,929 4,379 4,871 5,420
Primary balance (after grants) -1,774 639 3,267 1,832 2,088 2,481 2,856 3,121
Overall balance (after grants) -3,485 -1,351 1,006 -951 -842 -704 -745 -636
Net Financing 3,485 1,351 -1,006 951 842 704 745 636
External 4,019 3,458 3,266 3,332 4,473 4,593 4,771 5,142
Amortizations3/-911 -922 -865 -1,462 -1,396 -1,876 -2,352 -2,708
Disbursements 4,930 4,380 4,131 4,794 5,869 6,469 7,123 7,850
Project-related6/3,331 3,470 3,097 3,736 4,756 5,301 5,896 6,561
Budget support7/1,599 910 1,033 1,058 1,113 1,168 1,227 1,288
Domestic -535 -2,107 -4,272 -2,381 -3,631 -3,889 -4,026 -4,506
Central Bank -824 -2,204 -1,553 -366 -2,012 -2,998 -2,249 -2,538
Commercial Banks -19 66 -228 0 0 0 0 0
Amortizations (gross) -2,313 -2,864 -2,780 -5,228 -4,503 -4,149 -4,262 -4,291
Bonds issuance8/2,414 2,555 2,312 2,867 4,204 4,502 3,408 3,578
Others9/ 207 340 -2,023 345 -1,320 -1,245 -923 -1,255
Memorandum items:
Monitorable wage bill10/10,153 11,301 13,121 13,241 15,591 17,198 18,840 20,965
Poverty related expenditure 17,024 18,107 20,686 24,081 27,297 31,114 35,635 40,510
Central Government primary spending11/28,713 30,440 35,670 42,136 46,455 51,943 57,989 64,815
Sources: Central Bank of Nicaragua; Ministry of Finance; and Fund staff estimates and projections.
Note: Some aggregates may not add up due to rounding.
4/Current transfers in 2009 includes payment of arrears to the electricity sector for US$28 million.5/For 2010–12, it includes the off-budgetary grant from Venezuela to finance the wage bonus.6/In 2010 a project loan for US$17 million was reclassified as a grant.
8/It includes issuance of central government bonds to the social security institute (INSS).
11/It includes the extra-budgetary wage bonus.
Table 2a. Nicaragua: Operations of the Central Government, 2009–16
(Millions of Córdobas)
2009 2010 2011 2012
1/Starting in 2008, a portion of capital spending was reclassified to current spending, namely wages and goods and services.2/For 2010–12, it includes the off-budgetary wage bonus financed with Venezuela-related resources. From 2013 onward, the wage bonus is assumed to be absorbed by budget without counterpart of grant financing.
9/The program for 2011 includes a net reduction of debt of the consolidated public sector through the payment of outstanding obligations of state-owned enterprises in the electricity sector and in water and sewage provision. 10/It includes the wage bill of all decentralized agencies of the central government; and the extra-budgetary wage bonus.
7/The authorities' budget includes a US$45 million budget support loan from the IDB for 2012. This loan is still subject to approval by the IDBs' Board of Directors.
3/Debt service is measured on accrual basis.
Proj.
2012 ARTICLE IV REPORT NICARAGUA
30 INTERNATIONAL MONETARY FUND
2013 2014 2015 2016Est.
Total Revenue 18.9 19.6 21.1 21.5 21.6 21.7 21.8 21.9Tax 17.5 18.1 19.4 19.8 19.8 20.0 20.1 20.2
Income and property 6.2 6.0 6.9 7.1 7.1 7.1 7.2 7.2VAT 3.1 2.9 2.8 2.8 2.8 2.8 2.8 2.8Excises 2.6 3.9 3.7 3.7 3.8 3.8 3.9 3.9Other 5.6 5.3 6.0 6.1 6.1 6.2 6.2 6.2
Nontax and current transfers 1.3 1.5 1.7 1.7 1.7 1.7 1.7 1.7
Total Expenditure 24.1 23.0 23.2 24.4 23.9 23.9 24.0 24.0
Current expenditures1/ 18.5 17.7 18.1 18.9 18.3 18.2 18.2 18.1
Wages and salaries2/ 6.8 6.8 6.9 6.7 6.5 6.4 6.3 6.3of which: bonus 0.0 0.5 0.8 0.7 … … … …
Goods and services 3.7 3.5 3.9 4.3 3.9 3.9 3.9 3.9Interest 1.4 1.4 1.4 1.5 1.4 1.4 1.4 1.3
of which: external3/ 0.4 0.4 0.4 0.5 0.5 0.5 0.5 0.5
Current transfers4/ 6.7 6.0 6.0 6.5 6.5 6.5 6.5 6.5
Capital Expenditures1/ 5.5 5.4 5.1 5.4 5.6 5.7 5.8 5.9Domestically financed 0.7 1.2 1.2 1.4 1.4 1.5 1.6 1.7Externally financed 4.8 4.2 3.8 4.0 4.2 4.2 4.2 4.2
Net lending 0.0 0.0 0.0 0.0 0.0 0.0 0.0 0.0
Overall balance (before grants) -5.2 -3.4 -2.1 -2.9 -2.3 -2.2 -2.2 -2.1
Grants5/ 2.4 2.5 2.7 2.4 1.9 1.9 1.9 1.9
of which: Project-related4/ 2.2 1.7 1.9 2.0 1.9 1.9 1.9 1.9
Primary balance (after grants) -1.4 0.5 2.0 1.0 1.0 1.1 1.1 1.1Overall balance (after grants) -2.8 -1.0 0.6 -0.5 -0.4 -0.3 -0.3 -0.2
Net Financing 2.8 1.0 -0.6 0.5 0.4 0.3 0.3 0.2External 3.2 2.5 2.0 1.8 2.2 2.0 1.9 1.8
Amortizations3/ -0.7 -0.7 -0.5 -0.8 -0.7 -0.8 -0.9 -0.9Disbursements 3.9 3.1 2.5 2.6 2.8 2.8 2.8 2.8
Project-related6/ 2.6 2.5 1.9 2.0 2.3 2.3 2.3 2.3
Budget support7/ 1.3 0.6 0.6 0.6 0.5 0.5 0.5 0.5Domestic -0.4 -1.5 -2.6 -1.3 -1.8 -1.7 -1.6 -1.6
Central Bank -0.7 -1.6 -0.9 -0.2 -1.0 -1.3 -0.9 -0.9Commercial Banks 0.0 0.0 -0.1 0.0 0.0 0.0 0.0 0.0Amortizations (gross) -1.8 -2.0 -1.7 -2.8 -2.2 -1.8 -1.7 -1.5
Bonds issuance8/ 1.9 1.8 1.4 1.6 2.0 2.0 1.3 1.3
Others9/ 0.2 0.2 -1.2 0.2 -0.6 -0.5 -0.4 -0.4Memorandum items:
Monitorable wage bill10/ 8.0 8.0 8.0 7.2 7.5 7.5 7.3 7.3Poverty related expenditure 13.5 12.9 12.6 13.1 13.2 13.5 13.9 14.2
Central Government primary spending11/ 22.7 21.6 21.8 22.9 22.5 22.5 22.6 22.7
Sources: Central Bank of Nicaragua; Ministry of Finance; and Fund staff estimates and projections.
Note: Some aggregates may not add up due to rounding.
4/Current transfers in 2009 includes payment of arrears to the electricity sector for US$28 million.5/For 2010–12, it includes the off-budgetary grant from Venezuela to finance the wage bonus.6/In 2010 a project loan for US$17 million was reclassified as a grant.
8/It includes issuance of central government bonds to the social security institute (INSS).
11/It includes the extra-budgetary wage bonus.
Table 2b. Nicaragua: Operations of the Central Government, 2009–16(Percent of GDP)
2009 2010 2011 2012
2/For 2010–12, it includes the off-budgetary wage bonus financed with Venezuela-related resources. From 2013 onward, the wage bonus is assumed to be absorbed by budget without counterpart of grant financing.
9/The program for 2011 includes a net reduction of debt of the consolidated public sector through the payment of outstanding obligations of state-owned enterprises in the electricity sector and in water and sewage provision. 10/It includes the wage bill of all decentralized agencies of the central government; and the extra-budgetary wage bonus.
1/Starting in 2008, a portion of capital spending was reclassified to current spending, namely wages and goods and services.
3/Debt service is measured on accrual basis.
Proj.
7/The authorities' budget includes a US$45 million budget support loan from the IDB for 2012. This loan is still subject to approval by the IDBs' Board of Directors.
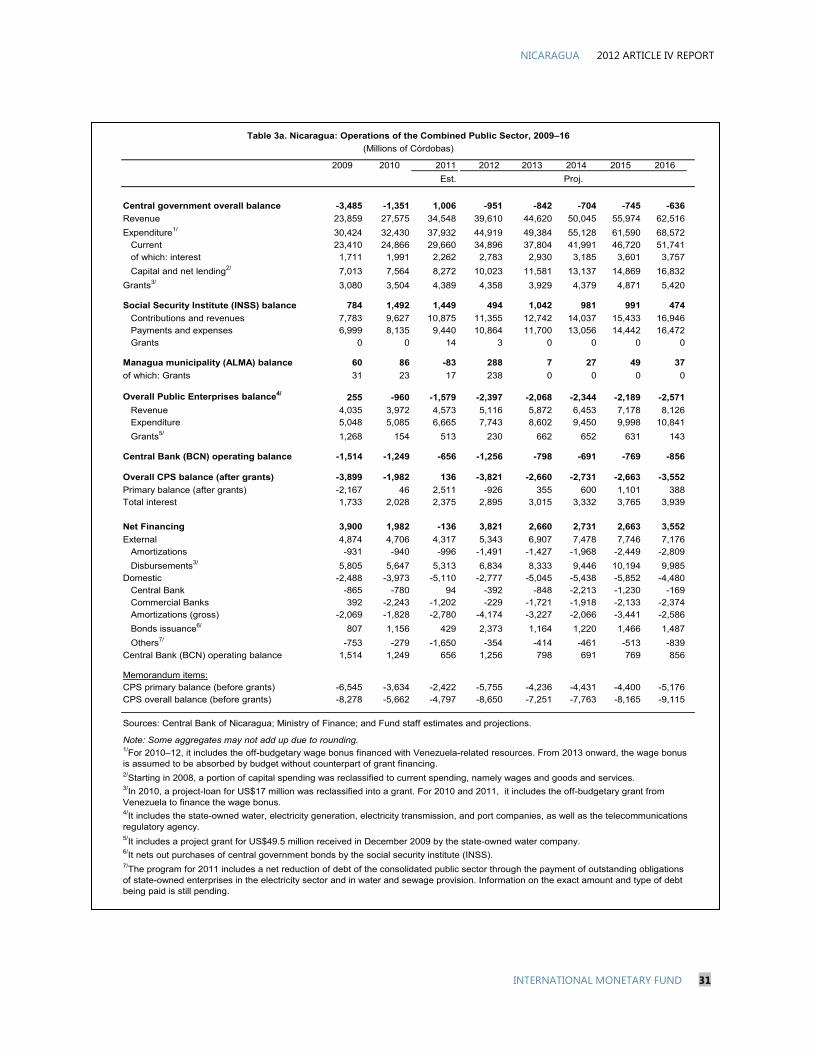
NICARAGUA 2012 ARTICLE IV REPORT
INTERNATIONAL MONETARY FUND 31
2013 2014 2015 2016
Est.
Central government overall balance -3,485 -1,351 1,006 -951 -842 -704 -745 -636
Revenue 23,859 27,575 34,548 39,610 44,620 50,045 55,974 62,516
Expenditure1/ 30,424 32,430 37,932 44,919 49,384 55,128 61,590 68,572Current 23,410 24,866 29,660 34,896 37,804 41,991 46,720 51,741of which: interest 1,711 1,991 2,262 2,783 2,930 3,185 3,601 3,757
Capital and net lending2/ 7,013 7,564 8,272 10,023 11,581 13,137 14,869 16,832
Grants3/ 3,080 3,504 4,389 4,358 3,929 4,379 4,871 5,420
Social Security Institute (INSS) balance 784 1,492 1,449 494 1,042 981 991 474
Contributions and revenues 7,783 9,627 10,875 11,355 12,742 14,037 15,433 16,946Payments and expenses 6,999 8,135 9,440 10,864 11,700 13,056 14,442 16,472Grants 0 0 14 3 0 0 0 0
Managua municipality (ALMA) balance 60 86 -83 288 7 27 49 37
of which: Grants 31 23 17 238 0 0 0 0
Overall Public Enterprises balance4/255 -960 -1,579 -2,397 -2,068 -2,344 -2,189 -2,571
Revenue 4,035 3,972 4,573 5,116 5,872 6,453 7,178 8,126Expenditure 5,048 5,085 6,665 7,743 8,602 9,450 9,998 10,841
Grants5/ 1,268 154 513 230 662 652 631 143
Central Bank (BCN) operating balance -1,514 -1,249 -656 -1,256 -798 -691 -769 -856
Overall CPS balance (after grants) -3,899 -1,982 136 -3,821 -2,660 -2,731 -2,663 -3,552
Primary balance (after grants) -2,167 46 2,511 -926 355 600 1,101 388Total interest 1,733 2,028 2,375 2,895 3,015 3,332 3,765 3,939
Net Financing 3,900 1,982 -136 3,821 2,660 2,731 2,663 3,552
External 4,874 4,706 4,317 5,343 6,907 7,478 7,746 7,176Amortizations -931 -940 -996 -1,491 -1,427 -1,968 -2,449 -2,809
Disbursements3/ 5,805 5,647 5,313 6,834 8,333 9,446 10,194 9,985Domestic -2,488 -3,973 -5,110 -2,777 -5,045 -5,438 -5,852 -4,480
Central Bank -865 -780 94 -392 -848 -2,213 -1,230 -169Commercial Banks 392 -2,243 -1,202 -229 -1,721 -1,918 -2,133 -2,374Amortizations (gross) -2,069 -1,828 -2,780 -4,174 -3,227 -2,066 -3,441 -2,586
Bonds issuance6/ 807 1,156 429 2,373 1,164 1,220 1,466 1,487
Others7/ -753 -279 -1,650 -354 -414 -461 -513 -839Central Bank (BCN) operating balance 1,514 1,249 656 1,256 798 691 769 856
Memorandum items:CPS primary balance (before grants) -6,545 -3,634 -2,422 -5,755 -4,236 -4,431 -4,400 -5,176CPS overall balance (before grants) -8,278 -5,662 -4,797 -8,650 -7,251 -7,763 -8,165 -9,115
Sources: Central Bank of Nicaragua; Ministry of Finance; and Fund staff estimates and projections.
Note: Some aggregates may not add up due to rounding.
5/It includes a project grant for US$49.5 million received in December 2009 by the state-owned water company. 6/It nets out purchases of central government bonds by the social security institute (INSS).
1/For 2010–12, it includes the off-budgetary wage bonus financed with Venezuela-related resources. From 2013 onward, the wage bonus is assumed to be absorbed by budget without counterpart of grant financing.2/Starting in 2008, a portion of capital spending was reclassified to current spending, namely wages and goods and services.3/In 2010, a project-loan for US$17 million was reclassified into a grant. For 2010 and 2011, it includes the off-budgetary grant from Venezuela to finance the wage bonus.4/It includes the state-owned water, electricity generation, electricity transmission, and port companies, as well as the telecommunications regulatory agency.
7/The program for 2011 includes a net reduction of debt of the consolidated public sector through the payment of outstanding obligations of state-owned enterprises in the electricity sector and in water and sewage provision. Information on the exact amount and type of debt being paid is still pending.
Proj.
Table 3a. Nicaragua: Operations of the Combined Public Sector, 2009–16
(Millions of Córdobas)
2009 2010 2011 2012
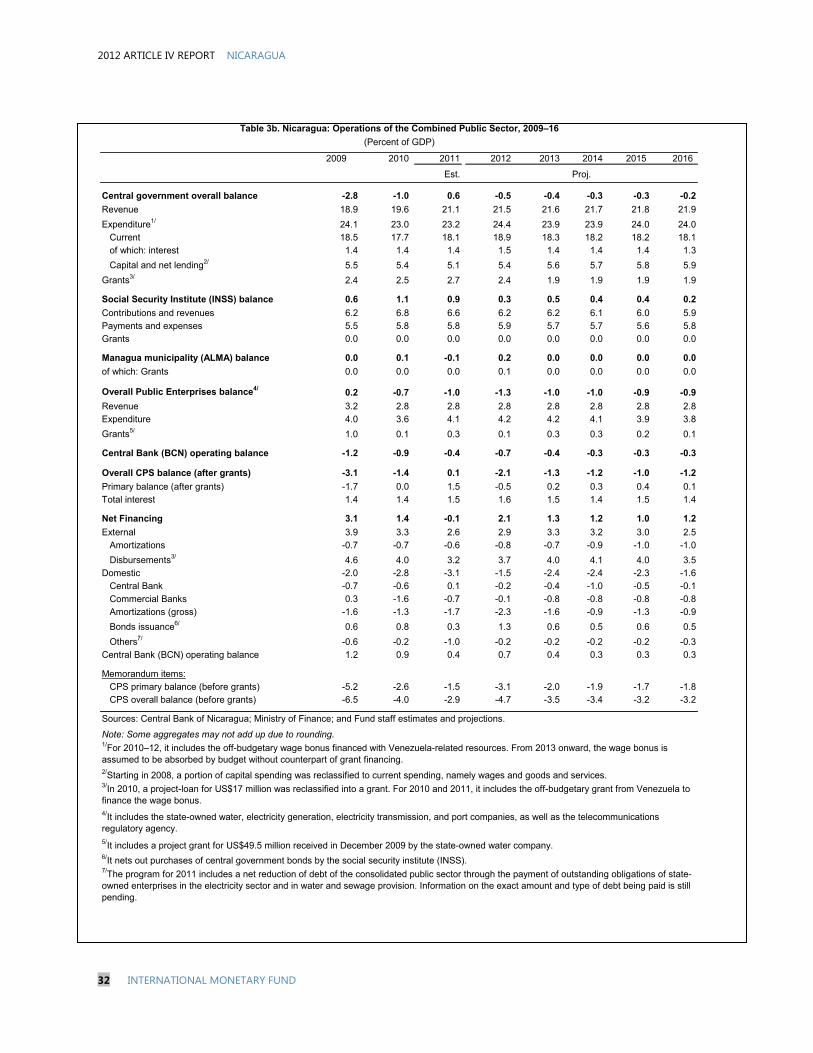
2012 ARTICLE IV REPORT NICARAGUA
32 INTERNATIONAL MONETARY FUND
2013 2014 2015 2016
Est.
Central government overall balance -2.8 -1.0 0.6 -0.5 -0.4 -0.3 -0.3 -0.2
Revenue 18.9 19.6 21.1 21.5 21.6 21.7 21.8 21.9
Expenditure1/ 24.1 23.0 23.2 24.4 23.9 23.9 24.0 24.0Current 18.5 17.7 18.1 18.9 18.3 18.2 18.2 18.1of which: interest 1.4 1.4 1.4 1.5 1.4 1.4 1.4 1.3
Capital and net lending2/ 5.5 5.4 5.1 5.4 5.6 5.7 5.8 5.9
Grants3/ 2.4 2.5 2.7 2.4 1.9 1.9 1.9 1.9
Social Security Institute (INSS) balance 0.6 1.1 0.9 0.3 0.5 0.4 0.4 0.2
Contributions and revenues 6.2 6.8 6.6 6.2 6.2 6.1 6.0 5.9Payments and expenses 5.5 5.8 5.8 5.9 5.7 5.7 5.6 5.8Grants 0.0 0.0 0.0 0.0 0.0 0.0 0.0 0.0
Managua municipality (ALMA) balance 0.0 0.1 -0.1 0.2 0.0 0.0 0.0 0.0
of which: Grants 0.0 0.0 0.0 0.1 0.0 0.0 0.0 0.0
Overall Public Enterprises balance4/ 0.2 -0.7 -1.0 -1.3 -1.0 -1.0 -0.9 -0.9
Revenue 3.2 2.8 2.8 2.8 2.8 2.8 2.8 2.8Expenditure 4.0 3.6 4.1 4.2 4.2 4.1 3.9 3.8
Grants5/ 1.0 0.1 0.3 0.1 0.3 0.3 0.2 0.1
Central Bank (BCN) operating balance -1.2 -0.9 -0.4 -0.7 -0.4 -0.3 -0.3 -0.3
Overall CPS balance (after grants) -3.1 -1.4 0.1 -2.1 -1.3 -1.2 -1.0 -1.2
Primary balance (after grants) -1.7 0.0 1.5 -0.5 0.2 0.3 0.4 0.1Total interest 1.4 1.4 1.5 1.6 1.5 1.4 1.5 1.4
Net Financing 3.1 1.4 -0.1 2.1 1.3 1.2 1.0 1.2
External 3.9 3.3 2.6 2.9 3.3 3.2 3.0 2.5Amortizations -0.7 -0.7 -0.6 -0.8 -0.7 -0.9 -1.0 -1.0
Disbursements3/ 4.6 4.0 3.2 3.7 4.0 4.1 4.0 3.5Domestic -2.0 -2.8 -3.1 -1.5 -2.4 -2.4 -2.3 -1.6
Central Bank -0.7 -0.6 0.1 -0.2 -0.4 -1.0 -0.5 -0.1Commercial Banks 0.3 -1.6 -0.7 -0.1 -0.8 -0.8 -0.8 -0.8Amortizations (gross) -1.6 -1.3 -1.7 -2.3 -1.6 -0.9 -1.3 -0.9
Bonds issuance6/ 0.6 0.8 0.3 1.3 0.6 0.5 0.6 0.5
Others7/ -0.6 -0.2 -1.0 -0.2 -0.2 -0.2 -0.2 -0.3Central Bank (BCN) operating balance 1.2 0.9 0.4 0.7 0.4 0.3 0.3 0.3
Memorandum items:CPS primary balance (before grants) -5.2 -2.6 -1.5 -3.1 -2.0 -1.9 -1.7 -1.8CPS overall balance (before grants) -6.5 -4.0 -2.9 -4.7 -3.5 -3.4 -3.2 -3.2
Sources: Central Bank of Nicaragua; Ministry of Finance; and Fund staff estimates and projections.
Note: Some aggregates may not add up due to rounding.
5/It includes a project grant for US$49.5 million received in December 2009 by the state-owned water company. 6/It nets out purchases of central government bonds by the social security institute (INSS).
2/Starting in 2008, a portion of capital spending was reclassified to current spending, namely wages and goods and services.
7/The program for 2011 includes a net reduction of debt of the consolidated public sector through the payment of outstanding obligations of state-owned enterprises in the electricity sector and in water and sewage provision. Information on the exact amount and type of debt being paid is still pending.
Table 3b. Nicaragua: Operations of the Combined Public Sector, 2009–16
2009 2010 2011 2012
(Percent of GDP)
1/For 2010–12, it includes the off-budgetary wage bonus financed with Venezuela-related resources. From 2013 onward, the wage bonus is assumed to be absorbed by budget without counterpart of grant financing.
4/It includes the state-owned water, electricity generation, electricity transmission, and port companies, as well as the telecommunications regulatory agency.
Proj.
3/In 2010, a project-loan for US$17 million was reclassified into a grant. For 2010 and 2011, it includes the off-budgetary grant from Venezuela to finance the wage bonus.
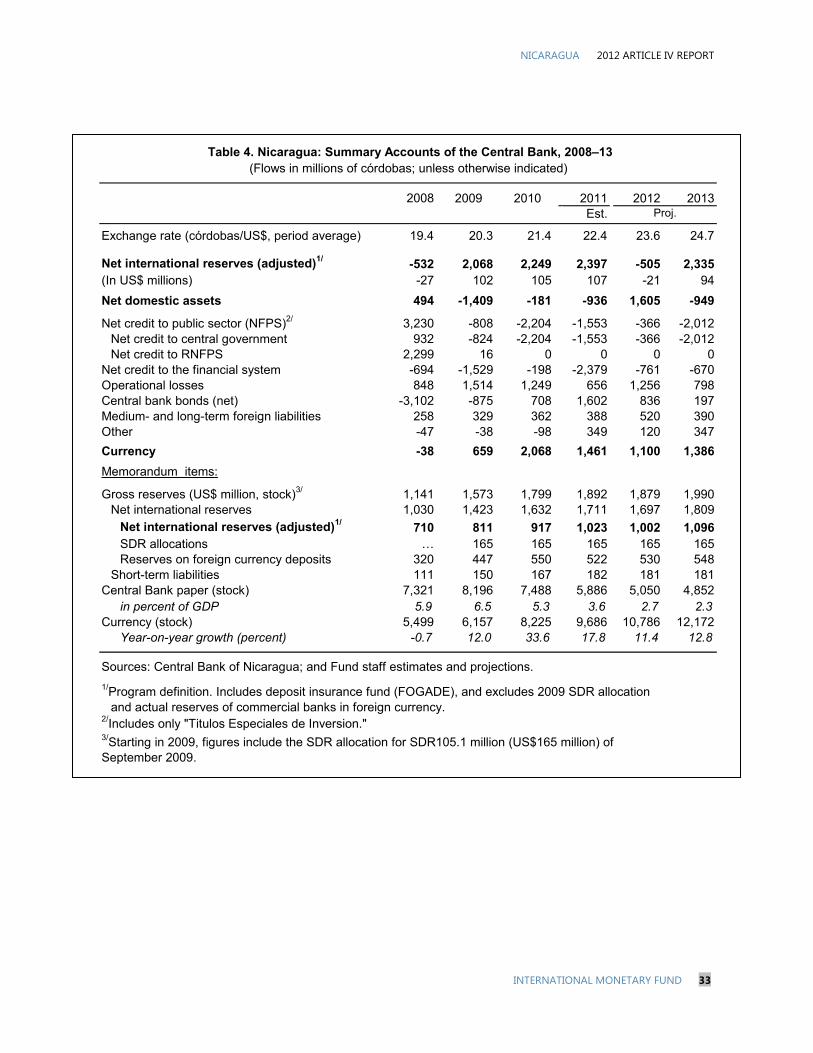
NICARAGUA 2012 ARTICLE IV REPORT
INTERNATIONAL MONETARY FUND 33
2008 2013Est.
Exchange rate (córdobas/US$, period average) 19.4 20.3 21.4 22.4 23.6 24.7
Net international reserves (adjusted)1/ -532 2,068 2,249 2,397 -505 2,335(In US$ millions) -27 102 105 107 -21 94
Net domestic assets 494 -1,409 -181 -936 1,605 -949
Net credit to public sector (NFPS)2/ 3,230 -808 -2,204 -1,553 -366 -2,012Net credit to central government 932 -824 -2,204 -1,553 -366 -2,012Net credit to RNFPS 2,299 16 0 0 0 0
Net credit to the financial system -694 -1,529 -198 -2,379 -761 -670Operational losses 848 1,514 1,249 656 1,256 798Central bank bonds (net) -3,102 -875 708 1,602 836 197Medium- and long-term foreign liabilities 258 329 362 388 520 390Other -47 -38 -98 349 120 347
Currency -38 659 2,068 1,461 1,100 1,386
Memorandum items:
Gross reserves (US$ million, stock)3/ 1,141 1,573 1,799 1,892 1,879 1,990Net international reserves 1,030 1,423 1,632 1,711 1,697 1,809
Net international reserves (adjusted)1/710 811 917 1,023 1,002 1,096
SDR allocations … 165 165 165 165 165Reserves on foreign currency deposits 320 447 550 522 530 548
Short-term liabilities 111 150 167 182 181 181Central Bank paper (stock) 7,321 8,196 7,488 5,886 5,050 4,852
in percent of GDP 5.9 6.5 5.3 3.6 2.7 2.3Currency (stock) 5,499 6,157 8,225 9,686 10,786 12,172
Year-on-year growth (percent) -0.7 12.0 33.6 17.8 11.4 12.8
Sources: Central Bank of Nicaragua; and Fund staff estimates and projections.
2012
Table 4. Nicaragua: Summary Accounts of the Central Bank, 2008–13(Flows in millions of córdobas; unless otherwise indicated)
3/Starting in 2009, figures include the SDR allocation for SDR105.1 million (US$165 million) of September 2009.
1/Program definition. Includes deposit insurance fund (FOGADE), and excludes 2009 SDR allocation
2/Includes only "Titulos Especiales de Inversion."
20112009 2010
and actual reserves of commercial banks in foreign currency.
Proj.
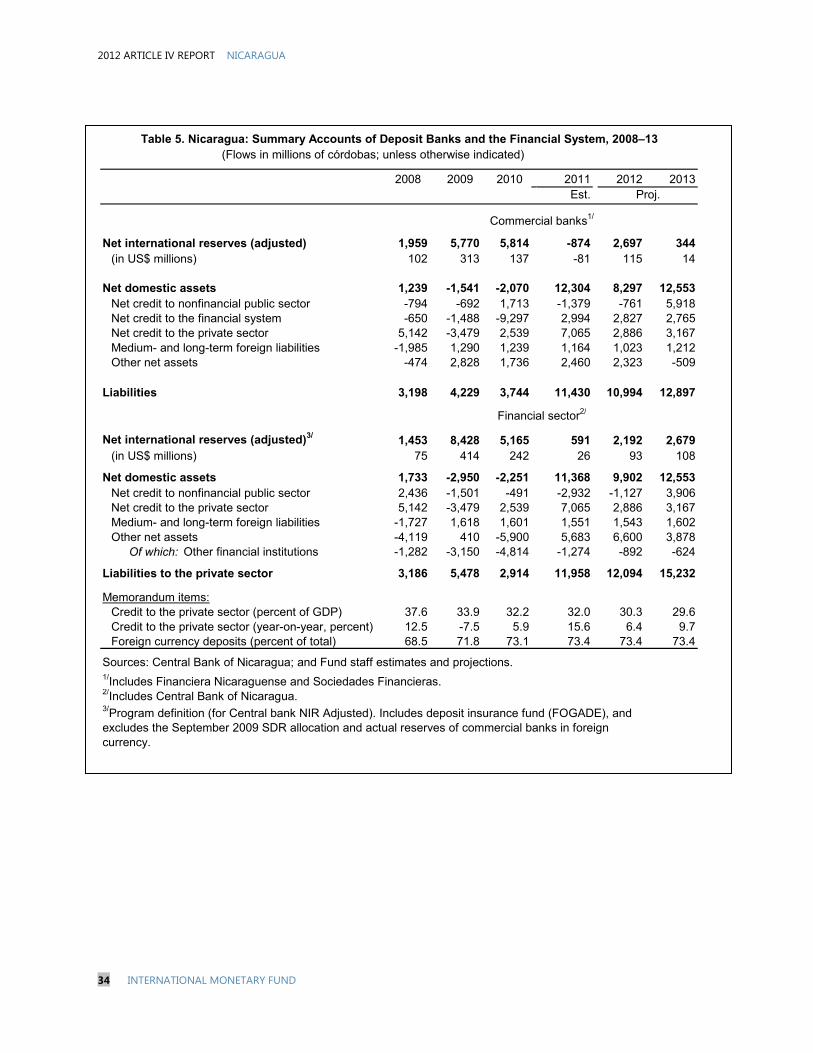
2012 ARTICLE IV REPORT NICARAGUA
34 INTERNATIONAL MONETARY FUND
2013Est.
Net international reserves (adjusted) 1,959 5,770 5,814 -874 2,697 344(in US$ millions) 102 313 137 -81 115 14
Net domestic assets 1,239 -1,541 -2,070 12,304 8,297 12,553Net credit to nonfinancial public sector -794 -692 1,713 -1,379 -761 5,918Net credit to the financial system -650 -1,488 -9,297 2,994 2,827 2,765Net credit to the private sector 5,142 -3,479 2,539 7,065 2,886 3,167Medium- and long-term foreign liabilities -1,985 1,290 1,239 1,164 1,023 1,212Other net assets -474 2,828 1,736 2,460 2,323 -509
Liabilities 3,198 4,229 3,744 11,430 10,994 12,897
Net international reserves (adjusted)3/ 1,453 8,428 5,165 591 2,192 2,679(in US$ millions) 75 414 242 26 93 108
Net domestic assets 1,733 -2,950 -2,251 11,368 9,902 12,553Net credit to nonfinancial public sector 2,436 -1,501 -491 -2,932 -1,127 3,906Net credit to the private sector 5,142 -3,479 2,539 7,065 2,886 3,167Medium- and long-term foreign liabilities -1,727 1,618 1,601 1,551 1,543 1,602Other net assets -4,119 410 -5,900 5,683 6,600 3,878
Of which: Other financial institutions -1,282 -3,150 -4,814 -1,274 -892 -624
Liabilities to the private sector 3,186 5,478 2,914 11,958 12,094 15,232
Memorandum items:Credit to the private sector (percent of GDP) 37.6 33.9 32.2 32.0 30.3 29.6Credit to the private sector (year-on-year, percent) 12.5 -7.5 5.9 15.6 6.4 9.7Foreign currency deposits (percent of total) 68.5 71.8 73.1 73.4 73.4 73.4
Sources: Central Bank of Nicaragua; and Fund staff estimates and projections.1/Includes Financiera Nicaraguense and Sociedades Financieras.2/Includes Central Bank of Nicaragua.
Table 5. Nicaragua: Summary Accounts of Deposit Banks and the Financial System, 2008–13(Flows in millions of córdobas; unless otherwise indicated)
Commercial banks1/
Financial sector2/
2011
3/Program definition (for Central bank NIR Adjusted). Includes deposit insurance fund (FOGADE), and excludes the September 2009 SDR allocation and actual reserves of commercial banks in foreign currency.
2008 2009 2010 2012Proj.
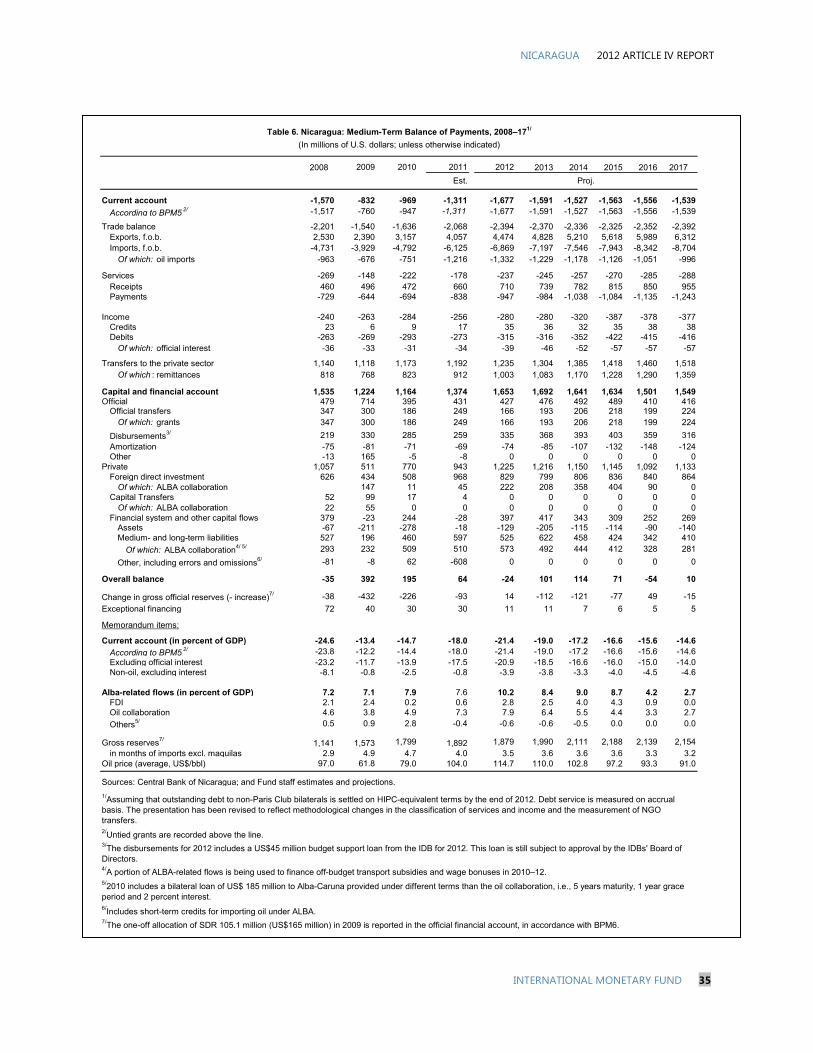
NICARAGUA 2012 ARTICLE IV REPORT
INTERNATIONAL MONETARY FUND 35
2008 2013 2014 2015 2016 2017
Est.
Current account -1,570 -832 -969 -1,311 -1,677 -1,591 -1,527 -1,563 -1,556 -1,539
According to BPM5 2/ -1,517 -760 -947 -1,311 -1,677 -1,591 -1,527 -1,563 -1,556 -1,539
Trade balance -2,201 -1,540 -1,636 -2,068 -2,394 -2,370 -2,336 -2,325 -2,352 -2,392Exports, f.o.b. 2,530 2,390 3,157 4,057 4,474 4,828 5,210 5,618 5,989 6,312Imports, f.o.b. -4,731 -3,929 -4,792 -6,125 -6,869 -7,197 -7,546 -7,943 -8,342 -8,704
Of which: oil imports -963 -676 -751 -1,216 -1,332 -1,229 -1,178 -1,126 -1,051 -996
Services -269 -148 -222 -178 -237 -245 -257 -270 -285 -288Receipts 460 496 472 660 710 739 782 815 850 955Payments -729 -644 -694 -838 -947 -984 -1,038 -1,084 -1,135 -1,243
Income -240 -263 -284 -256 -280 -280 -320 -387 -378 -377Credits 23 6 9 17 35 36 32 35 38 38Debits -263 -269 -293 -273 -315 -316 -352 -422 -415 -416
Of which: official interest -36 -33 -31 -34 -39 -46 -52 -57 -57 -57
Transfers to the private sector 1,140 1,118 1,173 1,192 1,235 1,304 1,385 1,418 1,460 1,518Of which : remittances 818 768 823 912 1,003 1,083 1,170 1,228 1,290 1,359
Capital and financial account 1,535 1,224 1,164 1,374 1,653 1,692 1,641 1,634 1,501 1,549Official 479 714 395 431 427 476 492 489 410 416
Official transfers 347 300 186 249 166 193 206 218 199 224Of which: grants 347 300 186 249 166 193 206 218 199 224
Disbursements3/ 219 330 285 259 335 368 393 403 359 316Amortization -75 -81 -71 -69 -74 -85 -107 -132 -148 -124Other -13 165 -5 -8 0 0 0 0 0 0
Private 1,057 511 770 943 1,225 1,216 1,150 1,145 1,092 1,133Foreign direct investment 626 434 508 968 829 799 806 836 840 864
Of which: ALBA collaboration 147 11 45 222 208 358 404 90 0Capital Transfers 52 99 17 4 0 0 0 0 0 0
Of which: ALBA collaboration 22 55 0 0 0 0 0 0 0 0Financial system and other capital flows 379 -23 244 -28 397 417 343 309 252 269
Assets -67 -211 -278 -18 -129 -205 -115 -114 -90 -140Medium- and long-term liabilities 527 196 460 597 525 622 458 424 342 410
Of which: ALBA collaboration4/ 5/ 293 232 509 510 573 492 444 412 328 281
Other, including errors and omissions6/ -81 -8 62 -608 0 0 0 0 0 0
Overall balance -35 392 195 64 -24 101 114 71 -54 10
Change in gross official reserves (- increase)7/ -38 -432 -226 -93 14 -112 -121 -77 49 -15
Exceptional financing 72 40 30 30 11 11 7 6 5 5
Memorandum items:
Current account (in percent of GDP) -24.6 -13.4 -14.7 -18.0 -21.4 -19.0 -17.2 -16.6 -15.6 -14.6
According to BPM5 2/ -23.8 -12.2 -14.4 -18.0 -21.4 -19.0 -17.2 -16.6 -15.6 -14.6Excluding official interest -23.2 -11.7 -13.9 -17.5 -20.9 -18.5 -16.6 -16.0 -15.0 -14.0Non-oil, excluding interest -8.1 -0.8 -2.5 -0.8 -3.9 -3.8 -3.3 -4.0 -4.5 -4.6
Alba-related flows (in percent of GDP) 7.2 7.1 7.9 7.6 10.2 8.4 9.0 8.7 4.2 2.7FDI 2.1 2.4 0.2 0.6 2.8 2.5 4.0 4.3 0.9 0.0Oil collaboration 4.6 3.8 4.9 7.3 7.9 6.4 5.5 4.4 3.3 2.7
Others5/ 0.5 0.9 2.8 -0.4 -0.6 -0.6 -0.5 0.0 0.0 0.0
Gross reserves7/1,141 1,573 1,799 1,892 1,879 1,990 2,111 2,188 2,139 2,154
in months of imports excl. maquilas 2.9 4.9 4.7 4.0 3.5 3.6 3.6 3.6 3.3 3.2Oil price (average, US$/bbl) 97.0 61.8 79.0 104.0 114.7 110.0 102.8 97.2 93.3 91.0
Sources: Central Bank of Nicaragua; and Fund staff estimates and projections.
4/A portion of ALBA-related flows is being used to finance off-budget transport subsidies and wage bonuses in 2010–12.
7/The one-off allocation of SDR 105.1 million (US$165 million) in 2009 is reported in the official financial account, in accordance with BPM6.
Table 6. Nicaragua: Medium-Term Balance of Payments, 2008–171/
(In millions of U.S. dollars; unless otherwise indicated)
2011 2012
6/Includes short-term credits for importing oil under ALBA.
2009 2010
1/Assuming that outstanding debt to non-Paris Club bilaterals is settled on HIPC-equivalent terms by the end of 2012. Debt service is measured on accrual basis. The presentation has been revised to reflect methodological changes in the classification of services and income and the measurement of NGO transfers.
5/2010 includes a bilateral loan of US$ 185 million to Alba-Caruna provided under different terms than the oil collaboration, i.e., 5 years maturity, 1 year grace period and 2 percent interest.
Proj.
2/Untied grants are recorded above the line.3/The disbursements for 2012 includes a US$45 million budget support loan from the IDB for 2012. This loan is still subject to approval by the IDBs' Board of Directors.
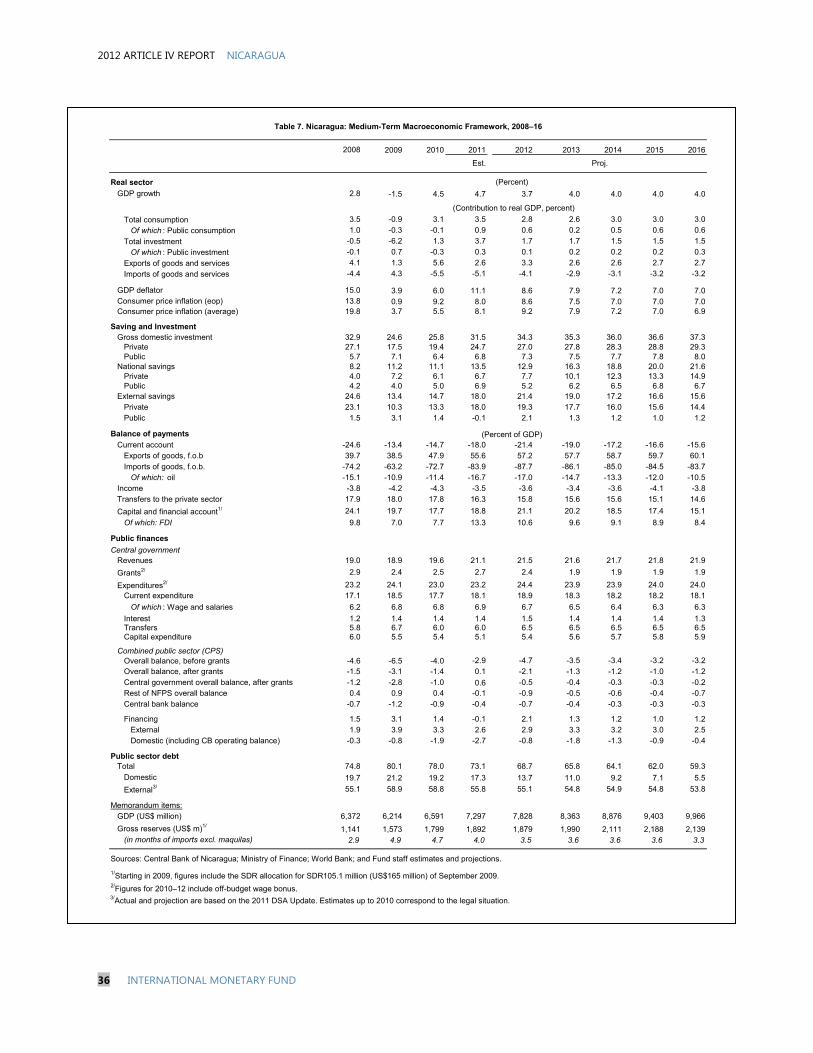
2012 ARTICLE IV REPORT NICARAGUA
36 INTERNATIONAL MONETARY FUND
2009 2010 2011 2012 2013 2014 2015 2016
Est.
Real sector
GDP growth 2.8 -1.5 4.5 4.7 3.7 4.0 4.0 4.0 4.0
Total consumption 3.5 -0.9 3.1 3.5 2.8 2.6 3.0 3.0 3.0
Of which : Public consumption 1.0 -0.3 -0.1 0.9 0.6 0.2 0.5 0.6 0.6
Total investment -0.5 -6.2 1.3 3.7 1.7 1.7 1.5 1.5 1.5
Of which : Public investment -0.1 0.7 -0.3 0.3 0.1 0.2 0.2 0.2 0.3
Exports of goods and services 4.1 1.3 5.6 2.6 3.3 2.6 2.6 2.7 2.7
Imports of goods and services -4.4 4.3 -5.5 -5.1 -4.1 -2.9 -3.1 -3.2 -3.2
GDP deflator 15.0 3.9 6.0 11.1 8.6 7.9 7.2 7.0 7.0Consumer price inflation (eop) 13.8 0.9 9.2 8.0 8.6 7.5 7.0 7.0 7.0Consumer price inflation (average) 19.8 3.7 5.5 8.1 9.2 7.9 7.2 7.0 6.9
Saving and InvestmentGross domestic investment 32.9 24.6 25.8 31.5 34.3 35.3 36.0 36.6 37.3
Private 27.1 17.5 19.4 24.7 27.0 27.8 28.3 28.8 29.3Public 5.7 7.1 6.4 6.8 7.3 7.5 7.7 7.8 8.0
National savings 8.2 11.2 11.1 13.5 12.9 16.3 18.8 20.0 21.6Private 4.0 7.2 6.1 6.7 7.7 10.1 12.3 13.3 14.9Public 4.2 4.0 5.0 6.9 5.2 6.2 6.5 6.8 6.7
External savings 24.6 13.4 14.7 18.0 21.4 19.0 17.2 16.6 15.6Private 23.1 10.3 13.3 18.0 19.3 17.7 16.0 15.6 14.4Public 1.5 3.1 1.4 -0.1 2.1 1.3 1.2 1.0 1.2
Balance of payments
Current account -24.6 -13.4 -14.7 -18.0 -21.4 -19.0 -17.2 -16.6 -15.6Exports of goods, f.o.b 39.7 38.5 47.9 55.6 57.2 57.7 58.7 59.7 60.1Imports of goods, f.o.b. -74.2 -63.2 -72.7 -83.9 -87.7 -86.1 -85.0 -84.5 -83.7
Of which: oil -15.1 -10.9 -11.4 -16.7 -17.0 -14.7 -13.3 -12.0 -10.5Income -3.8 -4.2 -4.3 -3.5 -3.6 -3.4 -3.6 -4.1 -3.8Transfers to the private sector 17.9 18.0 17.8 16.3 15.8 15.6 15.6 15.1 14.6
Capital and financial account1/ 24.1 19.7 17.7 18.8 21.1 20.2 18.5 17.4 15.1
Of which: FDI 9.8 7.0 7.7 13.3 10.6 9.6 9.1 8.9 8.4
Public finances
Central governmentRevenues 19.0 18.9 19.6 21.1 21.5 21.6 21.7 21.8 21.9
Grants2/ 2.9 2.4 2.5 2.7 2.4 1.9 1.9 1.9 1.9
Expenditures2/ 23.2 24.1 23.0 23.2 24.4 23.9 23.9 24.0 24.0Current expenditure 17.1 18.5 17.7 18.1 18.9 18.3 18.2 18.2 18.1
Of which : Wage and salaries 6.2 6.8 6.8 6.9 6.7 6.5 6.4 6.3 6.3
Interest 1.2 1.4 1.4 1.4 1.5 1.4 1.4 1.4 1.3Transfers 5.8 6.7 6.0 6.0 6.5 6.5 6.5 6.5 6.5Capital expenditure 6.0 5.5 5.4 5.1 5.4 5.6 5.7 5.8 5.9
Combined public sector (CPS)Overall balance, before grants -4.6 -6.5 -4.0 -2.9 -4.7 -3.5 -3.4 -3.2 -3.2Overall balance, after grants -1.5 -3.1 -1.4 0.1 -2.1 -1.3 -1.2 -1.0 -1.2Central government overall balance, after grants -1.2 -2.8 -1.0 0.6 -0.5 -0.4 -0.3 -0.3 -0.2Rest of NFPS overall balance 0.4 0.9 0.4 -0.1 -0.9 -0.5 -0.6 -0.4 -0.7Central bank balance -0.7 -1.2 -0.9 -0.4 -0.7 -0.4 -0.3 -0.3 -0.3
Financing 1.5 3.1 1.4 -0.1 2.1 1.3 1.2 1.0 1.2External 1.9 3.9 3.3 2.6 2.9 3.3 3.2 3.0 2.5Domestic (including CB operating balance) -0.3 -0.8 -1.9 -2.7 -0.8 -1.8 -1.3 -0.9 -0.4
Public sector debtTotal 74.8 80.1 78.0 73.1 68.7 65.8 64.1 62.0 59.3
Domestic 19.7 21.2 19.2 17.3 13.7 11.0 9.2 7.1 5.5
External3/ 55.1 58.9 58.8 55.8 55.1 54.8 54.9 54.8 53.8
Memorandum items:GDP (US$ million) 6,372 6,214 6,591 7,297 7,828 8,363 8,876 9,403 9,966
Gross reserves (US$ m)1/1,141 1,573 1,799 1,892 1,879 1,990 2,111 2,188 2,139
(in months of imports excl. maquilas) 2.9 4.9 4.7 4.0 3.5 3.6 3.6 3.6 3.3
Sources: Central Bank of Nicaragua; Ministry of Finance; World Bank; and Fund staff estimates and projections.
1/Starting in 2009, figures include the SDR allocation for SDR105.1 million (US$165 million) of September 2009.
(Percent of GDP)
2/Figures for 2010–12 include off-budget wage bonus.3/Actual and projection are based on the 2011 DSA Update. Estimates up to 2010 correspond to the legal situation.
Proj.
2008
Table 7. Nicaragua: Medium-Term Macroeconomic Framework, 2008–16
(Contribution to real GDP, percent)
(Percent)

NICARAGUA 2012 ARTICLE IV REPORT
INTERNATIONAL MONETARY FUND 37
2013 2014 2015 2016
Est.
Revenue 27.5 28.9 30.5 30.1 29.6 29.7 29.8 29.8Taxes 17.5 18.1 19.4 19.8 19.8 20.0 20.1 20.2
Taxes on income , profits, and capital gains 6.2 5.9 6.8 7.0 7.0 7.0 7.1 7.1Taxes on property 0.0 0.1 0.1 0.1 0.1 0.1 0.1 0.1Taxes on goods and services 5.7 6.8 6.5 6.6 6.6 6.7 6.7 6.7
VAT 3.1 2.9 2.8 2.8 2.8 2.8 2.8 2.8Excises 2.6 3.9 3.7 3.7 3.8 3.8 3.9 3.9
Other taxes 5.6 5.3 6.0 6.1 6.1 6.2 6.2 6.2Social contributions 5.4 5.7 5.7 5.6 5.6 5.6 5.6 5.6Grants 2.5 2.5 2.7 2.5 1.9 1.9 1.9 1.9
Current 0.3 0.8 0.8 0.5 0.0 0.0 0.0 0.0Capital 2.2 1.7 1.9 2.0 1.9 1.9 1.9 1.9
Other revenue 2.1 2.5 2.6 2.3 2.3 2.2 2.1 2.1Expenditure 29.6 28.8 28.9 30.3 29.5 29.6 29.7 29.8
Expense 24.1 23.4 23.9 24.8 23.9 23.9 23.9 23.9Compensation of employees 6.8 6.8 6.9 6.7 6.5 6.4 6.3 6.3
Of which : Bonus 0.0 0.5 0.8 0.7 … … … … …Use of goods and services 3.7 3.5 3.9 4.3 3.9 3.9 3.9 3.9Interest 1.4 1.4 1.4 1.5 1.4 1.4 1.4 1.3
Of which : External 0.4 0.4 0.4 0.5 0.5 0.5 0.5 0.5Subsidies 0.0 0.0 0.0 0.0 0.0 0.0 0.0 0.0Grants 6.7 6.0 6.0 6.4 6.4 6.5 6.5 6.5Social benefits 3.2 3.3 3.3 3.3 3.3 3.3 3.3 3.3Other expense 2.3 2.5 2.4 2.6 2.4 2.4 2.4 2.5
Net acquisition of nonfinancial assets 5.5 5.4 5.1 5.4 5.6 5.7 5.8 5.9Acquisitions of nonfinancial assets 5.5 5.4 5.1 5.4 5.6 5.7 5.8 5.9
Domestically financed 0.7 1.2 1.2 1.4 1.4 1.5 1.6 1.7Externally financed 4.8 4.2 3.8 4.0 4.2 4.2 4.2 4.2
Gross Operating Balance 3.4 5.5 6.6 5.3 5.7 5.8 5.9 5.8Net lending (+)/borrowing (–) (after grants) -2.1 0.1 1.5 -0.1 0.1 0.1 0.1 -0.1Net lending (+)/borrowing (–) (before grants) -4.5 -2.4 -1.2 -2.6 -1.8 -1.8 -1.8 -2.0Primary net lending (+)/borrowing (-) -0.7 1.5 2.9 1.4 1.5 1.5 1.5 1.3Total financing : Financial assets - Liabilities -2.1 0.1 1.5 -0.1 0.1 0.1 0.1 -0.1Net acquisition of financial assets 0.1 2.8 2.4 0.6 1.5 1.7 1.3 1.1
Domestic 0.1 2.8 2.4 0.6 1.5 1.7 1.3 1.1Currency and deposits 0.0 2.8 2.4 0.6 1.5 1.7 1.3 1.1
Central Bank 0.1 1.3 0.6 0.2 1.0 1.3 0.9 0.9Commercial Banks -0.1 1.5 1.8 0.4 0.5 0.4 0.4 0.2
Loans 37 … … … … … … …
Net incurrence of liabilities 2.2 2.7 0.9 0.7 1.4 1.6 1.2 1.1Domestic -1.0 0.3 -1.1 -1.1 -0.8 -0.4 -0.7 -0.7
Debt securities 0.1 -0.2 -0.3 -1.3 -0.1 0.2 -0.3 -0.2Loans -1.3 0.2 0.4 0.0 0.0 0.0 0.0 0.0
Central Bank -0.6 -0.3 -0.4 0.0 0.0 0.0 0.0 0.0Commercial Banks -0.7 0.5 0.8 0.0 0.0 0.0 0.0 0.0
Other accounts payable 0.2 0.2 -1.2 0.2 -0.6 -0.5 -0.4 -0.4Foreign 3.2 2.5 2.0 1.8 2.2 2.0 1.9 1.8
Loans 3.2 2.5 2.0 1.8 2.2 2.0 1.9 1.8Disbursement 3.9 3.1 2.5 2.6 2.8 2.8 2.8 2.8Amortization -0.7 -0.7 -0.5 -0.8 -0.7 -0.8 -0.9 -0.9
Sources: Central Bank of Nicaragua; Ministry of Finance; and Fund staff estimates and projections.
Proj.
Table 8. Nicaragua: Statement of Operations of the Central Government (GFSM 2001)–Preliminary, 2009–16
(Percent of GDP)
2009 2010 2011 2012

2012 ARTICLE IV REPORT NICARAGUA
38 INTERNATIONAL MONETARY FUND
2008Jun Dec Jun Dec Jun Dec
Capital adequacy
Regulatory capital to risk-weighted assets 15.3 16.7 16.5 16.4 16.6 15.7 14.8
Regulatory Tier 1 capital to risk-weighted assets1/ 9.0 10.0 10.9 11.8 11.1 10.0 9.2
Asset quality
Nonperforming loans to total gross loans 3.0 3.0 3.3 3.5 3.0 2.9 2.2
Nonperforming loans to total gross loans2/ 6.7 8.3 10.9 11.0 8.0 7.4 5.9Nonperforming loans net of provisions to capital 17.2 25.3 33.4 30.7 20.3 14.8 12.6
Earnings and profitabilityReturn on assets 1.8 1.4 0.5 0.0 1.0 1.7 1.6Return on equity 18.1 13.3 4.8 -0.1 10.8 18.0 16.7Interest margin to assets 9.1 8.7 8.7 7.8 7.0 5.9 6.2
LiquidityLiquid assets to total assets 21.2 24.5 29.5 31.5 28.7 31.1 27.2Liquid assets to total short-term liabilities 118.0 137.7 139.4 121.0 120.8 143.6 129.9
Exposure to FX risk
Net open position in foreign exchange to capital 94.7 90.8 81.4 86.6 99.4 106.4 92.6
Number of institutions3/10 10 9 9 8 8 8
Total assets (in millions of cordobas) 71,791 75,538 79,754 91,508 91,681 102,429 105,316
Bank concentration
Number of banks accounting for at least 25 percent of total assets 1 1 1 1 2 2 2 75 percent of total assets 9 9 8 8 6 6 6
Total assets (in percent of GDP)
Private commercial 58.2 60.4 63.8 68.6 68.7 62.6 64.4
Of which: Foreign banks4/ 25.7 26.3 29.1 27.8 26.3 17.0 18.3
Bank deposits (percentage of GDP)
Private commercial 39.6 41.3 45.2 50.8 52.8 48.5 50.1
Of which: Foreign banks4/ 17.7 18.4 20.0 19.7 20.0 13.1 14.6
Dollarization and maturity structureBanking system assets as percentage of GDP 58.2 60.4 63.8 68.6 68.7 62.6 64.4
Assets in foreign currency as percentage of banking system assets 69.5 68.0 70.2 68.9 72.0 73.2 71.6
Sources: Superintendency of Banks; and Central Bank of Nicaragua.1/In 2006 a regulatory change narrowed the definition of Tier 1 capital. 2/NPLs including restructured and reprogrammed loans.3/In 2009, HSBC (with deposits less than one percent of total deposits) closed its operations in Nicaragua.
In July 2010 Banex closed its operations in Nicaragua.4/ Refers to banks with more than 49 percent foreign ownership.
2009 2010 2011
Table 9. Nicaragua: Financial Soundness Indicators, 2008–11 (In percent, unless otherwise indicated)
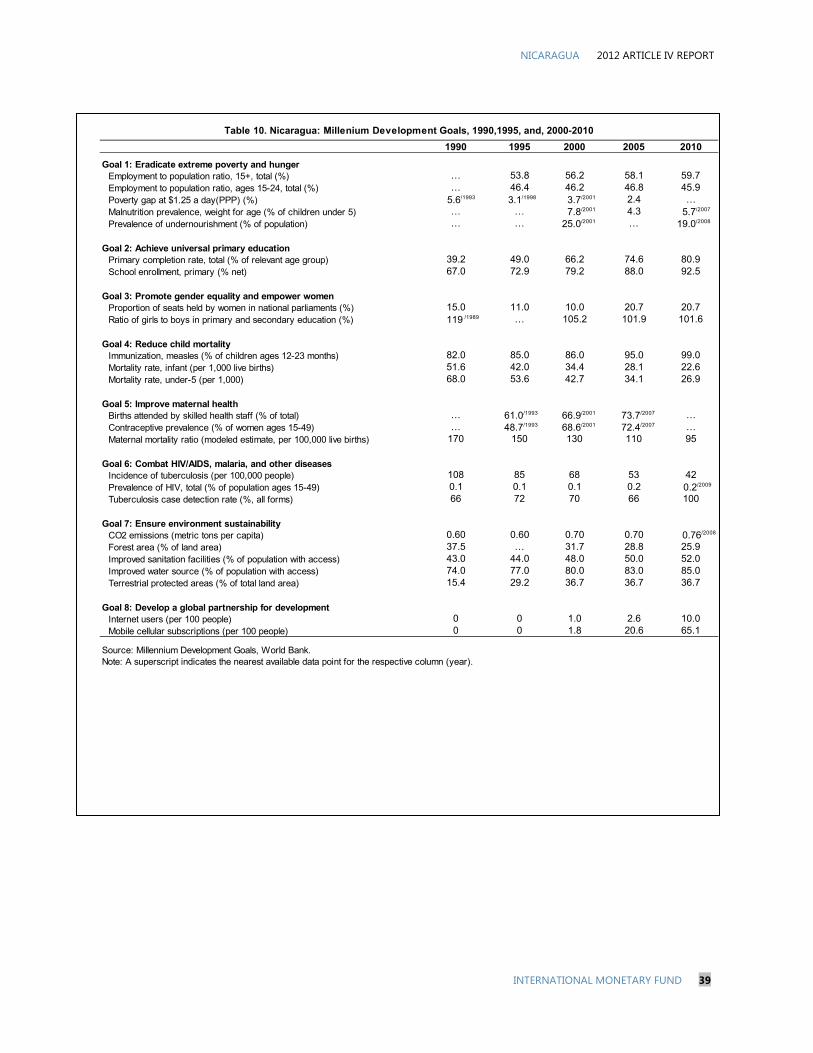
NICARAGUA 2012 ARTICLE IV REPORT
INTERNATIONAL MONETARY FUND 39
1990 1995 2000 2005 2010
Goal 1: Eradicate extreme poverty and hunger
Employment to population ratio, 15+, total (%) … 53.8 56.2 58.1 59.7Employment to population ratio, ages 15-24, total (%) … 46.4 46.2 46.8 45.9Poverty gap at $1.25 a day(PPP) (%) 5.6/1993 3.1/1998 3.7/2001 2.4 …Malnutrition prevalence, weight for age (% of children under 5) … … 7.8/2001 4.3 5.7/2007
Prevalence of undernourishment (% of population) … … 25.0/2001 … 19.0/2008
Goal 2: Achieve universal primary education Primary completion rate, total (% of relevant age group) 39.2 49.0 66.2 74.6 80.9School enrollment, primary (% net) 67.0 72.9 79.2 88.0 92.5
Goal 3: Promote gender equality and empower women Proportion of seats held by women in national parliaments (%) 15.0 11.0 10.0 20.7 20.7Ratio of girls to boys in primary and secondary education (%) 119 /1989 … 105.2 101.9 101.6
Goal 4: Reduce child mortality Immunization, measles (% of children ages 12-23 months) 82.0 85.0 86.0 95.0 99.0Mortality rate, infant (per 1,000 live births) 51.6 42.0 34.4 28.1 22.6Mortality rate, under-5 (per 1,000) 68.0 53.6 42.7 34.1 26.9
Goal 5: Improve maternal health Births attended by skilled health staff (% of total) … 61.0/1993 66.9/2001 73.7/2007 …Contraceptive prevalence (% of women ages 15-49) … 48.7/1993 68.6/2001 72.4/2007 …Maternal mortality ratio (modeled estimate, per 100,000 live births) 170 150 130 110 95
Goal 6: Combat HIV/AIDS, malaria, and other diseases Incidence of tuberculosis (per 100,000 people) 108 85 68 53 42Prevalence of HIV, total (% of population ages 15-49) 0.1 0.1 0.1 0.2 0.2/2009
Tuberculosis case detection rate (%, all forms) 66 72 70 66 100
Goal 7: Ensure environment sustainability CO2 emissions (metric tons per capita) 0.60 0.60 0.70 0.70 0.76/2008
Forest area (% of land area) 37.5 … 31.7 28.8 25.9Improved sanitation facilities (% of population with access) 43.0 44.0 48.0 50.0 52.0Improved water source (% of population with access) 74.0 77.0 80.0 83.0 85.0Terrestrial protected areas (% of total land area) 15.4 29.2 36.7 36.7 36.7
Goal 8: Develop a global partnership for development Internet users (per 100 people) 0 0 1.0 2.6 10.0Mobile cellular subscriptions (per 100 people) 0 0 1.8 20.6 65.1
Source: Millennium Development Goals, World Bank.Note: A superscript indicates the nearest available data point for the respective column (year).
Table 10. Nicaragua: Millenium Development Goals, 1990,1995, and, 2000-2010

NICARAGUA STAFF REPORT FOR THE 2012 ARTICLE IV CONSULTATION—INFORMATIONAL ANNEX Prepared By
Western Hemisphere Department
ANNEX I. FUND RELATIONS __________________________________________________________________ 2
ANNEX II. BANK-FUND COUNTRY LEVEL JOINT MANAGERIAL
ACTION PLAN, 2012–13 _______________________________________________________________________ 7
ANNEX III. RELATIONS WITH THE INTER-AMERICAN DEVELOPMENT BANK _____________ 9
ANNEX IV. STATISTICAL ISSUES ____________________________________________________________ 11
CONTENTS
June 12, 2012
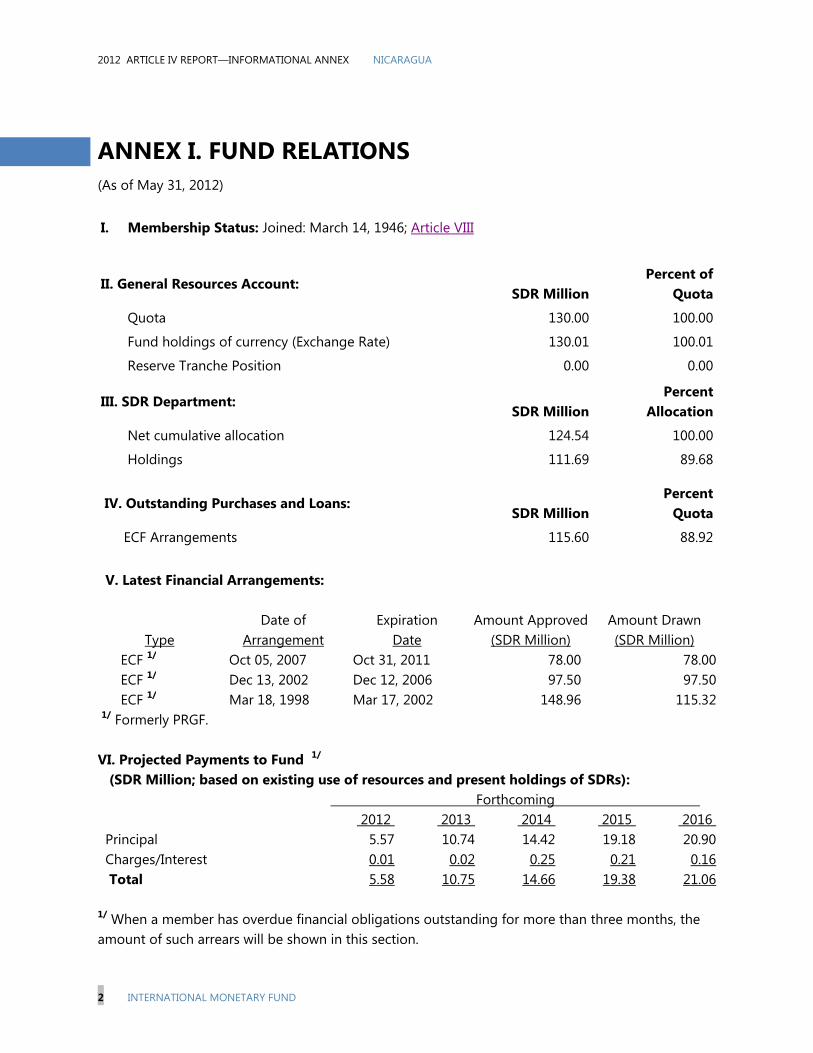
2012 ARTICLE IV REPORT—INFORMATIONAL ANNEX NICARAGUA
2 INTERNATIONAL MONETARY FUND
ANNEX I. FUND RELATIONS (As of May 31, 2012)
I. Membership Status: Joined: March 14, 1946; Article VIII
II. General Resources Account:
SDR Million Percent of
Quota
Quota 130.00 100.00
Fund holdings of currency (Exchange Rate) 130.01 100.01
Reserve Tranche Position 0.00 0.00
III. SDR Department:
SDR Million Percent
Allocation
Net cumulative allocation 124.54 100.00
Holdings 111.69 89.68
IV. Outstanding Purchases and Loans:
SDR Million Percent
Quota
ECF Arrangements
115.60
88.92
V. Latest Financial Arrangements:
Date of Expiration Amount Approved Amount Drawn Type Arrangement Date (SDR Million) (SDR Million)
ECF 1/ Oct 05, 2007 Oct 31, 2011 78.00 78.00 ECF 1/ Dec 13, 2002 Dec 12, 2006 97.50 97.50 ECF 1/ Mar 18, 1998 Mar 17, 2002 148.96 115.32 1/ Formerly PRGF.
VI. Projected Payments to Fund 1/ (SDR Million; based on existing use of resources and present holdings of SDRs): Forthcoming 2012 2013 2014 2015 2016 Principal 5.57 10.74 14.42 19.18 20.90 Charges/Interest 0.01 0.02 0.25 0.21 0.16 Total 5.58 10.75 14.66 19.38 21.06
1/ When a member has overdue financial obligations outstanding for more than three months, the amount of such arrears will be shown in this section.
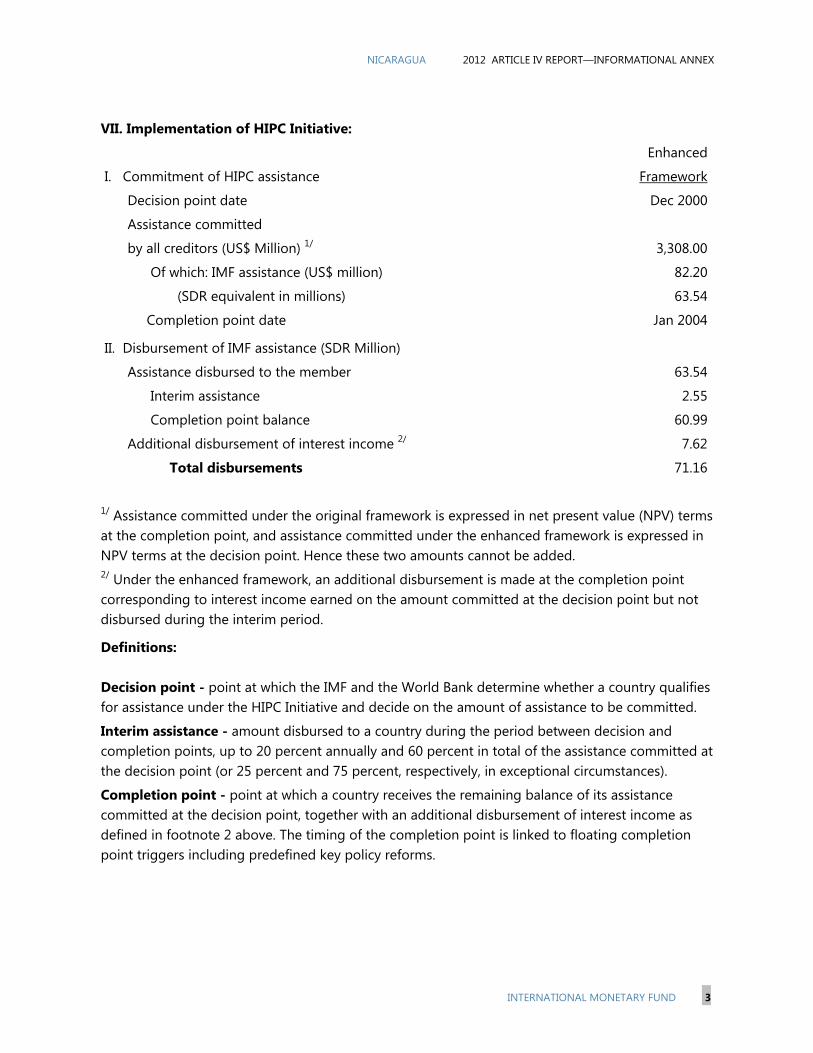
NICARAGUA 2012 ARTICLE IV REPORT—INFORMATIONAL ANNEX
INTERNATIONAL MONETARY FUND 3
VII. Implementation of HIPC Initiative:
Enhanced
I. Commitment of HIPC assistance Framework
Decision point date Dec 2000
Assistance committed
by all creditors (US$ Million) 1/ 3,308.00
Of which: IMF assistance (US$ million) 82.20
(SDR equivalent in millions) 63.54
Completion point date Jan 2004
II. Disbursement of IMF assistance (SDR Million)
Assistance disbursed to the member 63.54
Interim assistance 2.55
Completion point balance 60.99
Additional disbursement of interest income 2/ 7.62
Total disbursements 71.16
1/ Assistance committed under the original framework is expressed in net present value (NPV) terms at the completion point, and assistance committed under the enhanced framework is expressed in NPV terms at the decision point. Hence these two amounts cannot be added. 2/ Under the enhanced framework, an additional disbursement is made at the completion point corresponding to interest income earned on the amount committed at the decision point but not disbursed during the interim period.
Definitions: Decision point - point at which the IMF and the World Bank determine whether a country qualifies for assistance under the HIPC Initiative and decide on the amount of assistance to be committed.
Interim assistance - amount disbursed to a country during the period between decision and completion points, up to 20 percent annually and 60 percent in total of the assistance committed at the decision point (or 25 percent and 75 percent, respectively, in exceptional circumstances).
Completion point - point at which a country receives the remaining balance of its assistance committed at the decision point, together with an additional disbursement of interest income as defined in footnote 2 above. The timing of the completion point is linked to floating completion point triggers including predefined key policy reforms.
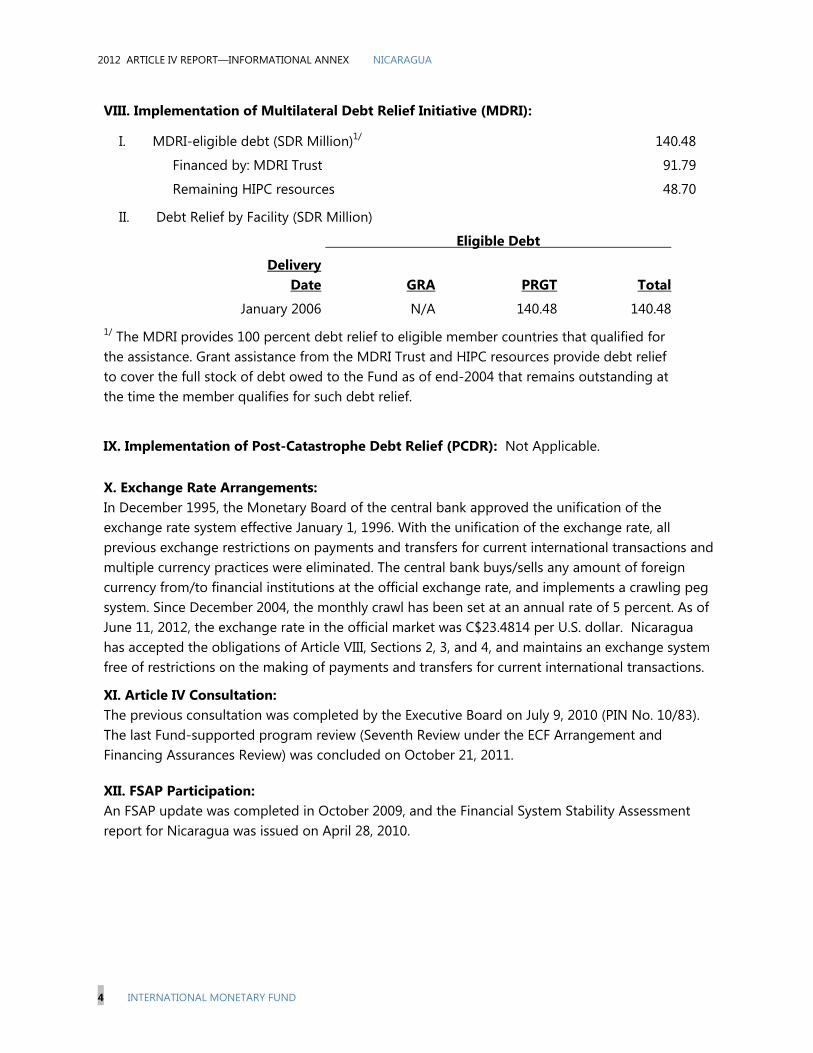
2012 ARTICLE IV REPORT—INFORMATIONAL ANNEX NICARAGUA
4 INTERNATIONAL MONETARY FUND
VIII. Implementation of Multilateral Debt Relief Initiative (MDRI):
I. MDRI-eligible debt (SDR Million)1/ 140.48
Financed by: MDRI Trust 91.79
Remaining HIPC resources 48.70
II. Debt Relief by Facility (SDR Million)
Eligible Debt
Delivery Date GRA PRGT Total
January 2006 N/A 140.48 140.481/ The MDRI provides 100 percent debt relief to eligible member countries that qualified for the assistance. Grant assistance from the MDRI Trust and HIPC resources provide debt relief to cover the full stock of debt owed to the Fund as of end-2004 that remains outstanding at the time the member qualifies for such debt relief.
IX. Implementation of Post-Catastrophe Debt Relief (PCDR): Not Applicable.
X. Exchange Rate Arrangements: In December 1995, the Monetary Board of the central bank approved the unification of the exchange rate system effective January 1, 1996. With the unification of the exchange rate, all previous exchange restrictions on payments and transfers for current international transactions and multiple currency practices were eliminated. The central bank buys/sells any amount of foreign currency from/to financial institutions at the official exchange rate, and implements a crawling peg system. Since December 2004, the monthly crawl has been set at an annual rate of 5 percent. As of June 11, 2012, the exchange rate in the official market was C$23.4814 per U.S. dollar. Nicaragua has accepted the obligations of Article VIII, Sections 2, 3, and 4, and maintains an exchange system free of restrictions on the making of payments and transfers for current international transactions.
XI. Article IV Consultation: The previous consultation was completed by the Executive Board on July 9, 2010 (PIN No. 10/83). The last Fund-supported program review (Seventh Review under the ECF Arrangement and Financing Assurances Review) was concluded on October 21, 2011.
XII. FSAP Participation: An FSAP update was completed in October 2009, and the Financial System Stability Assessment report for Nicaragua was issued on April 28, 2010.
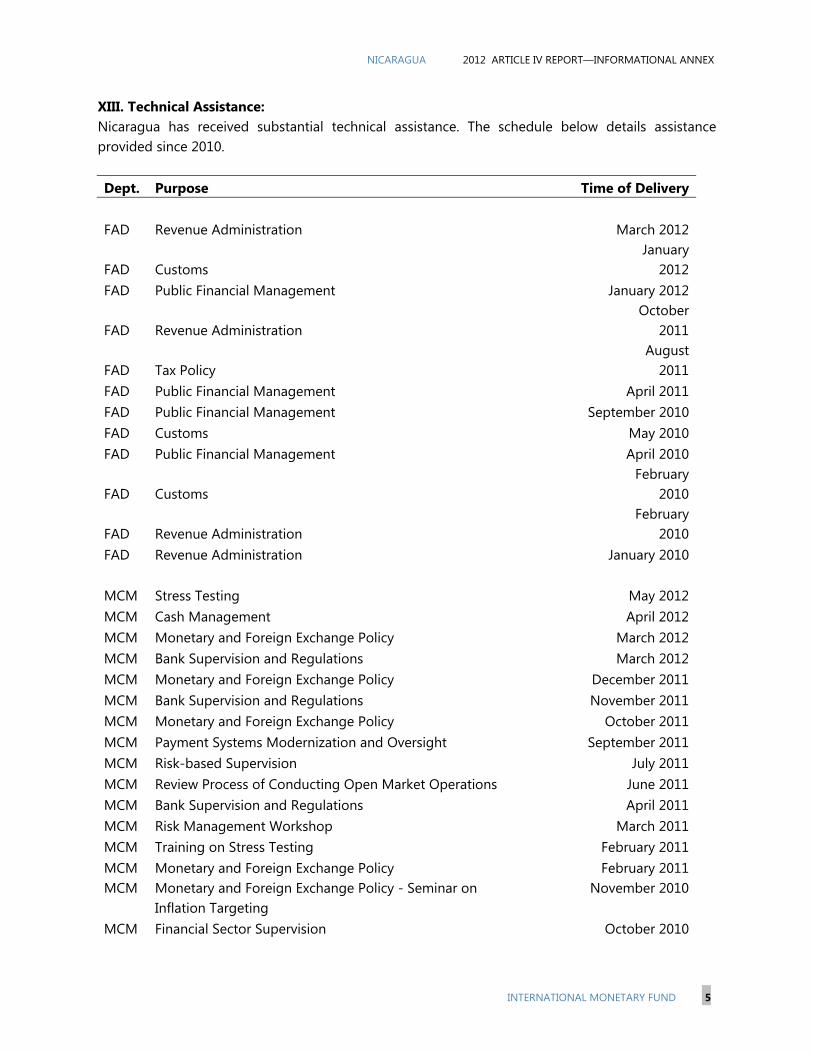
NICARAGUA 2012 ARTICLE IV REPORT—INFORMATIONAL ANNEX
INTERNATIONAL MONETARY FUND 5
XIII. Technical Assistance: Nicaragua has received substantial technical assistance. The schedule below details assistance provided since 2010. Dept. Purpose Time of Delivery FAD Revenue Administration March 2012
FAD Customs January
2012FAD Public Financial Management January 2012
FAD Revenue Administration October
2011
FAD Tax Policy August
2011FAD Public Financial Management April 2011FAD Public Financial Management September 2010FAD Customs May 2010FAD Public Financial Management April 2010
FAD Customs February
2010
FAD Revenue Administration February
2010FAD Revenue Administration January 2010 MCM Stress Testing May 2012MCM Cash Management April 2012MCM Monetary and Foreign Exchange Policy March 2012MCM Bank Supervision and Regulations March 2012MCM Monetary and Foreign Exchange Policy December 2011MCM Bank Supervision and Regulations November 2011MCM Monetary and Foreign Exchange Policy October 2011MCM Payment Systems Modernization and Oversight September 2011MCM Risk-based Supervision July 2011MCM Review Process of Conducting Open Market Operations June 2011MCM Bank Supervision and Regulations April 2011MCM Risk Management Workshop March 2011MCM Training on Stress Testing February 2011MCM Monetary and Foreign Exchange Policy February 2011MCM
Monetary and Foreign Exchange Policy - Seminar on Inflation Targeting
November 2010
MCM Financial Sector Supervision October 2010

2012 ARTICLE IV REPORT—INFORMATIONAL ANNEX NICARAGUA
6 INTERNATIONAL MONETARY FUND
MCM STE: Bank Supervision and Regulations October 2010MCM Monetary Policy - Liquidity Forecasting August 2010MCM Risk-based Supervision June 2010MCM Financial Sector Supervision March 2010 STA Monetary and Financial Statistics January 2012STA Balance of payments statistics November 2011STA Annual and Quarterly National Accounts Statistics August 2011STA Monetary and Financial Statistics June 2011STA Balance of payments statistics June 2011STA Balance of payments statistical techniques June 2011STA Export and Import Price Indexes May 2011STA Government finance statistics April 2011STA Balance of payments statistics February 2011STA National accounts January 2011STA Government finance statistics October 2010STA Balance of payments statistics October 2010STA Producer price index September 2010STA International Investment Position March 2010STA Government finance statistics February 2010
XIV. Resident Representative: Mr. Gabriel Di Bella assumed the position of Resident Representative in Nicaragua in February 2010.

NICARAGUA 2012 ARTICLE IV REPORT—INFORMATIONAL ANNEX
INTERNATIONAL MONETARY FUND 7
ANNEX II. BANK-FUND COUNTRY LEVEL JOINT MANAGERIAL ACTION PLAN, 2012–131
1
Products Mission timing Expected delivery
A. Mutual information on relevant work programs
The Fund work program
Strategy: An ECF arrangement for 2007-2011 concluded successfully on October 21, 2011. The IMF-supported program entailed macroeconomic policies anchored on containing expenditures, paving the way for fiscal consolidation, and protecting the external position. Technical assistance will focus on tax administration, improving payment systems and financial regulation and oversight. As of now, an IMF staff visit is planned for the second half of 2012 and an Article IV mission is scheduled to take place in the spring of 2013. Article IV May 2012 Board discussion in June
2012 Ex Post Assessment of Longer-Term Program Engagement
May 2012 Board discussion in June 2012
FADTA: Revenue Administration July 2012 TA report at the end of the final mission
FADTA: Public Financial Management
July 2012 TA report at the end of the final mission
MCMTA: Stress Testing July 2012 TA report at the end of the final mission
MCM TA: Payment System Organization
June 2012 TA report at the end of the final mission
MCM TA: Risk-based Supervision July 2012 TA report at the end of the final mission
MCM TA: Monetary and Foreign Exchange Policy
August 2012 TA report at the end of the final mission
MCM TA: Introducing IFRS October 2012 TA report at the end of the final mission
The World Bank program Strategy: The Bank’s operations and analytical activities under the Country Assistance Strategy 2008-2012 will aim at stimulating productivity and competitiveness, developing human capital (improving social equity and opportunity) and strengthening governance and
1 The Fund and the World Bank teams agreed to maintain regular monthly communication and exchange of information and to set a more structured semi-annual discussion in the context of the JMAP.
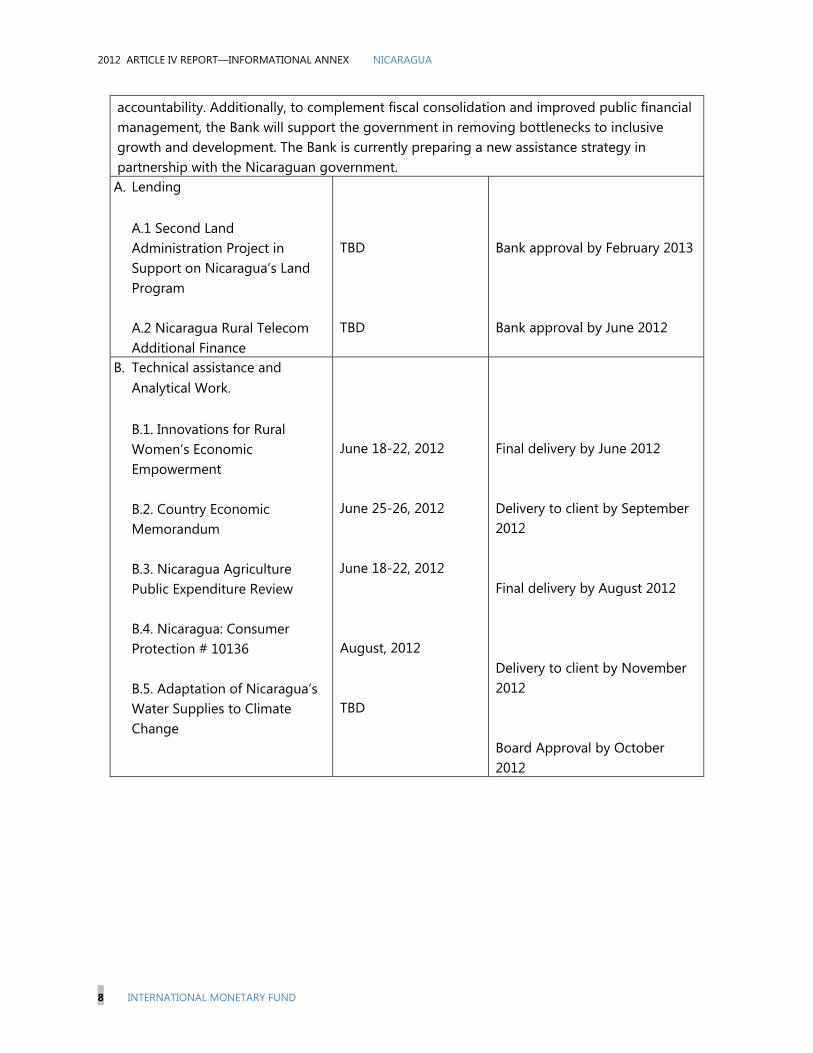
2012 ARTICLE IV REPORT—INFORMATIONAL ANNEX NICARAGUA
8 INTERNATIONAL MONETARY FUND
accountability. Additionally, to complement fiscal consolidation and improved public financial management, the Bank will support the government in removing bottlenecks to inclusive growth and development. The Bank is currently preparing a new assistance strategy in partnership with the Nicaraguan government. A. Lending
A.1 Second Land Administration Project in Support on Nicaragua’s Land Program A.2 Nicaragua Rural Telecom Additional Finance
TBD TBD
Bank approval by February 2013 Bank approval by June 2012
B. Technical assistance and Analytical Work. B.1. Innovations for Rural Women’s Economic Empowerment B.2. Country Economic Memorandum B.3. Nicaragua Agriculture Public Expenditure Review B.4. Nicaragua: Consumer Protection # 10136 B.5. Adaptation of Nicaragua’s Water Supplies to Climate Change
June 18-22, 2012 June 25-26, 2012 June 18-22, 2012 August, 2012 TBD
Final delivery by June 2012 Delivery to client by September 2012 Final delivery by August 2012 Delivery to client by November 2012 Board Approval by October 2012
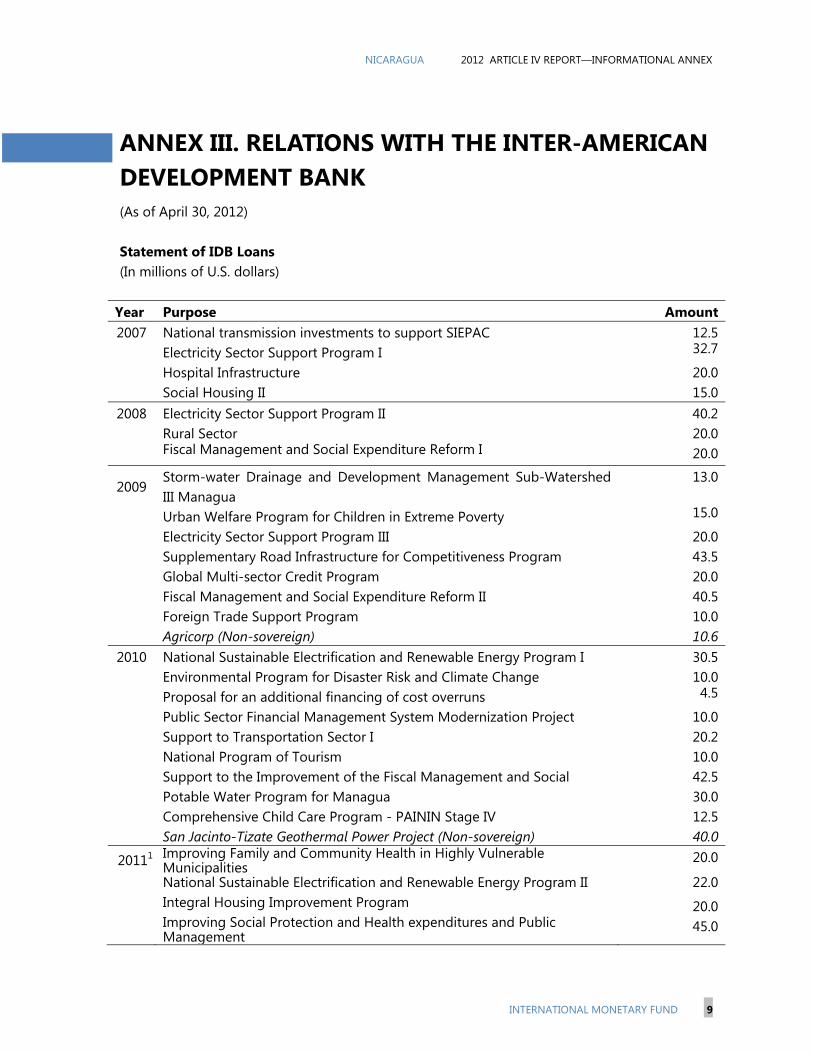
NICARAGUA 2012 ARTICLE IV REPORT—INFORMATIONAL ANNEX
INTERNATIONAL MONETARY FUND 9
ANNEX III. RELATIONS WITH THE INTER-AMERICAN DEVELOPMENT BANK (As of April 30, 2012) Statement of IDB Loans (In millions of U.S. dollars)
Year Purpose Amount2007 National transmission investments to support SIEPAC 12.5
Electricity Sector Support Program I 32.7
Hospital Infrastructure 20.0 Social Housing II 15.0
2008 Electricity Sector Support Program II 40.2 Rural Sector 20.0 Fiscal Management and Social Expenditure Reform I 20.0
2009 Storm-water Drainage and Development Management Sub-Watershed III Managua
13.0
Urban Welfare Program for Children in Extreme Poverty 15.0
Electricity Sector Support Program III 20.0 Supplementary Road Infrastructure for Competitiveness Program 43.5 Global Multi-sector Credit Program 20.0 Fiscal Management and Social Expenditure Reform II 40.5 Foreign Trade Support Program 10.0 Agricorp (Non-sovereign) 10.6
2010 National Sustainable Electrification and Renewable Energy Program I 30.5 Environmental Program for Disaster Risk and Climate Change 10.0 Proposal for an additional financing of cost overruns 4.5
Public Sector Financial Management System Modernization Project 10.0 Support to Transportation Sector I 20.2 National Program of Tourism 10.0 Support to the Improvement of the Fiscal Management and Social 42.5 Potable Water Program for Managua 30.0 Comprehensive Child Care Program - PAININ Stage IV 12.5 San Jacinto-Tizate Geothermal Power Project (Non-sovereign) 40.0
20111 Improving Family and Community Health in Highly Vulnerable Municipalities
20.0
National Sustainable Electrification and Renewable Energy Program II 22.0
Integral Housing Improvement Program 20.0
Improving Social Protection and Health expenditures and Public Management
45.0

2012 ARTICLE IV REPORT—INFORMATIONAL ANNEX NICARAGUA
10 INTERNATIONAL MONETARY FUND
2012 Program to accompany the implementation of the National Policy for children in Prioritized Communities
20.0
Sustainable Agricultural Productivity Program * 40.0 Integrated Health Networks * 36.2 Support to the Transportation Sector II * 59.2 National Sustainable Electrification and Renewable Energy Program III * 35.0 Improving Expenditures on Health and Social Protection II * 45.0
Rent to Own: Innovation to Improve Access to Social Housing (Non-sovereign)
10.0
1 Carry-over of US$64.2 million for 2012. * Pending for Approval.
IDB Loan Commitments and Disbursements
As of April 30 2012, there were 31 projects in the IDB’s current sovereign loan portfolio with a total commitment of US$699.6 million, and an undisbursed balance of US$328.65 million. Basic infrastructure (roads and energy) accounts for almost half the portfolio. Nicaragua is one of four IDB borrowing member countries to receive highly-concessional loans from the Fund for Special Operations (FSO). Nicaragua receives a lending blend of 50 percent from the FSO and 50 percent from the Ordinary Capital. The annual sovereign lending envelop depends on the availability of FSO funding as well as an allocation formula that encompasses policy performance, project performance, per capita income and population. The allocation for Nicaragua was US$80.2 million per annum in 2007 and 2008. In early 2009, the overall FSO funding for the four low-income countries was increased as a counter-cyclical response to the global economic crisis, and Nicaragua’s allocation increased to US$162.0 million for 2009 and US$170.2 million for 2010. For 2011, the FSO allocation increased to US$171.2 million.
Technical Assistance
As of April 30 2012, there were 27 non-reimbursable technical cooperations (for the public sector) in execution with an approved commitment of US$13.0 million and an available balance of US$8.5 million. The Multilateral Investment Fund has: (i) 17 non-reimbursable technical cooperations (including regional operations) in execution with an available balance of US$7.5 millions; and (ii) 7 loans in execution from the Social Entrepreneurship Program with an approved commitment of US$2.3 million and an available balance of US$1.1 million. Recent Agreements
The current country strategy with Nicaragua was approved by the Board in February 2009. A new country strategy for the period 2012-2017 is expected to be approved in late 2012.

NICARAGUA 2012 ARTICLE IV REPORT—INFORMATIONAL ANNEX
INTERNATIONAL MONETARY FUND 11
ANNEX IV. STATISTICAL ISSUES (As of April 30, 2012)
Assessment of Data Adequacy for Surveillance
General: Data provision has some shortcomings, but is broadly adequate for surveillance. Most affected areas are government financing statistics and monetary statistics.
National accounts:
National accounts are compiled in accordance with the United Nations System of National Accounts 1993 (SNA93). GDP estimates with 1994 as the base year are available up to the fourth quarter of 2011.
STA provided technical assistance in quarterly national accounts to the Central Bank of Nicaragua in June 2005 and January 2008. Quarterly GDP series at current and at constant prices with 1994 as the base year were published in October 2008. The Central Bank of Nicaragua is currently in the process of changing the base year of the national accounts to 2006 in accordance with the methodology of the System of National Accounts 2008. The Regional national accounts Statistics Advisor visited Managua during January 24–28, 2011 to prepare a work plan on TA and training needs on national accounts statistics as well as to provide TA in quarterly national accounts (QNA). The first TA mission on QNA was conducted during August 29-September 2, 2011. The second TA mission dealt with the quarterly flow of funds table and was conducted during October 2–14, 2011. The third mission dealt with the quarterly flow of funds table and the quarterly financial accounts by institutional sector and was conducted during November 28–December 9, 2011. Production accounts, supply and use table, and the majority of accounts for other institutional sectors have been compiled with 2006 as the base year. Preliminary estimates for the period 2006-2008 are expected to be released during the third quarter.
Price statistics:
The consumer price index (CPI), with expenditure weights derived from a (1998/99) household expenditure survey, was introduced in 2001. The CPI covers Managua and eight other cities and is published monthly. Expenditures (weights) and prices in rural areas are excluded. The base year of the CPI was updated from 1994 to 1999, reflecting the improvement in the varieties of basket, the number of respondents reporting prices, and the number of prices collected per month. The CPI is calculated on the geometric average and imputations for missing prices are made. However, the base, basket, and weights of the CPI need updating.
The producer price index (PPI) (July 2006=100) covers a sample of small and medium-size establishments, as well as goods for processing establishments in the tax-free zones (i.e., “la maquila”). Compilation of a PPI began in 1999, and its public release started in May 2004. Historical data are available from 1992. STA provided technical assistance for improving the PPI in January 2006, September 2007, December 2008, and September 2010. The September 2010
2012 ARTICLE IV REPORT—INFORMATIONAL ANNEX NICARAGUA
12 INTERNATIONAL MONETARY FUND
mission helped authorities develop a work plan for expanding the coverage to the service sector.
Government finance statistics (GFS): The fiscal ROSC mission in 2002 and the data ROSC mission in 2005 both found serious weaknesses in fiscal data. In general, government finance statistics are not fully aligned with international standards. The transactional coverage of GFS is still partial in comparison with the GFSM 2001 requirements. Coverage and sectorization issues can be partially explained by the Public Administration Law, which excludes the judicial and legislative branches from the data coverage of the central administration. The fiscal data also present large discrepancies between the overall balance compiled by the Ministry of Finance and Public Credit (MHCP) and the financing data compiled by the BCN. Therefore, stronger collaboration is needed between the MHCP and the BCN to derive more accurate and timely estimates of external and domestic financing of the nonfinancial public sector. A 2004 GFS mission recommended that the envisaged Integrated System of Financial Management be made to support the compilation of GFS data and gradual migration to the GFSM 2001. These recommendations were reiterated by the FAD/STA mission in June 2006. An STA mission conducted in February 2010 found that the authorities are making significant progress in implementing the GFSM 2001 methodology. An STA mission conducted in April-May 2011 recommended the creation of a department in charge of public fiscal statistics (Dirección de Estadísticas de Finanzas Publicas) and requested the reporting of quarterly data for the IFS for the Central Government. In the medium term is expected also the quarterly reporting of the consolidated public sector accounts. The MHCP disseminates government finance statistics (GFS) covering only the central administration, and compiles annual GFS for the nonfinancial public sector (NFPS) for internal use and for reporting to the Western Hemisphere Department. The BCN reports budgetary central government data, albeit with considerable delay, for publication in the International Financial Statistics. In 2006 the MHCP reported GFS data for publication in the GFS Yearbook.
Monetary finance statistics: Monetary statistics are, in general, consistent with the Monetary and Financial Statistics Manual (MFSM), 2000. In April 2008, STA provided technical assistance to help harmonize monetary and financial statistics in the Central American region. A standardized report form (SRFs) for credit cooperatives and insurance companies was compiled based on their accounting records for December 2007. In January 2012, STA provided technical assistance under the second phase of the Regional Project on Harmonization of Monetary and Financial Statistics. The mission developed a work plan to compile surveys for the other financial corporations following the recommendations of the Monetary and Financial Statistics Manual and Monetary and Financial Statistics Compilation Guide. The mission encouraged the authorities of the central bank to start the compilation of monthly data for insurance companies and recommended the compilation of the monetary and financial statistics for credit and savings cooperatives. The mission prepared an action plan aimed at improving the collection, compilation, and dissemination of monetary data.
In December 2011 and May 2012, MCM provided technical assistance to implement stress testing on the banking system. The mission team explained to Central Bank and Superintendency of Banks and Other Financial Institutions (SIBOIF) the process with particular emphasis on hands-
NICARAGUA 2012 ARTICLE IV REPORT—INFORMATIONAL ANNEX
INTERNATIONAL MONETARY FUND 13
on training.
External sector statistics: Balance of payments statistics broadly follow the concepts and definitions set out in the fifth edition of the Balance of Payments Manual (BPM5), within the limits set by the availability of information sources.
Resident institutional units are defined in conformity with BPM5’s concepts of economic territory, residency, and center of economic interest. However, coverage of the private sector is incomplete, in both the current and financial accounts. There are major coverage weaknesses in areas such as services, compensation of border employees, and financial transactions. In February 2007, a STA mission found that the downsizing of staff at the BCN and additional workload unrelated to compiling external sector statistics, have resulted in limited progress in implementing previous STA recommendations.
STA provided technical assistance for improving the balance of payments and the international investment position in April 2009 and April 2010. A one-week CAPTAC TA mission on international investment position statistics also visited Managua in March 2010.
In October 2010 and November 2011 CAPTAC provided technical assistance for improving the compilation of services statistics in the goods and services account of the balance of payments. The External Sector Area (ESA) of the Central Bank of Nicaragua has been using a mix of administrative records and quarterly/annual business surveys to compile services statistics. The ESA faced difficulties while implementing some recommendations regarding services statistics made by previous TA missions. In particular, the ESA was unable to access disaggregated data on insurance services from the Superintendency of Banks and Other Financial Institutions (SIBOIF). Coverage and compilation issues regarding services statistics within the framework of the adoption of the sixth edition of the Balance of Payments and International Investment Position Manual (BPM6) guidelines were addressed. The mission reviewed several questionnaires, particularly those related to foreign direct investment and free trade zones. The authorities have made progress in the implementation of the recommendations regarding services statistics of previous TA. Nonetheless, they need to coordinate with the SIBOIF the implementation of insurance’s accounts catalog, and improve the access of the Central Bank to SIBOIF’s database.
In December 2011, CAPTAC provided assistance on Export, Import and Producer Price Statistics. As part of the national accounts project, the Central Bank of Nicaragua has been developing a system of Integrated Indices of Prices, Value, and Volume for Imports and Exports. Preliminary unit value indices have been developed, nonetheless, some of these unit value indices have been determined to have strange behavior.
Data dissemination: Nicaragua has participated in the General Data Dissemination System (GDDS) since February 2005. Data ROSC was published in December 2005. In April 2012, a STA mission assessed Nicaragua’s data compilation and dissemination practices

2012 ARTICLE IV REPORT—INFORMATIONAL ANNEX NICARAGUA
14 INTERNATIONAL MONETARY FUND
against the Special Data Dissemination Standard (SDDS) requirements for coverage, periodicity, and timeliness, and provided the authorities with recommendations to meet all SDDS requirements. Nicaragua meets the SDDS requirements for coverage for all compiled and disseminated SDDS data categories except for general government operations; balance of payments; and the international investment position. After the implementation of recommendations, Nicaragua could subscribe to the SDDS by end-2013.

Nicaragua: Table of Common Indicators Required for Surveillance (AS OF MAY 29, 2012)
Date of
latest
observatio
n
Date
received
Frequen
cy of
Data7
Frequenc
y of
Reporting7
Frequency
of
Publicatio
n7
Memo Items:
Data Quality –
Methodological
soundness8
Data Quality –
Accuracy and
reliability9
Exchange Rates 5/29/2012 5/29/2012 D D D
International Reserve Assets and Reserve
Liabilities of the Monetary Authorities1
5/29/2012 5/29/2012 D D D
Reserve/Base Money 5/29/2012 5/29/2012 D D D
Broad Money 5/29/2012 5/29/2012 D D D O, LO, LO, LO LO, O, LO, LO, LO
Central Bank Balance Sheet 4/30/2012 5/29/2012 M M M
Consolidated Balance Sheet of the Banking
System
March
2012
5/29/2012 M M M
Interest Rates2 5/24/2012 5/29/2012 W W W
Consumer Price Index April 2012 5/29/2012 M M M O, LO, LO, LO LO, LO, LO, O, LO
Revenue, Expenditure, Balance and
Composition of Financing3 – General
Government4
March
2012
5/10/2012 M M M
LO, LNO, LNO, LO
O, O, O, O, LO
Revenue, Expenditure, Balance and
Composition of Financing3– Central
Government
March
2012
5/10/2012 M M M
Stocks of Central Government and Central
Government-Guaranteed Debt5
Q4 2011 5/10/2012 Q Q Q
External Current Account Balance Q4 2011 5/10/2012 Q Q Q LO, LO, LNO, LO LO, O, LO, LO, LO
INTERN
ATION
AL MO
NETARY FU
ND
15
NICARAG
UA
2012ARTICLE
IVREPO
RT—IN
FORM
ATION
ALAN
NEX
NICARAG
UA
2012ARTICLE
IVREPO
RT—IN
FORM
ATION
ALAN
NEX
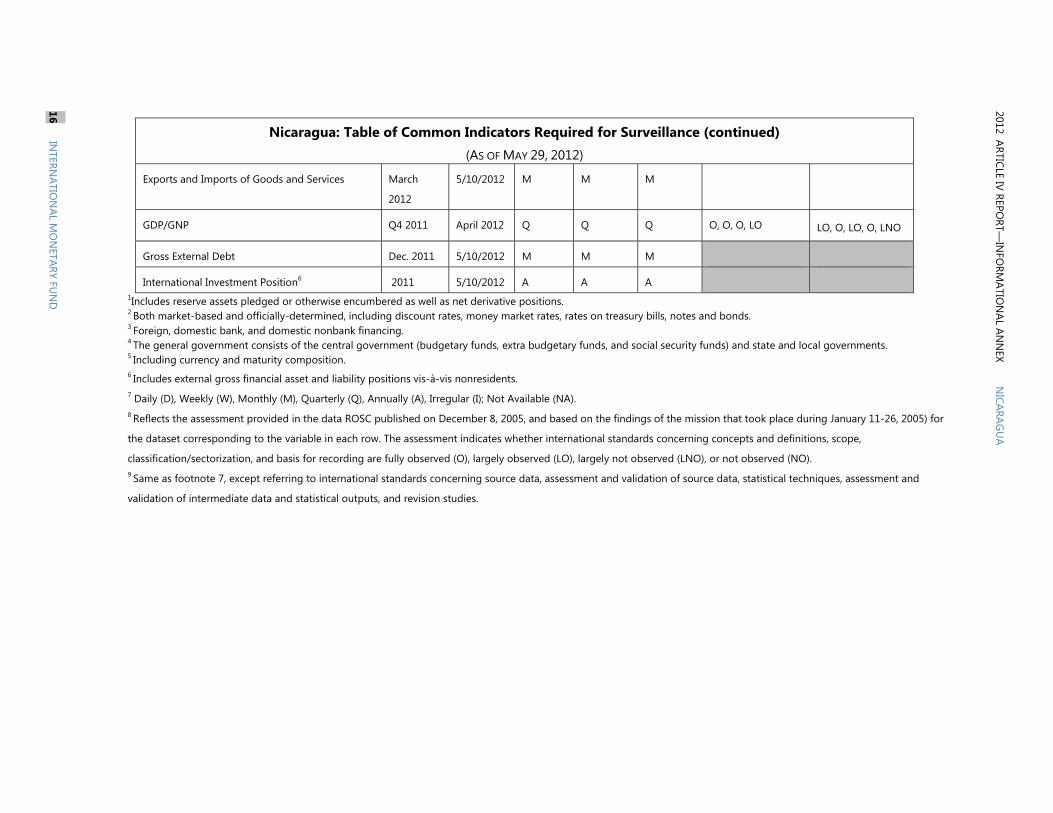
Nicaragua: Table of Common Indicators Required for Surveillance (continued) (AS OF MAY 29, 2012)
Exports and Imports of Goods and Services March
2012
5/10/2012 M M M
GDP/GNP Q4 2011 April 2012 Q Q Q O, O, O, LO LO, O, LO, O, LNO
Gross External Debt Dec. 2011 5/10/2012 M M M
International Investment Position6 2011 5/10/2012 A A A 1Includes reserve assets pledged or otherwise encumbered as well as net derivative positions. 2 Both market-based and officially-determined, including discount rates, money market rates, rates on treasury bills, notes and bonds. 3 Foreign, domestic bank, and domestic nonbank financing. 4 The general government consists of the central government (budgetary funds, extra budgetary funds, and social security funds) and state and local governments. 5 Including currency and maturity composition. 6 Includes external gross financial asset and liability positions vis-à-vis nonresidents.
7 Daily (D), Weekly (W), Monthly (M), Quarterly (Q), Annually (A), Irregular (I); Not Available (NA). 8 Reflects the assessment provided in the data ROSC published on December 8, 2005, and based on the findings of the mission that took place during January 11-26, 2005) for
the dataset corresponding to the variable in each row. The assessment indicates whether international standards concerning concepts and definitions, scope,
classification/sectorization, and basis for recording are fully observed (O), largely observed (LO), largely not observed (LNO), or not observed (NO). 9 Same as footnote 7, except referring to international standards concerning source data, assessment and validation of source data, statistical techniques, assessment and
validation of intermediate data and statistical outputs, and revision studies.
2012ARTICLE
IVREPO
RT—IN
FORM
ATION
ALAN
NEX
NICARAG
UA
16 IN
TERNATIO
NAL M
ON
ETARY FUN
D
Public Information Notice (PIN) No. 12/75 FOR IMMEDIATE RELEASE July 12, 2012
IMF Executive Board Concludes 2012 Article IV Consultation with Nicaragua
On June 27, 2012, the Executive Board of the International Monetary Fund (IMF) concluded the Article IV consultation1 and discussed the Ex Post Assessment of Longer-Term Program Engagement (EPA)2 with Nicaragua. Background Macroeconomic developments in Nicaragua have been broadly positive since 2010. Real gross domestic product (GDP) grew on average 4.6 percent during 2010-11, underpinned by robust consumption and investment. Inflationary pressures abated somewhat to 8 percent by end-2011 (from 9.2 percent at end-2010), as world commodity prices eased. Although the external current account deficit widened in 2011 (to 18 percent of GDP), larger capital inflows (mainly sizable foreign direct investment) produced a small surplus in the balance of payments, thus increasing international reserves.
1 Under Article IV of the IMF's Articles of Agreement, the IMF holds bilateral discussions with members, usually every year. A staff team visits the country, collects economic and financial information, and discusses with officials the country's economic developments and policies. On return to headquarters, the staff prepares a report, which forms the basis for discussion by the Executive Board. At the conclusion of the discussion, the Managing Director, as Chairman of the Board, summarizes the views of Executive Directors, and this summary is transmitted to the country's authorities. An explanation of any qualifiers used in summings up can be found here: http://www.imf.org/external/np/sec/misc/qualifiers.htm.
2 An EPA is required for all members having longer-term program engagement with the Fund. EPAs are intended to provide an opportunity to step back from continuing program relations to consider an analysis of the economic problems facing the country, review progress under Fund-supported programs, and draw forward-looking lessons for future Fund engagement.
International Monetary Fund 700 19th Street, NW Washington, D. C. 20431 USA

2 The fiscal outturn of 2011 surpassed expectations. The tax reform of 2009 and the strong output recovery boosted tax revenues, while central government spending as a share of GDP remained broadly stable. As a result, the central government recorded a surplus of 0.6 percent of GDP (following a deficit of 1 percent of GDP in 2010), which was primarily used to pay down debts of the state-owned electricity generation company. Elsewhere in the public sector, a deterioration in the fiscal result of the social security system, the municipality of Managua, and the state-owned enterprises was partly offset by a smaller operating deficit of the central bank than in 2010. On net, the consolidated public sector recorded a small surplus for the first time since 2007.
Monetary policy continued to bolster the international reserves position and conditions in the financial system strengthened. The central bank maintained the crawling-peg system, which helped anchor inflation expectations. Banks’ liquidity remained ample while credit growth picked up significantly towards the end of the year. Nonperforming loans ratios declined as banks’ profitability improved and deposits (in local and foreign currency) rose.
Looking ahead, real GDP growth is expected to slow in 2012 and inflation to rise to between 8 and 9 percent owing to oil price increases. The consolidated public sector is projected to post a deficit in 2012 as some spending pressures resurface, but its fiscal position is expected to improve gradually in the medium term with expenditure restraint at the level of the central government, central bank, and state-owned enterprises. The external current account balance is expected to widen in 2012 on the back of weaker external demand and a larger oil bill, which would reduce moderately the international reserves coverage. Risks to the economic outlook for 2012 are tilted to the downside given Nicaragua’s exposure to economic activity abroad.
The Ex Post Assessment (EPA) reviewed Nicaragua’s performance under the 2007–11 program supported by an Extended Credit Facility (ECF) arrangement. The EPA concluded that although the Nicaraguan economy was buffeted by a series of adverse shocks between 2007 and 2011, the ECF-supported program was effective in helping the authorities develop an appropriate policy framework to support macroeconomic stability. The program also paved the way for some reforms of the tax system and the energy sector, but it fell short in key areas, such as pensions and public financial management.
Executive Board Assessment Executive Directors welcomed Nicaragua’s robust economic recovery and favorable macroeconomic performance on the back of sound policies, high export prices, and large investment inflows. Nevertheless, Directors underscored that important macroeconomic and structural challenges remain to be addressed, including widespread poverty and large external imbalances. With downside risks prevailing due to the uncertain global environment, Directors encouraged the authorities to maintain prudent macroeconomic policies and step up the pace of structural reform.
3
Directors stressed that fiscal consolidation should be the cornerstone of macroeconomic stability. With wage bonuses and higher electricity subsidies worsening the fiscal outlook for 2012, Directors urged firm expenditure restraint. In the medium term, reforms to strengthen further the revenue effort and to revamp the pension system will be critical, alongside current expenditure restraint, in accommodating higher social and infrastructure spending while maintaining fiscal sustainability. Particularly important will be to widen the tax base by curtailing exemptions.
Directors underscored that reducing external vulnerabilities related to the large external current account deficit will be a key challenge in the period ahead. They supported plans to cut back on oil imports and increase international reserves. They also stressed the importance of reducing the size and improving the composition of the public debt, and encouraged the authorities to step up efforts to obtain debt relief on HIPC terms from non-Paris Club creditors.
Directors urged the authorities to prioritize and address the key structural impediments to growth and poverty reduction. They highlighted the need to strengthen governance and institutions, improve public financial management, reduce labor market informality, and tackle weaknesses in the energy sector.
Directors welcomed the progress in improving banking supervision, reflected in the overall soundness of the financial system. They encouraged concerted action to deal with remaining vulnerabilities, including increased collaboration with regional supervisors. Directors welcomed the creation of a financial intelligence unit, and urged the authorities to seize the opportunity to bring the regime against money laundering and terrorism financing into compliance with international standards.
Directors welcomed the conclusion of the Ex Post Assessment that the Fund’s engagement in Nicaragua during 2007–11 contributed to macroeconomic stability. They noted, however, that exogenous shocks and at times weak program ownership led to uneven progress in structural reforms. In light of this, Directors highlighted several lessons for the future. In particular, Directors stressed that policies should have strong ownership by the authorities, structural reforms should be well designed and well targeted, and implementation should be flexible to accommodate unexpected shocks and capacity constraints.

4
Public Information Notices (PINs) form part of the IMF's efforts to promote transparency of the IMF's views and analysis of economic developments and policies. With the consent of the country (or countries) concerned, PINs are issued after Executive Board discussions of Article IV consultations with member countries, of its surveillance of developments at the regional level, of post-program monitoring, and of ex post assessments of member countries with longer-term program engagements. PINs are also issued after Executive Board discussions of general policy matters, unless otherwise decided by the Executive Board in a particular case.
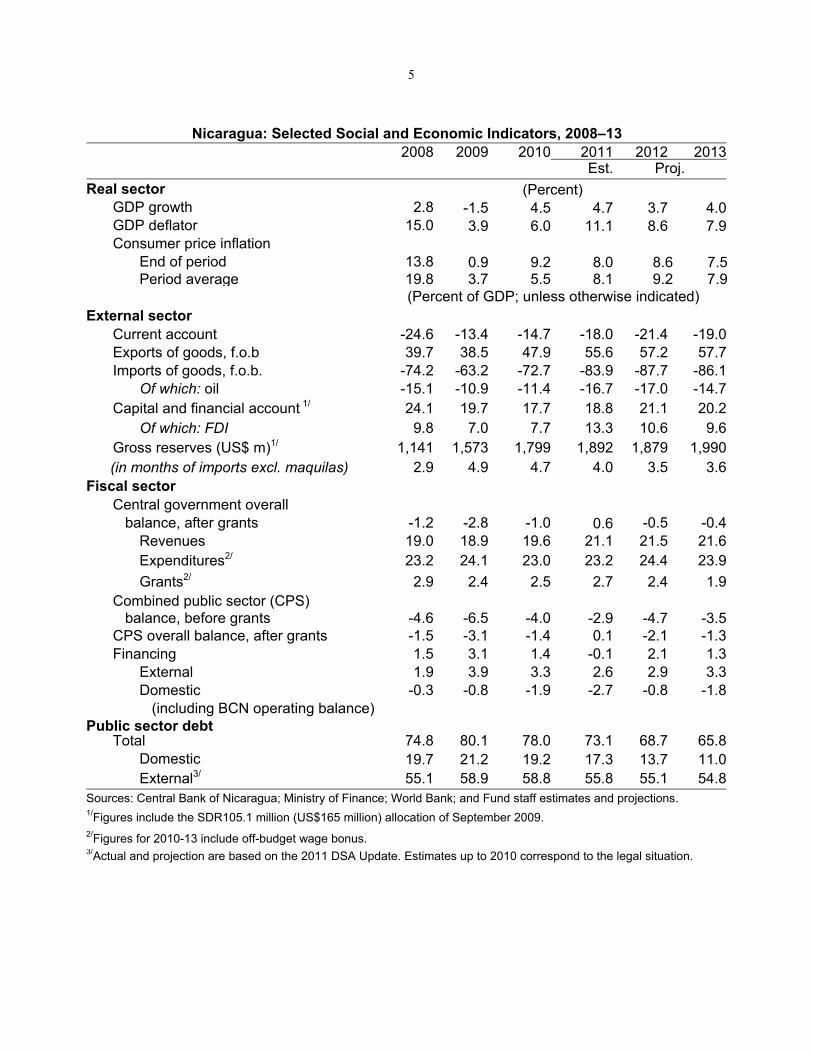
5
Nicaragua: Selected Social and Economic Indicators, 2008–13 2008 2009 2010 2011 2012 2013
Est. Proj.
Real sector (Percent) GDP growth 2.8 -1.5 4.5 4.7 3.7 4.0GDP deflator 15.0 3.9 6.0 11.1 8.6 7.9Consumer price inflation
End of period 13.8 0.9 9.2 8.0 8.6 7.5Period average 19.8 3.7 5.5 8.1 9.2 7.9
(Percent of GDP; unless otherwise indicated) External sector
Current account -24.6 -13.4 -14.7 -18.0 -21.4 -19.0Exports of goods, f.o.b 39.7 38.5 47.9 55.6 57.2 57.7Imports of goods, f.o.b. -74.2 -63.2 -72.7 -83.9 -87.7 -86.1
Of which: oil -15.1 -10.9 -11.4 -16.7 -17.0 -14.7Capital and financial account 1/ 24.1 19.7 17.7 18.8 21.1 20.2
Of which: FDI 9.8 7.0 7.7 13.3 10.6 9.6Gross reserves (US$ m)1/ 1,141 1,573 1,799 1,892 1,879 1,990(in months of imports excl. maquilas) 2.9 4.9 4.7 4.0 3.5 3.6
Fiscal sector Central government overall balance, after grants -1.2 -2.8 -1.0 0.6 -0.5 -0.4
Revenues 19.0 18.9 19.6 21.1 21.5 21.6Expenditures2/ 23.2 24.1 23.0 23.2 24.4 23.9
Grants2/ 2.9 2.4 2.5 2.7 2.4 1.9Combined public sector (CPS) balance, before grants -4.6 -6.5 -4.0 -2.9 -4.7 -3.5CPS overall balance, after grants -1.5 -3.1 -1.4 0.1 -2.1 -1.3Financing 1.5 3.1 1.4 -0.1 2.1 1.3
External 1.9 3.9 3.3 2.6 2.9 3.3Domestic -0.3 -0.8 -1.9 -2.7 -0.8 -1.8 (including BCN operating balance)
Public sector debt Total 74.8 80.1 78.0 73.1 68.7 65.8
Domestic 19.7 21.2 19.2 17.3 13.7 11.0External3/ 55.1 58.9 58.8 55.8 55.1 54.8
Sources: Central Bank of Nicaragua; Ministry of Finance; World Bank; and Fund staff estimates and projections. 1/Figures include the SDR105.1 million (US$165 million) allocation of September 2009. 2/Figures for 2010-13 include off-budget wage bonus. 3/Actual and projection are based on the 2011 DSA Update. Estimates up to 2010 correspond to the legal situation.
Statement by Mr. Pérez-Verdía, Executive Director for Nicaragua, and Mr. Cosenza Jimenez, Advisor to Executive Director
June 27, 2012
We would like to thank staff for their illustrative and balanced reports and for their constructive dialogue with our authorities. Our authorities concur with the main messages of the reports and we simply wish to emphasize the following points:
1. Recent Economic Developments
As the reports indicate Nicaragua’s macroeconomic situation is sound and stable with the central government and the consolidated public sector posting a 0.6 percent and 0.1 percent surplus, respectively, in 2011. Current expenditure was reduced, tax revenues increased in 2011 and reserves are at a comfortable level. Public external debt remains stable at about 55 percent of GDP. Economic growth is expected to remain in the 4.0-4.7 percent range, while inflation will be in the 7-9 percent range. Bank capitalization and liquidity are ample and nonperforming loans have decreased to 2.2 percent.
The authorities plan to issue their new medium term economic and financial program in the next couple of months. The program will continue to gear policy towards the attainment of social objectives, in a context of strengthened macroeconomic stability. In the near term the government will continue to promote fiscal consolidation in a context of increased public investment to support growth.
The authorities continue to place great importance on equitable growth and on pro-poor spending. As a result, poverty continues to decrease. It is estimated that the percentage of the population living under the international poverty line, that is those earning less than $2 per day, decreased from 48.3 percent in 2005 to 42.5 percent in 2009.
2. Outlook and Policies
The Formal and Informal Sectors
In spite of the significant accomplishments mentioned in the previous paragraphs, Nicaragua is still beset by widespread poverty and low income per capita. Poverty has indeed fallen, but not enough or sufficiently fast. Indeed, deeper poverty reduction demands faster economic growth; which in turn requires higher economic productivity.
The authorities agree with staff that one of the main obstacles to higher productivity is the size of the informal sector. The temporary and ephemeral nature of informal employment discourages investing in worker training and in the technology and tools necessary to raise productivity. The authorities are fully cognizant of the need to reduce the size of the informal sector. Consequently, they seek to decrease or eliminate the perceived disadvantages of formalization, while simultaneously explaining its inherent advantages. This requires, inter alia, the simplified access to micro finance services and the elimination of red tape and onerous charges and taxes levied on micro and small enterprises. It also demands better monitoring efforts to ensure that companies do not operate clandestinely in the informal

2
sector simply to avoid paying a fair wage and providing social benefits to their employees while simultaneously evading taxes and social security contributions. To this end, simplified electronic processes are being implemented to reduce red tape and taxes are being kept low for micro and small enterprises. In addition, a single identification number will be issued to all companies by the national and local governments and by the Social Security Institute, thus ensuring that registration with any one of them will lead to registration with the other two, thereby rendering evasion more difficult.
The government’s strategy to reduce the informal sector also comprises investing wisely in health, education and in infrastructure, particularly in the electricity sector. The authorities are committed to improve the composition and effectiveness of public spending prioritizing infrastructure investment. This commitment already bore fruit in 2011.
Informality notwithstanding, Nicaragua has recorded important gains in competitiveness. Nevertheless, the authorities are aware of the need to continue to improve the business climate and the staff reports recognize steady improvements in external competitiveness, in a framework of an export strategy based on product diversification, the consolidation of traditional and new markets and the negotiation of free trade agreements. Furthermore, important efforts are being made to achieve a broad consensus on key economic decisions, through a tripartite approach involving the private sector, workers and the government. As a consequence of these efforts direct foreign investment reached a record in 2011 when $967 million flowed into the economy, nearly doubling the 2010 figures. The investment-promotion agency, Pro Nicaragua, actively seeks foreign investment and its efforts are partially responsible for the recent surge in investment flows. The relative calm and social cohesion that prevail in the country bode well for continued foreign direct investment flows henceforth.
The Electricity Sector
The authorities wish to acknowledge that the document Lifting a Constraint on Growth: Achievements and Challenges of Nicaragua’s Electricity Sector, included in the Selected Issues annex, has made a valuable, and welcome, contribution to the understanding of the sector issues. As that document indicates, Nicaragua, as a non oil-producing country, has suffered from the steep fuel price increases registered in the last decade. Electricity production is predominantly (70 percent) fuel-based. Nicaragua, however, is endowed with ample natural resources that can be harnessed to meet its electricity needs and the authorities are committed to dramatically altering the status quo by 2017. By then it is expected6 that 75 percent of the electricity will be generated with natural, renewable resources, mainly hydroelectric, geothermal, eolic and biomass, where additional 270MW, 100 MW, 120 MW and 20 MW, respectively, are expected to come on-line by 2016. Several private companies, local and foreign, are already building the generating stations that will sell their renewable energy to the private distribution companies that already operate in the country, with the state assuming a subsidiary role.
This transformation of the electricity sector underpins the authorities’ strategy to address the financial difficulties that beset it. The tariffs currently charged to consumers would appear adequate for the cost of producing, transmitting and distributing electricity once the new
3
renewable energy generating stations are commissioned. The issue therefore is how to best bridge the financial gap that the sector will experience between now and 2017. The authorities fully understand that a financially healthy sector, with adequate generation capacity and tariffs, low electricity losses and targeted subsidies, is a fundamental precondition for accelerated growth. Based on this understanding, they currently work in the definition of the strategy to follow in the 2012-2017 transition period, as they expect that the situation will be vastly ameliorated once the new, renewable energy stations come into operation by 2017.
Social Security Reform
The authorities appreciate the advice and technical assistance that the Fund has provided on this issue. They fully recognize the importance of the issue and the need to proceed cautiously so as not to erect an additional barrier to formalization. The authorities intend to undertake a public consultation process with regard to the social security reform and, once that process is concluded, to submit a proposal to the National Assembly to modify the current system.
3. Fiscal Policy
The authorities remain firmly committed to further consolidate public finances by continuing to control expenditures and enhance revenue collection. As stated in the Article IV Staff Report, expenditures were contained in 2011 and revenue collection improved. Nicaragua’s tax burden is 19.4 percent, which is reasonable for a low income country. Nevertheless, the authorities have decided to complete the tax reform process begun in 2009 in order to render the system more progressive and equitable, while simultaneously making it simpler to operate and monitor. Although revenue enhancement is not the goal of the reform, it is likely that a streamlined system which reduces tax incentives and exemptions and incorporates the proper use of transfer prices will result in higher revenues. The authorities have recently begun a consultation process with all stakeholders, including the private sector. It is expected that the result of this participative and transparent process will culminate in September so that the anticipated results of the reform may be reflected in the budget to be submitted to the National Assembly in mid October. It is estimated that the National Assembly will subsequently enact this new tax legislation and that the new system will be implemented in 2013.
Finally, the authorities are committed to improve the quality of expenditure thereby creating the space for additional investment in infrastructure, in human capital and in the social safety nets. The authorities’ resolve is evinced in the current expenditure reduction posted in 2011.
4. Monetary and Exchange Rate Policies
The Staff Report for the Article IV Consultation states that the exchange rate is “broadly in line with fundamentals”. The authorities will continue to implement an announced annual devaluation with respect to the US dollar, as this has served the country well hitherto. As indicated in the Staff Report, reserves remain at a comfortable level, amounting to the equivalent of 2.6 times the monetary base. Although the current account deficit (18 percent

4
of GDP) might appear high, it reflects Nicaragua’s high dependence on oil imports and significant investment needs. This deficit has been partially offset by the recovery of important flows, in particular, remittances (mainly from the USA and Costa Rica) which are now stable and estimated to be about 12.5 percent of GDP, while income from tourism represents 5 percent of GDP. The remaining current account deficit is fully financed with FDI, grants and concessional loans.
5. Financial Sector Policy
In the financial sector the authorities will continue to upgrade regulation and supervision, as well as expand the supervisory perimeter to include microcredit organizations and credit cooperatives. In general, the sector is healthy and no major issues afflict it. Furthermore, the micro credit subsector is on firmer ground after new legislation was enacted to promote and regulate it.
6. Debt Management Policy
About one quarter of the outstanding public external debt is with non-Paris Club members. Although the negotiation process has been excruciatingly slow, the authorities remain steadfast in bringing it to fruition. Furthermore, the authorities’ commitment to further fiscal consolidation ensures a reduction of the public debt henceforth. Finally, the authorities will continue to prioritize external financing through grants and concessional loans, while developing the domestic debt market. In order to further advance in pending debt relief, Nicaragua will, once again, request full participation of all creditors in the debt reduction initiatives.
7. Aid and Transparency
As mentioned in the reports, Nicaragua receives substantial financial support from several sources, including Venezuela. In the latter case, assistance is provided through a private sector entity, without sovereign guarantee and its use, along with that of other important external financing, is transparently presented in a biannual report on official external aid. The staff reports also delve into the deleterious consequences of a sudden stop of the Venezuelan support. However, the question of sustainability of the support provided by Venezuela is no different from that of other important partners, and the historically strong ties between Nicaragua and Venezuela render the probability of such an event extremely low. Nevertheless, if the risk of reduction of external aid was to materialize, the necessary adjustment would be implemented to limit a significant adverse impact on the fiscal position.
8. Conclusion
As the Ex Post Assessment indicates, the ECF program recently completed by Nicaragua was quite successful. Although the international environment worsened significantly after the program was initiated, the Fund and the authorities responded flexibly and adapted the program to the new reality. Given these circumstances, it is not surprising that the completion of some of the reviews was delayed. However, the authorities persevered and the program was successfully completed. This clearly attests the ownership of the program by the
5
authorities. In fact, the successful performance in the last two programs evinces Nicaragua’s strong ownership of the programs supported by the Fund.
We close by reiterating our appreciation for the thorough and detailed work that underlies the reports prepared by the IMF mission teams. Our authorities appreciate the high quality dialogue that resulted from their visits to Nicaragua and will give due consideration to their recommendations and observations.