stabilization a clay soil by electrokinetic technique
TRANSCRIPT

ORE Open Research Exeter
TITLE
Stabilisation of clay soil with polymers through electrokinetic technique
AUTHORS
Estabragh, AR; Moghadas, M; Javadi, AA; et al.
JOURNAL
European Journal of Environmental and Civil Engineering
DEPOSITED IN ORE
16 December 2019
This version available at
http://hdl.handle.net/10871/40109
COPYRIGHT AND REUSE
Open Research Exeter makes this work available in accordance with publisher policies.
A NOTE ON VERSIONS
The version presented here may differ from the published version. If citing, you are advised to consult the published version for pagination, volume/issue and date ofpublication

Stabilization of clay soil with polymers through electrokinetic technique
A. R. Estabragha, M. Moghadasa, A. A. Javadib & J. Abdollahia
aFaculty of Soil and Water Engineering, University of Tehran, Karaj, Iran bComputational Geomechanics Group, Department of Engineering, University of Exeter,
Exeter, UK Abstract
In this work the effect of migration of two polymers, namely polyethylene oxide (PEO)
and sodium carboxymethyle cellulose (CMC) with concentrations of 2, 4 and 6 g/L on
improvement of a clay soil is investigated through a program of experimental tests. The
tests were conducted in a special apparatus under the voltage of 50 volt and over a period
of 7 days. During each test, the values of pH and EC in the two reservoirs, discharge fluid
from the cathode reservoir were measured at different time intervals. At the end of each
test the strength of soil was measured across the length of sample. SEM tests were also
carried out at the end of the test on the samples. The results showed that both polymers
caused significant increase in the settlement and undrained shear strength of the soil but
the maximum strength was obtained at concentration of 4 g/L. At this concentration the
values pH and EC at the cathode reservoir were about 13 and 48 dS/m for both polymers.
The SEM results revealed that the increase in strength is due to the covering of the particle
surfaces and penetration of the polymer between the spaces of soil particles.
Key words: Electrokenetic, polymer, distilled water, clay soil, settlement, strength

2
Introduction
One of the challenges of geotechnical engineering is to improve the physical and
mechanical properties of the problematic soils. These soils may be used as foundation
material or as material for construction work. Improving the physical and mechanical
properties of a soil will improve its performance such that it will be able to support the
applied loads without risk of failure or excessive deformation. The selection of an
appropriate method for soil improvement or stabilization is dependent on the type and
nature of the soil. Soil stabilization methods can be divided into those that are applicable
to non-cohesive soils and those for cohesive soils. In the present work, only the techniques
that are used for improving the cohesive soils are considered.
The stability of buildings is dependent on the soil on which they are founded. In cases
where soft clay soil forms a large area of a town or city and there is a lack of suitable soil,
the improvement of this kind of soil should be considered before any design and
construction of buildings. One of the soil improvement methods is to use surcharge or
preloading to increase the strength and limit the settlement of the soil. However, this
method takes a long time to achieve the desired behaviors (Charles & Watts, 2002). In
order to decrease the time, it is possible to increase the weight of the surcharge but it may
cause sudden failure of the ground. Another method for decreasing the time of

3
improvement is installation of vertical drains and it can be used for surface and deep soils.
Chemical techniques are also used for improving the behavior of cohesive soils. In these
methods usually calcium ions are produced in the mass of soil based on the agents such as
lime or cement (Bahar et al.; 2004 and Al-Rawas et al.; 2005). These chemical methods
have been used satisfactory for many decades. Recently new compounds have been
introduced that when mixed with cohesive soils, they could undergo reactions to yield a
solidified material. It has been found that organic chemicals can be mixed with soil where
polymerization reactions bind the soil particles together (Brown et al.; 2004). Some
researchers such as Ajayi-Majebi et al. (1991), Bolander (1999) and Tingle & Santoni
(2003) examined the use the resin as an addictive agent for stabilization of soils. Bolander
(1999), Tingle & Santoni (2003) and Estabragh et al. (2011 and 2013) investigated the
effect of different resins on the strength of soil. They reported that adding the desired resin
can increase the tensile strength and unconfined compressive strength of cohesive soil.
Rauch et al. (2002), Katz et al. (2001) and Inyang et al. (2007) also conducted a series of
laboratory experiments to evaluate the effects of polymers on treatment of clay soils. Pore
water can have an important influence on the stability of soils. The strength and stability
of soil are dependent on the effective stress and hence, on the change in pore water pressure.
Dewatering is a technique of improving soil behavior by reducing pore water pressure and
water content (Casagrande, 1952 and Bjerrume et al., 1967). In practice, for safe and
economic design of electro-osmotic projects in the field, some information about design
parameters is required. Parameters such as Ke (electro-osmosis permeability), Kh (hydraulic
permeability), E (electric field intensity) and ρ (energy consumptions) can be determined
through a set of laboratory experiments (Shang & Mohamedelhassan, 2001).

4
Another problem that engineers may be faced is how to improve the soil under a founded
building. The above methods can not be used for this case as they may lead to settlement
of buildings. Al-Shawabkeh & Sheahn (2003) proposed the freezing, hydrofracture
grouting and electroosmotic consolidation for such cases. Using these methods may cause
considerable movement of the ground and can be a potential cause of damage to the
adjacent and overlying structures. Rogers et al. (2003), Al-Shawabkeh & Sheahn (2003)
and Barker et al. (2004) suggested that, to overcome this problem, it is possible to use
chemical improvement under an electrical current. In this method the chemical ions are
transported between two installed electrodes and the desired improvement is achieved. This
type of stabilization is known as electrokinetic stabilization and involves the use of
electrokinetics to draw stabilizing chemicals through the soil. In this technique, by applying
a direct current (DC) under a specific gradient an electrical field is provided across the
mass of soil through two electrodes to facilitate the migration of stabilizing agents into the
soil. Rogers et al. (2003) stated that this method is suitable for soils with low permeability
and can be used without any excavation of soil and for improving the soil beneath a
foundation.
This method of soil improvement was adopted at the end of 1990s. Ozkan et al. (1990)
studied the use of electrokinetics for injection of ions of aluminium and phosphate to
stabilize kaolinite and they reported increase in strength up to 50-60%. Lefebre & Burnette
(2002), Mohamedalhassan & Shang (2003), Alshawabkeh & Sheahan (2003),
Alshawabkeh et al. (2004), Otsuki et al. (2007), Chien et al. (2009), Ou et al. (2009) and
Abdullah & Al-Abadi (2010) also reported that injection of ionic solutions to soil under an
electric voltage can improve the strength of soft clay soil. In this technique the cations in a
5
saline solution may migrate in clay soil under the electric field. The cationic ions may cause
cation exchange on clay particles which can cause a change of clay structure and lead to
improvement of the soil. Paczkowska (2005) examined the injection of a polymer to a clay
soil by this method and found it is effective in increasing the strength parameters of the
clay soil.
In recent years, special attention has been paid to the polymer materials for use in civil
engineering projects. This is because of their suitable properties such as tightness, good
aging stability; resistance to gasoline, organic solvents and strong inorganic acids and bases
(Paczkowska, 2005). Paczkowska (2005) showed that by using a polymer the amount of
outflow of water could be about 3.5-3.85 times more than using distilled water. To achieve
the desired strength, it is possible to reduce the duration of treatment or increase distance
between the anode and cathode both of which would reduce the cost of treatment. Although
some research works have been done on the treatment of clay soils by injection of ions
under electrical field, but treatment of clay soil by injection of polymer materials is
relatively rare, except the research work reported by Paczkowska (2005). The research
work by Paczkowska (2005) is limited to one type of polymer material and the measured
data is limited to liquid flow in and out of soil, electrical current and water content. The
focus of this work is to study the effects of different polymers and determine the optimum
concentration of the used polymers. In this work two types of polymer were selected.
Injection tests were conducted at different concentrations and the values of pH, EC
(Electrical Conductivity), Ke (Electro-osmotic permeability) and strength of the treated soil
were measured during or at the end of the tests. The effects of the two polymers were
compared with each other and with distilled water and the best concentration for field work

6
was recommended. The experimental procedures and results are presented in the following
sections.
Materials
The main materials that were used in this work were soil, water and polymers. A brief
description of the materials is presented below.
Soil
The soil used in the testing program was a fine grained soil comprising 10% sand, 56% silt
and 34% clay. Laboratory tests to determine specific gravity, liquid limit (LL), plastic limit
(PL), shrinkage limit (SL), grain size distribution and compaction characteristics were
conducted according to the ASTM standards. Tables 1 and 2 summarize the various
physical, mechanical and chemical properties of the soil. The soil can be classified as clay
with low plasticity (CL) according to the Unified Soil Classification System (USCS). XRD
(X-ray diffraction) tests were also conducted on the samples of this soil. Based on the XRD
tests, the minerals of the soil include quartz, calcite, feldspar (Na, Ca) and feldspar (K).
The results also show that the clay minerals of the soil are illite, chlorite and
montmorillonite.
Water
Drinking water was used for conducting the tests. It had a pH of 7.0, Cl content of 1.7
meq/L and Ca-Mg content of 9.1 meq/L.
Polymer
Two different types of polymer were used in this work. They were polyethylene oxide
(PEO) and Sodium carboxymethyl cellulose (CMC). These polymers were used by Inyang
et al. (2007) for cotrolling the volume change of an expansive soil. Selected of these

7
polymers was based on their high aqueous solubility, medium to high biodegradability, low
toxicity (or nontoxicity) and low cost.
a- Polyethylene oxide (PEO)
Polyethylene oxide (PEO) is a polymer with chemical formula (-(CH2CH2O)n-) that is
obtained by polymerization of ethylene oxide. It is commercially available over a wide
range of molecular weights. PEO with different molecular weights has different
applications and physical properties (e.g. viscosity) due to the chain length effects. It is in
liquid or low melting solid state depending on its molecular weight. Therefore, it is a
compound with many applications from industrial manufacturing to medicine. It has low
toxicity and is a water soluble polymer. The PEO used in this research was a white powder
with melting point 65-67oC. Its bulk density and particle size were 0.3 to 0.5 kg/L and 1000
um respectively. The PEO used had a low molecular weight (200000 g/mol) with neutral
charge.
b- Sodium carboxymethyl cellulose
Sodium Carboxymethyl cellulose (CMC) is a plant based “green” and inexpensive natural
polymer consisting of glycopyranose units with non-toxic, biocompatible, and
biodegradable nature (El-Newehy et al., 2016). Due to being water soluble, CMC possesses
both carboxylate and hydroxyl groups
The pure Sodium Carboxymethyl cellulose is white or milk white fibrous powder or
particles and tasteless. It is soluble in water but insoluble in organic solvents. Its chemical
formula is [C6H7O2(OH)2OCH2COONa]n and its viscosity is within 25-50 Pa.s. It is a non-
toxic and aqueous solution and is neutral or alkaline. Sodium Carboxymethyl cellulose is
8
used for producing sodium salt, as well as ammonium and aluminum salts.The CMC that
was used in this work had a molecular weight of 80000 g/mol with negative charge.
Solutions with concentrations of 2, 4 and 6 g/L of these polymers were examined in this
work. To prepare a desired solution, the required mass of the polymer was poured to a
graduated container and then distilled water was added until the volume reached to 1 liter.
It was shaken thoroughly before it was ready to use.
Apparatus
Based on the considerations reported by previous researchers, an apparatus was designed
and made for this work, similar to the one used by Rittirong et al. (2008) and
Mohammedalhassen & Shang (2001). The apparatus consists of a main cell, loading frame
and D.C. power supply as shown in Fig. 1. The main section of the apparatus is the cell
that consists of a rectangular tank (with length, width and height of 30, 10 and 30 cm
respectively) that holds the soil sample. It was made of Plexiglas plates with 1 cm thickness.
Two reservoirs, namely anode and cathode, were added on the two sides of the main cell
and were connected to the cell through perforated Plexiglas sheets as shown in Fig. 1. The
reservoirs were filled with fluid and the total hydraulic head in them was controlled by
adjusting two identical standing tubes through valves. Two electrodes made of stainless
steel sheets (also used by Paczkowska, 2005) were added to allow the liquid to pass easily.
The electrodes were rectangular in shape and had holes with 1 mm diameter. They were
placed vertically at a distance of 5 cm from the soil in the main cell. Geotextile sheets were
used between soil and electrode compartments to prevent from loss of soil (Jeon et al. 2010
and Kim et al. 2009 used filter paper and porous stone between soil and electrode
compartments). These sheets were saturated (by submerging in the same liquid as the one
9
used in the anode and cathode reservoirs) and then placed on the two sides of sample. Being
saturated, the sheets could not absorb the pore water from the sample and sample remained
in saturated condition. A number of voltage probes were installed at the bottom of the cell
at distances 0.15, 0.3, 2, 3, 5, 8 and 11 cm from the anode. The diameter of the probes was
1 mm and they were made from iridium oxide (as used by Rittirong et al., 2008). These
probes were used to measure the voltage in certain time intervals during the progress of the
test. A loading system was designed to apply the desired load to the soil sample (see Fig.1).
It consists of a plate that is placed on top of the sample and is connected to another plate at
the bottom of cell through a bar coated with a foam material that is isolated against
electrical current. The load was applied through the bottom plate to the sample. A dial
gauge was mounted on the top plate for measuring the vertical deformation due to
consolidation. The power supplier of D.C. current consisted of a generator that produced
various ranges of voltage and was connected to the electrodes through the connections.
Sample preparation
A specific amount of air-dried soil was mixed with water to bring its water content to 5%
above the liquid limit. The soil was mixed by hand steer for about 1 hour until a smooth
condition was achieved. This mixture was kept in a plastic bowl with closed lid for about
10 days for uniform distribution of water content. The strength of the prepared soil was
measured by using shear vane apparatus in random points of the soil. The prepared soil
sample was placed at three layers in the main cell and each layer was subjected to 5 minutes
of vibration. During vibration the small air voids that were formed while placing the soil
in the main cell were disappeared by vibration. After that a saturated geomembrane was

10
placed on top of the soil to create horizontal flow condition. The level of fluid was kept the
same in the anode and cathode reservoirs at two sides of the soil in the main cell.
Experimental tests
The experimental tests were conducted in two groups: in group 1 the anode and cathode
reservoirs were filled with distilled water while in group 2 the anode reservoir was filled
with desired polymer solution and the cathode reservoir with distilled water. The
procedures for both groups were as follows.
After placing the sample of soil in the main cell the anode and cathode were filled with
desired fluid and then a surcharge pressure of 1.0 kPa was applied to the soil via the loading
plate. The level of fluid was kept constant at both reservoirs and consolidation was recorded
using a dial gauge. The consolidation settlement stopped after about five days. This
consolidation stage under the surcharge pressure will be referred to as preloading
consolidation stage. Osmosis consolidation was carried out after the preloading
consolidation stage by keeping the fluid levels constant in the anode and cathode reservoirs.
Therefore, the hydraulic gradient between the two reservoirs was set to zero. The osmosis
consolidation was enforced by applying a D.C. current through the soil. During the test the
changes in vertical deformation were measured using a dial gauge and the changes in
volume of the sample were determined by measuring the volume of discharge fluid that
flowed out from the cathode reservoir. In addition, the values of pH and EC of the fluid in
both reservoirs were measured during the test. The total time for the consolidation stage
was about 10 days for different voltages. The tests were conducted in a temperature control
room at 20-22oC. The temperatures of both reservoirs during the test were measured from
time to time and were nearly the same. It was not realized that during the injection of

11
polymer materials to the soil they were decomposed and changed to toxic gas. When the
test was completed the surcharge load and the geomembrane were removed. After that the
undrained shear strength of soil was measured by using shear vane apparatus. This was
performed at the distances of 4, 11, 18 and 26 cm from the anode. A number of samples
were also taken from these points after the strength tests for determination of water content
and Atterberg limits.
At the end of each test scanning electron microscopy (SEM) tests were performed on the
samples that were taken from at the anode, middle and cathode in order to observe the
microstructure of the samples in different conditions. The samples were scanned under
SEM following the method that was used by Tremblay et al. (2002).
Results
The results obtained are discussed in the following sections.
pH
Fig.2 shows the variations of pH at the anode and cathode reservoirs for different fluids
during the tests. The results show that the initial values of pH for distilled water and all
polymer solutions at anode and cathode reservoirs are nearly the same (i.e. pH=7) . During
the test by increasing the time, the values of pH at the anode decreased for all fluids but
they increased at the cathode. At the end of the test, the value of pH at cathode for distilled
water was 12.4 but for the other solutions it was more than 13.3. This shows that the effect
of these solutions in creating an alkaline environment is more than distilled water. At the
end of test, the value of pH at anode was 4.8 for distilled water. However, for the different
solutions of CMC and PEO the values of pH decreased from initial values but there was no
specific trend with increasing the concentration. The value of pH for anode reservoir at

12
concentration 4 g/L was less than the other concentrations for both polymers. Comparing
the results of pH at cathode for both polymers indicates that the value of pH for PEO nearly
the same as CMC. In other words, the effect of both polymers solutions is important in
creating basic in cathode reservoir.
EC (Electrical Conductivity)
The variations of EC with time at the anode and cathode reservoirs during the tests are
shown in Fig.3. The results show that during the tests, the values of EC for both anode and
cathode increased from their initial values by increasing the time. For example the initial
values of EC for distilled water at anode and cathode were 1.37 and 1.16 dS/m respectively
and they are changed to 17 and 60 dS/m at the end of the test. This trend of variations is
also seen for CMC solution with different concentrations. The initial values of EC at
concentration of 2 g/L CMC at anode and cathode were 4.58 and 2 dS/m respectively but
at the end of the test they changed to 11.03 and 36.8 dS/m. The results show that by
increasing the concentration of CMC the values of EC at anode were increased and the
amount of increase is dependent on the concentration of CMC. This trend of variation was
also observed for oxide with concentrations of 2 and 4 g/L of PMC but at concentration of
6 g/L a decrease in value of EC is observed in comparison with the other concentrations.
Q (Discharge)
Fig.4. shows the variations of cumulative discharge of fluid from the cathode reservoir at
different times during the test. As shown in this figure the total volume of discharge of
distilled water at the end of the test was 1118 cm3 but for solution of CMC it changed to
1015, 2659 and 2110 cm3 at concentrations of 2, 4 and 6 g/L respectively. It is seen that
for concentrations of 4 and 6 g/L the discharge of fluid was nearly twice the distilled water

13
and the maximum discharge of fluid was at concentration of 4 g/L. The volume of
discharged fluid for solution of PEO had no specific trend; at the concentrations of 2, 4 and
6 g/L the final volumes of discharge were 925, 3010 and 890 cm3 respectively. The
maximum volume of discharge for PEO was also at concentration of 4 g/L.
Ke (electro-osmotic permeability)
The amount of discharge of fluid from the soil can be defined by the following relationship
(Mitchell, 1993):
Q = Ke* E*A (3)
where Q is the electro-osmotic flow rate, A is the cross sectional area normal to the direction
of flow, E is the electric field intensity and Ke is electro-osmotic permeability. As it is seen
from the above equation, the rate of discharge of fluid from the soil is controlled by Ke and
E. It can be said that the discharge of fluid under a specific electric field intensity is
dependent on the value of Ke. The values of Ke were calculated from the obtained data
based on equation (3). Fig.5 shows the variations of Ke with time for each of the used
solutions. As shown in this figure, the value of Ke decreased with time for all solutions.
The value of Ke at the end of the test with distilled water was 1.18E-09 m2 /s.v but for other
solutions its value was more than distilled water. For example for CMC with concentration
of 2 g/L the value of Ke was 5.35E-09 m2 /s.v. and it decreased with increasing the
concentration of CMC. The value of Ke for the solution of PEO was more than distilled
water but its maximum value was at concentration of 6 g/L (4.48E-09 m2 /s.v.).
I (Intensity of electrical current)
The results of variations of current intensity with time are shown in Fig.6 for different
solutions. As seen in this figure, the intensity of current is decreased with increasing the
14
time. The intensity of current for the distilled water reached 0.27 ampere (A) at the end of
test but for the CMC and PEO its value changed with concentration of solution. For the
CMC solutions, the intensity of current was 0.11, 0.39 and 0.36 A at concentrations of 2, 4
and 6 g/L respectively. The value of I was 0.09, 0.4 and 0.1 A for concentrations of 2, 4
and 6 g/L of PEO respectively. It is resulted that for both polymers the value of I is
increased until concentration of 4 g/L then there is a reduction in the value of it.
Consolidation
The vertical settlement of soil was measured for all samples using a dial gauge before,
during and after application of the electric current. Figs 7a and b present the variations of
vertical settlement during the two stages of testing. It is seen from Fig.7a and b that the
settlement at the end of the first stage (consolidation under surcharge pressure) was not the
same for distilled water and polymer solutions. During the second stage (osmotic
consolidation by applying electric current) the total settlements were 1.32, 1.57 and 1.63
mm for CMC with concentrations of 2, 4 and 6 g/L (Fig.7a). These values for the same
concentrations of PEO were 1.1, 1.18 and 0.91 mm respectively (Fig.7b). It is observed
from these figures that during the application of electrical current, most of the settlement
occurred in the first day of testing.
Strength
At the end of each test the strength of the soil was measured at distances 4, 11, 18 and 26
cm from the anode (Fig.8). The results show that the undrained shear strength generally
increased by increasing the distance from the anode. When the solution was distilled water,
the strengths at distances of 4, 11. 18 and 26 cm were 1.6, 1.8, 2.0 and 8.2 kPa respectively.
Also, when the solution of CMC or PEO was used, the strength increased with increasing

15
the distance from the anode. For the CMC solution with concentration of 2g/L, the strength
was less than distilled water while for the CMC solutions with concentrations 4 and 6 g/L
the strength was higher in comparison with distilled water. For the CMC with concentration
of 4 g/L, the strength at distance of 26 cm from the anode was nearly four times the strength
with distilled water. The results show that for the CMC solutions, the highest strength was
at concentration of 4 g/L and lowest at concentration of 2 g/L. Similar results were also
obtained for the PEO solutions at different concentrations. For the PEO solutions, the
highest strength was seen at concentration of 4 g/L and lowest at concentration of 6 g/L.
SEM results
Figs.9a and 9b show the SEM results for the soil samples that were taken from around the
anode and cathode at the end of test when the anode reservoir was full of distilled water.
As shown in Fig.9a the soil particles were plate-like in shape and parallel with each other
with large voids between them. It is seen from Fig.9b that the pores between the particles
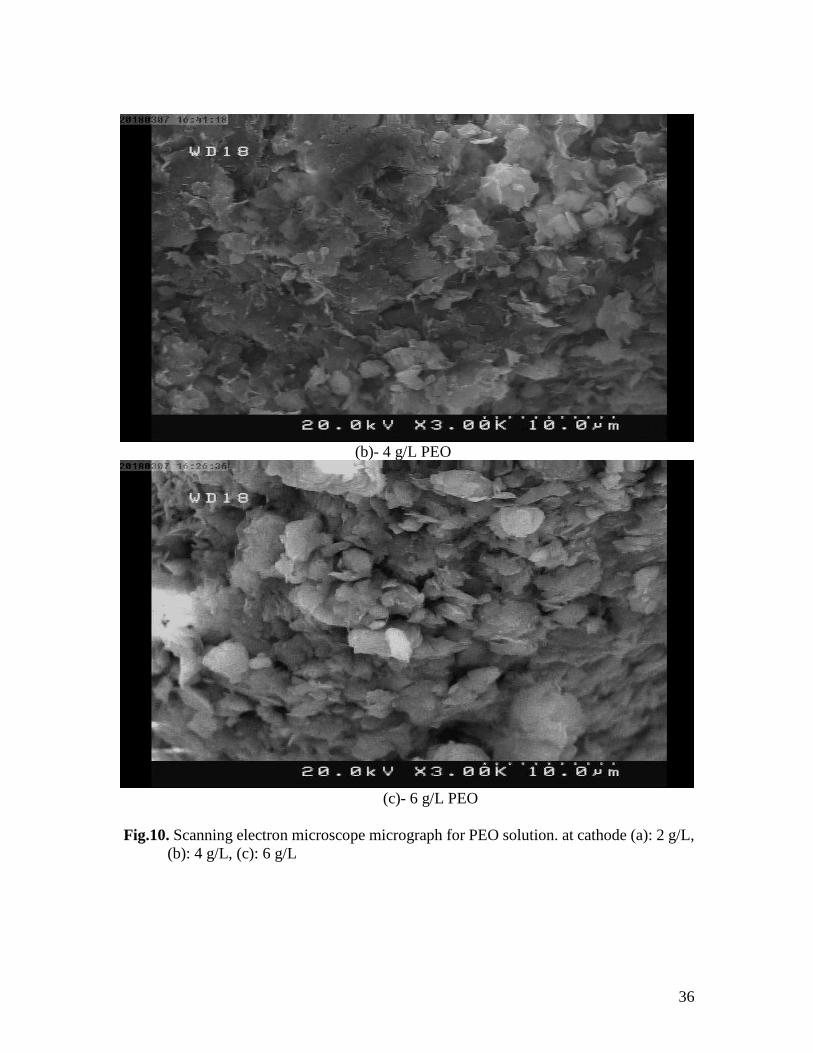
were reduced in comparison with Fig.9a and they made a denser mass of soil. Figs. 10a, b
and c show the micrographs of the samples that were taken from the vicinity of the cathode
(26 cm from the anode) at the end of the tests for concentrations of 2, 4 and 6 g/L PEO. As
shown in Fig.10a the particles were nearly parallel to each other but for the concentrations
of 4 and 6 g/L they were less parallel and the spaces between them were reduced in
comparison with concentration of 2 g/L (Fig.10a). Fig.11a and b show the micrographs for
the soil with CMC solution with concentrations 2 and 6 g/L. It is seen that by increasing
the concentration of CMC, the contact between particles was increased which resulted in
increase in strength of the soil.
Discussion

16
Applying a direct electrical current via electrodes produces electrochemical reactions such
as oxidation at the anode and cathode. The reactions produce an acid front and oxygen at
anode and a base front and hydrogen gas at cathode. The presence of H+ in the anode causes
the value of pH to decrease and the liquid adjacent to the anode gets acidic, but in the
cathode it changes to alkaline. Fig. 2 shows the variations of pH in the fluid that electrodes
were immersed in. The initial value of pH was about 7 in all tests. During each test, the
value of pH in the anode decreased leading to an acidic front while it was increased in the
cathode resulting in a basic front. When distilled water was used, the final values of pH
were 4.8 and 12.4 at the anode and cathode respectively. However, for different
concentrations of CMC or PEO solutions the values of pH at anode and cathode were less
than 4.13 (final value of the pH for distilled water) and more than 13.3 respectively. It can
be concluded that the solutions of polymers produce ions that help to increase the intensity
of acidic and basic fronts in the tests. The results indicate that at concentration of 4 g/L,
both polymers produced more acidity around the anode than the other concentrations (i.e.
2 and 6 g/L). It is resulted that more ions are produced at this concentration of used
polymers.
Variations of electrical conductivity (EC) of fluids at anode and cathode reservoirs during
the tests are shown in Fig.3. As shown in this figure the initial values of EC for distilled
water at anode and cathode reservoirs were 1.37 and 1.16 dS/m respectively. This initial
value for the solutions of CMC changed to 4.58, 7.58 and 11.7 in the anode reservoir for
concentrations of 2, 4 and 6 g/L. The increase of EC can be the result of accumulation of
dissolved ions, particularly in the cathode reservoir. As it was discussed earlier, the
decrease of pH in the anode creates an acidic front which moves from the anode to the

17
cathode. Solution of this polymer in water produces some ions that increase the EC. The
value of EC was increased with increasing the concentration the CMC. This polymer is an
anionic kind because of the carboxylate components. These components are solved in water
and produce Na and COO ions that cause increase in the value of EC at the anode. The
value of EC was also increased at both reservoirs during the tests. When distilled water
was used at anode and cathode, the values of EC increased from their initial values. For
example, for distilled water the final values of EC were 17.0 and 60.0 dS/m at the anode
and cathode respectively. At the end of test, these values were changed to 11.03 and 36.8
for 2 g/L solution of CMC. A similar trend of variation was seen for the solutions of 4 and
6 g/L where the magnitude of EC at the anode reservoir was a function of concentration of
this polymer.
The final values of EC for PEO were less than that the values that were obtained for CMC.
PEO is a nonionic and neutrally charged polymer. When it is solved in water, it may obtain
charges or become protonated which increases the value of EC in comparison with distilled
water. Rosen (1989), Edwards et al. (1994) and Ko et al. (1998) have also shown that the
nonionic surfactant may obtain charges during solution in water. The results also show that
the final values of EC for both reservoirs were increased and at concentration of 4 g/L the
values of EC were higher than the other concentrations. It can be concluded that by the
applying the electrical current this polymer produces ions that cause increase in the value
of EC at both reservoirs.
As shown in Fig.7 the deformations at the end of stage 1 (consolidation under surcharge
pressure) for CMC and PEO solutions were more than distilled water. This difference is
due to the viscosity of polymer solutions that is higher than the distilled water which can
18
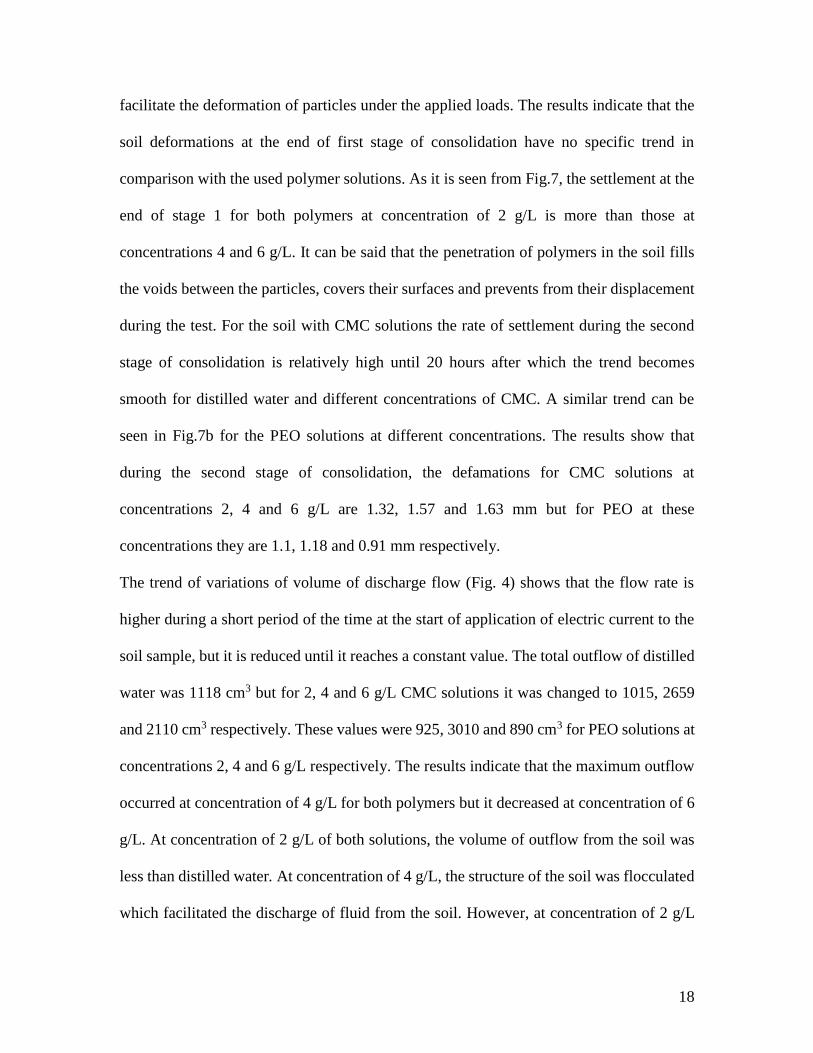
facilitate the deformation of particles under the applied loads. The results indicate that the
soil deformations at the end of first stage of consolidation have no specific trend in
comparison with the used polymer solutions. As it is seen from Fig.7, the settlement at the
end of stage 1 for both polymers at concentration of 2 g/L is more than those at
concentrations 4 and 6 g/L. It can be said that the penetration of polymers in the soil fills
the voids between the particles, covers their surfaces and prevents from their displacement
during the test. For the soil with CMC solutions the rate of settlement during the second
stage of consolidation is relatively high until 20 hours after which the trend becomes
smooth for distilled water and different concentrations of CMC. A similar trend can be
seen in Fig.7b for the PEO solutions at different concentrations. The results show that
during the second stage of consolidation, the defamations for CMC solutions at
concentrations 2, 4 and 6 g/L are 1.32, 1.57 and 1.63 mm but for PEO at these
concentrations they are 1.1, 1.18 and 0.91 mm respectively.
The trend of variations of volume of discharge flow (Fig. 4) shows that the flow rate is
higher during a short period of the time at the start of application of electric current to the
soil sample, but it is reduced until it reaches a constant value. The total outflow of distilled
water was 1118 cm3 but for 2, 4 and 6 g/L CMC solutions it was changed to 1015, 2659
and 2110 cm3 respectively. These values were 925, 3010 and 890 cm3 for PEO solutions at
concentrations 2, 4 and 6 g/L respectively. The results indicate that the maximum outflow
occurred at concentration of 4 g/L for both polymers but it decreased at concentration of 6
g/L. At concentration of 2 g/L of both solutions, the volume of outflow from the soil was
less than distilled water. At concentration of 4 g/L, the structure of the soil was flocculated
which facilitated the discharge of fluid from the soil. However, at concentration of 2 g/L
19
the degree of flocculation was less than that at concentration of 4 g/L, so the discharge of
fluid was decreased. At concentration of 6 g/L CMC the discharge of fluid decreased in
comparison with 4 g/L. This may be due to the accumulation of polymer in the voids of
soil and blocking of the pathway of fluid which led to reduction of outflow of fluid from
the soil. The results of discharge fluid due to the concentration of PEO are similar to the
CMC solution. For PEO, the discharge fluid at concentration of 4 g/L was more than 2 and
6 g/L. The difference in the discharge fluid at the same concentration for the two polymers
can be attributed to the different physical and chemical properties of the two polymers.
Dewatering and treatment are dependent on the volume of water that flows out of the soil
(cathode reservoir). The results showed that at concentration of 4 g/L both polymers caused
more water to flow out of the sample (about 2-3 times more than water) and the greatest
strength was achieved at this concentration. In practice, for safe and economic design of
treatment projects in the field, some information about design parameters is required.
Therefore, it is necessary to conduct a set of laboratory tests on soil samples to determine
the required design information such as the best concentration of polymer. In the field, if
improved strength of soil is required by dewatering, it is possible to reduce the duration of
treatment or increase the distance between cathode and anode both of which would result
in cost saving.
The electerokinetic permeability, Ke decreased and nearly approached to zero at the end of
the test (Fig. 5). The value of Ke for the soil with CMC solutions was a function of its
concentration; it decreased by increasing the concentration. However, the same trend was
not observed for the PEO solutions. This can be attributed to the difference of properties
of the two polymers. These results are consistent with the results that were reported by

20
Mohamedelhassan & Shang, (2001) and Rittirong, et al., (2008). According to the model
of Helmholtz & Smoluchowski (H-S model), the value of electro-osmosis permeability (Ke)
is independent of pore size of soil (in contrast with hydraulic permeability (Kh) which varies
with pore size), but it depends on the electric field intensity. As shown in Fig.5, the values
of Ke decreased with increasing the treatment time. The changes of Ke are dependent on the
variations of pH and reduction of water content. Shang (1997) indicated that the value of
Ke is dependent on the zeta potential. The variation of zeta potential is a function of pH
changes. Since the values of pH are not the same along the sample therefore, the zeta
potential is not constant and this leads to the reduction of Ke. The discharge of fluid from
the cathode is decreased by reduction of Ke.
During the tests, the values of electrical current, I, initially increased in all tests, and then
decreased until it reached a constant value. These results are in agreement with the results
that were reported by Ou et al. (2009) for injection of solution of CaCl2 into a clay soil. The
final values of I for the CMC solutions at concentrations of 4 and 6 g/L were more than
distilled water. For PEO solutions, there was no particular trend for variations of I with
time.
As shown in Fig.8, when the electrokinectic technique is used for soil improvement using
distilled water or a solution of polymer, the shear strength of the soil is increased. The
results show that the improvement is dependent on the distance of soil from the anode; the
strength is increased by increasing the distance from the anode. When distilled water is
used, the increase in shear strength in the vicinity of the cathode is about five times that in
the vicinity of the anode. The value of pH is high around the cathode and the soil is an
alkaline condition. Under this condition, the transported ions from anode form a cementing

21
material that pastes the particles together with strong bond and this leads to increase in the
shear strength of the soil. The micrograph in Fig.9b shows that the particles are pasted to
each other and form a coagulated structure which increases the strength of the soil. These
results are consistent with the results reported by Micic et al. (2002), Alshawabheh &
Sheahn et al., (2003), Burnotte et al., (2004) and Rittirang et al., (2008). The effect of
polymer solutions on improving the strength of the soil is similar to distilled water; by
increasing the distance from the anode the degree of improvement is increased (Figs10 and
11). As the polymers migrate from the anode towards the cathode, they penetrate between
the sheets of minerals of clay and cause a cation exchange between them which leads to
formation of a link or bond between the sheets increasing the strength of the soil
(Paczkowska, 2005). Lagaly et al. (2006) explained the intercalation condition in the
adsorption of organic compounds by the clay soils. They stated that in the process of
penetration of organic molecules into the interlayer space of clay minerals (intercalation)
the intercalated guest molecules can be displaced by other suitable molecules. The
interlayer cations can be exchanged by various types of other suitable molecules. The
cation exchange can make strong links between sheets of clay soil because the organic
cations are covalently attached to the polymer chain. The results show that, for both
polymers, the maximum strength is seen in the vicinity of the cathode. As it is seen from
Fig.8 the strength for different concentrations of polymers is increased with increasing the
distance from the anode. Comparison of the amount of increase in strength at cathode for
different polymer solutions shows that maximum strength is obtained at concentration of 4
g/L for both polymers. Perhaps the high value of pH is effective in linking the sheets of
clay by penetration of polymer. As mentioned above, PEO is a nonionic and neutrally

22
charged polymer. When it is solved in water, it may obtain charges or become protonated
and this causes increase in the value of pH in comparison with distilled water. Rosen (1989),
Edwards et al. (1994) and Ko et al. (1998) have also shown that nonionic surfactants may
obtain charges during solution in water. This can link the sheets and form bond between
them. When CMC is solved in water, it produces Na and COO ions that are important in
adsorption of polymer to the sheets of clay. Comparing the results for different
concentrations of polymer indicates that maximum strength is obtained at concentration of
4 g/L. At concentration of 2 g/L the amount of polymer that contributes to the penetration
and exchange of ions is not significant. At concentration of 6 g/L a certain amount of
polymer contributes to ion exchange but the rest of it remains between the pore space of
the particles and at the contact of particles which is an important factor in reduction of the
strength of the soil.
Electrokinetic technique is usually used for cohesive soils. When a soil is treated by
injection of materials, the degree of treatment is dependent on many factors such as the
type of injected material and the type of minerals of the clay soil. In this work a clay soil
with low plasticity was used. The tests can be performed on other clay soils with different
minerals to study the interaction of injected material and strength of treated soil.
Conclusion
Stabilization of a clay soil through electerokinetic technique was studied by injection of
two different types of polymer. The following conclusions can be drawn from the results
obtained in this study:
- The negative and neutral polymers cause decrease and increase in pH values at
anode and cathode in comparison with distilled water. The final values of EC are
23
increased at the anode and cathode by injection of both polymers. These variations
are dependent on the concentration of the used polymer.
- The outflow of fluid from the soil is observed when polymer is injected but the
maximum discharge is observed for concentration of 4 g/L of polymer.
- The strength of soil is increased by using polymer solutions. For a given
concentration of polymer the amount of increase in strength is dependent on the
distance from the anode. The maximum strength is observed around the cathode for
both polymers at concentration of 4 g/L.
- For field applications, it is possible to achieve the desired strength at reduced cost,
reduced duration of treatment or increased distance of anode and cathode
References
Abdullah, W.S. & Al-Abadi, A.M. (2010). Cationic-electrokinetic improvement an
expansive soil. Applied clay Science 47(3-4), 343-350.

24
Ajayi-Majebi, A. Grissom, W.A. Smith, L.S. & Jones, E.E. (1991). Epoxy resin-based
chemical stabilization of a fine, poorly graded soil system. Transportation
Research Record, Transportation Research Board, Washington, DC 1295, 95–108.
Al-Rawas, A. A. Hago, A. & Al-Sarmi H. (2005). Effect of lime, cement and sarooj
(artificial pozzolan) on the swelling potential of an expansive soil from Oman.
Building and Environment 40(5), 681-687.
Alshawabkeh, A.N. & Sheahan, T.C. (2003). Soft soil stabilisation by ionic injection under
electric fields. Proceedings of the ICE- Ground Improvement 7(4), 177-185.
Alshawabkeh A.N., Sheahan, T.C. & Wu, X. (2004). Coupling of electrochemical and
mechanical processes in soils under DC fields. Mechanics of Materials 36(5-6),
453–465.
Bahar, R. Benazzoug, M. & Kenai, S. (2004). Performance of compacted cement
stabilized soil. Cement and Concrete Composites 24(7),811-820.
Barker, J.E. Rogers, C.D.F. Boardman, D.I. & Peterson, J. (2004). Electrokinetic
stabilization: an overview and case study. Proceedings of the ICE-Ground
Improvement 8(2), 47-58.
Bjerrum, L. Moum, J. & Eide, O. (1967). Application of electro-osmosis to a foundation
problem in a Norwegian quick clay. Géotechnique 17, 214-235.
Bolander, P. (1999). Laboratory testing of non-traditional additives for stabilization of
roads and trail surfaces. Transportation Research Record, Transportation Research
Board, Washington, DC1652, 24–31.

25
Brown, J.J. Brandon, T.L. Daniels, W.L. DeFazio, T.L. Filz, G.M. & Mitchell, J.K.
(2004). Rapid stabilization/polymerization of wet clay soils: Phase I literature
review. Air Force Research Laboratory, Tyndall AFB FL.
Burnotte, F. Lefebvre, G. & Grondin, G. (2004). A case record of electro-osmotic
consolidation of soft clay with improved soil-electrode contact. Canadian
Geotechnical Journal 41(6), 1038-1053.
Casagrande, L. (1952). Electro-osmosis stabilization of soils. Journal of the Boston Society
of Civil Engineers 39(1), 51-83.
Charles, J.A. & Watts, K.S. (2002). Treated ground: engineering properties and
performance. London: Construction Industry Research and Information
Association, CIRIA Funders Report/C572.
Chien, S.C. Ou, C.Y. & Wang, M.K. (2009). Injection of saline solutions to improve the
electroosmotic pressure and consolidation of foundation soil. Applied Clay Science
44(3-4), 218–224.
Edwards, D.A., Adeel, Z., and Luthy, R.G. 1994. Distribution of nonionic surfactant and
phenanthrene in a sediment/aqueous system. Environmental Science & Technology
28(8),1550–1560.
El-Newehy, M.H. El-Naggar, M.E. Alotaiby, S. El-Hamshary, H. Moydeen, M. & Al-
Deyab, S. (2016). Preparation of biocompatible system based on electrospun
CMC/PVA nanofibers as controlled release carrier of diclofenac sodium. Journal
of Macromolecular Science, Part A 53(9), 566–573
Estabragh, A.R. Beytolahpour, I. & Javadi, A.A. (2011). Effect of Resin on the Strength of
Soil-Cement Mixture. Journal of Material in Civil Engineers 23(7), 969-976.

26
Estabragh, A.R. Naseh, M. Beytolahpour, I. & Javadi, A.A. (2013). Strength of a clay soil
and soil-cement mixture with resin. Proceedings of the ICE-Ground Improvement
166(2), 108-114.
Inyang, H.I. Bae, S. Mbamalu, G. & Park, S.W. (2007). Aqueous polymer effects on
volumetric swelling of Na-Montmorillonite. Journal of Materials in Civil
Engineering 19(1), 84-90.
Jeon C.S. Yang, J.S. Kim, K.J. & Baek, K. (2010). Electrokinetic removal of petroleum
hydrocarbon from residual clayey soil following washing process. Clean 38(2),189-
193.
Katz, L.E. Rauch, A.F. Liljestrand, H.M. Shaw, K.S. & Vieira, A.R. (2001). Mechanisms
of soil stabilization with liquid ionic stabilizer. Transportation Research Record,
Transportation Research Board, Washington, DC 1757, 50–57.
Kim, J.H. Kim J.Y. & Kim, S.S. (2009). Effect of H2SO4 and HCl in the anode purging
solution for the electrokinetic-Fenton remediation of soil contaminated with
phenanthrene. Journal of Environmental Science and Health Part A 44(11), 1111–1119.
Ko, S.O. Schlautman, M. A. & Carraway, E.R. (1998). Effect of solution chemistry on the
partitioning of phenanthrene to sorbed surfactants. Environmental Science &
Technology 32(22), 3542–3548.
Lagaly, G. Ogawa M. & Dekany, I. (2006). Clay mineral organic interaction. Handbook
of clay science. , Bergaya F, Theng BKG, Lagaly G (eds.)Vol.1, Chapter 7.3: p. 309-
377.

27
Lefebvre, G. & Burnotte, F. (2002). Improvement of electro-osmotic consolidation of soft
clays by minimizing power loss at electrodes. Canadian Geotechnical Journal
39(2), 399-408.
Micic, S. Shang, J.Q. & Lo, K.Y. (2002). Electrokinetic strengthening of marine clay
adjacent to offshore foundations. International Journal of Offshore and Polar
Engineering 12(1), 64-73.
Micic, S. Shang, J.Q. Lo, K.Y. Lee, Y.N. & Lee, S.W. (2001). Electrokinetic strengthening
of a marine sediment using intermittent current. Canadian Geotechnical Journal
38(2), 287-302.
Mitchell, J.K. (1993). Fundamentals of Soil Behavior. John Wiley & Sons, New York.
Mohamedelhassan, E. & Shang, J.Q. (2001). Effects of electrode materials and current
intermittence in electroosmosis. Proceedings of the ICE-Ground Improvement 5(1),
3-11.
Mohamedelhassan, E. & Shang, J.Q. (2003). Electrokinetics-generated pore fluid and ionic
transport in an offshore calcareous soil. Canadian Geotechnical Geotechnical
Journal 40(6), 1185-1199.
Otsuki, N. Yodsudjai, W. & Nishida, T. (2007). Feasibility study on soil improvement
using electrochemical technique. Construction Building Materials 21(5), 1046-
1051.
Ou, C.Y. Chien, S.C. & Wang, Y.G. (2009). On the enhancement of electroosmotic soil
improvement by the injection of saline solutions. Applied Clay Science 44(1-2),
130- 136.
28
Ozkan, S. Gale, R.J. & Seals, R.K. (1999). Electrokinetic stabilisation of kaolinite by
injection of Al and 3
4PO − ions. Proceedings of the ICE-Ground Improvement 3(4),
135-144.
Paczkowska, B. (2005). Electroosmotic introduction of methacrylate polycations to
dehydrate claey soil. Canadian Geotechnical Journal 42(3), 780-786.
Rauch, A.F., Harmon, J.S., Katz, L.E., and Liljestrand, H.M. 2002. Liqiud soil stabilizers:
Measured effects on engineering properties of clay. Transportation Research
Record, Transportation Research Board, Washington, DC 1757, 33–41.
Rittirong, A. Douglas, R.S. Shang, J.Q. & Lee, E.C. (2008). Electrokinetic improvement
of soft clay using electrical vertical drains. Geosynthetics International 15(5), 369-
381.
Rogers, C.D.F. Liaki, C. & Boardman, D.I. (2003). Advances in the engineering of lime
stabilised clay soils. In Proceedings of the International Conference on
Problematic Soils, Nottingham.UK.
Rosen, M.J. (1989). Surfactants and interfacial phenomena. New York, Wiley.
Shang, J.Q. (1997). Zeta potential and electroosmotic permeability of clay soils. Canadian
Geotechnical Journal 34(4), 627-631.
Shang, J.Q. & Mohamedelhassan, E. (2001). Electrokinetic dewatering of Eneabba West
Mine Tailings: An experimental study, ASCE Special Publication No. 112, Soft
Ground Technology, ASCE Press, Reston, Virginia, p. 346-357.
Tingle, J.S. & Santoni, R. L. (2003). Stabilization of clay soils with nontraditional additives.
Transportation Research Record, Transportation Research Board, Washington,
DC 1819, 72–84.

29
Tremblay, H. Duchesne, J. Locat, J. & Leroueil, S. (2002). Influence of the nature of
organic compounds on fire soil stabilization with cement. Canadian Geotechnical
Journal 39(3), 535-546.

30
Fig.1. Schematic plan of the test set-up (dimensions in mm)
0
2
4
6
8
10
12
14
16
0 40 80 120 160 200
DW-A DW-C CMC-2 g/L-ACMC-2 g/L-C CMC-4 g/L-A CMC-4 g/L-CCMC- 6 g/L-A CMC-6 g/L-C PEO-2 g/L-APEO-2 g/L-C PEO-4 g/L-A PEO-4 g/L-CPEO-6 g/L- A PEO-6 g/L-C
Time, h (hour)
pH

31
Fig.2. Variations of pH with time. DW=Distilled water, A=Anode, C= Cathode
Fig.3. Variations of EC with time. DW=Distilled water, A=Anode, C= Cathode
0
20
40
60
80
100
120
0 40 80 120 160 200
DW-A DW-C CMC-2 g/L-A CMC-2 g/L-C
CMC-4 g/L-A CMC-4 g/L-C CMC-6 g/L-A CMC-6 g/L-CPEO-2 g/L-A PEO-2 g/L-C PEO-4 g/L-A PEO-4 g/L-C
PEO- 6 g/L-A PEO-6 g/L-C
0
500
1000
1500
2000
2500
3000
3500
0 40 80 120 160 200
DW CMC-2 g/l CMC-4 g/l
CMC-6 g/l PEO-2 g/l PEO-4 g/l
PEO-6 g/l
Time, h (hour)
Dis
char
ge,
Q (
cm3)
Time, h (hour)
E
lect
rica
l co
ndu
ctiv
ity, E
C (
dS
/m)

32
Fig.4. Discharge fluid of cathode with time. DW= Distilled water
Fig.5. Variations of Ke with time during different tests. DW= Distilled water
0
2
4
6
8
10
0 20 40 60 80 100 120 140 160 180
DW CMC-2 g/L CMC-4 g/LCMC-6 g/L PEO-2 g/L PEO-4 g/LPEO-6 g/L
0
0.2
0.4
0.6
0.8
1
1.2
0 40 80 120 160 200
DW CMC-2 g/L CMC-4 g/LCMC-6 g/L PEO-2 g/L PEO-4 g/LPEO-6 g/L
Time, h (hour)
K
e (
mm
2 /s
.v)
Time, h (hour)
I (A
mper
)

33
Fig.6. Variation of current intensity with time during different tests. DW= Distilled water
(a)
(b)
Fig.7. Settlement with time, a: CMC solution, b: PEO solution
4
5
6
7
8
9
10
11
12
13
14
0 20 40 60 80 100 120 140 160 180
Distilled water 2 g/L-CMC
4 g/lL-CMC 6 g/L- CMC
4
5
6
7
8
9
10
11
12
0 20 40 60 80 100 120 140 160 180
Distilled water 2 g/L- PEO
4 g/L- PEO 6 g/L- PEO
Time, h (hour)
S
ettl
emen
t (m
m)
Time, h (hour)
Set
tlem
ent
(mm
)

34
Fig.8. Variation of strength along the sample
(a)- Anode
0
5
10
15
20
25
30
35
0 5 10 15 20 25 30
DW CMC-2 g/L CMC-4 g/L CMC-6 g/L
PEO-2 g/L PEO-4 g/L PEO-6 g/L
Distance (cm)
S
tren
gth
(kP
a)

35
(b)- Cathode
Fig.9. Scanning electron microscope micrograph for distilled water. (a): anode, (b):
cathode
(a)- 2 g/L PEO
36
(b)- 4 g/L PEO
(c)- 6 g/L PEO
Fig.10. Scanning electron microscope micrograph for PEO solution. at cathode (a): 2 g/L,
(b): 4 g/L, (c): 6 g/L

37
(a)- 2 g/L CMC
(b)- 6 g/L CMC

38
Fig.11. Scanning electron microscope micrograph for CMC solution. at cathode. (a): 2g/L.
(b): 6 g/L
Table 1. Physical and mechanical properties of soil
Property Standard Designation Value
Specific gravity, Gs
ASTM D 854-10 2.70
Particle distribution
Gravel (%) 8.0
Sand (%) 27.0
Silt (%) 53.0
Clay (%) 12.0
Consistency limits
Liquid limit, LL (%) ASTM D 4318-10 53.3
Plastic limit, PL (%) ASTM D 4318-10 26.1
Plastic index, PI (%) ASTM D 4318-10 27.2
Shrinkage limit, SL (%) ASTM D 427-04 13.0
USCS classification ASTM D 2487-11 CL
Compaction characteristics
Optimum water content, w
(%)
ASTM D 698-07e
16.33
Maximum dry unit weight,
γdmax (kN/m3)
17.75
Table. 2 Chemical composition of soil
Chemical
component
Amount Chemical
component
Amount
pH 8.0 Mg2+ (meq/L) 10.0
ECa (mmhos/cm) 10.74 Cl- (meq/L) 60.0
Na+ (meq/L) 114.0 CO32- (meq/L) 0.6
K+ (meq/L) 0.23 HCO3- (meq/L) 4.0
Ca2+ (meq/L) 24.0 SO42- (meq/L) 83.0
CO3Ca (%) 10.2 O.C.b (%) 0.11
a-Electerical Conductivity
b- Organic content

39