electrokinetic removal of uranium from contaminated .../67531/metadc675314/m2/1/high... ·...
TRANSCRIPT

SANDIA REPORT SAND97-0122 UC-602 Unlimited Release Printed January 1997
Electrokinetic Removal of Uranium From Contaminated, Unsaturated Soils
Wyatt F. Booher, Eric R. Lindgren, Patrick V. Brady
Prepared by Sandia National Laboratories Albuquerque, New Mexico 871 85 and Livermore, California 94550
Approved for public relea tion is unlimited.
SF29000(8-81)
Issued by Sandia National Laboratories, operated for the United States Department of Energy by Sandia Corporation. NOTICE This report was prepared as an account of work sponsored by an agency of the United States Government. Neither the United States Govern- ment nor any agency thereof, nor any of their employees, nor any of their contractors, subcontractors, or their employees, makes any warranty, express or implied, or assumes any legal liability or responsibility for the accuracy, completeness, or usefulness of any information, apparatus, prod- uct, or process disclosed, or represents that its use would not infringe pri- vately owned rights. Reference herein to any specific commercial product, process, or service by trade name, trademark, manufacturer, or otherwise, does not necessarily constitute or imply its endorsement, recommendation, or favoring by the United States Government, any agency thereof or any of their contractors or subcontractors. The views and opinions expressed herein do not necessarily state or reflect those of the United States Govern- ment, any agency thereof or any oftheir contractors.
Printed in the United States of America. This report has been reproduced directly from the best available copy.
Available to DOE and DOE contractors from Office of Scientific and Technical Information PO Box 62 Oak Ridge, TN 37831
Prices available from (615) 576-8401, FTS 626-8401
Available to the public from National Technical Information Service US Department of Commerce 5285 Port Royal Rd Springfield, VA 22161
NTIS price codes Printed copy: A04 Microfiche copy: A01

Portions of this document may be illegible in electronic image products. Images are produced from the best available orighd document.
SAND97-0122 Unlimited Release
Printed January 1997
Distribution Category UC-602
ELECTROKINETIC REMOVAL OF URANIUM FROM CONTAMINATED, UNSATURATED SOILS
Wyatt F. Booher IT Corporation
530 1 Central Avenue NE, Suite 700 Albuquerque, New Mexico 87 108
Eric R. Lindgren Environmental Restoration Technologies Department
Sandia National Laboratories Albuquerque, NM 87 185
Patrick V. Brady Geochemistry Department
Sandia National Laboratories Albuquerque, NM 87185
Abstract Electrokinetic remediation of uranium-contaminated soil was studied in a series of laboratory-scale experiments in test cells with identical geometry using quartz sand at approximately 10 percent moisture content. Uranium, when present in the soil system as an anionic complex, could be migrated through unsaturated soil using electrokinetics. The distance that the uranium migrated in the test cell was dependent upon the initial molar ratio of citrate to uranium used. Over 50 percent of the uranium was recovered from the test cells using the citrate and carbonate complexing agents over of period of 15 days. Soil analyses showed that the uranium remaining in the test cells had been mobilized and ultimately would have been extracted. Uranium extraction exceeded 90 percent in an experiment that was operated for 37 days. Over 70 percent of the uranium was removed from a Hanford waste sample over a 55 day operating period. Citrate and carbonate ligand utilization ratios required for removing 50 percent of the uranium from the uranium-contaminated sand systems were approximately 230 moles ligand per mole uranium and 1320 moles ligand per mole uranium for the waste. Modifying the operating conditions to increasing the residence time of the complexants is expected to improved the utilization efficiency of the complexing agent.

Table of Contents
1 . 0 INTRODUCTION .................................................................................. 5
2 . 0 EXPERIMENTAL ................................................................................... 6
2.1 APPARATUS ............................................................................................. 8 2.1.1 Test Cell ........................................................................................... 8 2.1.2 Power Supply ..................................................................................... 8 2.1.3 Electrodes ......................................................................................... 8
2.2 ELECTROLYTE SOLUnoNS .............................................................................. 12 2.3 MATRIX ................................................................................................ 13
2.3.1 Sand Preparation ............................................................................... 14 2.3.2 Closed Cell Conductivity Tests .................................................................. 14
2.4 EXPERIMENTS .......................................................................................... 15 2.4.1 Closed Cell Uranium-Contaminated Sand Experiments ..................................... 15 2.4.2 Open Cell Uranium-Contaminated Sand Experiments ....................................... 16 2.4.3 Hanford Waste Experiments .................................................................... 18
2.4.3.1 Analyses ....................................................................................... 19 2.4.3.2 pH ............................................................................................................................ 19 2.4.3.3 Soil Electrical Conductivity .................................................................... 20 2.4.3.4 Voltage Measurements ......................................................................... 20 2.4.3.5 Moisture Content ........................................................................................................ 20 2.4.3.6 Uranium Analyses ....................................................................................................... 20
3 . 0 RESULTS AND DISCUSSION ................................................................. 21
3.1 CLOSED CEU URAMUM-CONTA~WNATED SAND EXPHUMENTS ....................................... 21 3.1.1 Discussion of Closed Cell Results .............................................................. 28
3.2.1 Discussion of Open Cell Results ................................................................ 30 3.2.2 Discussion of Open Cell Wedron Sand Results ............................................................... 40 3.2.3 Discussion of Open Cell Hanford Soil Results ................................................ 44
4 . 0 CONCLUSIONS ................................................................................... 47
3.2 OPEN CEU UFL4NIUM-CONTAMINATED SAND EXPEFSMENTS .......................................... 28
5 . 0 REFERENCES ..................................................................................... 50
2

Figure 1 . Figure 2 . Figure 3 . Figure 4 . Figure 5 .
Figure 6 .
Figure 7 .
Figure 8 . Figure 9 .
List of Figures
Schematic of closed cell electrokinetics test device ...................................................................... 10 Schematic of open cell electrokinetics test device ........................................................................ 11 Results of the 200: 1 citrate to uranium closed cell experiment ....................................................... 23 Distribution of uranium with time in the 200: 1 citratewanium closed cell test device ....................... 23 Uranium migration with time, closed cell device . 20: 1 mom ratio of citrate:uranium- contaminated sand ................................................................................................................. 25 Uranium migration with time. closed cell device . 200:l m o m ratio of citrate:uranium- contaminated sand ................................................................................................................. 25 Uranium distribution following 10 hrs . of applied current in two closed cell experiments where no citrate was added ................................................................................................................... 26 Pore water pH vs . time in closed cell experiments ....................................................................... 27 Cell voltage vs . time for cloed cell experiments .......................................................................... 27
Figure 10 . Comparison of uranium migration distance with varying molar ratios of citrate ................................ 29 Figure 1 1 . Uranium-contaminated sand experiments ................................................................................... 31 Figure 12 . Cumulative normalized uranium recovered in the catholyte solutions .............................................. 31 Figure 13 . Concentration of uranium in anolyte effluent with time for the citrate and carbonate catholyte
uranium-contaminated sand open cell experiments ....................................................................... 33 Figure 14 . Normalized distribution of uranium remaining in the test cell at the termaination of the
uranium-contaminated sand open cell experiments ....................................................................... 33 Figure 15 . Pore-water pH across the test cells in the uranium-contaminated sand open cell experiments ................ 35 Figure 16 . Pore-water conductivity across the test cells in the uranium-contaminated sand open cell experiments ... 35 Figure 17 . Cell voltage changes over the operation period of the uranium-contaminated sand open
cell experiments ................................................................................................................... 36 Figure 18 . Graph of typical voltage gradient differential across points in test cell vs . time in the open cell
uranium-contaminated sand experiments .................................................................................... 37 Figure 19 . Extended uranium-contaminated sand open cell experiments .......................................................... 39 Figure 20 . Extended uranium-contaminated sand open cell experiments .......................................................... 39 Figure 21 . Uraniumm concentration in anolyte effluent over time ................................................................. 41 Figure 22 . Cell voltage and anolyte effluent uranium concentration vs . time for the citrate and carbonate
uranium-contaminated sand open cell experiments ....................................................................... 42 Figure 23 . Schematic showing the different forms of uranium present ............................................................ 43 Figure 24 . Cumulative normalized uranium recovered in the anode effluent from the Hanford waste using
carbonate and citrate as uranium complexing agents ..................................................................... 45
experiments at the termination of the experiments ....................................................................... 46 Figure 25 . Normalized distribution of uranium remaining in the test cells for the Hanford waste
3

List of Tables
Table 1 . Wedron Sand Sieve Results ...................................................................................................... 14 Table 2 . Test Parameters for Closed Cell Experiments ............................................................................... 17 Table 3 . Test Parameters for Open Cell Experiments ................................................................................. 17 Table 4 . Uranium Concentrations in Hanford Waste .................................................................................. 19 Table 5 . pH and Electrical Conductivity of Electrolytes and Pore-Water for Open Cell Experiments .................... 36
4

1 .O INTRODUCTION
Remediation of subsurface contamination is frequently the most costly and time consuming part of any clean-up. Soils contaminated with radioactive elements present a special dilemma since these metals are not only a radiation hazard but are also often toxic. Typically, the majority of the costs associated with remedial activities lies with the cost of soil and ground water remediation. Currently, most remediation of soils with metal Contaminants consists of removal of the soil and transport to a chemical or radioactive waste landfill.
Uranium contamination of soil and groundwater is a problem in the United States. The majority of uranium contamination in soils and groundwater is due to uranium mining and milling, and weapons production activities. Current technologies for the remediation of uranium- contaminated sites involve the extraction and transportation of the contaminated soil to an appropriate disposal facility, immobilization of the radioactive metals in place, and separation of the more highly contaminated soil fractions. Excavation, transportation, and disposal of the entire volume of the uranium-contaminated soil from the Fernald, Ohio (estimated at 2,000,000 to 4,000,000 m3 contaminated soil) or the Hanford, Washington sites would be very expensive and studies at Fernald indicated that physical separation is not a feasible alternative (ORNL, 1993).
A relatively recent technology involves the use of electrokinetic migration to achieve remediation of uranium-contaminated soils. Electrokinetics, the process of applying a direct current electric field across a soil-water system, provides an in situ remediation approach to this problem. In electrokinetic remediation, electrodes are implanted directly in the soil and an electric field is imposed between the two electrodes. Electrokinetics is unique in that it allows selective introduction of chemical agents into a porous medium in a controlled manner.
The electrokinetic effect was first observed by Reuss in 1809 when an electrical potential was applied to water in a capillary and the water moved toward the cathode. Casagrande (1952) was the first to apply electrokinetics to soil dewatering. In the past, electrokinetic techniques were used primarily for the stabilization of soils and other dewatering applications. However, due to the recent interest in in-situ remediation of contaminated soils, electrokinetic research has focused on the application of this technology to soil and groundwater remediation.
The feasibility and cost effectiveness of electrokinetic remediation for removal of contaminants from soils has been demonstrated through laboratory and bench-scale studies (Runnels and Larson, 1986; Shapiro et al., 1989; Pamuku and Wittle, 1992; Bibler et al., 1992; Acar and Alshawabkeh, 1993; Probstein and Hicks, 1993; Mattson and Lindgren, 1995; Wong et al., 1995) and limited pilot scale studies (Lageman, 1989). Similarly, electrokinetics has been found to be a potential remediation technology in the laboratory but has not yet been demonstrated to be a viable
5

technology in the field. To date, few studies have attempted to apply electrokinetic remediation techniques to unsaturated soils and none published have reported successful removal of uranium from unsaturated soils. Because the majority of the uranium-contaminated sites in the United States exist in relatively arid climates and the bulk of the uranium contamination is present in unsaturated soils, a method must be developed to apply this technology in these conditions.
The research described in this report focuses on the application of electrokinetics for the removal of uranium from unsaturated soils. Studies indicate that the uranium contamination, in native soils and at waste sites, is present predominantly as uranyl (UO?) species, and therefore exists in the sorbed or precipitated form (Buck et al., 1996; Francis et al., 1993). Consequently, effective mobilization of uranium cannot be accomplished without first solubilizing the uranium. Complexation with an organic or inorganic molecule to forrn negatively charged uranyl complexes will result in desorption and solubilization of uranium and ultimate transport through the soil pore- water system under the influence of an electric field. Although the research presented in this report focuses on the removal of uranium contamination from soil, the principles and applications of the technology presented are universal. That is, most metal contaminants tend to be present in soil as precipitates or sorbed onto soil as cationic species. Before the metal contaminant can be mobilized, it must first be converted to a soluble form. Complexation provides a method for solubilizing the metal contaminant. Electrokinetics provides an in situ method for mobilizing and removing the metal complex.
The objective of this research project was to determine the feasibility of removing uranium from unsaturated soils using electrokinetics. This objective was based on the premise that uranyl species can react with a variety of complexing agents to form soluble anionic complexes. Under the influences of a direct current electric field, these complexes can be mobilized and transported through the soil pore-water to the anode of an electrokinetic system and subsequently removed. Aspects of this research included consideration of uranium complexation and transport processes.
2.0 EXPERIMENTAL
This research consisted of laboratory experiments. A testing apparatus was constructed to study the electokinetic migration of uranium in soil. Uranium, in the form of a uranyl species, was emplaced in a sand medium and complexing agents were directly introduced or introduced as anionic species at the cathode. The migration of uranium was measured in the sand media and in the electrolyte solutions. Electrical conductivity, pH, and other parameters integral to the electrokinetic process were monitored during each experiment. Control experiments were conducted to confirm the results.
Electrokinetic theory suggests that uranium in the uranyl form, can be solubilized and
6

complexed with select complexing agents to form anionic complexes which can be caused to migrate in the presence of an applied electric field. A successful electrokinetic system designed for the removal of uranium from unsaturated soil will possess the following qualities:
(1) The system selected must operate in vadose zone soils. The bulk of removable uranium contamination exists in vadose zone soils; thus, it is essential that the system be able to operate in unsaturated soil conditions.
(2) The system must be designed to maintain neutral pH pore-water conditions. Acid and base fronts will develop at the electrodes and migrate through the soil pore-water if not controlled. Acidic and alkaline pore-water solutions may result in substantial changes in soil chemistry.
(3) The apparatus must be designed to allow neutralization of the hydrogen and hydroxide ions at or near the point of generation. Studies showed that when soils containing high concentrations of calcium were leached in acidic conditions, large quantities of calcium were solubilized (ORNL, 1993). Thus, the system should be designed to maintain the pore-water pH conditions in the neutral to alkaline pH range rather than in the acid range when high calcium concentrations are present.
(4) In order for uranium (in the uranyl form) to be mobilized, the appropriate complexing agent must transform the species into an anionic complex. In addition, the ligand must be able to be transported into the soil mass, in situ, by electromigration. The complexing agent chosen must be selective for uranium and favor formation of anionic uranyl complexes. Examples of chelating agents which possess this attribute include carbonyl compounds such as acids and salts of citrate, carbonate, and EDTA.
(5) In order for the electrokinetic system to operate for extended periods of time, the system must be able to extract co-ions arriving at the electrodes while simultaneously replenishing the system with counter ions. Accumulation of co-ions at the electrodes will result in diffusion gradient problems. Counter ions are necessary to conserve the electronueutrality and sustain system operation. Therefore, the apparatus must allow introduction and removal of electrolyte solutions.
(6) Electro-osmosis and electrolysis will cause the anode to dry out. A continuous flux of water into the soil mass at the anode is required to prevent this problem.
Experiments conducted as part of this research project were designed with the above criteria in mind. The experimental program consisted of closed- and open-cell experiments carried out in polycarbonate test cells. Closed-cell experiments were initially conducted to provide a rapid
7

indication of the proposed technique. Open-cell experiments were subsequently performed in order to control pore-water pH and in situ introduction of the complexants and removal of contaminants in the electrode solutions.
2.1 Apparatus
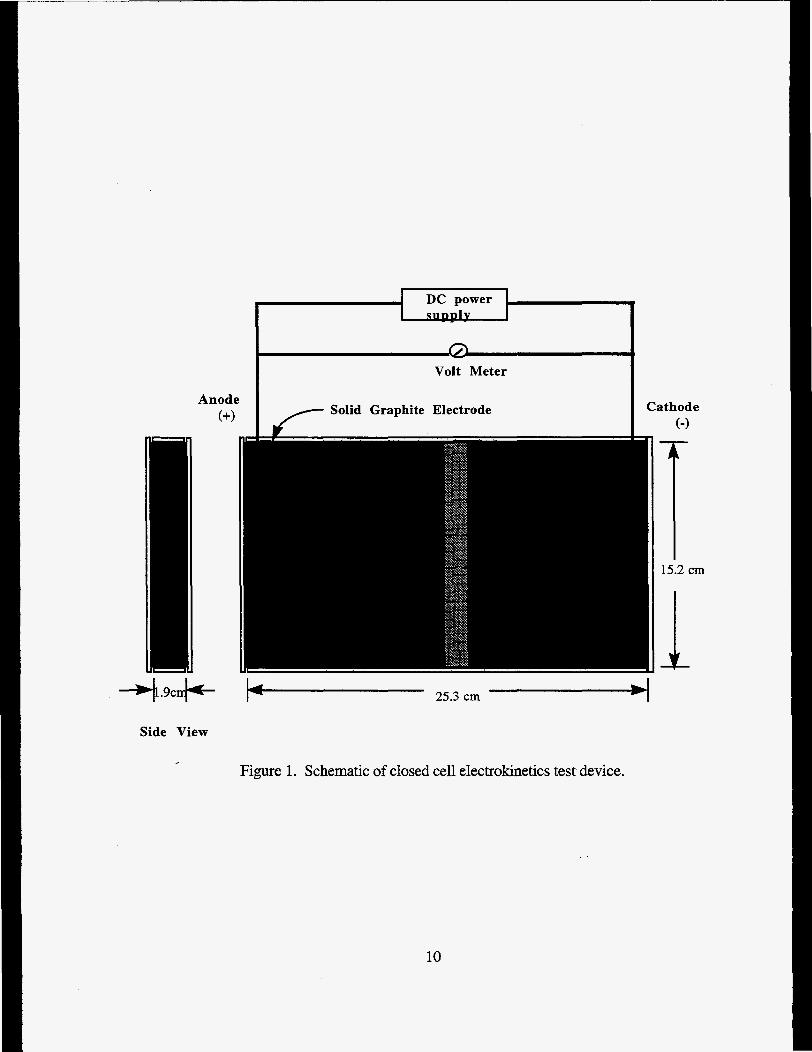
The closed cell experimental apparatus consisted of a test cell, solid electrodes, and a power supply. The open cell experiment apparatus consisted of a test cell, electrode systems, and electrical supply. Schematics of both test cell systems used are illustrated in Figures 1 and 2.
2.1.1 Test Cell
The experimental setup used in both closed and open celI experiments consisted of a rectangular acrylic cell having internal dimensions of 1.9 x 15.2 x 21.5 centimeters (cm). The upper section and the 15.2 cm x 21.5 cm faceplate was removable and secured to the cell body with machine screws. The upper plate was drilled with 9 8 inch holes for electrode access.
2.1.2 -Power Supply
Fisher Biotec Electrophoresis SystemTM, Model 701 power supply units were used in all tests. With the exception of the sand conductivity tests described below, a current density of 3.46 Nm2 (cross-sectional area) was applied to each test cell. An effective pore-water current density can be calculated if one assumes that all of the current travels through the pore water. The pore-water current density is the applied current density divided by the volumetric water content of the sand which in this case was 10 weight percent (0.166). For the sand used, the pore-water current density was 2.11 mNcm2. The voltage was allowed to vary to maintain constant current conditions. The system was set to shut off when the voltage potential between the electrodes reached 1,000 volts.
2.1.3 Electrodes
The primary difference between the closed and open cell experimental apparatus was the electrodes used. Each type is described below.
Closed Cell Electrode System. Solid graphite electrodes (1.9 cm2 and 15.2 cm high) were used for both the anode and cathode in the closed cell experiments. The electrodes were located at each end of the test cell and the geometry of the electrodes and test cell was such that the sand only contacted one surface of each electrode (see Figure 1).
Open Cell Electrode System. The electrode system developed by Mattson and Lindgren (1995)
8

was used for all open cell experiments (Figure 2). This electrode design was selected because it met the criteria requirements identified above. The portion of the electrode system in contact with the sand consisted of a 1.5 cm diameter porous ceramic suction lysimeter epoxied into a nonporous plastic body. The electrodes were inserted into the center of electrode bodies and extended completely into the lysimeters, and were immersed in the electrolyte solution. The plastic body was machined to accept inlet and outlet tubing to allow liquid to be circulated through the system, support the electrode, and provide a receptacle for the power supply. The electrodes were emplaced at each end of the cell. The liquid capacity of each electrode was approximately 15 mL.
The open cell electrode system was designed to extend the entire vertical thickness of the cell to allow uniform current conduction across the entire thickness of the cell. Seven millimeter (mm) diameter titanium rods coated with iridium oxide were used as anodes in all experiments and 7 mm diameter solid graphite rods or copper-coated steel rods were used as cathodes.
The electrolytes in the open cell experiments were continuously circulated through the electrodes using chemical feed pumps. The electrolyte was passed through the electrode and not recycled to avoid the possibility of exhausting the buffering capacity of the electrolytes. The pumps were set to pump at a constant flow rate and pump approximately 150 W d a y of electrolyte through each electrode. The anolyte and catholyte effluent supplies were replenished and samples were collected every one to two days during each experiment.
Hydrogen and oxygen gas evolved at the electrodes by water electrolysis was entrained by the circulating solutions and vented through the vacuum reservoir and eventually to the atmosphere. The current applied to the system was set at a level to prevent the accumulation of explosive concentrations of hydrogen and oxygen in the system.
A standard, laboratory grade, vane-type vacuum pump, connected to a vacuum tank reservoir was used to maintain the system under vacuum conditions. Six to 8 inches of mercury (Hg) vacuum was applied to the electrode system in order to maintain the necessary vacuum on the water columns in the lysimeter cups to maintain the desired soil moisture content. As expected, increasing the vacuum resulted in lowering the moisture content of the test soil whereas lowering the vacuum allowed moisture to enter the soil.
9
I -
Volt Meter
Anode (+) I Solid Graphite Electrode
Side View
Cathode (-1
kp 25.3 cm -----+I
Figure 1. Schematic of closed cell electrokinetics test device.
15.2 cm
I
10

I I I
I t i I
p%-l Effluent
E f Effluent
Volt Meter
r
-1rlTi Anode
15.2 cm
1 Figure 2. Schematic of open cell electrokinetics test device
11

2.2 Electrolyte Solutions
Buffer solutions were circulated through both electrode systems in the open cell experiments to neutralize hydrogen and hydroxide ions generated by electrolysis at the electrodes and to introduce the complexant and co- and counter-ions into the pore-water system. A single anolyte consisting of 0.4 molar (M) sodium acetate solution was used in all open cell experiments to buffer the anode reaction. Catholytes consisted of mixtures of the salt and acid forms of citrate, acetate, and carbonate solutions. Electrolyte preparation and corresponding neutralization reactions are presented below.
AnoZyte. A 0.4 M sodium acetate solution was used in all open cell experiments. The solution was circulated through the anode to neutralize the hydrogen ions evolved from water electrolysis. The overall anolyte neutralization reaction was
NaOAC + H" w HOAc + Na" (1)
When an electric potential was applied to the system, the sodium ion migrated through the pore- water to the cathode and was subsequently transferred into the catholyte effluent. The acetic acid formed was pumped from the electrode body to the anolyte effluent reservoir.
Citrate Catholyte. A 0.4 M citrate buffer solution was prepared by combining 0.167 mole fraction citric acid and 0.833 mole fraction trisodium citrate resulting in a final solution pH of approximately 7. The corresponding catholyte neutralization reaction that occurred in the electrode body was:
H,Cit, + OH- e H20 + H,-,Citn-' (2)
The citrate anion migrated through the pore-water to the anode and was ultimately transferred into the anolyte effluent solution.
Acetate Catholyte. The acetate catholyte solution consisted of a sodium acetatelacetic acid solution (6535 molar ratio). The corresponding electrode neutralization reaction was:
HOAC + OH- e H20 + Oac- (3)
12
Carbonate CathoZyte. A 0.5 M sodium bicarbonate (NaHC03) solution was used for the open cell carbonate catholyte experiments. The correspondmg electrode neutralization reaction was:
NaHCO, + OH- e Na" + C0:- + H,O (4)
2.3 Matrix
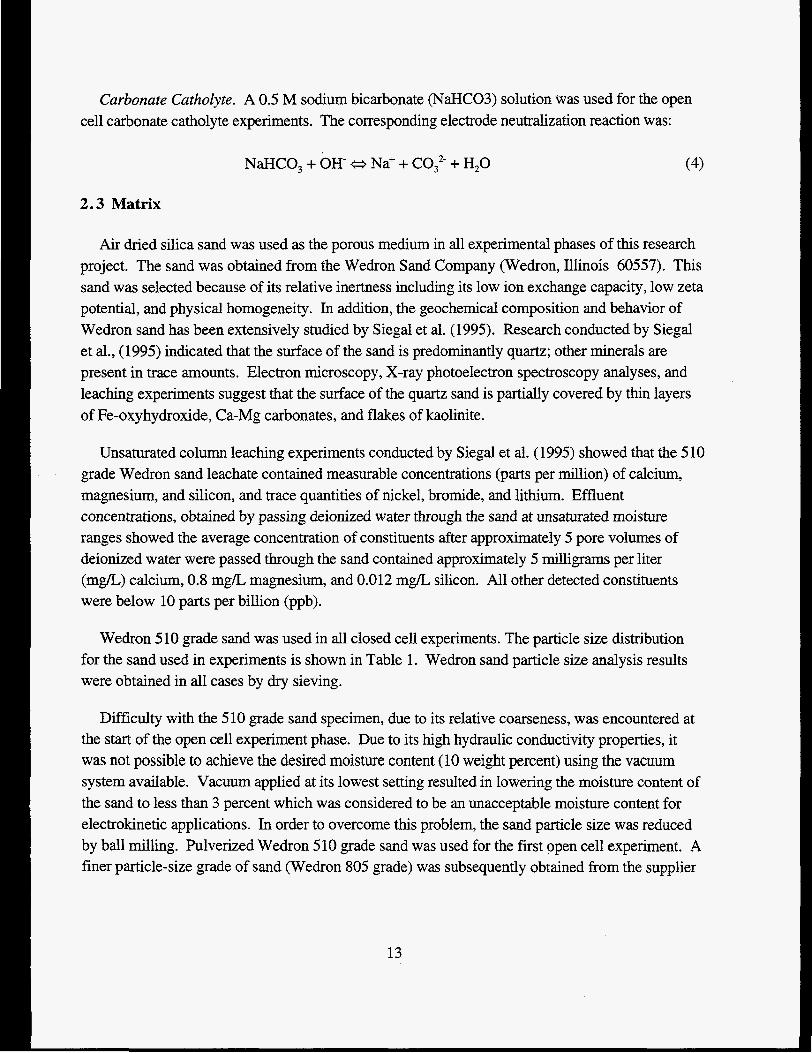
Air dried silica sand was used as the porous medium in all experimental phases of this research project. The sand was obtained from the Wedron Sand Company (Wedron, Illinois 60557). This sand was selected because of its relative inertness including its low ion exchange capacity, low zeta potential, and physical homogeneity. In addition, the geochemical composition and behavior of Wedron sand has been extensively studied by Siegal et al. (1995). Research conducted by Siegal et al., (1995) indicated that the surface of the sand is predominantly quartz; other minerals are present in trace amounts. Electron microscopy, X-ray photoelectron spectroscopy analyses, and leaching experiments suggest that the surface of the quartz sand is partially covered by thin layers of Fe-oxyhydroxide, Ca-Mg carbonates, and flakes of kaolinite.
Unsaturated column leaching experiments conducted by Siegal et al. (1995) showed that the 5 10 grade Wedron sand leachate contained measurable concentrations (parts per million) of calcium, magnesium, and silicon, and trace quantities of nickel, bromide, and lithium. Effluent concentrations, obtained by passing deionized water through the sand at unsaturated moisture ranges showed the average concentration of constituents after approximately 5 pore volumes of deionized water were passed through the sand contained approximately 5 milligrams per liter ( m a ) calcium, 0.8 mg/L magnesium, and 0.012 mg/L silicon. All other detected constituents were below 10 parts per billion (ppb).
Wedron 510 grade sand was used in all closed cell experiments. The particle size distribution for the sand used in experiments is shown in Table 1. Wedron sand particle size analysis results were obtained in all cases by dry sieving.
Difficulty with the 5 10 grade sand specimen, due to its relative coarseness, was encountered at the start of the open cell experiment phase. Due to its high hydraulic conductivity properties, it was not possible to achieve the desired moisture content (10 weight percent) using the vacuum system available. Vacuum applied at its lowest setting resulted in lowering the moisture content of the sand to less than 3 percent which was considered to be an unacceptable moisture content for electrokinetic applications. In order to overcome this problem, the sand particle size was reduced by ball milling. Pulverized Wedron 510 grade sand was used for the first open cell experiment. A finer particle-size grade of sand (Wedron 805 grade) was subsequently obtained from the supplier
13
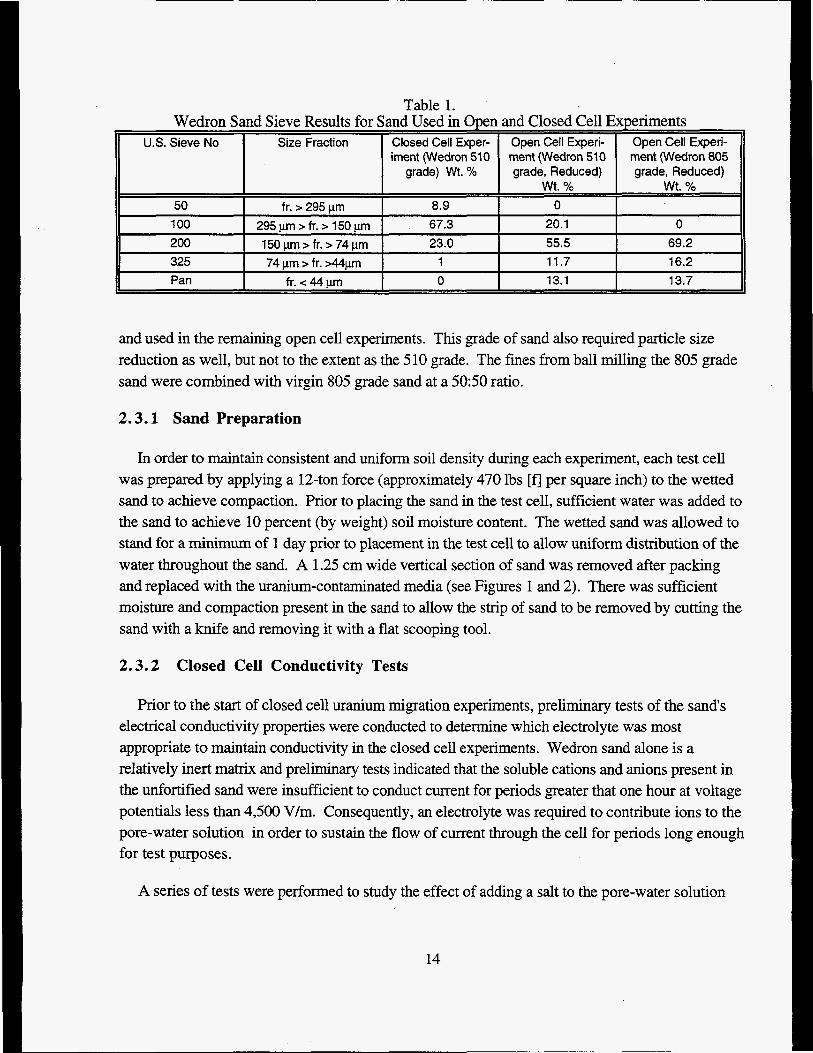
Table 1. Wedron Sand Sieve Results for Sand Used in Open and Closed Cell Experiments
U.S. Sieve No Size Fraction Closed Cell Exper- Open Cell Experi- Open Cell Experj- iment (Wedron 510 ment (Wedron 510 ment (Wedron 805
grade) Wt. % grade, Reduced) grade, Reduced) wt. % wt. %
50 fr. > 295 urn 8.9 0 100 295pm>fr.>150pm 67.3 20.1 0 200 150 pm > fr. > 74 pm 23.0 55.5 69.2 325 74 pm > fr. >44pm 1 11.7 16.2 Pan fr. -z 44 pm 0 13.1 13.7
and used in the remaining open cell experiments. Ths grade of sand also required particle size reduction as well, but not to the extent as the 5 10 grade. The fines from ball milling the 805 grade sand were combined with virgin 805 grade sand at a 50:50 ratio.
2.3.1 Sand Preparation
In order to maintain consistent and uniform soil density during each experiment, each test cell was prepared by applying a 12-ton force (approximately 470 lbs [f'j per square inch) to the wetted sand to achieve compaction. Prior to placing the sand in the test cell, sufficient water was added to the sand to achieve 10 percent (by weight) soil moisture content. The wetted sand was allowed to stand for a minimum of 1 day prior to placement in the test cell to allow uniform distribution of the water throughout the sand. A 1.25 cm wide vertical section of sand was removed after packing and replaced with the uranium-contaminated media (see Figures 1 and 2). There was sufficient moisture and compaction present in the sand to allow the strip of sand to be removed by cutting the sand with a knife and removing it with a flat scooping tool.
2.3.2 Closed Cell Conductivity Tests
Prior to the start of closed cell uranium migration experiments, preliminary tests of the sand's electrical conductivity properties were conducted to determine which electrolyte was most appropriate to maintain conductivity in the closed cell experiments. Wedron sand alone is a relatively inert matrix and preliminary tests indicated that the soluble cations and anions present in the unfortified sand were insufficient to conduct current for periods greater that one hour at voltage potentials less than 4,500 V/m. Consequently, an electrolyte was required to contribute ions to the pore-water solution in order to sustain the flow of current through the cell for periods long enough for test purposes.
A series of tests were performed to study the effect of adding a salt to the pore-water solution
14

for a test cell electrolyte. Salt solutions studied as candidate electrolytes included 0.005 M CaC12, 0.005 M NaCl, and 0.01 M NaCl. These solutions were added to the sand to achieve a 10 percent (by weight) moisture content in all cases. During each test, the power supply was set to provide a current of 20 mA through the system and the voltages were allowed to fluctuate to maintain constant current conditions.
In all of the tests described above, the system shut-down within 2 to 3 hours of operation. Voltage gradient measurements showed large voltage and pH differences existed in the soil at approximately two-thirds the distance from the cathode indicating that insufficient ions were present in the system to conduct current. Results showed that the hydroxide ion and hydronium ion fronts converged while the ions present in the pore water electromigrated towards the attracting electrodes. Over time, the pore-water was depleted of ions and the hydroxide ions and hydrogen ions converged and combined to form high resistance water.
Solutions of 0.008 M and 0.084 M Na-citratekitric acid buffer (pH = 6.8) were also tested in the same manner as described above. The 0.008 M solution test cells shut-down after 4.8 hours of operation with pH and voltage gradient results as before. The 0.084 M solution cell ran for 34 hours and did not shut down. The final voltage across the entire cell was 406 volts. However, there was a 350 voltage difference near the center of the cell indicating impending system shut- down.
A test was run where the sand was blended with 5% (by weight) CaSO,. Water was added to the CaS0,Nedron sand mixture and it was allowed to stand overnight before current was applied. The system was run for approximately 33 hours with a final cell voltage of 51 volts. No large voltage gradients were measured at any of the measurement points and a linear voltage gradient across the test cell was observed. Based on the success of this test, CaSO, was selected for addition to the sand used in closed cell experiments.
2.4 Experiments
Closed and open cell experiments were run to study the migration of uranium through sand. Four closed cell and 6 open cell experiments were run. Control experiments were included for both types of experiments to veri@ the effects of not adding a complexing agent to the system resulted in minimal or no uranium migration.
2.4.1 Closed Cell Uranium-Contaminated Sand Experiments
Four closed cell experiments were run to study the effect of varying the molar ratios of citrate to uranium to determine if the molar ratio affected the uranium migration and migration rate. Solutions containing molar ratios of 200: 1,20: 1, and 3: 1 of citrate to uranium were prepared in
15

deionized water and added to the sand. The contaminated strip of sand was emplaced near the center of each cell where a vertical section of sand had been previously removed after compaction. The contaminated sand was then pressed into the void to ensure similar compaction and connectivity. Two control experiments were also conducted where uranyl nitrate was added to the sand without the addition of any citrate salt. Experiment parameters are summarized in Table 2.
The uranyl citrate solution was prepared by addmg the appropriate weight of reagent grade uranium nitrate [UO,(NO,),- 6H20] (Baker Inc.) and citric acid-trisodium salt to achieve a 100 parts per million (pprn) uranium concentration. One mL of mixture was added to 100 grams (g) of sand to produce 10 ppm uranium-contaminated sand at 10 percent moisture content. A 2.25 cm (nominal) wide strip of the uranium-contaminated sand was added as a section to a prepared cell near the center (see Figure 1).
A constant current density of 0.346 mA/cm2 was applied to the cell and current was passed through the cell for a period of approximately 2 hours. At the end of the 2-hour period, the current was shut off and the face plate was removed. At approximately 2.3,4.4,7.0, and 9.6 hours of operation, a 2.6 cm horizontal strip (20%) of the sand was removed (Figure 1) and subsectioned into 9 samples for analysis. The remaining 5.2 cm was sectioned and analyzed after 22 hours of operation. The horizontal width of each sample was 2.4 cm. After removal of each horizontal strip of sand, the current was reduced proportionally to maintain the current density constant throughout the entire experimental run. This process was repeated in all of the closed cell experiments.
2.4.2 Open Cell Uranium-Contaminated Sand Experiments
Four open cell experiments using uranium-contaminated Wedron sand were run to study the feasibility of removing uranium from the test cell. Three of the experiments consisted of adding a 2.25 cm (nominal) wide vertical strip of uranium-contaminated sand to the center of each test cell (Figure 2). The selected complexant was added as the catholyte. The third experiment was designed as a control and consisted of addition of the acetate catholyte solution at the cathode. The fourth test, an extended experiment using the citrate catholyte, was run for 37 days to determine the time required to remove the bulk of the uranium contamination from the cell. Test parameters for each open cell experiment conducted are provided in Table 3.
16

Ta )le 2. Test Parameters for Closed Cell Experiments Matrix Molar Electrode Duration of Current Normalized
Moisture Ratio Type Experiment Density Location of U Content Na3Cit: (hours) (mNcm2) Emplacement (Wt. %) U added (Anode to
Cathode) (mg) 510 Wedron 200:l Graphite 21.9 0.346 0.5
51 0 Wedron 20: 1 Graphite 11.62 0.346 0.83
510 Wedron 3:l Graphite 10.55 0.346 0.83
51 0 Wedron 0: 1 Graphite 10.17 0.346 0.83
10%
1 0%
1 0%
1 OYO 0.83 I 0.346 I 510Wedron I 0:l I Graphite I 10.27
10%
Table 3. Test Parameters for &en Cell ExDeriments
as U0,N03
EK7 1 00/9 1 7
EK8CAC 100/1000
EK8 100/1000
EK9 100/1000
EK10 209 mg (Hanford)
EK11 220 mg (Hanford)
Matrix/ Cathode/ Anode/ Duration o f Current Normalized Preparation/ Catholyte Anolyte Experiment Density location of U
Percent (Days) (mA/cm2) emplacement Moisture (anode to (wt Yo) cathode)
~
510 Wedrod Graphite/ Ir oxide 14 0.346 0.5 pulverized/ 0.4M coated Ti/
10 Citrate 0.4 M
805 Wedron/ Pulverized
10 805 Wedrod Pulverized/
10
805 Wedrod Pulverized/
10
NaOAc
Above Acetate
steel/ Above
Carbonate & I Above
steel/ 0.4M
15
21
37
-p 0.346
Citrate
Pulverized/ Above Carbonate
0.346 Above
17

In each test cell prepared, the sand was moistened with 0.05 M NaCl solution. Prior to addition of the uranium-contaminated sand, the system moisture was allowed to stabilize for a minimum of one day with the vacuum applied to the electrode system. The 0.05 M NaCl solution was circulated through both electrodes to allow the soil in the cell to reach hydraulic equilibrium. Moisture content was accurately determined by monitoring the weight of each test cell. Vacuum was increased or decreased accordingly to obtain the desired moisture content. Current was not applied to the cell during this time.
Once hydraulic equilibrium between the electrode solution and soil-water system was reached, the system was shut down, the cover of the cell removed, and a vertical strip (approximately 2.25 cm) or sand was removed. Moisture content was gravimetrically-determined to verify that the desired moisture was present in the cell and the uranium-contaminated sand or soil at the proper moisture content was placed in the previously removed section of the test cell. The uranium- contaminated Wedron sand was prepared by adding 10.0 mL of 10,000 parts per million (ppm) uranium solution to 100 g of Wedron sand so that the uranium loading was 1,000 ppm at 10% moisture. A higher concentration of uranium was used in the open cell experiments compared to the closed cell experiments to provide a more realistic concentration of uranium in contaminated soils.
The system was allowed to restabilize for approximately one day using the procedure described above. After that time, the selected electrolytes were added and the current was applied. Each system was allowed to run continuously once the current was applied. The electrolyte solutions were replenished daily and samples were collected for experiments that ran for up to 15 days. Experiments the ran for extended periods of time (greater than 15 days) were replenished and sampled every 2 to 3 days. At the completion of the experiment, the test cell was disassembled and the sand was removed in 9 equal, vertical strips. The center strip, which contained the uranium contamination was deliberately isolated from the remaining strips to measure the amount uranium remaining in the contaminated strip.
2.4.3 Hanford Waste Experiments
Two experiments using uranium-contaminated pond waste obtained from a remediation site at the DOE-Hanford site in Richland, Washington were also conducted. The waste was obtained from the South Process Pond which is an inactive 36,000 m2 unlined surface impoundment located within the 300 Area. The south process pond was the fist process liquid waste disposal facility for the 300 Area. It was built in 1943 and was operated until 1975. Details of a site investigation and results of comprehensive chemical and radiological analyses are presented in DOE report RL- 92-43 (DOE, 1992). Uranium analysis results for samples tested as part of this research are presented in Table 4. High concentrations of calcium (95,300 ppm), copper (95,300 ppm), and
18

magnesium (25,500 ppm) were present in the sediment.
Table 4. Uranium Concentrations in Hanford Waste EXp.-No. Sample Mass U-238 U-238 U-235 U-235 U-234 U-234 Ttl U Mass
in Test Cell (9) (pCi/g) (rng) (pc'ig) (mg) (pCi/g) (rng) per sample (rng)
EKlO 57.55 1220 206.5 91 .o 2.37 1220 0.011 208.9 EKI 1 57.22 1290 217.1 90.8 2.37 1290 0.012 21 9.5
Before use, the sediment was oven dried, sieved to remove pebbles, and coned and quartered. Two of the quartered samples were moistened to 10% moisture content and placed in 2 test cells in the same manner as the uranium-contaminated sand test cells had been prepared. The carbonate catholyte (0.5M) was used on one test cell (EK10) and the citrate catholyte (0.4M) was added to the second test cell (EKll). All system parameters were the same as the open cell uranium- contaminated sand experiments.
2.4.3.1 Analyses
Analyses included tests to determine uranium concentrations, pH, electrical conductivity, and moisture content. Uranium analyses were performed by inductively coupled plasma / mass spectrometry (ICPMS) or by luminescent spectrophosphorimetry. Sample preparation and analysis techniques are described below.
2.4.3.2 pH
Soil pH was analyzed as follows. Five to 10 grams of moist soil from each sectioned sample was place in a disposable plastic beaker. An equal mass of deionized water was added to each beaker and the resulting slurry was thoroughly stirred and allowed to stand for a few minutes. The pH of the supernatant was then determined using a calibrated pH meter.
The accuracy of the measurement method described above was verified using an alternative test method. The pH of the soil of 14-day uranium-contaminated sand citrate catholyte and the carbonate catholyte experiments was also determined using colorimetric pH test strips. Whatman@ pH test strips, which yield measurement accuracy to 1 pH unit, were pressed and held against the damp soil samples until the indicator strip was wetted. The strips were then quickly rinsed with deionized water to remove any sand that had adhered. The pH was then determined by comparing the test strip to a color chart that was included with the pH strips. The results from pH test strip measurements were consistent with the results obtained using the method described above but were approximately 1 pH unit lower.
19
2.4.3.3 Soil Electrical Conductivity
Electrical conductivity of the soil was determined by measuring the electrical conductivity of the supernatant prepared for soil pH measurement (Section 3.5.1). All conductivity measurements were performed in accordance with the instrument manufacturer's instructions. Soil moisture conductivity measurements were corrected to account for the dilution of the pore-water during the sample preparation step. The correction factor was used because of the ten-fold dilution in the soil moisture present in the sample (ie., 10 g of soil at 10 percent moisture content diluted with 10 mL of deionized water).
2.4.3.4 Voltage Measurements
Cell voltages from electrode to electrode were measured each time that a sample was collected. Voltage measurement data were taken from the volt meter display on the power supply. In several experiments, in addition to cell voltages, 11 equally spaced stainless steel pins that penetrated the entire thickness of the sand were inserted into the sand in the cell. Voltage measurements were taken from the anode to each pin in a sequential manner with increasing distance. This measurement was taken during several of the experiments to determine the local electric potential gradient tie., AV/A 1).
2.4.3.5 Moisture Content
The soil moisture content of each sample was determined by weighing the sample immediately upon sample collection, placing the sample in an oven and heating to 100 degrees centigrade overnight. The sample was removed from the oven, allowed to cool and reweighed. The soil moisture content was calculated as weight percent moisture.
2.4.3.6 Uranium Analyses
All samples analyzed for uranium required preparation before analysis. For the closed cell experiment samples, the entire section of sand (- 20g) was prepared. The sample was placed in a conical beaker and wet ashed with concentrated nitric acid and 30% hydrogen peroxide. The sample was allowed to cool, quantitatively transferred through a Whatman@ 4 1 filter circle and the filtrate brought to final volume of 100 mL with deionized water. Open cell sand samples were prepared in an identical manner except the sample mass was reduced to approximately 1 to 5 g per sample. Multiple samples were prepared from the sections taken from the areas where uranium concentrations were expected to be greatest to measure the variability in uranium concentrations within that section of sand.
The liquid samples and soil leachate samples analyzed by luminescent spectrophosphorimetry
20

required further preparation prior to instrumental analysis. Samples were prepared using the following procedure: An aliquot (100 to 500 microliters [pl]) of the soil leachate solution or electrode effluent was placed in a precleaned 20 mL scintillation vial. Samples were wet ashed by adding 1 mI, concentrated nitric acid and 0.5 mL of 30 percent hydrogen peroxide to each vial. The vials were then placed on a hot plate and heated to dryness. This wet ashing procedure was repeated as necessary until a white translucent material was all that remained. Most of the leachate samples and anode effluent did not require additional preparation after the initial addition of nitric acid and peroxide. However, the cathode samples (sodium citrate) required numerous additions of nitric acid and hydrogen peroxide before a white ash residue was obtained. The samples were then brought to 10.0 mL volume with 1% (by volume) nitric acid and subsequently analyzed in accordance with the instrument manufacturers specifications. Samples were analyzed by ICPMS or by luminescent spectrophosphorimetry . Because of matrix effects, standard addition was used to quantify detectable concentrations of uranium when the samples were analyzed by luminescent spectrophosphorimetry .
3.0 RESULTS AND DISCUSSION
The results of experiments performed in this study are presented in this chapter. Closed cell experiments were limited to the study of the migration of uranyl citrate complexes while open cell experiments investigated a variety of complexing agents. Closed cell results are presented and discussed in Section 3.1 and open test cell results and discussion are presented in Section 3.2.
Pond sediment contaminated with radioactive and chemical waste products, obtained from a DOE-Hanford site, was also studied to determine the feasibility for application of the technique to waste media. Because of the high concentrations of chemical constituents present in the soil that interfere and compete with the uranium complexation process, this waste was considered to represent an extreme for the application of electrokinetics process described in this report. Hanford waste experiment results are presented and discussed in Section 3.2.3.
3.1 Closed Cell Uranium-Contaminated Sand Experiments
As previously stated, the primary objective of the closed cell experiments was to provide a rapid indication of the feasibility of migrating uranium through soil by an electric field. The closed test cell was a simpler design and provided a more rapid approach to studying uranyl citrate migrational behavior than the open cell configuration.
A secondary objective of the closed cell experiments was to gain an understanding of the amount of citrate required to mobilize uranium in the selected porous media. Stability constant data show that the monomeric and dimeric species are favored to be the most abundant uranyl citrate
21

species present in the pore-water; therefore, one is justified in concluding that a 2: 1 ratio of citrate to uranium is adequate to completely complex all of the available uranyl ions in absence of other metals. However, results presented below showed that equilibrium, precipitation, and adsorption affected the migration of uranium through the soil thereby reducing the efficiency of the uranium removal process.
Closed cell experiments with 200: 1,20: 1 and 3: 1 citrate to uranium molar ratios were conducted to determine this effect on uranium migration as a uranyl citrate complex subjected to an electric field. Control experiments were also conducted to verify that the uranyl ion was immobile when the chelating agent was not present.
Results of the 200: 1 citrate to uranium closed cell experiment is depicted in Figure 3 where the normalized mass of the uranium is plotted as a function of position with respect to time. Results were normalized to provide comparison of results between experiments. The mass of uranium present in the samples was normalized by dividing the measured concentration by the total mass of uranium added to the cell. In this experiment, as well as subsequent ones, a constant current density of 0.346 mA/cm2 was applied to the test cell. As soil mass was removed from the cell, the amperage applied to the cell was decreased proportionally. The initial amperage applied to cell was 10.0 mA and was reduced to 8.3,6.7,5.0, and 3.3 mA, respectively, each time a sixth of the soil mass was removed from the test cell.
Figure 4 shows that uranium, when combined with citric acid, migrated towards the anode. A small fraction (0.033) migrated completely to the anode by the tennination of the experiment (2 1.9 hours). However, the majority of the uranium mass remained situated between the point of emplacement and the anode. Results suggest that the uranium mass tended to spread and then to refocus with increasing time.
The uranium migration rate at the various sampling times can be estimated by measuring the distance that 50 percent of the uranium mass had migrated within the designated time interval. If this approach is used, the velocity of the uranyl citrate complex can be estimated to be approximately 0.5 cm/hr when sampled at 7.0 hours, 0.82 cm/hr at 9.6 hours, and 0.23 cm/hr at 21.5 hours.
22

1 1
0.9
.- 0.8
2 6 0.7 .N a 0.6 -- m .r O Q ,
-- -- --
5 E o
Q)c - 'p 0.5 -- 5 0.4 --
0.3 -- P O
= = 0.2 f - - 0 0.1 --
/ + U-Cont. Sond. Citrate Cothowe sc +t- u-Cont. Sond. Carbonote Cotholyte I +Hontord. Corbonate Cotholyte -+- Honford. Citrote COlhOl~te
0 0 10 20 30 40 50 60
Day Figure 3. Results of the 200: 1 citrate to uranium closed cell experiment
0.8
0.7
E 0.6 E
v)
f 0.5 .- S a
'c3 Q,
m
3 0.4
0.3
E z" 0.2
0.1
0 -9.6 -7.2 -4.8 -2.4 0 2.4 4.8 7.2 9.6 -9.6
anode Position in test cell (cm) cathode
Figure 4. Distribution of uranium with time in the 200: 1 citrate:uranium closed cell test device.
23

Because uranium was expected to migrate in the direction of the anode, only the samples collected between the anode and the point at which the uranium-contaminated sand was emplaced were analyzed for the 2.3,4.4,9.6, and 21.2 hour sampling periods. The validity of this assumption was confirmed by analysis of all samples collected from the anode to the cathode in the 7.0 hour sampling event. The results for the 7 hour sampling event (Figure 3) showed that uranium was present only in the samples taken between the emplacement point and the anode and was not detected elsewhere.
Closed cell experiments were repeated using the same set of parameters as the 200: 1 molar ratio of citrate to uraniurn experiment except the molar ratios of citrate to uranium were reduced to 20: 1, 3: 1 and 0: 1. These experiments were conducted to determine if varying the molar ratio of citrate to uranium had an effect on the distribution and migration rate of uranium. Control experiments were conducted to verify that uncomplexed uranyl species were immobile in the sand.
Results of uranium migration in the 20: 1 and 3: 1 molar ratio experiments are presented in histogram form in Figures 5 and 6, respectively. The initial migration rates and the quantity of uranium that migrated were roughly the same in both cases. Results showed that uranium migration ceased in both experiments after approximately 9 hours. The leading edge of the uranium front in both of these experiments moved approximately 5 cm towards the anode and halted after 4.5 hours. The trailing edge in the 3: 1 experiment appears to have migrated slower than the 20: 1 experiment but uranium migration ceased after approximately 9 hours. Control experiment results for uranium distribution in the test cell after approximately 10 hours of operation are depicted in Figure 7. Both sets of results show a slight migration towards the anode; however, no migration was evident in the direction of the cathode indicating that the uranyl ion probably precipitated or sorbed. The slight redistribution of uranium towards the anode may be due to migration of an anionic uranyl species or sampling/analytical error. The former is more likely since the two sets of results are consistent. In either case, movement was less than 2.5 cm. Figure 4 shows that uranium, when combined with citric acid, migrated toward the anode. A small fraction (0.033) migrated completely to the anode by the termination of the experiment (21.9 hrs). However, the majority of the uranium mass remained situated between the point of emplacement and the anode. Results suggest that the uranium mass tended to spread and then to refocus with time.
Typical uranium migration rate at the various sampling times can be estimated by measuring the distance that 50 percent of the uranium mass had migrated over within the designated time interval. If this approach is used the velocity of the uranyl citrate complex can be estimated to be approximately 0.5 cm/hr when sampled at 7.0 hrs, 0.82 cm/hr at 9.6 hrs, and 0.23 cm/hr at 21.5 hrs. Because uranium was expected to migrate in the direction of the anode, only the samples
24

0.9
H 2.08 hours
0.8
0.7
0.6
0.5
0.4
0.3
0.2
0.1
0
r
d d
8.35 hours 0 10.55 hours
0 2.4 4.8 7.2 9.6 12 Distance from uranium emplacement to anode
0.7
0.6
0.5
0.4
0.3
0.2
0.1
0
_.
E 2.25 hours 4.42 hours 6.55 hours
0 9.12 hours 11.6 hours
0 2.4 4.8 7.2 9.6 12
Distance from uranium emplacement to anode
Figures 5 (top) and 6 (bottom). Uranium migration with time, closed cell device. 20: 1 (top) and 200: 1 (bottom) mom ratio of citrate:uranium-contaminated sand.
25

g 0.9 0.8 0.7
2 0.6 8 0.5 ’ 0.4 a fi 0.3 I 0.2
8 2 0
- E 0.1
N Control Experiment No. 1 0 Control Experiment No. 2
-2.4 cathode
-0.5 0 2.4 Emplacement point
Position in cell (cm)
4.8 7.2 9.6
Figure 7. Ura ium distribution following 10 hrs. of applied current j cell experiments where no citrate was added.
anode
two closed
collected between the anode and the point at which the uranium-contaminated sand was emplaced were analyzed for the 2.3,4.4,9.6 and 21.5 hour sampling periods. The validity of this assumption was confiied by analysis of all samples collected from the anode to the cathode in the 7.0 hour sampling event, the results of which are presented in Figure 3. Uranium was present only in samples taken between the emplacement point and the anode.
Typical variations in the pore-water pH in the closed cell are depicted in Figure 8. As hydrogen ions were generated at the anode, they migrated towards the cathode lowering the pH of the pore- water. Conversely, hydroxide ions, generated at the cathode migrated towards the anode. Cell voltage was allowed to vary in order to maintain constant current. Voltage measurements across the entire cell (electrode to electrode) were taken just before shutting the system off to collect samples. Cell voltages over time are shown in Figure 9. Measurements show that the applied voltages were fairly constant between the experiments indicating that the soil pore-water conductivity was relatively uniform. Based on this data, differences in the uranyl citrate migration rates cannot be attributed to varying voltage gradients between experiments. Figure 9 shows that the cell voltage decreased over time. As previously noted hydroxide and hydrogen ions were generated which migrated towards the attracting electrodes. Because these ions have relatively high mobilities compared to other ions. Consequently, the voltage gradient across the cell decreased with time as hydronium and hydroxide ions infiltrated the cell. Another factor that contributed to the increase in pore-water conductivity was from solubilization of the calcium sulfate
26

14
12
10
8
6
4
2
0
- 4-0 Hours -4.4 Hours -6.6 Hours *9.1 Hours -11.6 Hours
I I
I I
I I
I 1
I I I
I I I
I I
I I
I I I
1.2 3.2 cathode
5.2 7.2 9.2 11.2 13.2 15.2 17.2 19.2 Location of sand within cell, anode
V U
70
60
50
T +200:1 Experiment -2O:l Experiment -t- 3:l Experiment *Control Experiment
40
30
20
0 2 4 6 Hours of Operatic
8 10 12
Figures 8 (top) and 9 (bottom). Pore water pH vs. time in closed cell experiments (top). Cell voltage vs. time for cloed cell experiments (bottom).
27

added to the sand for an ion source.
3.1.1 Discussion of Closed Cell Results
Closed cell experiments were performed to gain a basic understanding of migration of uranyl complexes under electrolunetic influences in the selected medium. Experimental results were consistent with the hypothesis that uranyl ions, when complexed with citrate to form anionic uranyl citrate complexes, will migrate under the influence of an applied electric field towards the anode.
Control experiment results demonstrated that uranium was immobile at uranium concentrations up to 100 ppm. Results suggest that uranium initially precipitated upon addition of the uranium- citrate complex to the sand and ceased migrating when it reprecipitated and/or resorbed onto the sand.
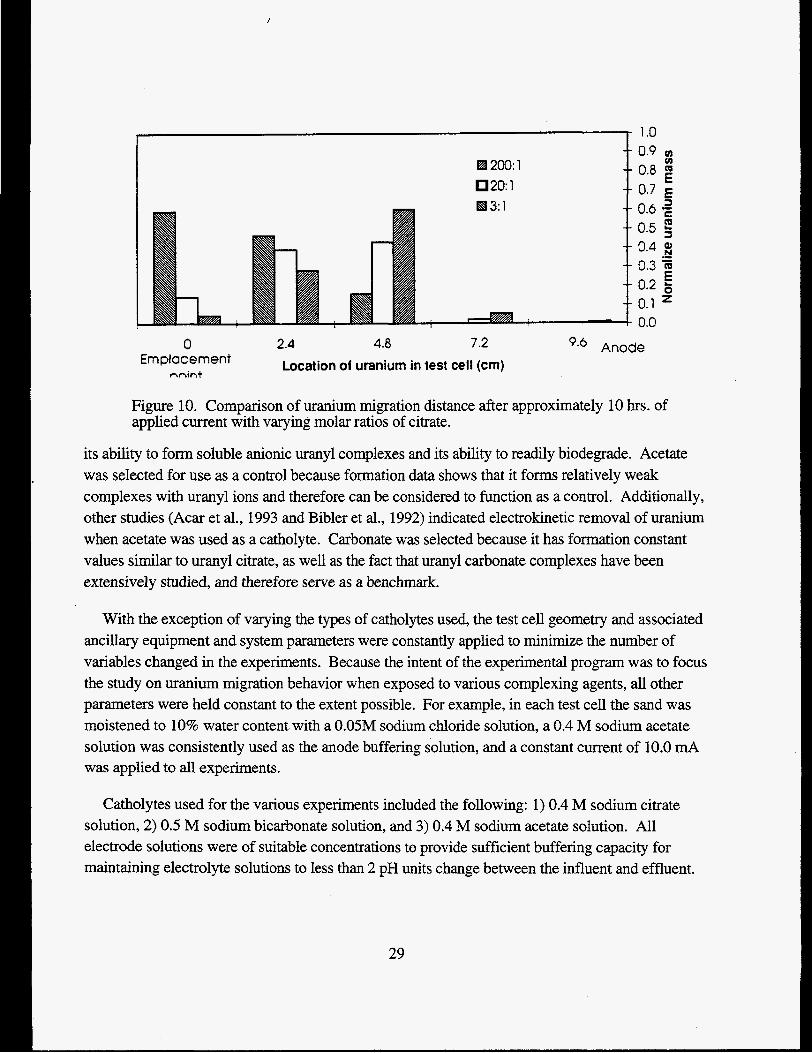
Varying the molar ratio of citrate with respect to uranium affected the distance that uranium migrated. Figure 10 shows that the amount of citrate ion added to the system had an effect on the uranium migration distance. The lack of sustained uranium migration in the closed cell experiments is attributed to the thermodynamic condition that metal-ligand complexes exist in a state of equilibrium. When the uranyl complex was in the dissociated form, the uranyl and citrate ions tended to migrate in opposite directions under the influence of the electric field. When the dissociated ions migrated distances greater than the equilibrium bond length, the applied electric potential prevailed and the cation and anion pairs did not recombine to form complexes. The citrate anion continued to migrate towards the anode and the uranium either sorbed or formed a precipitate. Because citrate analysis capabilities were not available at the time the closed cell experiments were performed, the actual citrate concentrations in the cell could not be determined. Results, however, suggested that a constant flux of citrate ions was necessary to sustain uranium electromigration.
3.2 Open Cell Uranium-Contaminated Sand Experiments
Based on the results of the closed cell experiments, the study was extended into an open test cell configuration where acid and base effects could be controlled and complexing agents could be introduced into the cell in a continuous, in situ manner. Closed cell experiments indicated that the migration of an anionic uranyl complex was possible but a constant flux of the chelating agent through the cell was necessary to sustain uranium electromigration.
Three types of ligands were selected as the basis for studying the behavior of electrokinetic uranyl complex migration using the open test cell design. All complexing agents selected were introduced at the cathode as anionic species. Citrate was chosen as a complexing agent because of
I
28
- 1.0 -- 0.9 rn
a 200: 1 0.8 -- 20: 1 0.7 E - -
v)
3 0.6 = 0.5
0.3 E 0.4 3
0.1 =
.- 0.2 g 0.0
0 2.4 4.8 7.2 9h Anode Location of uranium in test cell (cm) Emplacement
nnint
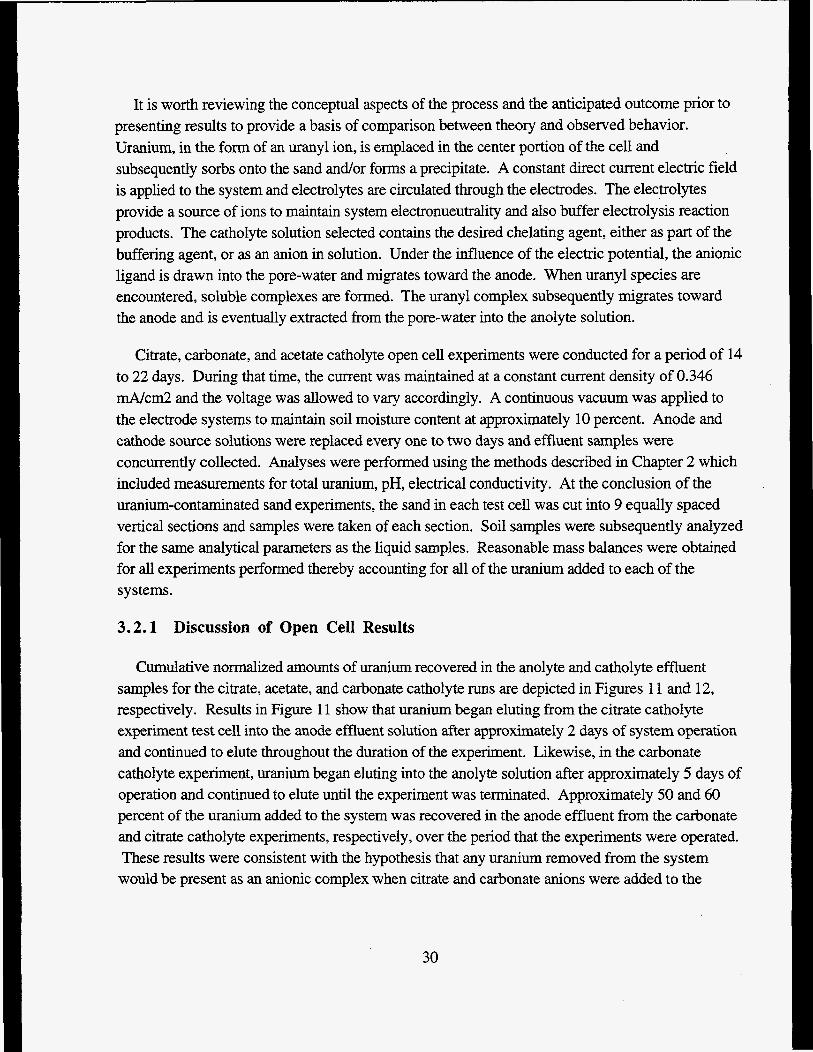
Figure 10. Comparison of uranium migration distance after approximately 10 hrs. of applied current with varying molar ratios of citrate.
its ability to form soluble anionic uranyl complexes and its ability to readily biodegrade. Acetate was selected for use as a control because formation data shows that it forms relatively weak complexes with uranyl ions and therefore can be considered to function as a control. Additionally, other studies (Acar et al., 1993 and Bibler et al., 1992) indicated electrokinetic removal of uranium when acetate was used as a catholyte. Carbonate was selected because it has formation constant values similar to uranyl citrate, as well as the fact that uranyl carbonate complexes have been extensively studied, and therefore serve as a benchmark.
With the exception of varying the types of catholytes used, the test cell geometry and associated ancillary equipment and system parameters were constantly applied to minimize the number of variables changed in the experiments. Because the intent of the experimental program was to focus the study on uranium migration behavior when exposed to various complexing agents, all other parameters were held constant to the extent possible. For example, in each test cell the sand was moistened to 10% water content with a 0.05M sodium chloride solution, a 0.4 M sodium acetate solution was consistently used as the anode buffering solution, and a constant current of 10.0 mA was applied to all experiments.
Catholytes used for the various experiments included the following: 1) 0.4 M sodium citrate solution, 2) 0.5 M sodium bicarbonate solution, and 3) 0.4 M sodium acetate solution. All electrode solutions were of suitable concentrations to provide sufficient buffering capacity for maintaining electrolyte solutions to less than 2 pH units change between the influent and effluent.
29
It is worth reviewing the conceptual aspects of the process and the anticipated outcome prior to presenting results to provide a basis of comparison between theory and observed behavior. Uranium, in the form of an uranyl ion, is ernplaced in the center portion of the cell and subsequently sorbs onto the sand and/or forms a precipitate. A constant direct current electric field is applied to the system and electrolytes are circulated through the electrodes. The electrolytes provide a source of ions to maintain system electronueutrality and also buffer electrolysis reaction products. The catholyte solution selected contains the desired chelating agent, either as part of the buffering agent, or as an anion in solution. Under the influence of the electric potential, the anionic ligand is drawn into the pore-water and migrates toward the anode. When uranyl species are encountered, soluble complexes are formed. The uranyl complex subsequently migrates toward the anode and is eventually extracted from the pore-water into the anolyte solution.
Citrate, carbonate, and acetate catholyte open cell experiments were conducted for a period of 14 to 22 days. During that time, the current was maintained at a constant current density of 0.346 mA/cm2 and the voltage was allowed to vary accordingly. A continuous vacuum was applied to the electrode systems to maintain soil moisture content at approximately 10 percent. Anode and cathode source solutions were replaced every one to two days and effluent samples were concurrently collected. Analyses were performed using the methods described in Chapter 2 which included measurements for total uranium, pH, electrical conductivity. At the conclusion of the uranium-contaminated sand experiments, the sand in each test cell was cut into 9 equally spaced vertical sections and samples were taken of each section. Soil samples were subsequently analyzed for the same analytical parameters as the liquid samples. Reasonable mass balances were obtained for all experiments performed thereby accounting for all of the uranium added to each of the systems.
3.2.1 Discussion of Open Cell Results
Cumulative normalized amounts of uranium recovered in the anolyte and catholyte effluent samples for the citrate, acetate, and carbonate catholyte runs are depicted in Figures 11 and 12, respectively. Results in Figure 11 show that uranium began eluting from the citrate catholyte experiment test cell into the anode effluent solution after approximately 2 days of system operation and continued to elute throughout the duration of the experiment. Likewise, in the carbonate catholyte experiment, uranium began eluting into the anolyte solution after approximately 5 days of operation and continued to elute until the experiment was terminated. Approximately 50 and 60 percent of the uranium added to the system was recovered in the anode effluent from the carbonate and citrate catholyte experiments, respectively, over the period that the experiments were operated. These results were consistent with the hypothesis that any uranium removed from the system would be present as an anionic complex when citrate and carbonate anions were added to the
30

1 - l
v) 0.9
E - 0.8 -- added at the cathode = a e E 0.7- +-Anode effluent when 2 w carbonate added at the
cathode +Anode effluent when citrate
added at the cathode
-- -c- Anode effluent when acetate v)
Lc)
E E .-
a r
0 2 4 6 8
Day
10 12 14
0.5 1 . 0.45 - - E, .- 3 c 0.4 -- = s = z = a .- W 3 0.3 -- 0 5 E 0.25 --
0.2 -- a 0
9 p 0.15 -- s o
0
E 0.35 t
- e .E .? 2 L
5 E 0.1 -- 0.05 --
+Acetate added at cathode
--t Citrate added at cathode
+ Carbonate added at cathode
f 0
10 12 14 0 2 4 6 Day8
16
Figures 11 (top) and 12 (bottom). Uranium-contaminated sand experiments. Uranium recovered when citrate, carbonate and acetate catholytes were used (top). Cumulative normalized uranium recovered in the catholyte solutions (bottom).
31

system. Uranium was detected in the acetate catholyte experiment anode effluent at trace concentrations (0.113 mgL) after 6 days of operation (this may have been an anomaly given the low concentration at which it was measured) but was not again detected until 6 days later at a similar concentration. Uranium was not detected in any of the catholyte effluent samples from either the citrate or carbonate experiments but was detected at measurable concentrations in the acetate catholyte experiments.
Formation constant data show that acetate forrns positive, negative, and neutral species and therefore should experience electromigration in both directions. Because all possible uranyl acetate species form weak complexes, the amount of uranium migrating from the cell was expected to be minimal.
Figure 13 depicts uranium concentrations in the anode effluent with respect to time for the citrate, carbonate, and acetate catholyte experiments. Two distinct peaks are evident for both the citrate and carbonate catholyte experiments with the first peak in both cases reaching the highest concentration. Similar behavior was exhibited by the carbonate experiment for the first peak period except that the eluting peak was delayed a few days. Both effluent uranium concentrations peaked within 3 to 4 days after uranium was first detected. An explanation for the presence of multiple peaks is provided in Section 3.2.2. The relative distribution and normalized mass of uranium remaining in the soil for the uranium-contaminated sand experiments is depicted in Figure 14. Results showed that when either citrate or carbonate was added at the cathode, the uranium mobilized and migrated towards the anode at substantial levels. The uranium distribution for the citrate and catholyte experiments indicated that the uranium that remained in the sand at the termination of the experiment had mobilized as an anionic complex and would have ultimately migrated to the anode where it would have been extracted.
Results from the acetate catholyte experiment bring out some interesting points. Namely, formation constant data provides an indicator of the ability of the complexing agent to form mobile complexes. Fifty to 60 percent of the uranium added to the systems was recovered in the anode effluent from the carbonate and citrate catholyte experiments over the same period of time that the acetate catholyte experiment was operated; whereas, less than one percent was recovered in the anolyte and 14 percent was recovered in the catholyte in the acetate catholyte experiment. The recoveries reported by Bibler et al. (1992) and Acar et al. (1993) were not observed. Bibler et al. reported that 57 percent of the uranium was recovered in the soil near the anode and cathode. It is likely that the Uranium migration reported by Bibler, et al. (1992) was partially, if not completely due to the formation of soluble uranyl acetate complexes rather than the migration of the uranyl ion as suggested by the authors. This aspect was demonstrated by the closed cell control experiment results where no migration towards the cathode was noted and by the open cell carbonate and
32

80
70 CI
E60 Q Y
50
'S L 40
8 30
0
.- c c
5 20 = 10
0
- -+-Citrate experiment +Acetate Experiment
1 h +-Carbonate experiment
0 2 4 6 8 Day
10 12 14
Figure 13. Concentration of uranium in anolyte effluent with time for the citrate and carbonate catholyte uranium-contaminated sand open cell experiments.
0.5
0.45 E4 Citrate Catholyte, 14 day exp. E4 Acetate Catholyte 01
0.4 ' 0.35 El Citrate Catholyte, 37 day exp. fcil Carbonate catholyte f = 0.3
5 0.25 tm
U
t 0.15
0.05
0
A 0.2
g 0.1
- - b
0.00 0.13 0.25 0.37 0.50 0.63 0.75 0.87 1 .00 Anode Emplacement Point Cathode
Normalized Position in cell
Figure 14. Normalized distribution of uranium remaining in the test cell at the termaination of the uranium-contaminated sand open cell experiments.
citrate catholyte experiments which showed migration only towards the anode. The acidic soil
33
conditions present in the experiments conducted by Acar et al. (1993) probably allowed the migration of the uranyl ion which resulted in greater than 90 percent of the uranium in the soil migrating to the region near the cathode. However, this was not the case in the experiments conducted by Bibler, et al. (1992) nor in the experiments described in herein.
Soil moisture, pH and electrical conductivity measurements were taken from samples of each of the 9 vertical sections taken. Soil moisture results showed that the soil moisture content (by weight) ranged from 8 to 10 percent and was approximately the same as the initial moisture content.
Results of pore water pH and electrical conductivity measurements, with respect to location within the test cells, are depicted in Figures 15 and 16, respectively. Average (across the cell) pore-water pH and electrical conductivity, time-averaged anolyte and catholyte influent and effluent conductivity, and pH values are presented in Table 5. The pore-water conductivity results were corrected to account for pore-water dilution during sample preparation which resulted in a 10-fold dilution @e., 10 g of soil at 10 percent moisture content diluted in 10 mL of deionized water). Electrical conductivity measurement data showed that the highest soil-water conductivities were measured in the carbonate catholyte test cell sand samples and the lowest (- 8 to 15 milliSiemens [mS]) in the citrate catholyte sand samples. Similar behavior was noted in the corresponding pH data (Figure 15) suggesting that the conductivity was influenced to a certain degree by the pH of the pore-water.
Daily cell voltage measurement results are depicted in Figure 17. As indicated, the voltage was at its highest at the start of each experiment, decreased, and eventually leveled off at approximately 15 volts after 5 to 10 days of operation. The change in cell voltage was obviously due to a change in the pore-water chemistry since virtually all of the current was conducted through the pore-water. As indicated in Figure 17, the starting voltage for the citrate experiment was noticeably higher than the acetate and carbonate catholyte experiments. The cause of this deviation was probably due to the fact that the sand source was changed between the citrate experiment and subsequent acetate and carbonate experiments. The sand source was changed from Wedron grade 801 to grade 805 because the latter contained more fines and required less preparation time. Unfortunately, soil washing before use was prohibited due to the fineness of the pulverized sand required to maintain the proper hydraulic characteristics. This change in soil could have affected the initial pore-water conductivity. A second citrate catholyte experiment was subsequently performed and results are reported below. The start of this experiment was approximately 45 volts which is consistent with the starting cell voltages for the acetate and carbonate catholyte experiments. In addition to monitoring cell voltages, the change in the local voltage gradients were measured daily in both the
34

14 ,
4 8
4 8 6 : 4
Pore-water pH for 14 day citrate experiment
Pore-water pH for acetate experiment
A Pore-water pH for carbonate experiment
0 anode
2 4 6 8 10 12 14 16 18 20 22 24 cathode
Cell Position, cm
67 4 Pore-water conductivity for the citrate
experiment
’t “ t A A
W 8
4
w Pore-water conductivity for the
A Pore-water conductivity for the acetate experiment
3 --
I 2 --
4 1 - -
0 ,
A A A W A
W W
4
W
4
3 5 7 anode
9 11 13 15 17 Cell Position, cm
19 21 23 cathode
Figures 15 and 16. Pore-water pK(top) a d conductivity (bottom) across the test cells in the uranium-contaminated sand open cell experiments.
35

Table 5. pH and Electrical Conductivity of Electrolytes and Pore-water for Open Cell Experiments ~~
Average" Anolyte Catholyte Anode Cathode Electrode InfluentlEffluent InfluentlEffluent Influent/Eff luent InfluentlEffluent Solution PH PH Conductivity Conductivity
29.1 130.3 Citrate 7.3 15.7 5.3 15.5 23.1 123.6 15.8 I 15.8 Acetate 7.3 15.7 4.9 I 6.8 23.6 I 23.1
Carbonate 7.3 1 5.7 8.5 I 9.1 23.9 / 22.1 29.8 130.5 Averageb Pore-water pH at Pore-water pH at Pore-water Pore-water
Pore-water start termination conductivity at start conductivity at solution (mWcm) termination
(mSlcm) (mS1cm)
(mSlcm) Citrate 7.9 9.3 7.8 29.6
Acetate 8.0 10.7 6.5 18.8 Carbonate 8.0 10.2 6.5 33.8
aAverage between samples collected over time. bAverage between samples taken across test cell at the completion of the experiment.
Q) Q) m = 0 >
1 80
160 --
140 -- -+-Acetate Experiment
120
100
-- +Citrate Experiment --
80 -- -A- Carbonate Experiment
60 -- 40 -- 20 --
o r I
0 2 4 6 a 10 12 14 16 Day
Figure 17. Cell voltage changes over the operation period of the uranium- contaminated sand open cell experiments.
36

citrate and carbonate catholyte experiments. Voltage measurements were taken between 11 equally-spaced metallic pins inserted in the test cell from the anode to the cathode. Typical changes in voltages across a typical test cell (DVD 1) cell are depicted in Figure 18. This graph shows that the local voltage gradient was greatest near the center of the cell initially and after a period of approximately 5 days the voltage gradient (in the region where uranium migration would have been affected by voltage fluctuations) was constant (i.e., flat). These data show that the voltage differential (df/dz) was relatively constant and therefore should not have affected the electromigration rate to any great degree.
10.0
Day 1
--C Day 3
+ Day 5
*Day10 :ij 5'0 *Day15
Pin 8 4'0 -- + D a y 2 0
0.1 0.3 0.5 0.7 0.9
anodc Normalize Distanc cathodl Figure 18. Graph of typical voltage gradient differential across points in test cell vs. time in the open cell uranium-contaminated sand experiments.
An extended experiment was also conducted to determine if the uranium could be completely removed from the cell using the citrate catholyte. This test cell system was continuously operated for a period of 37 days which resulted in extracting 93% of the uranium added. During the period that the experiment operated, two operational errors occurred that had a direct effect on the outcome of the experiment.
1. On the third day of operation, the portion of the cathode in contact with the sand became loose. This resulted in abnormally high current resistance in the interface region between the sand and the cathode body which resulted in high voltages and poor delivery of the citrate anion into the soil. This high resistance problem was identified and corrected on the sixth day. This problem resulted in a three-day delay in the uranium eluting from the
37

system.
2. A vacuum system failure occurred on day 37th day of operation resulting in saturation of the soil in the cell with the electrolytes; consequently, the system was halted before all of the uranium was extracted from the system. Anolyte and catholyte sample data were not affected; however, soil pore-water pH, conductivity measurements could not be obtained. The uranium distribution in the soil may also have been altered when the system was saturated with electrolyte.
Corrected and uncorrected anode effluent recovery data for the cumulative amount of uranium recovered from the test cell are presented in graphical form in Figure 19 and variations in daily uranium concentrations are shown in Figure 20. Extrapolating the cumulative uranium extract data trend indicates that 99+% of the uranium would have been removed from the system after approximately 32 days of operation. The changes in anolyte and catholyte liquid volumes were measured each time a sample was collected in all of the experiments performed in order to measure the electroosmotic flow rate. The average electroosmotic velocities measured in the various experiments was approximately 0.014 cdday in the region of constant cell gradients (20 volts was used for all calculations).
The citrate flux rate was measured in samples collected from the extended citrate catholyte experiment by measuring the concentration of citrate in the anolyte effluent solution. Problems were encountered with the citrate analysis method apparently due to the citrate forming stable uranyl citrate complexes. Consequently, the citrate measurements were considered valid only at the end of the extended citrate experiment when the uranium concentration in the effluent was minimal. The flux rate at which the citrate was introduced was estimated by assuming that all of the anions present were citrate or uranyl citrate complexes. This assumption is considered to be valid because the hydroxide ion concentration (pH - 9) was 3 to 4 orders of magnitude less than the citrate ion concentration in the pore-water and the hydroxide ion was the only other anion that should have been present in the pore-water in the uranium-contaminated sand system. Based on this assumption, the molar flux rate of citrate through the cell was calculated to be 2.15 x cm-* s-'. The average measured flux rate for experiments performed was 2.5 x 10⁻⁷ mol cm-2 s-' which is slightly higher than predicted but well within the range of experimental error.
mol
Carbonate and acetate flux rates could not be quantified because of the anolyte used. Obviously, acetate ions entering the anolyte could not be measured since the anolyte was an acetate solution. In the case of carbonate, the pH of the anolyte solution was approximately 5.5. At this pH, the carbonate species equilibrium shifts towards CO,.
38

t .-
1 .oo /
0.90 -- 0.80 -- 0.70 -- 0.60 --
0.50 --
0.40 --
0.20
Oe30 1 I I
Extrapolated regior
- Uncorrected data + Corrected data
0 5 10 15 20
Day
25 30 35 40
50
40
30
x)
10
0
+ Corrected results - Actual resutts
0 5 10 15 20 Day
25 30 35 40
Figures 19 (top) and 20 (bottom). Extended uranium-contaminated sand open cell experiments. Cumulative normalized uranium extracted, citrate added to catholyte (top). Uranium in anolyte effluent, data corrected for a period of poor cathode contact (bottom).
39

3.2.2 Discussion of Open Cell Wedron Sand Results
Experimental results demonstrated that when uranium (in the form of a uranyl ion) was complexed with the appropriate ligand, it formed anionic complexes which electromigrated through the soil system pore-water to the anode. Three questions that come to mind when reviewing the open cell experiment results are: 1) What is the uranium migration rate? 2) Why does the uranium removal rate decrease with time? and, 3) What is the ligand utilization efficiency? These questions are addressed below.
Uranium Removal Rate. The rate at which an ion will migrate through porous media is dependent upon several factors including: the electromigration rate, the electroosmotic velocity, chemical diffusion, chemical sorption and chemical equilibrium effects. Chemical species known to form from complexation reactions will exist in thermodynamic equilibrium with each other. However, if the dissociation rate of species formed is slow compared to the rate of complex formation and to the rate at which the complex migrates, one can expect the migration of discrete uranyl-complexes through the cell. This condition would be necessary in order for uranyl complexes, which form both positive and negatively charged species, to migrate in both directions; otherwise, no migration would be observed in either direction.
The migration rate of uranium, as an anionic uranyl complex, can be studied by examining the concentration of uranium present in the anolyte effluent solution with respect to time. Results of uranium analyses for the citrate and carbonate catholyte solutions showed that all the uranium recovered in the electrode solutions was present in the anolyte. Figure 2 1 depicts the uranium electromigration into the anode effluent solutions for the carbonate and the two citrate catholytes experiments when the uranium concentration is plotted as a function of time. Multiple peaks are evident in all experiments. Examination of the electromigration equation in its simplest form shows that the migration velocity of an ion is dependent upon the charge number of the specie, the ion mobility, and the voltage gradient. Voltage measurements taken at discrete points across the test cells (Figure 18) showed that the voltage gradient was relatively constant after a period of 5 days and therefore did not affect the change in the migration rate. Thus, the migration velocity of the uranium complex was probably dependent primarily on the charge number (z) of the species. As a result, the various urany1 complexes formed during complexation exhibited an electrophoretic effect.
The types of uranyl species that will form in aqueous solutions will depend on the pH of the solution. Thus, the pH at which complexation reactions occurred must also be considered before drawing conclusions concerning uranium migration rates. Measurements showed that the pH of the soil pore-water was between 7.5 and 8.0 at the start of each experiment. Surprisingly, the pH
40

70
60
50
40
30
20
10
0
--t 14 day citrate cathoyte experiment
+36 day citrate catholyte experiment,
-21 day carbonate catholyte experiment corrected data
0 5 10 l5 Day 2o 25 30 35
Figure 2 1. Uraniumm concentration in anolyte effluent over time. Note the presence of multiple peaks marking different species.
of the soil pore-water, measured at the termination of the experiment, was considerably higher than at the start. Results showed that the OH‘ concentration increased by approximately 3 orders of magnitude (i.e., increase of pH from 7 to 10) during the course of each experiment. The reason for the increase in pH is unknown, especially in light of the fact that the catholyte and anolyte solutions typically had pH values much lower than those measured in the soil. It is possible that the method used for measuring the soil pH was inaccurate and yielded erroneous results.
Aside from the origin of the hydroxide ions, the characteristic decreases in all cell voltages was probably due to the increase in pore-water pH. Moisture content measurements taken at the termination of experiments showed that the moisture content of the soil remained relatively constant; thus, the decreases in voltage was not due to increases in soil moisture content. Furthermore, at constant current conditions, the equivalent number of ions present in the pore- water system will remain constant (i.e., the number of coulombs passing through the system per unit time will remain constant). Because the ionic mobility of the anionic ligands used are expected to be much less than the chloride ions initially present in the pore-water, the increase in conductivity must have been a result of more mobile ionic species (i.e., hydroxide) entering the pore-water solution. Based on this premise, cell voltage changes can be used as an indicator of pH change which indicate that the pH decreased gradually over a period of approximately 10 days (Figure 22). Figure 22 shows that by the time that the conductivity/pH had stabilized, the largest concentrations of uranium had eluted from the cell. Results suggest that a portion of the uranyl ions were sorbed onto the sand particles and the remaining uranium mass added to the system was present in the precipitate form. The sorbed species readily formed soluble monomeric and dimeric
41

200 1 80 160 1 40 1 20
5 100 80
v)
> c
1 - - = - - Cell voltage for citate catholyte
I:
60 40 20 0
1
h
--t- U conc. with citrate catholyte --+- U conc. with carbonate catholyte -1- - M - Cell voltage for carbonate catholyte 1
6 16 21
100 90 I 80 70 f
t - 60 $ -
o E 50 c P 40 .s 30 20 s 10 = 0
Figure 22. Cell voltage and anolyte effluent uranium concentration vs. time for the citrate and carbonate uranium-contaminated sand open cell experiments.
uranyl complexes with the initial ligand flux and migrated immediately to the anode resulting in the fnst set of peaks. The precipitated uranyl species were solubilized by complexation at a slower rate. However, once the complexes were formed, the solubilized complexes then migrated through the soil to the anode. Because solubilization was limited to the complexation of the uranyl ions present at the surface of the soil particle, the solubilization process was drawn out. This mechanism accounts for the diminished uranium recovery and extended time required to recover the remaining uranium after the initial "wave". This concept is illustrated in Figure 23.
Ligand Utilizatiun. Results showed that electromigration on uranium will depend of the ability of the chelating agent to form a stable complex with the uranyl ion. This fact is borne out by the difference in the amounts of uranium recovered in the acetate and the carbonate and citrate catholyte experiments. However, the dissolution rate of precipitated uranyl species also appears to have an effect on ligand utilization.
Wong et al. (1995) noted similar results when EDTA was introduced into an electrokinetic cell containing lead and zinc oxide species. The authors attributed the poor ligand utilization to the kinetics associated with the metal oxide dissolution. It appears that a similar effect may be present in the experiments performed as part of this research.
Review of the citrate and carbonate recovery data shown in Figure 16 shows that the uranium extraction rate for the carbonate and citrate ligands was approximately equal or extraction of 50 percent of the uranium. The rate at which the ligands were delivered into the system was
42

C ath ode
1
Figure 23. Schematic showing the different forms of uranium present. The sorbed form readily reacts to form soluble species. The solubility of precipitated species is limited to uranyl species at the surface of the soil particle.
proportional to the current applied to the cell as follows:
where,
Nligand = Moles of ligand
I = current (Us)
t = time (s)
F = Faraday constant (96,485 C/mol).
If 50 percent recovery is selected as the measurement point which is roughly 1 1 days time (1- 1/2 days have been subtracted for the time it takes for the ligand to migrate to the uranyl ion) the calculated molar utilization was approximately 230 moles of citrate per mole of uranium recovered. For 90 percent removal using the citrate catholyte (24.5 days using corrected values), the molar ratio was calculated to be approximately 520 moles of ligand for every mole of uranium, or ligand
43

utilization efficiency of 1.7 x uranyl complexes continued migration through the cell and eventually were extracted into the anolyte effluent.
The carbonate had similar ratios. The ligands not forming
The decrease in ligand utilization efficiency is attributed to the decrease in the uranyl complex transference number as well as the presence of less soluble uranium species.
3.2.3 Discussion of Open Cell Hanford Soil Results
Based on the success of the uranium-contaminated sand experiments, sediment waste from a process pond located at the DOE-Hanford complex was obtained for chelate-enhanced electrokinetic remediation testing. The waste contained 2,000 to 3,000 mgkg of uranium along with high concentrations of calcium, magnesium and copper (see Section 2.4.3). The molar ratios for calcium, copper, and magnesium with respect to uranium were 147: 1 (Ca:U), 95: 1 (Cu:U), and 241: 1 (Mg:U). Approximately 57 grams each of waste material, at 10 percent moisture content, was emplaced as vertical sections in the center of two open cell test devices to determine the ability of the process to remove the uranium contamination from the waste. Citrate and carbonate solutions were circulated through the cathode for approximately 60 days.
Prior to conducting open cell tests with the waste sediment, batch-type leaching experiments were performed to determine the ability of the complexing agents to extract the uranium from the soil. A sample was split into four subsamples and leached with water, the citrate (pH - 5.3) and carbonate (pH - 8.5) catholyte solutions, and a concentrated nitric acid hydrogen peroxide solution for approximately 48 hours. The leachate sample was subsequently filtered and analyzed for uranium. Results showed, relative to the concentrated nitric acid leach results, that less than 1 percent of the uranium was extracted with deionized water, approximately 26 percent of the uranium was extracted with to the carbonate solution, and 75 percent of the uranium was extracted with the citrate solution. Water leachate results demonstrated that the uranium present in the waste required acidification or complexation in order for the uranium to be solubilized. The ability of citrate to leach larger quantities of uranium from the Hanford waste compared to the carbonate was apparently due to its ability to remove coatings from the uranium particulates (e.g., amphorous iron and aluminum sesquoxides), which were insoluble in carbonate solution.
Cumulative uranium recoveries from the Hanford waste using citrate and carbonate catholyte solutions in the electrokinetic test cells are depicted in Figure 24. Results of the uranium- contaminated Wedron sand experiments are also included in this plot for comparison purposes. As indicated, approximately 40 percent of the uranium was removed from the soil over a 50-day
44

i t U U-Cont. Sand. Carbonote COthOlVte + Hanford , Carbonate Cotholyte + HonforU. Citrote Cotholyte
0 10 20 30 40 50 60 Day
Figure 24. Cumulative normalized uranium recovered in the anode effluent from the Hanford waste using carbonate and citrate as uranium complexing agents.
operating period with carbonate and citrate complexants. Comparison of the uranium extraction rate between the citrate and carbonate complexants are virtually identical to each other and are similar to the citrate and carbonate Wedron sand experiment results. However, there was a noticeable decrease in the extraction rate for the Hanford sediment in both experiments. This decrease was probably due to the large concentrations of calcium, magnesium and copper present in the waste which competed for the complexing agent. The chemical form of the uranium, which is unknown, also had a probable impact on the extraction rate.
The normalized mass of uranium remaining in the test cells is shown in Figure 25. This figure shows that the bulk of the uranium contamination remaining in the cell was at the point of emplacement. The fact that the residual uranium remained at the emplacement point and was not distributed between the point of emplacement and the anode suggest that uranium removal was solubility limited.
A plot of the uranium concentration in the anolyte effluent for the citrate and carbonate catholyte experiments is shown in Figure 24. Uranium concentrations for the two different complexants exhibited very similar profiles and are similar to the Wedron sand experiments but the concentrations are approximately one-half of those measured in the Wedron sand experiments. Results show that uranium continued to be extracted up through termination of data collection but
45

0.5 0.45
8 Hanford Waste, Citrate
Ed Honford Waste.
Catholyte .48 days
0 anode
0.13 0.25 0.37 0.5 0.63 0.75 Normalized Position in Cell
0.87 1 cathode
Figure 25. Normalized distribution of uranium remaining in the test cells for the Hanford waste experiments at the termination of the experiments.
decreased to approximately 1.5 mg uranium per day.
It is worth mentioning that copper, apparently, was also recovered in the anolyte solutions in both test cells; the copper formed a characteristically green complex in both the citrate and carbonate experiments. Copper was present in the Hanford waste at a concentration of 95,300 ppm. The concentration of copper extracted from the citrate catholyte cell appeared to be much higheiand more prolonged compared to the carbonate catholyte. Copper metal was also observed to have plated onto the cathode in the citrate catholyte experiment. These results are consistent with metal ion complex data tables which include formation of copper-citrate complexes for a positively-charged complex (+l, log K = 6) as well as a host of negatively charged species (up to -4) with log formation constants ranging up to 33. Copper was first observed on the same day that uranium was detected in the citrate and carbonate test cell anode effluent samples, but was probably present in the effluent a few days before at lower, not visibly noticeable, concentrations.
The molar ligand utilization ratio was approximately the same for citrate and carbonate and was calculated to be approximately 1 120: 1 (citrate:uranium) to extract 35 percent of the uranium from the soil. Using the rate data from the period at the end of data collection, the molar ratio of citrate to uranium was estimated to be 1320: 1 to extract 50 percent of the uranium from the waste.
Soil analyses results show that a substantially larger amount of uranium was removed from the soil than indicated by the effluent analyses. Results of uranium in soil analyses showed that for the carbonate catholyte experiment, approximately 139 mg of the 219 mg of uranium placed in the cell was removed which resulted in 62 percent uranium removal. Similarly, for the citrate catholyte experiment, 7 1 % of the uranium was removed. The uranium results, measured by phosphorimetry, were confirmed by gamma spectroscopy analyses. There was less than 10
46

percent difference between the two methods of measurements in both cases.
The discrepancy between the total uranium mass recovered in the effluent samples and uranium mass remaining in the soil at the termination of the Hanford waste experiments is probably due to the slight negative analytical bias present in the liquid analyses. The fact that the results are biased is indicated by the matrix spike quality control sample results which yielded an average of 92.5 percent recovery of the uranium added to the samples. This slight negative bias resulted in a propagated error of approximately 25 percent difference in the mass balances between the two experiments.
Gross radioactivity soil measurements @e., gross alpha and gross beta) showed that alpha activity, primarily due to uranium decay, decreased by an order of magnitude and beta activity, primarily due to cobalt-60, strontium-90, and cesium-137, was decreased by a factor of three. The mean gross alpha activity decrease from approximately 290 pCi/g to 40 pCi/g and to 30 pCi/g using the carbonate and citrate catholyte solutions, respectively. The mean gross beta activity decreased from 370 pCi/g to 90 pCi/g and to 120 pCi/g using the carbonate and citrate catholyte solutions, respectively.
A portion of the Hanford waste material subjected to the citrate catholyte was further subjected to citrate leaching at the termination of the experiment to determine if additional uranium could be removed from the sample; or, if the uranium remaining was present in an insoluble form [e.g., U(JY)]. This was determined by placing approximately 5 grams of soil in a flask, adding 100 mL of the citrate catholyte solution, and allowing the mixture to stand at room temperature for approximately 24 hours. The leachate solution was subsequently analyzed using the procedures described in Chapter 2. Results showed that an additional 50 percent of the uranium remaining in the treated waste was leached by the citrate solution. This result suggest that upwards to 85 percent of the uranium could have been removed from the waste by electrokinetic treatment.
4.0 CONCLUSIONS
Laboratory experiments demonstrated that uranium, in the uranyl form, can be removed from unsaturated contaminated soil by application of electrokinetic methods. When a ligand, whch forms strong anionic uranyl complexes, is introduced into the test cell, uranium is mobilized and transported to the anode. Experiments using carbonate and citrate, both of which form moderately strong to strong anionic uranyl complexes, was introduced at the cathode, uranium was removed from contaminated sand and Hanford waste sediment. Subsequent sampling of the porous media in the uranium-contaminated sand test cells showed that the uranium remaining in the test cell had migrated towards the anode. No uranium was detected in the region between emplacement and the cathode in any of the citrate or carbonate catholyte uranium-contaminated sand experiments
47

verifying that anionic uranyl complexes were the reason for the uranium migration. Acetate catholyte experiments showed migration in both directions suggesting the-formation of soluble complexes with positive and negative charges.
Closed cell experiments demonstrated that the uranyl ion, which apparently sorbed and formed precipitates, could not be mobilized without addition of a complexant and that a constant molar flux of ligand through the system was required to sustain uranyl ion migration. Results suggested that the reason why uranium, when initially complexed with citrate, did not maintain constant migration towards the anode was because the uranyl citrate complex dissociated in the presence of an electric field. The uranium sorbed and formed precipitates while the citrate ion continued its migration towards the anode. This aspect can be viewed as a benefit when one considers the fact that uranium migration ceased in the absence of a constant flux of citrate ligands. These results suggest that the cessation of the ligand flux though the system halted and immobilized uranium. Closed cell experiment results also showed that pH fronts will advance across the cell and therefore must be controlled in order to control the pH of the pore-water in the system.
The results of the open cell electrode system demonstrated that anionic complexing agents could be introduced into unsaturated soil in an in situ manner. Pore-water pH could be controlled at the electrode/solution interface by circulating the appropriate buffers through the electrodes. Furthermore, the electrode system allowed migration of ions in and out of the soil-water system so that electronueutrality conditions could be constantly maintained. Open cell results suggest that once a particular complex is formed, it will retain that form as long as sufficient complexant is available to sustain migration. It is possible that the lower pore-water pH conditions encountered by the uranyl citrate complexes in the closed cell experiments also had an effect on the dissociation rate of the uranyl citrate complexes.
The results of experiments using the various complexants demonstrated that uranium migration as well as other precipitated metal species requires the use of complexing agents which possess high formation constants in order to be mobilized. Formation constant data provides an indication of the ability of the ligand to form strong complexes even when the associated kinetic rates are unknown as long as the complexants being evaluated have similar chemical bonding properties (e.g., carboxyl groups).
Comparison of the use of citrate to carbonate as a complexing agent indicates that citrate is as good or maybe even superior to carbonate for removing uranium from soil using electrokinetics. Studies (Huang, 1996, and Dodge and Francis, 1994) indicate that the uranyl citrate species are biodegradable and therefore may have an advantage over uranyl carbonates. The fact that citrate is readily biodegradable may also pose problems in terms of citrate and uranyl citrate transport. The citrate may be biodegraded by the local microbial population during migration into the
48

contamination zone as well as the mobilization of the uranyl citrate species. Consequently, it may be necessary to force the bacterial population into a dormancy stage or disinfect the soil mass prior to and during remediation to prevent ligand and uranyl citrate complex biodegradation and biomass plugging of the soil column.
Although some success at removing uranium using acetate as a complexant was observed, acetate by virtue of the weak complexes that if forms with the uranyl ion is not an effective complexant for mobilizing and removing uranium from soil by electrokinetic transport. As noted, uranium was extracted at the cathode as well as the anode in the acetate catholyte experiment and soil analysis results showed migration of uranium both directions due to the formation of neutral, cationic, and anionic species. In a soil system rich in clays and other negatively charged substrate components, removal of any metal as a cationic species would be compromised,
Hanford waste experiments showed that competing elements such as magnesium, copper, and calcium will suppress uranium mobilization. However, synergistic benefits may be derived in terns of removal of other metal contaminants and radionuclides as demonstrated by the apparent simultaneous removal of copper and uranium from the Hanford waste.
Poor ligand utilization efficiency was observed in the uranium-contaminated sand experiments and even more pronounced in the Hanford waste experiments. The low ligand utilization efficiency was attributed to a large fraction of the complexing agent being transported through the soil without participating in the solubilization process. Increasing the ligand residence time by decreasing the applied voltage or modulating the current applied is expected to enhance ligand utilization. Research suggests that the current should be constantly applied initially to allow for optimal introduction of the ligand and removal of the most soluble uranium species. As the concentration in the electrode effluent decreases, the residence time should be increased to allow for dissolution of the less soluble species.
The system pH is the other operational parameter will affect metal solubilization. Studies by Dodge and Francis (1994) showed that uranium trioxide (as well as other uranium-oxide species in general) tends to be more soluble in the pH range of less than 4 and was relatively insoluble at pH ranges of 5.5 to 10.5. Increasing the acidity of the pore-water could result in decreasing the time required to mobilize and remove the uranium from certain soils. Lowering of the pH of the pore- water could easily be accomplished by not neutralizing the anode electrolysis reaction thereby allowing an abundance of hydrogen ions to enter the soil pore-water system.
49

5.0 REFERENCES
Acar, Y.B ., and A.N. Alshawabkeh, 1993, "Principles of Electrokinetic Remediation," Environ. Sci. Technol., 27, (13), 2638 - 2647.
Bibler, J.P., T.F. Meaker, A.B. Osteen, 1992, Electrokinetic Migration Studies on Removal of Chromium and Uranyl Ions from 904-A Trench Soil, Westinghouse Savannah River Company, Savannah River Technology Center, WSRC-RP-92- 1207; Savannah, GA.
Brainard, J.R., H.D. Iams, E.R. Brimbaum, B.A. Strietelmeier, and R.R. Ryan, 1993, "Selective Extractionhaching Approaches to Uranium Contamination in Soils: Progress Report," Removal of Uranium from Uranium-contaminated Soils: Phase I Bench Scale Testing; Oak Ridge National Laboratory, US. Department of Energy.
Buck, E.C., N.R. Brown, N.L. Dietz, 1996, "Contaminant Uranium Phases and Leaching at the Fernald Site in Ohio," Environ. Sci. Technol. 30,80-88.
Dodge, C.L., and A.J. Francis, 1994, "Photodegredation of Uranium-Citrate Complex with Uranium Recovery," Environmental Science and Technology, 28,1300- 1306.
Francis, C.W., A.J. Mattus, M.P. Elless, and M.E Timpson, 1993, 'I Carbonate- and Citrate- Based Leaching of Uranium from Uranium-Contaminated Soils," Removal of Uranium from Uranium-contaminated Soils: Phase 1 Bench Scale Testing; Oak Ridge National Laboratory, U.S. Department of Energy.
Huang, F., 1996, personal communication, New Mexico Institute of Mining and Technology.
Jury, W.A., W.R. Gardner, and W.H. Gardner, 1991, Soil Physics, John Wiley and Sons, NY; pp 87 -1 10.
Lageman, R., 1989, "Theory and Practice of Electro-Reclamation," in Forum on Innovative Hazardous Waste Treatment Technologies, Atlanta, Georgia, June 19-21 , 1989; United States Environmental Protection Agency, Office of Research and Development, EPA/540/2-89/056.
Lindgren, E.R., 1996, Sandia National Laboratories, personal communication.
Lindgren, E.R. and E.D. Mattson 1995, U.S. Patent No.5435895, July 1995.
Lindgren, E.R., R.R. Rao, and B.A. Finlayson, (1995), "Numerical Simulation of Electrokinetic Phenomena," in Emerging Technologies in Hazardous Waste Management IV, D.W. Tedder and F.G. Pohland (eds.); I&EC Special Symposium, ACS Symposium Series,
50

Atlanta, GAY 1993,49-62.
Lindgren, E.R., E.D. Mattson, and M.W. Kozak, 1994, "Electrokinetic Remediation of Contaminated Soils," in Emerging Technologies in Hazardous Waste Management N, D.W. Tedder and F.G. Pohland (eds.); I&EC Special Symposium, Atlanta, GA, 1992.
Mattson, E.D and E.R. Lindgren, 1995, "Electrokinetic Extraction of Chromate from Unsaturated Soils," in Emerging Technologies in Hazardous Waste Management IVY D.W. Tedder and F.G. Pohland (eds.); IE&C Special Symposium, ACS Symposium Series, Atlanta GA.
ORNL, see Oak Ridge National Laboratory
Oak Ridge National Laboratory, 1993, "Removal of Uranium from Uranium-Contaminated Soils, Phase I: Bench-Scale Testing," ORNL-6762, Oak Ridge National Laboratory, Oak Ridge Tennessee.
Pamukcu, S. and J.K. Wittle, 1992, "Electrokinetics for Removal of Low-Level Radioactivity from Soil", Conference Proceedings, Fourteenth Annual U.S. Department of Energy Low-Level Radioactive Waste Management Conference, pp. 256-278.
Probstein, R.E., and R.E. Hicks, 1993, "Removal of Contaminants from Soils by Electric Fields," Science, 260,498.
Runnels, D.L., and J.L. Larson, 1986, "A Laboratory Study of Electromigration as a possible Field Technique for the Removal of Contaminants from Groundwater," Groundwater Monitoring Review, Summer 1986, 88-91
Shapiro, A.P., P.C. Renaud, and R.F. Probstein, 1989, I t Preliminary Studies on the Removal of Chemical Species from Saturated Porous Media by Electroosmosis, PhysicoChemical Hydrodynamics 11,56,785-802
Siegal, M.D., D.B. Ward, C.R. Bryan, W.C. Cheng, 1995, Characterization of Materials for a Reactive Transport Model Validation Experiment, Sand94-0 189, Sandia National Laboratories, Albuquerque, NM.
U.S. Department of Energy (DOE), 1992; Report No. DOE/RL-92-43, Rev. 0.
Wong, J.S.H, R. E. Hicks, and R.F. Probstein, 1995, "EDTA-Enhanced Electroremediation of Metal Contaminated Soils," Preprint; Journal of Hazardous Materials.
51

Distribution:
10
3
MS 0719 E. R. Lindgren, 6621
MS 0750 P. V. Brady, 6118
MS 0188 C. E. Meyers, 4523
MS 0750 H. R. Westrich, 6118
MS 9018 Central Technical Files, 8940-2
MS OS99 Technical Library, 4414
MS 0619 Review and Approval Desk, 12690 For DOE/OST I
52