stabilization of red clay soil using natural gravel …
TRANSCRIPT

PERFORMANCE OF RED SOIL STABILIZED WITH
GRAVEL AND LIME IN CONSTRUCTION OF LOW-
VOLUME ROADS IN NYERI COUNTY, KENYA
GODFREY NJIHIA HINGA
MASTER OF SCIENCE
(Civil Engineering)
JOMO KENYATTA UNIVERSITY OF
AGRICULTURE AND TECHNOLOGY
2021


Performance of Red Soil Stabilized with Gravel and Lime in
Construction of Low-Volume Roads in Nyeri County, Kenya
Godfrey Njihia Hinga
A Thesis Submitted in Partial Fulfillment of the Requirements
for the Degree of Master of Science in Civil Engineering of the
Jomo Kenyatta University of Agriculture and Technology
2021

ii
DECLARATION
This thesis is my original work and has not been presented for a degree in any other
University.
Signature ………………………………….. Date ………………………...
Godfrey Njihia Hinga
This thesis has been submitted for examination with our approval as the university
supervisors.
Signature ………………………………….. Date ………………………...
Prof. Eng. Geoffrey N. Mang’uriu, PhD
JKUAT, Kenya
Signature ………………………………….. Date ………………………...
Dr. Eng. Charles K. Kabubo, PhD
JKUAT, Kenya

iii
DEDICATION
This work is dedicated to the memory of Mr and Mrs John Hinga Ikenye
for their tender love and inspiration as my parents.
Educating the mind without educating the heart is no education – Aristotle

iv
ACKNOWLEDGEMENT
The author would like to express the deepest and heartily gratitude to his thesis
supervisors Prof. (Eng.) Geoffrey N. Mang’uriu and Dr. (Eng.) Charles K. Kabubo
for their time in giving detailed advice, invaluable comments and generous guidance
towards the progress of this study.
The author is also deeply grateful to the chairs of Department of Civil, Construction
and Environmental Engineering during the research period, Ms. P.M. Kibetu, Dr.
(Eng) J.K Kiptala and Dr. (Eng) CK Cheruiyot, for their support and kind words of
encouragement. A particular debt of gratitude is owed to the former Dean of SCEGE,
Prof. Zachary Abiero-Gariy, for having maintained a keen eye towards the successful
completion of this thesis.
The author also wishes to acknowledge many institutions and individuals for the
valuable assistance and support given. Institutions that deserve mention include
JKUAT, ICRAF, and Department of Mines and Geology all in Nairobi, as well as the
Materials Testing Laboratories in Nyeri for use of their resources. In particular, the
author would like to express his indebtedness and gratitude to all staff in the
Department of Civil Engineering, JKUAT who cheerfully offered many helpful
suggestions during this study. The author also extends his heartily thanks to Mr.
B.M. Ngula for his invaluable contribution in skillfully generating some of the
graphic illustrations used in this thesis.
This acknowledgement would be incomplete without registering my special and
sincere thanks to my wife Purity and our children for their steady love and
unwavering support during the entire period of study.

v
TABLE OF CONTENTS
DECLARATION ...................................................................................................... ii
DEDICATION ......................................................................................................... iii
ACKNOWLEDGEMENT ...................................................................................... iv
TABLE OF CONTENTS ......................................................................................... v
LIST OF TABLES .................................................................................................. ix
LIST OF FIGURES ................................................................................................. x
LIST OF PLATES ................................................................................................. xii
LIST OF APPENDICES ...................................................................................... xiii
LIST OF ABBREVIATIONS, ACRONYMS AND SYMBOLS ....................... xiv
DEFINITION OF TERMS ................................................................................. xviii
ABSTRACT ........................................................................................................... xix
CHAPTER ONE ...................................................................................................... 1
INTRODUCTION .................................................................................................... 1
1.1 Background to the Study ..................................................................................... 1
1.2 Statement of the Problem .................................................................................... 3
1.3 Research Objectives ............................................................................................ 4
1.3.1 General Objective........................................................................................ 4
1.3.2 Specific Objectives...................................................................................... 4
1.4 Research Questions ............................................................................................. 5
1.5 Justification of the Study ..................................................................................... 5
1.6 Scope and Limitations of Research ..................................................................... 7
1.6.1 Scope ........................................................................................................... 7

vi
1.6.2 Limitations .................................................................................................. 8
CHAPTER TWO ...................................................................................................... 9
LITERATURE REVIEW ........................................................................................ 9
2.1 Hierarchy and Structure of Road Pavements ....................................................... 9
2.2 The Study Area .................................................................................................. 12
2.2.1 Location, Topography and Climate ........................................................... 12
2.2.2 Geology ..................................................................................................... 14
2.2.3 Settlement, Land Use and Natural Resources ........................................... 16
2.2.4 Economy and Transport ............................................................................ 17
2.3 Empirical Review on Properties of Red Soil, Natural Gravel and Lime ........... 18
2.3.1 Red Soil .......................................................................................................... 18
2.3.2 Natural Gravel ................................................................................................ 22
2.3.3 Lime .......................................................................................................... 26
2.4 Soil Stabilization................................................................................................ 29
2.4.1 History of Soil Stabilization ...................................................................... 30
2.4.2 Methods of Soil Stabilization .................................................................... 32
2.4.3 Selection of Method and Stabilizer ........................................................... 38
2.4.4 Compaction ............................................................................................... 39
2.5 Material Testing ................................................................................................. 41
2.5.1 Soil Mineralogy ......................................................................................... 43
2.5.2 Lime .......................................................................................................... 45

vii
2.5.3 Strength Tests ............................................................................................ 48
2.6 Summary of Empirical Review ......................................................................... 52
2.7 Theoretical Review of Past Studies on Red Clay Soil ...................................... 53
2.8 Research Gap ..................................................................................................... 56
2.9 Conceptual Framework ..................................................................................... 58
CHAPTER THREE ............................................................................................... 60
MATERIALS AND METHODS .......................................................................... 60
3.1 Research Design ................................................................................................ 60
3.2 Materials Acquisition and Preparation .............................................................. 61
3.3 Materials Physical and Chemical Characteristics.............................................. 61
3.3.1 Visual Examination ................................................................................... 61
3.3.2 Laboratory Tests........................................................................................ 62
3.4 Materials Compaction Characteristics ............................................................... 70
3.4.1 Materials .................................................................................................... 70
3.4.2 Laboratory Tests........................................................................................ 70
3.5 Materials Strength ............................................................................................. 72
3.5.1 Materials .................................................................................................... 72
3.5.2 Strength Tests ............................................................................................ 72
CHAPTER FOUR .................................................................................................. 76
RESULTS AND DISCUSSION ............................................................................ 76
4.1 Material Properties of Red Soil-Gravel-Lime Admixtures ............................... 76

viii
4.1.1 Field Observations ..................................................................................... 76
4.1.2 Physical Properties .................................................................................... 77
4.1.3 Soil Classification ..................................................................................... 90
4.2 Compaction Characteristics of Red Soil-Gravel-Lime Admixtures .................. 93
4.2.1 Standard and Modified Compaction ......................................................... 93
4.2.2 Lime Demand ............................................................................................ 95
4.3 Strength of Red Soil-Gravel-Lime Admixtures................................................. 96
4.3.1 Aggregate Crushing and Impact Values .................................................... 96
4.3.2 California Bearing Ratio ........................................................................... 97
CHAPTER FIVE .................................................................................................. 103
CONCLUSIONS AND RECOMMENDATIONS ............................................. 103
5.1 CONCLUSIONS ............................................................................................. 103
1) Material Properties ....................................................................................... 103
2) Compaction Characteristics ......................................................................... 103
3) Material Strength ......................................................................................... 104
4) General Conclusion ...................................................................................... 104
5.2 RECOMMENDATIONS................................................................................. 104
REFERENCES ..................................................................................................... 106
APPENDICES ...................................................................................................... 117

ix
LIST OF TABLES
Table 2.1: Chemical and mineralogical composition of Nyeri red clay soil ............. 21
Table 2.2: Chemical composition of two volcanic rocks from Nyeri ....................... 24
Table 2.3: Natural gravel guidelines for subbase and base ....................................... 25
Table 2.4: Guidelines for gravel plasticity characteristics ........................................ 25
Table 2.5: Typical characteristics of some clay minerals ......................................... 44
Table 4.1: Results for consistency limits and initial lime demand ........................... 81
Table 4.2: Clay activity and relationship with clay minerals and free swell ............ 85
Table 4.3: Chemical composition of the red soil, gravel and hydrated lime............. 87
Table 4.4: XRD results for the red soil ..................................................................... 89
Table 4.5: Mechanical properties of natural gravel................................................... 96
Table 4.6: Material mix proportions for different road pavement layers ................ 101
Table A7.1: Unified Soil Classification System (USCS) ........................................ 117
Table A7.2: AASHTO Soil Classification System ................................................. 118
Table A7.3: Basic characteristics of red soil and natural gravel ............................. 118
Table A7.4: Chemical composition of research materials ...................................... 120
Table A7.5: Complete mineralogical analysis data on red soil ............................... 120
Table A7.6: Potential volume change of soils by plasticity and climate ................ 122
Table A7.7: Subgrade Beaing Strength Classes and Elastic modulus .................... 122
Table A7.8: Summary of laboratory results for soil admixtures ............................. 123
Table A7.9: Density and bearing strength of natural materials ............................. 123
Table A7.10: Summarized Rating for Properties of Research Materials ................ 124
Table A7.11: Summary of Material Properties for Subbase ................................... 125

x
LIST OF FIGURES
Figure 1.1: Coverage in different types of road surfaces in Nyeri County ................. 6
Figure 2.1: Characteristics of different classes of roads ............................................. 9
Figure 2.2: Typical section through a road pavement ............................................... 11
Figure 2.3: Location of Nyeri County on the global, regional and national map ..... 12
Figure 2.4: Topographic map of Nyeri County with administrative boundaries ...... 12
Figure 2.5: Geological map of Nyeri County ............................................................ 15
Figure 2.6: Soil map of Nyeri County ....................................................................... 15
Figure 2.7: Water availability per capita in Tana Basin, Kenya ............................... 17
Figure 2.8: Global distribution of red soils ............................................................... 19
Figure 2.9: Generalized composition of common igneous rocks .............................. 23
Figure 2.10: Schematic lime manufacturing process ................................................ 27
Figure 2.11: Guideline to select suitable method of soil stabilization ...................... 38
Figure 2.12: Effect of lime on compaction characteristics ....................................... 40
Figure 2.13: Common soil description systems based on particle size ..................... 43
Figure 2.14: Conventional plasticity locating some tropical residual soils .............. 45
Figure 2.15: Plasticity method for determining initial lime content ......................... 47
Figure 2.16: CBR thickness design chart for a granular road pavement .................. 50
Figure 2.17: Schematic distribution of traffic load through road pavement ............. 51
Figure 2.18: Conceptual framework for the study .................................................... 59
Figure 3.1: Research Design Framework .................................................................. 60
Figure 3.2: Sieve stacking and hydrometer set for soil grain size analyses .............. 64
Figure 3.3: Fall cone penetrometer for liquid limit test ............................................ 66
Figure 3.4: Schematic illustration of linear shrinkage mold ..................................... 67

xi
Figure 3.5: Apparatus for and standard method of compaction ................................ 71
Figure 3.6: Schematic illustration of CBR soaking assembly .................................. 74
Figure 3.7: Schematic illustration of CBR test assembly ......................................... 75
Figure 4.1: Variation in specific gravity with addition of gravel and lime ............... 78
Figure 4.2: Combined grading curves for red soil and gravel .................................. 80
Figure 4.3: Variation in PI with gravel and lime stabilizers ..................................... 83
Figure 4.4: Variation in colloidal activity of natural soil and gravel admixtures ..... 85
Figure 4.5: Variation in free swell index with gravel content and lime.................... 86
Figure 4.6: Typical plasticity chart ........................................................................... 91
Figure 4.7: Plotting of soil admixtures on the plasticity chart .................................. 92
Figure 4.8: Location of common clay minerals on plasticity chart .......................... 92
Figure 4.9: Variation in MDD and OMC of soil admixtures with gravel and lime .. 93
Figure 4.10: Variation in demand for hydrated lime with gravel content ................. 96
Figure 4.11: CBR values for neat and lime-treated soil admixtures ......................... 98
Figure 4.12: Swelling factor for different soil admixtures........................................ 99
Figure A7.1: Plotting of natural gravel in grading envelopes for aggregates ......... 119
Figure A7.2: The XRD diffractogram for the red soil ............................................ 121
Figure A7.3: Feldspar composition diagram .......................................................... 121
Figure A7.4: Improvement in soil plasticity with stabilization method ................. 126
Figure A7.5: Gain in CBR with stabilization method ............................................. 126

xii
LIST OF PLATES
Plate 1.1: Bad condition of a rural road in Nyeri County during wet season .............. 3
Plate 2.1: Elevation map of Nyeri County viewed from the south ............................ 13
Plate 2.2: Intensive land use near Karatina Town in Nyeri County .......................... 16
Plate 3.1: The AIV testing machine .......................................................................... 73

xiii
LIST OF APPENDICES
Appendix I: Soil Description and Classification .................................................... 117
Appendix II: Chemical and Mineralogical Composition ....................................... 120
Appendix III: Established Material Properties ....................................................... 122
Appendix IV: Summarized Laboratory Results and Quality of Materials ............. 123
Appendix V: Stabilization Effect on Soil Plasticity and CBR ................................ 126

xiv
LIST OF ABBREVIATIONS, ACRONYMS AND SYMBOLS
AASHTO American Association of State Highway and Transport Officials
ACV Aggregate Crushing Value
AFCAP African Community Access Program
AfDB African Development Bank
AICD Africa Infrastructure Country Diagnostic
AIV Aggregate Impact Value
Al2O3 Alumina as Aluminium Oxide
ARM Athi River Mining Cement Limited
ARRB Australian Road Research Board
ASTM American Society for Testing and Materials
AustStab Australian Stabilization Industry Association
BLA British Lime Association
BSI British Standards Institution
CaCO3 Limestone as Calcium Carbonate
CAH Calcium Aluminate Hydrates
CaO Quicklime as Calcium Oxide
Ca(OH)2 Hydrated Lime as Calcium Hydroxide
CBR California Bearing Ratio
CEC Cation Exchange Capacity
CKD Cement Kiln Dust
CL High Calcium Lime
cm; cm3 Centimeter; Cubic centimeter

xv
CO2 Carbon Dioxide
CSH Calcium Silicate Hydrates
DoFEP Department of Finance and Economic Planning
DTA Differential Thermal Analysis
ESA Equivalent Standard Axles
g; Mg; kg Gram; Megagram; Kilogram
gTKP Global Transport Knowledge Partnership
ICL Initial Consumption of Lime
ICRAF International Centre for Research in Agro-Forestry
ILO International Labor Organization
ISRIC International Soil Reference and Information Centre
JKUAT Jomo Kenyatta University of Agriculture and Technology
KIPPRA Kenya Institute for Public Policy Research and Analysis
km; km2 Kilometer; Square kilometer
kN Kilonewton
KNBS Kenya National Bureau of Statistics
L Liter
LKD Lime Kiln Dust
LAA Los Angeles Abrasion
LVRs Low Volume Roads
LVSRs Low Volume Sealed Roads
m; m3 Meter; Cubic meter
MDGs Millennium Development Goals

xvi
MgCO3 Dolomite as Magnesium Carbonate
MgO Magnesium Oxide
MPa Mega Pascals
MoPND Ministry of Planning and National Development
MoRPW Ministry of Roads and Public Works
MoT Ministry of Transport
MoTC Ministry of Transport and Communications
MoTI Ministry of Transport and Infrastructure
MoWTC Ministry of Works, Transport and Communication
NCHRP National Cooperative Highway Research Program
NLA National Lime Association
NMT Non-Motorized Traffic
NNW North-North West
PI Plasticity Index
ppm Parts per million
PVC Polyvinyl Chloride
RAI Rural Access Index
RGN Natural Red Soil and Gravel Admixture
RGT Lime-treated Red Soil and Gravel Admixture
R2000 Roads 2000 Strategic Plan
SDGs Sustainable Development Goals
SiO2 Silica as Silicon Dioxide
S-S Silica-Sesquioxide ratio

xvii
SSA Sub-Saharan Africa
SSE South-South East
TRL Transport Research Laboratories
UCS Unconfined Compressive Strength
UK United Kingdom
UN United Nations
USA United States of America
USAID United States Agency for International Development
USCS Unified Soil Classification System
VPD Vehicles Per Day
XRD X-Ray Diffraction
XRF X-Ray Fluorescence
WRMA Water Resources Management Authority
µm; mm Micrometer; Millimeter
% Percentage

xviii
DEFINITION OF TERMS
Basic Access A minimum level of rural access required as a human right to
sustain socio-economic activity.
Blending A form of soil stabilization that give an acceptable granular
mixture out of careful proportioning of at least two soils.
Earth Road Also known as engineered natural surface, it is a road built
from the natural soil available along the road.
Natural Gravel Weathered rock existing naturally as mixture of stone, sand
and fines that is used for surfacing and construction of Low
Volume Sealed Roads (LVSRs).
Isolation The lack of accessibility (that is, need for travel relative to
time and cost) and a major characteristic of poverty.
Land Degradation The slow but cumulative loss of productivity and ecosystem
function of land with long lasting impacts on the people.
Low Volume Roads Roads carrying up to 300 vehicles per day or less than one
million Equivalent Standard Axles (ESA) in their design life.
MDGs The broad-based Millennium Development Goals, now
Sustainable Development Goals (SDGs), that fall under the
United Nations (UN) initiatives for improved human welfare.
Rural Access Index Also known as RAI, it is an economic indicator representing
the proportion of rural population within 2 km or walking
distance of 20-25 minutes to an all-weather road.
Resilient Modulus Also known as subgrade modulus that represents stress and
strain relationship of a soil, it is a measure of resistance to
permanent road deformation under repeated traffic loading.
Soil stabilization Alteration of some soil properties to create an improved soil
material possessing the desired strength and other properties.
Subgrade Usually the native soil that acts as the foundation to a road
pavement and is overlain by the protective Subbase and Base
as the secondary and primary load-spreading layers.
Whole-life costs A decision-making tool that assesses all cost savings or
benefits to the society by a road during its design lifetime.

xix
ABSTRACT
Red clay soil is abundant in Kenya’s central highlands but is often regarded a poor
road construction material. The objective of this study was to stabilize red clay soil
using natural gravel and hydrated lime to generate an efficient, affordable and
sustainable material for construction of low volume road in Nyeri County. The soil
was blended with natural gravel at 20% increments varying from 0 to 100% to give
six soil-gravel admixtures. A predetermined amount of hydrated lime was also added
to each of the six admixtures. The soil, gravel and lime were subjected to advanced
mineralogical and chemical analytical methods, which showed that red soil and
gravel consisted mainly of silica at 40.7 and 50.8% respectively while hydrated lime
consisted of 72.5% calcium oxide. Kaolinite was also the predominant clay mineral
in red soil. The gravel classified as stone Class A after testing for toughness. Three
test specimens were prepared and tested in all cases according to applicable standard
testing procedures for particle size, specific gravity, consistency limits, activity, free
swell, compaction, and California Bearing Ratio (CBR). Both red soil and natural
gravel were well-graded according to particle size and classified as laterite soil and
lateritic gravel after silica-sesquioxides ratio analyses. Specific gravity dropped
marginally for all soil admixtures with increasing gravel content and with addition of
lime. Hydrated lime content varied with gravel content from 4.7 to 2.2% that further
decreased consistency limits. Red soil had 74.3 % liquid limit and 30.1% plasticity
index, and differed from natural gravel with a margin of 36.4% liquid limit, 22.8%
plastic limit, 23.5% plasticity index, and 12.4% linear shrinkage. Free swell index
ranged between 0 and 6.3% for all admixtures but with a peak of 12.7% in soil-
gravel-lime admixtures. All admixtures compacted fairly well and maximum dry
density increased by 744 kg/m3 while optimum moisture content decreased by 22.4%
with increasing gravel content in red soil. Similarly, the corresponding soaked CBR
rose by 121.7% and swelling factor dropped marginally by 0.55%. Red soil classified
as MH and A-7-5 after Unified Soil Classification System (USCS) and American
Association of State Highway and Transport Officials (AASHTO) system, and as
subgrade class S3. The respective classification of natural gravel was GW and A-2-7.
The study successfully yielded optimal mixes applicable for most paved roads. This comprised about 80% red soil, 16% gravel and 4% lime for improved subgrade, and 32%
red soil, 65% gravel and 3% lime for subbase of low volume sealed roads (LVSRs).


1
CHAPTER ONE
INTRODUCTION
1.1 Background to the Study
For as long as the human race has existed, there has been movement of people and
goods (or freight) from one location to another by means of trails, road, rail, water
and air. The birth of modern road is unknown since it is lost in what O’Flaherty
(1997) calls ‘the mists of antiquity’. However, the ancient Romans are credited with
building of the first elaborate road system; this fell into decay and disuse after
collapse of the vast empire due to lack of technology and will by the local peoples
(Holt, 2010; Wignall et al., 1999). Today, the industrialized countries have dense and
well developed road networks while those in most developing countries are sparse
and least developed. The extent and condition of road networks in developing
countries is largely a reflection of their past colonial history and small economic
capacity. Additionally, the physical condition of road transport network in a country is
critical since this dictates to the level of its national economic development and the
standard of living for her population. Nevertheless, road transport dominates in
developing countries and carries 80-90 percent of passenger and freight in the Sub-
Saharan Africa (SSA) and 93% in Kenya; it also supplements the fragmentary
railway system and the geographically hindered inland water transport (Jjuuko et al.,
2014; Mwaipungu & Allopi, 2014; Ministry of Transport [MoT], 2009).
There are different categories of roads but Low-Volume Roads (LVRs) comprise the
greater part of public roads and account for nearly 30 million kilometers or about
60% of the road network globally, over 70% in the SSA and 80% in Kenya
(Kamtchueng et al., 2015; Cook et al., 2013; Greening & O’Neill, 2010; Sogomo,
2010). In effect, LVRs are of low social and geographical reach and include tracks
and narrow unpaved rural roads that provide the last link of transport network
worldwide (Faiz, 2012; Foster & Briceño-Garmendia, 2010; Johannessen, 2008).
LVRs substantially hinder movement of the little and light traffic that they carry but
remain the only means of access and lifelines that inevitably sustain large rural

2
population in developing countries, mankind and the world economy (Fukubayashi
& Kimura, 2017; Faiz, 2012; Gwilliam et al., 2011). Besides transport, the LVRs
uniquely transcend, culture, topography, climate and language to play a critical role
in disaster management, peace building and political integration of a country (Faiz,
2012). They are also instrumental in realization of the United Nations (UN)
Sustainable Development Goals (SDGs) and national initiatives that guide global and
national action on sustainable development. Kenya’s socio-economic blueprint known
as ‘Vision 2030’ is a good example that focuses on poverty reduction, rural
development, and on a clean and safe environment for a high quality of life to citizens.
In tropical areas like Kenya, over 65% of the population live in rural areas and
depend heavily on rural roads for transport and on agriculture for subsistence and
economic gain (Cook et al., 2013; MoT, 2009; Lennox & Mackenzie, 2008). In this
regard, agricultural development is often the main objective of rural access road
improvements. However, conventional road construction depends largely on
quarrying of soils as the primary construction materials, but these are scarce non-
renewable resources. Additionally, paved roads are expensive to construct and not
justifiable on LVRs where good soils are scarce, not available close to the road or
depleted (Ejeta et al., 2017; Roughton, 2016; Johannessen, 2008). This is usually the
case in mountainous areas where the process of soil stabilization has been developed
primarily to economically improve the properties of poor local that replace the
difficult to obtain good soils. The process itself may sometimes be least understood
but is employed to tap on a wealth of benefits in environment and in material use and
cost (Holt, 2010; Wilmot, 2006; Cook et al., 2001; Wignall et al., 1999). Most of
Kenya is covered by residual soils which are often red clays that are generally poor
as road construction materials (Rolt, 1979; Foss, 1973). It was on this background
that the highly mountainous but agriculturally-productive and densely populated
Nyeri County on the equator in central Kenya was selected as a representative study
area for stabilization of the naturally abundant red clay soil.

3
1.2 Statement of the Problem
Rural transport networks in most developing countries are sparse, underdeveloped
and of poor quality by international standards whereby about 85% of the low-volume
roads in the SSA and about 50% in Kenya are estimated to be in poor condition
(Kamtchueng et al., 2015; Foster & Briceño-Garmendia, 2010; MoT, 2009). Thus,
majority of the rural roads are old unsealed earth and gravel roads that account for
about 60% of classified road networks globally, over 90% in the SSA and about 96%
in Kenya (Johannessen, 2008; Lebo & Schelling, 2001; Wasike, 2001). This leaves
about 3 billion people globally without safe, reliable, and sustainable all-weather
access to basic services, markets, and economic opportunities (Faiz, 2012; Gwilliam
et al., 2011). According to the Department of Finance and Economic Planning
[DoFEP] (2018), Ejeta et al. (2017) and Muturi (2015), the situation is no better in
Nyeri County where about 15% of rural roads are paved and 85% are unpaved gravel
and earth roads. This situation leaves about 91% of the population in the County with
no access to paved all-weather roads (DoFEP, 2013; Elsharief et al., 2013). Worse
still, the unpaved rural roads often become impassable during rainy season, as
demonstrated in Plate 1.1, leading to great economic loss as the rural population and
farm produce cannot reach public utilities and markets, respectively.
Plate 1.1: Bad condition of a rural road in Nyeri County during wet season
(Source: The Star, 13 November 2014)

4
Provision of paved roads generally remains a mirage in many developing countries
because they are expensive to construct and maintain, and hence often difficult to
justify on LVRs that give very small economic returns (Roughton, 2016; African
Development Bank [AfDB], 2011). Road construction cost has technological and
environmental drivers but Johannessen (2008) and O’Flaherty (2002) singled out
materials as the principal factor, taking about 70% of total cost especially where
suitable local materials are scarce or not in close proximity to the road. Further, most
design standards, which are foreign origin, preclude use of local materials considered
to be inferior or troublesome in pavement construction (Collier et al., 2013; Cook et
al., 2013). Such conditions advocates for use of good borrow materials which is
expensive due to hauling over long distances. In Nyeri County, engineers encounter
the challenges of weak and inherently variable subgrade provided by the fertile and
soft red soil coupled with scarcity of suitable natural gravels to replace the poor soils
(DoFEP, 2013; Vorobrieff & Murphy, 2003).
O’Flaherty (2002) quipped that road designers and builders in countries now only
experiencing the pleasures and problems associated with the motor age have very
great challenges and opportunities! Most developing countries are now in this age
where one of the basic and essential challenges for road engineers is to find good and
affordable engineering solutions to the provision and maintenance of LVRs
(Johannessen, 2008; Petts et al., 2006). Thus, the potential of optimizing use of red
clay soil stabilized with natural gravel and hydrated lime in paving of LVRs was
explored in this study expected to help overcome this challenge in Nyeri County.
1.3 Research Objectives
1.3.1 General Objective
To evaluate the suitability of stabilizing red clay soil with natural gravel and
hydrated lime as a construction material for subgrade and sub-base of low-volume
roads in Kenya’s Nyeri County.
1.3.2 Specific Objectives
1) To determine the chemical and physical properties of red soil, natural gravel,
hydrated lime, and their admixtures.

5
2) To evaluate the compaction characteristics of red soil-gravel-lime admixtures.
3) To establish the bearing strength of red soil-gravel-lime admixtures as
pavement construction materials for lightly trafficked rural roads.
1.4 Research Questions
1) What are the properties of red clay soil, natural gravel, and hydrated lime?
2) What are the compaction characteristics of the red soil-gravel-lime
admixtures?
3) What is the bearing strength of compacted soil-gravel-lime admixtures as
road as road construction material?
1.5 Justification of the Study
Highway engineers have strived continuously to produce better roads at lower costs,
a feat that is successfully achieved by stabilization of locally available soils. This
study promoted the efficient use of local red clay soils in an affordable and
sustainable construction of LVRs (Cocks et al., 2015; Wilmot, 2006; O’Flaherty,
2002). This comes at a time when natural gravel is fast getting depleted and end to
the age of graveling earth roads beckons in Nyeri County and the larger central
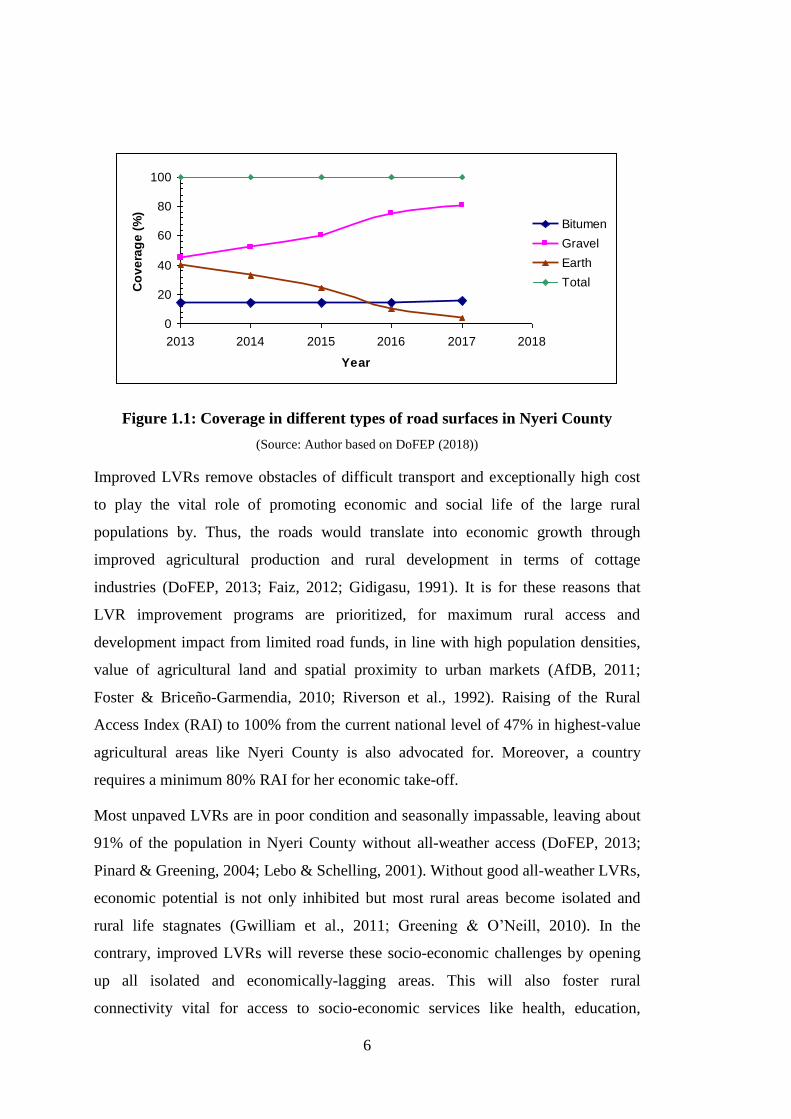
Kenya (DoFEP, 2018; Cook et al., 2013). As Figure 1.1 illustrates, there has been
massive graveling of earth roads to about 81% but at the expense of 15% paved
roads. In spite of this commendable achievement, gravel roads worldwide also take
an enormous share of available resources to maintain and eventually become more
expensive than paved roads (Petts et al., 2006; Rolt, 1979). In effect, all the county
governments in central Kenya should brace themselves for the inevitable question
asked many road agencies of when to start paving the gravel roads (Faiz et al., 2012;
Lennox & Mackenzie, 2008; Skorseth & Selim, 2000). The decision to seal a road is
a matter of trade-offs and the county governments should have courage and take an
objective look at the long-term benefits of lower whole-life costs of sealed roads
(Roughton, 2016; Mwaipungu & Allopi, 2014; Collier et al., 2013; AfDB, 2011;
Gwilliam et al., 2011).
6
Figure 1.1: Coverage in different types of road surfaces in Nyeri County
(Source: Author based on DoFEP (2018))
Improved LVRs remove obstacles of difficult transport and exceptionally high cost
to play the vital role of promoting economic and social life of the large rural
populations by. Thus, the roads would translate into economic growth through
improved agricultural production and rural development in terms of cottage
industries (DoFEP, 2013; Faiz, 2012; Gidigasu, 1991). It is for these reasons that
LVR improvement programs are prioritized, for maximum rural access and
development impact from limited road funds, in line with high population densities,
value of agricultural land and spatial proximity to urban markets (AfDB, 2011;
Foster & Briceño-Garmendia, 2010; Riverson et al., 1992). Raising of the Rural
Access Index (RAI) to 100% from the current national level of 47% in highest-value
agricultural areas like Nyeri County is also advocated for. Moreover, a country
requires a minimum 80% RAI for her economic take-off.
Most unpaved LVRs are in poor condition and seasonally impassable, leaving about
91% of the population in Nyeri County without all-weather access (DoFEP, 2013;
Pinard & Greening, 2004; Lebo & Schelling, 2001). Without good all-weather LVRs,
economic potential is not only inhibited but most rural areas become isolated and
rural life stagnates (Gwilliam et al., 2011; Greening & O’Neill, 2010). In the
contrary, improved LVRs will reverse these socio-economic challenges by opening
up all isolated and economically-lagging areas. This will also foster rural
connectivity vital for access to socio-economic services like health, education,
0
20
40
60
80
100
2013 2014 2015 2016 2017 2018
Year
Co
ve
rag
e (
%)
Bitumen
Gravel
Earth
Total

7
amenities and markets (Cook et al., 2013; Faiz, 2012; Petts et al., 2006). The roads
will also remove social isolation essential for poverty reduction as envisaged by the
universal Millenium Development Goals (MDGs), now SDGs. To attain substantial
poverty reduction, and hence achieve all the MDGs, in lowering high levels of
hunger, disease, illiteracy and unemployment, a country should have a minimum 7%
national economic growth (Foster & Briceño-Garmendia, 2010).
According to DoFEP (2013), Nyeri County is endowed with natural resources where
2.3 million tones of murram/gravel are mined per year for road construction and
maintenance. However, the widespread use of gravel in unpaved roads pose health,
safety and environmental hazards to natural habitats adjacent to the road corridors
(Ejeta et al., 2017; Jawad et al., 2014; Lennox & Mackenzie, 2008). As envisaged in
Kenya’s Roads 2000 Strategic Plan [R2000], this study aimed at ensuring optimum
utilization of the locally available red soil and gravel in construction of stronger LVR
pavements capable of carrying the ever increasing size, load and number of modern
vehicles (Fukubayashi & Kimura, 2017; Cocks et al., 2015; Greening & O’Neill,
2010; Wilmot, 2006). This would save on the environment, on public funding and
even foreign exchange and hence the urgency to provide efficient, affordable and
sustainable LVR network in Nyeri County.
1.6 Scope and Limitations of Research
1.6.1 Scope
This study investigated the improvement of red soil using natural gravel and
hydrated lime. The red soil and natural gravel were collected from Othaya and
Nyaribo in Nyeri County, some 13 km and 10km by road to the south and north of
Nyeri Town respectively. A commercial grade hydrated lime suitable for soil
stabilization, as recommended by the manufacturer, was obtained from a stockist
over the counter. Soils in general are completely different in different locations and
hence the red clay soil and natural gravel from the Kenya Highlands were taken to be
representative of similar materials found elsewhere. The hydrated lime was also
expected to meet universal manufacturing standards.

8
As an experimental study, select laboratory tests were conducted to determine
properties of the red soil, natural gravel and hydrated lime, and also as a measure of
their combined soundness and functionality in soil stabilization. Secondary data was
also gathered for the purpose of relating laboratory results with the existing body of
knowledge. Most of the data was used to establish the optimal stabilized mixes for
improved subgrade and subbase of an LVR pavement.
1.6.2 Limitations
The published laboratory data was limited to the research materials but the findings
could be applicable to other materials of similar properties. Further, the study was
limited to construction of a sealed LVR but the results could be of benefit not only to
engineered earth and gravel roads but also to paved roads of a higher category.
However, the soundness of these materials was limited to short soaking periods of 4
and 7 days without prolonged exposure to the weather elements.

9
CHAPTER TWO
LITERATURE REVIEW
2.1 Hierarchy and Structure of Road Pavements
i) Hierarchy
According to Wasike (2001), roads are usually put into three functional classes,
namely:
i) Primary roads for mobility and serve as the main national linkages to capital
city, airports, the sea, and other countries,
ii) Secondary roads for both mobility and access, connecting regions within the
country as departmental, provincial or regional roads, and
iii) Tertiary roads mainly for access and connect towns within one province or
region as municipal/urban or local/rural roads. Figure 2.1 summarizes the
attributes of different classes of roads.
Figure 2.1: Characteristics of different classes of roads
(Source: Lebo and Schelling, 2001)
This study focused on rural roads which are also variously known as district/county
roads, local government roads, feeder roads and access roads (Nwachukwu, 2013;

10
Lebo & Schelling, 2001). As roads of low value, they are designed with very little
financial and scientific input, and are constructed from the nearest available materials
as possible whereas their condition can be significantly affected by a period of
excessive traffic volumes or inclement weather (Ejeta et al, 2017). In most
developing countries, the access roads include old earth roads or partly engineered
earth and gravel roads where many of them are of poor quality and cannot carry the
modern vehicular traffic since (MoT, 2009; Wasike, 2001; Gianfrancisco & Jenkins,
2000). Some of the roads also consist of an elevated and very rough riding surface,
side drains and cross-drainage structures like culverts and bridge. According to Rolt
(1979), most of the roads usually have problems in rutting, corrugations, erosion,
dust and alignment that create safety and traffickability hazards to users. In addition,
the effective strength of an unsealed pavement varies daily with moisture content that
fluctuates, in turn, with the rainfall and dry periods. Thus, rutting depend critically on
the type of soil and weather. In this regard, access roads built on bare clay soils have
fairly deep ruts that make the roads impassable during wet weather. Some rutting
also form in gravelled roads built on clay soils.
ii) Structure
A typical flexible or bituminous road pavement consists of several layers consisting
of a wearing surface, base course, and subbase built over compacted subgrade (or
natural soil), as shown in Figure 2.2. According to Robinson and Thagesen (2004),
O’Flaherty (2002) and Cook et al. (2001), these layers generally carry and spread the
self and imposed traffic load in a manner that they shall not deteriorate to any serious
extent within the design life. Nonetheless, each layer plays a critical role in the
performance of the pavement. The wearing course of a completed pavement protects
the underlying layers from the effects of weather and also provides a riding surface
to vehicles. The base and subbase are the respective primary and secondary layers
that spread the traffic load safely over the underlying subgrade as the actual
foundation. In some limited cases, however, the subbase layer may not used. Also,
where the subgrade is an inherently weak soil, the material is typically removed and
replaced with a stronger granular material (Holt, 2010).

11
Figure 2.2: Typical section through a road pavement
(Source: Johannessen, 2008)
Paved roads are constructed from a wide variety of materials and mixtures that
consist of conventional binders like lime, cement and bitumen together with local
materials like soil, gravel and stone (Budhu, 2011; Johannessen, 2008; Cook et al.,
2001). The wearing surface is made of high quality crushed stone or aggregates
mixed with a binder, usually bitumen. The underlying layers consist primarily of
treated and untreated local gravels. The base is constructed mainly of treated gravels
for increased strength while the subbase is mostly untreated local gravel. Moreover,
the top of the subgrade is sometimes stabilized with either cement or lime, though
cement gives a material with a higher tendency to cracking (Hudson, 1997). Thus,
greater attention is now being paid to the use of substitute materials such as
stabilized soils to meet road construction needs especially for the upper layers
(O’Flaherty, 2002; Cook et al., 2001).
The successful construction of roads requires a structure that is capable of carrying
the imposed traffic loads safely (Holt, 2010). This is because life of a road depends
on strength of the subgrade soil and traffic density. Thus, the road structure is almost
impossible to design and maintain even with best materials when it is overloaded or
the traffic increases in number (Gianfrancisco & Jenkins, 2000). Accordingly,

12
Nwachukwu (2013) postulated that Low Volume Sealed Roads (LVSRs) need to be
effectively and efficiently planned, designed, built, upgraded continuously and
preserved by means of integrated policies that respect the environment and still
provide the expected socio-economic services. It is therefore becoming recognized
that a key objective in LVSRs is to best match the locally available material to its
road task and its local environment (Cook et al., 2001).
2.2 The Study Area
2.2.1 Location, Topography and Climate
Nyeri County is situated in Kenya’s central highlands with its headquarters at Nyeri
town, some 150km by road north of Nairobi. The county borders Laikipia to the
north, Meru to the north-east, Kirinyaga to the east, Murang’a to the south, and
Nyandarua to the west. It lies between the equator and latitude 0°38’45” south, and
between longitudes 36°35’22” and 37°18’29” east. It has a total land area of 3,337
km2 and lies at an altitude of between 1210 m and 5199 m above sea level suggesting
a markedly great topographic variability. Figures 2.3 and 2.4 show the location,
topographical and administrative maps of Nyeri County, respectively.
Figure 2.3: Location of Nyeri County
on the global, regional and national
map
(Source: Maphill, 2011)
Figure 2.4: Topographic map of Nyeri
County with administrative
boundaries
(Source: Maphill, 2011)
The county sits largely in the saddle between Mt. Kenya (5199m) to the east and the
Aberdare Ranges (3999m) to the west. These volcanic mountains however give way
to a central landscape marked by many small isolated and rounded hills like
Mt Kenya The
Kenya The
Aberdares The

13
Tumutumu and Nyeri Hills seen as remnants of old volcanic vents (Muturi, 2015;
DoFEP, 2013; MoPND, 2005; Shackleton, 1945). The landscape along the Aberdares
is characterized by an undulating volcanic topography with a general easterly slope
which is deeply dissected by numerous, closely spaced and almost parallel steep
ridges and river valleys. Conversely, the area about Mt Kenya has a gently rolling
plain traversed by shallow and rather featureless valleys to the south, and an
extensive grass-covered plateau of southern Laikipia to the west. The central
landscape is drained by the Tana and Uaso Nyiro river basins with many permanent
rivers like Chania and Sagana with an easterly flow, and Naromoru with a
predominantly northerly flow (Jaetzold et al., 2006; Baker, 1967; Fairburn, 1966;
Thompson, 1964). Plate 2.1 presents the elevation map of Nyeri County as viewed
from the south showing the two volcanic mountains that influence its geology, relief,
climate, human settlement, economy, and transport networks.
Plate 2.1: Elevation map of Nyeri County viewed from the south (Source: Maphill, 2011)
According to DoFEP (2013) and Muturi (2015), Nyeri County has conditions of a
mountainous and wet area that experiences moderate temperatures with a monthly
mean of between 12.8°C and 20.8°C. The county also receives strongly seasonal
relief rainfall that occurs mostly at changes of the monsoon in two separate rain
seasons that come as the long rains from March to May and as the short rains from
October to December. However, the Laikipia Plateau has a trimodal rainfall pattern,
with middle rains in July-August intruding from the west (Jaetzold et al., 2006).
Accordingly, rainfall ranges from 700 mm in the Laikipia Plateau to 2200 mm in the
higher volcanic country. The areas over 1500 m above sea level also experience
frequent mists and drizzle caused by the south-easterly trade winds forced up the
mountains in the months June-September. Conversely, the whole county experiences

14
a dry season in January-February due to the dry NE Trades from the Somalia deserts
that blow over the region (Muturi, 2015; MoPND, 2005).
2.2.2 Geology
According to Budhu (2011), geology is important to a geotechnical engineer for
successful understanding of the character of the rocks and soils at a place. The
geology and soil formation is influenced by such environmental factors like
topography, climate and drainage conditions (Northmore et al., 1992a). Geological
information was extracted from relevant old reports. Hinga et al. (2019), Baker
(1967), Fairburn (1966) and Shackleton (1945) reported that geology of the larger
Kenya Highlands is grounded on the Basement System, a crustal block of the
Precambrian or Archaean age. It was transformed from the oldest marine
sedimentary rocks and it structurally consists of highly folded and crystalline
metamorphic rocks like gneisses and schists. The crustal block has a SSE-NNW
general strike and dips 20°-40° dominantly to the west. The Basement System is best
represented by a belt of exposed metamorphic hills and ridges to the south east, near
Sagana Township. In Kenya east of the Rift Valley, the crustal block provides a
planed erosion surface of the sub-Miocene age called peneplain (Bruggemann &
Gosden, 2004; Attewill & Morey, 1994). However, the peneplain is largely missing
in Nyeri area where a highly irregular pre-volcanic floor is evident instead.
The Basement System is overlain by volcanic rocks where the gneiss hills served as a
continuous barrier to the lava flows and form a buried sub-volcanic ridge in the
Tumutumu-Kiganjo area; the hills also influences the subterranean drainage pattern
of the area (Fairburn, 1966; Thompson, 1964; Terzaghi, 1958; Shackleton, 1945).
According to Bruggemann and Gosden (2004), lavas represent the height of volcanic
activity with eruptions occurring from localized vents as seen in section 2.3.1. Thus, two
intermittent periods of intense volcanic activity are picked up around Mt Kenya-
Aberdares region where the Sattima Fault is the only major structural feature east of
the Rift Valley. The volcanics thicken westwards and northwards of the metamorphic
hills towards the Aberdares and Mt Kenya but thin out to the east of the hills that
effectively mark the western limit of exposed Basement System east of the Rift
Valley. The volcanics comprise the oldest Simbara (or northern Aberdare) Series of

15
Tertiary age, the Mt Kenya Suite of Pleistocene age, and the younger Laikipian
Series of Pliocene age. The Simbara Series dips to the southeast but thin out
northwards and include basalts, agglomerates and trachytes. The Mt Kenya Suite
comprises the phonolitic agglomerates and trachytic tuffs like the Nyeri tuffs. The
Laikipian Series are associated with the numerous volcanic vents on the plateau and
comprise olivine basalts that dip to the southeast.
Finally, the volcanic rocks are overlain by recent soil deposits of Quaternary age.
These comprise the red soils in the highlands and the pink soils along the gneiss hills,
the black soils, red lateritic earths, natural gravels and the allophanic Naromoru ash
(soil) in the lowlands west of Mt Kenya. The name ‘Nyeri’ reportedly originates
from the Maasai word ‘nyiro’ for the dominant red soil. The natural gravels were
found to overlie the Nyeri tuffs in two distinctly colored layers – grey and bluish –
quarried for building stone. The geology, topography and climate of the area also
generated some soils and rocks used as road construction materials. The red soil and
natural gravel for this study were also obtained locally. Figures 2.5 and 2.6 shows the
associated lithological and soil maps of Nyeri County respectively.
Figure 2.5: Geological map of Nyeri
County
Source: GCS, 1984)
Figure 2.6: Soil map of Nyeri County
(Source: GCS, 1984)

16
2.2.3 Settlement, Land Use and Natural Resources
The topography, climate and geology of Nyeri County further determine the human
settlement patterns, land use and the distribution of transport network. Human
settlement and agriculture are highly influenced by natural land fertility and adequate
rainfall (DoFEP, 2013). As a result, the Kenya National Bureau of Statistics [KNBS]
(2019) demonstrated that the majority of population is found in the humid highlands
and minority in semi-arid lowlands that correspond to high and low agricultural
potential respectively. The county recoded an average population density of 228
persons per square kilometer but this varied greatly between the high- and low-
potential areas that took about 74% and 26% of the total county population.
According to DoFEP (2013), Knoop et al. (2012) and Baker (1967), arable land take
about 30% of the total surface area and much of it is used for subsistence and
commercial farming, livestock rearing and agro-forestry. In the highlands, the land is
used intensively for food crops and cash crops like tea and coffee as demonstrated in
Plate 2.2. However, subsistence farming mixed with large-scale farming for
horticulture, wheat, and livestock rearing is predominant in the expansive and semi-
arid lowlands though water scarcity limits the potential to establish ranches.
Plate 2.2: Intensive land use near Karatina Town in Nyeri County (Source: International Soil Reference and Information Centre [ISRIC], 2010)

17
The county also benefits from a forest cover of 10.6% mainly from indigenous and
plantation trees, compared to the national forest cover of 6.4%, as it serves as an
extensive natural carbon sink and as a source of timber and wood fuel for domestic
and industrial use. It is also self-sufficient in surface and sub-surface water for
domestic, agriculture and industrial use. However, building stones, gravel and kaolin
clay for ceramics are the only economic natural deposits of the county. Additionally,
the high population density and construction activities adversely affect the use of
natural resources like land, soils and water. For instance, Figure 2.7 illustrates a
markedly continued decline in water per capita in the larger Tana Basin.
Figure 2.7: Water availability per capita in Tana Basin, Kenya
(Source: Knoop et al., 2012)
2.2.4 Economy and Transport
According to DoFEP (2018, 2013), Muturi (2015), and Jaetzold et al. (2006), there is
no potential for large-scale mining activities in Nyeri County but there are small
mining of natural gravel, building stone, aggregates, sand and kaolin clay; the annual
production of gravel and kaolin is the highest and lowest at 2.3 million and 2,560
tonnes respectively. For this reason, agriculture is the backbone of the local economy
with 53% of the population being involved in agricultural production. However, the
type of agriculture practiced in an area, and hence its economy, depends on the type
of soil and climate. Moreover, there are a number of manufacturing industries in
Nyeri County mainly engaged in agro-processing. The tourism industry also thrives

18
especially within Mt. Kenya and the Aberdare ecosystems of the county where game,
site-seeing, and sporting are the major tourist attractions.
A good and adequate road network is however vital for efficient transport of people
and the highly perishable agricultural produce like tea, milk and horticultural
products and hence sustain economic growth in the county. Railway transport is the
second most important mode of transport in Kenya with a total of 2,778 km of
railway network (MoT, 2009). Nyeri County is served by 3,093 km of classified
roads, a derelict railway line, and three operational airstrips. The roads are confined
mainly to the ridges in line with the undulating terrain and drainage pattern that raise
the cost of opening up of new roads (DoFEP, 2013; Baker, 1967). In this regard, only
24% of the classified roads are paved and the rest are unsealed gravel and earth roads
that often become impassable during the rainy season (DoFEP, 2013). Muturi (2015)
therefore advocated for improved condition of road network as a deliberate effort to
initiate economic growth and social development in the county.
2.3 Empirical Review on Properties of Red Soil, Natural Gravel and Lime
2.3.1 Red Soil
Red clay soils are tropical residual soils usually predominant in young, sloping and
well-drained volcanic highlands and mainly a product of chemical weathering which
is abundant in hot and humid climate (Xue et al., 2020; Elsharief et al., 2013; Keter
& Ahn, 1986). According to Wesley (2009) and Coleman et al. (1964), red soils are
formed mostly, but not always, over basic volcanic rocks like basalt. They are one of
the most fertile and widely distributed group of soils in the world that support dense
populations (Bommer et al., 2002; Northmore et al., 1992a; Rolt, 1979; Foss, 1973).
The volcanic soils are common in parts of Central and South America, Africa and
South East Asia, as shown in Figure 2.8. Red clay soil is locally known as ‘red coffee
soil’ and is predominant in the central Kenya Highlands including Nyeri County
(Hinga et al., 2019; Waweru et al., 1998; Gichaga et al., 1987).

19
Figure 2.8: Global distribution of red soils
(Source: Robinson and Thagesen, 2004)
In natural state, red clay soil is about 1.5 to 20 metres deep, is well-drained due to a
highly porous structure and a granular appearance and have a dry density of 800-
1300 kg/m3 (Waweru et al., 1998; Dixon & Robertson, 1970; Foss, 1973). The soils
are fairly soft but break easily after some time of exposure to weather; they also
exhibit large cohesion and numerous joints as drying cracks. Moreover, the soils
have strong adsorption capacity, are capable of holding large quantities of water and
exist at high natural moisture content and degree of saturation subject to large
seasonal variations but still remain considerably strong and stable (Xue et al., 2020;
Chen & Lu, 2015; Rolt, 1979). The red clay soils consist of very high clay content of
30-80% and up to 30% silt whereby they often classify as silts (Keter & Ahn, 1986;
Coleman et al., 1964; Terzaghi, 1958). As a result, red clay soils have abnormally
high consistency limits, high shear strength, and high resistance to accelerated soil
erosion. The void ratio of 1.2-2.5 of the soil suggests clay of low compressibility
whose strength varies with porosity and moisture conditions. The soils are also
difficult to compact and this results in abnormally low maximum dry density (MDD)
and high optimum moisture content (OMC).
Red clay soils experience a strong mineralogical influence in their behavior, and
consist principally of halloysite or kaolinite silicate clay minerals (Bruggemann &
Gosden, 2004; Northmore et al., 1992b; Newill, 1961). They may also contain non-

20
silicate sesquioxides gibbsite and goethite, the hydrated forms of aluminium and iron
oxide more common in older volcanic soils and which act as cementing agents.
Allophane, an amorphous clay mineral formed from rapid weathering and alteration
of volcanic ‘glass’, is a good example of halloysitic soil. Hydrated halloysite forms
in wet areas but converts into the anhydrous metahalloysite upon its desiccation or
loss of water (Wesley, 2010; 2009; Coleman et al., 1964). Metahalloysite can be
difficult to distinguish from kaolinite as it is poor-crystalline kaolin mineral.
Red color of the soil is attributed to the presence of hematite as amorphous or free
iron oxide in a thin porous coating to soil particles (Xue et al., 2020; Sherwood,
1967; Coleman et al., 1964). The soils are also strongly aggregated into clusters by
the cementing properties of halloysite and hematite which results in a relatively
coarse-grained appearance, friable (powdery) texture and a crumb structure. The
presence of allophone also enables majority of red soils to exist at abnormally very
high natural moisture content, usually above optimum. In addition, red soils
containing allophane, halloysite and gibbsite have a marked sensitivity to drying and
the physical properties are highly susceptible to irreversible changes even when
partially dried (Bruggemann & Gosden, 2004; Northmore et al., 1992b).
Many volcanic soils including the red clay soils are highly desirable for many
engineering uses. According to Xue et al. (2020) and Wesley (2010; 2009), the soils
have good engineering properties when hydrated halloysite is the predominant
mineral. However, the excellent physical properties are highly unusual when
compared with similar soils of temperate climate. Thus, the unusual characteristics of
red clay soils can be a source of considerable puzzlement to engineers encountering
them for the first time, and even remain a major source of concern to road engineers
who are to reluctant to accept this behavior (Elsharief et al., 2013; Wesley, 2009;
Rolt, 1979). For instance, many engineers are faced with inability to adequately
classify the red clay soils and mistakenly call any red tropical residual soils 'laterite'.
Others find the red clay soils particularly troublesome to handle, especially those
containing halloysite, and also mistake the soils for a good foundation soil in
buildings or the (Kamtchueng et al., 2015; Northmore et al., 1992a; Gichaga et al.,
1987). Thus, a higher risk of failure and a short design life are generally adopted in

21
road works for economic reasons; a conservative allowable bearing pressure of 80
kN/m2 is also recommended in building foundations. Nonetheless, the difficulties
encountered in assessing and handling of the soils has been linked to a lack of
understanding of their nature, yet they are relatively good and stable as subgrade
(Elsharief et al., 2013; Smart, 1973; Dixon & Robertson, 1970).
Coleman et al. (1964) and Smart (1973) summarized the structure as well as
chemical and mineralogical composition of the Nyeri red clay, as outlined in Table
2.1. They reported that most of the soil consisted of brown amorphous material some
of which occurred as rounded aggregations. These writers and Terzaghi (1958) added
that the soil consisted principally of metahalloysite, silica as ordinary quartz, and
ferric oxide as hematite together with small quantities of a mineral of the feldspar
type and possibly some goethite. Rossiter (2004) proposed a geochemical index
represented by the silica-sesquioxide (S-S) ratio of a soil and expressed as
(SiO2/(Fe2O3+Al2O3). The index defines the degree of laterization (that is, advanced
stage of chemical weathering) of tropical aluminosilicate rocks into soil. When
applied to the Nyeri red clay as studied by Coleman et al. (1964), the S-S ratio is
0.96 (<1.33) which classifies the soil as a highly weathered or laterite soil.
Table 2.1: Chemical and mineralogical composition of Nyeri red clay soil
Elementa Mean Percentage Mineral
b Percentage
Silica (SiO2) 40.8 Metahalloysite 50
Ferric oxide (Fe2O3) 22.7 Iron oxide 23
Alumina (Al2O3) 19.6 Quartz & Feldspar 2-3
Ignition loss 12.6 Muscovite Trace
Titanium (TiO2) 1.9 Hornblende Trace
Potassium (K2O) 1.0 Magnetite or Ilmenite Trace
Sodium (Na2O) 0.6 Hematite or Limonite Trace
Magnesium (MgO) 0.1 Leucoxene Trace
Manganese (Mn3O4) <0.01
Calcium (CaO) <0.01
Sulphate (SO3) <0.01
Total 99.3
Free Ferric Oxide (Fe2O3) 10.2
Organic matter 1.7
(Source: Coleman et al., 1964a; Smart, 1973
b)

22
2.3.2 Natural Gravel
Gravel is a naturally occurring mineral material that consists of partially weathered
rock that is often excavated and used in road construction in relatively unprocessed
form in flexible road pavements. According to Robinson and Thagesen (2004), and
O’Flaherty (2002), rocks are generally classified into three main groups based on
their method of origin, namely the igneous rocks, the sedimentary rocks, and the
metamorphic rocks. The igneous rocks are the most common and they are formed by
cooling and solidification of hot molten rock material called magma. They are further
identified and classified into two main groups according to their manner of formation
and texture as:
1) Extrusive or volcanic rocks that include loose pyroclastic materials ejected from
volcanic vents with a fine-grained and often glassy or vitreous structure as a
result of rapid cooling of magma on the surface of the earth, and
2) Intrusive or plutonic rocks with coarse-grained and entirely visible crystalline
texture resulting from very slow cooling of large volumes of magma at great
depths within the earth’s crust; hypabyssal rocks are formed nearer to the surface
of the earth in small cavities and cracks as medium-grained rocks or pophyries.
The igneous rocks are further described geologically as aphanitic, pophyritic and
phaneritic rocks if they are fine-grained, medium-grained and coarse-grained in
texture, respectively. Robinson and Thagesen (2004), and O’Flaherty (2002) added
that the color and classification of igneous rocks is related to silica content. Thus, the
rocks are described as ultramafic, mafic, intermediate and felsic as silica content
increases from about 30-80% and the rocks become lighter in color. Similarly, the
rocks are classified as ultrabasic, basic, intermediate and acidic as silica content
increases over the same range. The color and chemical classification of igneous rocks
is summarized in Figure 2.9 where other constituent minerals are determined by
drawing a vertical line from the known silica content and then reading off their
relative proportions at the arbitrary boundaries.
23
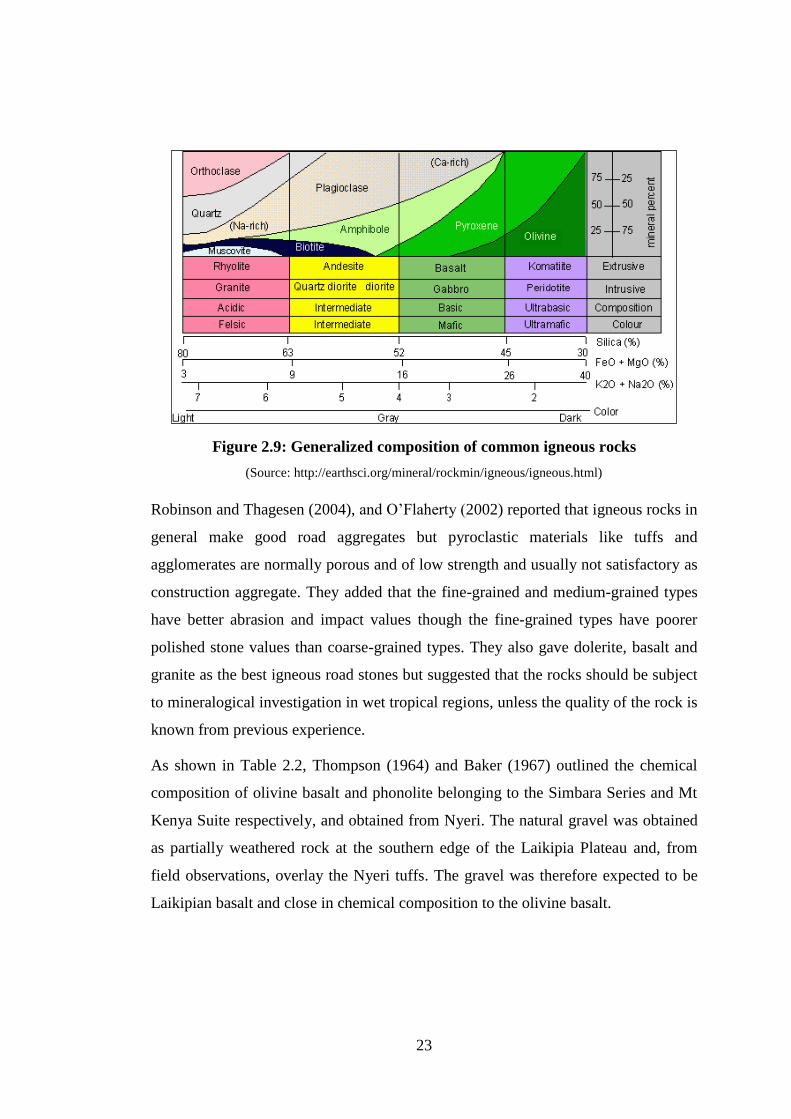
Figure 2.9: Generalized composition of common igneous rocks
(Source: http://earthsci.org/mineral/rockmin/igneous/igneous.html)
Robinson and Thagesen (2004), and O’Flaherty (2002) reported that igneous rocks in
general make good road aggregates but pyroclastic materials like tuffs and
agglomerates are normally porous and of low strength and usually not satisfactory as
construction aggregate. They added that the fine-grained and medium-grained types
have better abrasion and impact values though the fine-grained types have poorer
polished stone values than coarse-grained types. They also gave dolerite, basalt and
granite as the best igneous road stones but suggested that the rocks should be subject
to mineralogical investigation in wet tropical regions, unless the quality of the rock is
known from previous experience.
As shown in Table 2.2, Thompson (1964) and Baker (1967) outlined the chemical
composition of olivine basalt and phonolite belonging to the Simbara Series and Mt
Kenya Suite respectively, and obtained from Nyeri. The natural gravel was obtained
as partially weathered rock at the southern edge of the Laikipia Plateau and, from
field observations, overlay the Nyeri tuffs. The gravel was therefore expected to be
Laikipian basalt and close in chemical composition to the olivine basalt.

24
Table 2.2: Chemical composition of two volcanic rocks from Nyeri
Determination Olivine Basalt a Phonolite
b
Silica (SiO2) 46.58 52.10
Alumina (Al2O3) 13.67 22.29
Ferric oxide (Fe2O3) 6.15 1.73
Ferrous oxide (FeO) 6.37 4.10
Magnesium (MgO) 7.66 1.17
Calcium (CaO) 11.20 2.42
Sodium (Na2O) 2.55 8.60
Potassium (K2O) 1.30 4.66
Water (H2O+) 1.70 0.75
Water (H2O-) 0.46 1.00
Titanium (TiO2) 2.66 0.3
Phosphorous (P2O5) 0.25 0.46
Manganese (Mn3O4) Trace 0.23
Total 100.55 99.81
(Source: Thompson, 1964a; Baker, 1967
b)
According to McNally (1998), Petts et al. (2006), Gianfrancisco and Jenkins (2000),
and Skorseth and Selim (2000), the term ‘gravel’ is used in the general sense for
convenience since gravels are actually gravel-sand-silt mixtures with a small
proportion of clay binder that occur in few natural deposits. They added that good
gravel is normally scarce in some regions of the world but it is usually worked from
the face of dry pits after stripping of the overburden soil. Thus, the quality of gravel
varies substantially with location of each borrow pit and within a borrow pit over
time in depth of extraction. In this respect, great care is required at source to make
them free from vegetation, topsoil, marginal material, segregation, and any over-
sized hard material. Thus, quality gravel should comply with grading and plasticity
requirements for high mechanical strength and stability to resist breakdown and
movement under the effects of traffic loads and weather, but few natural deposits
have an ideal gradation without appropriate processing (Johannessen, 2008; Cook et
al., 2001). Natural gravels are varied and widespread deposits whose characteristics
may be difficult to generalize but they are excessively coarse, porous and moisture-
sensitive (McNally, 1998). However, the respective specifications for quality gavel

25
are presented in Tables 2.3 and 2.4 for grading and plasticity guidelines as provided
by MoTC (1987) and Intech Associates (2002).
Table 2.3: Natural gravel guidelines for subbase and base
BS Sieve Size
(mm)
Nominal Size and Percent Passing (%)
Subbase Base
60 mm 40 mm 50 mm
75 100 -
63 95-100 - -
50 85-100 100 100
37.5 75-95 90-100 95-100
28 60-87 75-95 80-100
20 50-80 60-90 60-100
10 30-67 35-75 35-90
5 23-58 25-63 20-75
2 13-40 15-45 12-50
1 7-32 8-35 10-40
0.425 4-20 4-26 7-33
0.075 0-10 0-12 4-20
(Source: MoTC, 1987)
Table 2.4: Guidelines for gravel plasticity characteristics
Climate Liquid limit
(%)
Plasticity Index
(%)
Linear Shrinkage
(%)
Moist and Wet Tropical <35 4-9 2-5
Seasonally Wet Tropical <45 6-20 3-10
Arid and Semi-arid <55 15-30 8-15
(Source: Intech Associates, 2002)
McNally (1998) further posited that natural gravels are the most widely used and
most economical road-making materials in the world because they are the locally
available and incur minimal haulage charges, they require only rudimentary in-pit or
on-road processing, and they are flexible and can be worked by simple equipment.
Nonetheless, some deposits are shallow and broad leading to significant
environmental impact due to its extensive lateral exploitation. Moreover, most
pavement material specifications usually regard gravel to be of marginal quality but

26
which might at best be acceptable as sub-base for lightly trafficked rural or local
roads. In this regard, quality gravel should generally be composed of virtually all
fractured and angular particles, and not rounded particle shapes, for good particle
interlock. As a guideline, the gravel should simply consists of a mixture of 35-65%
stone for strength, 20-40% sand to fill the voids between stones, give stability and
maintain high drainage characteristics, and 10-25% clay or plastic fines to bind the
particles together (O’Flaherty, 2002; Skorseth & Selim, 2000). The removal or
breakdown of oversize material and sufficient compaction are also considered
essential for optimum performance (Paige-Green, 2007).
2.3.3 Lime
2.3.3.1 Manufacture of Lime
Lime is a versatile alkaline chemical used extensively in production of food, paper,
pharmaceuticals and construction materials like steel, glass, rubber, leather, paints,
and plastics. Its use in construction span over several millennia but it is mainly used
today in the stabilization of roads, airfields, building foundations and earth dams
(O’Flaherty, 2002; Little, 1995). It is also widely used in the treatment of drinking
water and wastewater, treatment of industrial effluent, and in the remediation of
contaminated land, and in neutralization of gases generated from power stations for
environmental purposes (British Lime Association [BLA], 2010).
The manufacture of lime involves the heating of natural limestone (CaCO3), usually
in giant shaft or rotary kilns at atmospheric pressure and temperatures of 950°C, to
produce quicklime (Australian Stabilization Industry Association [AustStab], 2002;
Little, 1995). The process of burning crushed limestone is known as calcination.
Here, the high temperatures lead to evaporation of water in the stone, and to
chemical dissociation of limestone into calcium oxide (CaO) and carbon dioxide
(CO2). O’Flaherty (2002) added that when pure or almost pure limestone is calcined,
it produces calcitic or high-calcium quicklime. Similarly, dolomitic limestone
produces dolomitic quicklime which is a mixture of CaO and magnesium oxide
(MgO). After calcining, quicklime is cooled, crushed and stored for shipment in bulk
or bags. The production of quicklime is chemically expressed as follows:
Limestone + Heat = Quicklime + Carbon Dioxide

27
CaCO3 + Heat = CaO + CO2 (for calcitic quicklime), and
CaCO3·MgCO3 + Heat = CaO·MgO + CO2 (for dolomitic quicklime)
The manufacture of lime is also illustrated in Figure 2.10.
Figure 2.10: Schematic lime manufacturing process
(Source: AustStab, 2002)
According to O’Flaherty (2002), calcination is a reversible reaction. Hence, calcitic
hydrated lime is obtained when a limited amount of water is added to calcitic
quicklime during production, an exothermic reaction associated with expansion.
Dolomitic quicklime does not hydrate so readily under similar conditions and
produces dolomitic monohydrate lime. In slaking, however, quicklime is combined
with an excess amount of water to produce slaked lime slurry of varying consistency.
In this regard, quicklime is only available as a dry granular material while hydrated
lime is produced as a fine dry white powder or in slurry form. Hydrated lime
contains about 30% water which makes it more expensive than quicklime to handle
and transport especially if large quantities and long hauling distances are involved
(Powrie, 2004; Little, 1995). The calcined lime is not the same as non-calcined and
chemically inactive ‘agricultural lime’ which is not suitable enough for soil
stabilization (National Lime Association [NLA], 2004; Cook et al., 2001).

28
AustStab (2002) cautioned that commercial quicklime is never 100% calcium oxide
since the quality of lime depends on nature of parent material and production
process. First, limestone feedstocks for calcination are not pure carbonate and,
secondly, over-burning in the kilns results in increased impurities as cement clinker
minerals. Thus, kilning processes have inherent inefficiencies that effectively reduce
calcium content and the ability of lime to react with water. In this respect, the percent
of lime present should be determined in the laboratory if it is not designated on the
package. Lime production is a high energy consumption process that is responsible
for a considerable amount of carbon dioxide and dust emissions, all that affects the
environment negatively (Jawad et al., 2014; Little, 1995).
2.3.3.2 Properties of Lime
According to Little (1995), lime is generally white in color, which varies in intensity
with its chemical purity. However, hydrated limes are whiter than quicklime.
Fineness, specific gravity, bulk density, heat of solution, and solubility are the most
important physical properties of lime related to soil stabilization. Normal grades of
hydrated lime when air-classified have 75-95% passing 75μm (or 0.075mm) sieve, a
specific gravity of 2.0 to 2.2, and a bulk density of 400 to 640 kg/m3. Quicklime is
non-toxic but it is irritant, caustic and has a highly exothermic reaction with water.
However, hydrated lime is much less caustic and reactive and hence most often used
than quicklime (Guyer, 2011; O’Flaherty, 2002; Hudson, 1997).
Little (1995) also reported that quicklime and hydrated lime are reasonably stable
chemical compounds but quicklime is more vulnerable to water than hydrated lime
whose composition remains stable or unchanged in presence of water. Moreover,
lime in solution gives a ‘basic’ environment with a peak pH value of approximately
12.45 at a temperature of 25°C, which is of great practical importance in soil
stabilization. This environment facilitates the complex reactions between lime and
the compounds of silica (SiO2) and alumina (Al2O3) in clay minerals. According to
AustStab (2002), these reactions result in the formation of hydrated calcium silicate
and calcium-aluminate compounds in the presence of water, similar to those found in
cement paste. Jawad et al. (2014) and Little (1995) also reported that lime reacts with
carbon dioxide in the air and rainwater in a process known as carbonation where

29
water and fineness of lime act as catalysts. In effect, the process of carbonation robs
the construction system of quality lime that is reactive with soil minerals and results
in development of lower strengths than otherwise expected. Thus, lime should
generally be protected against weather prior to use to minimize carbonation, and
hydrated lime is best used within 4-6 months from the manufacturing date otherwise
it should be discarded (Johannessen, 2008; O’Flaherty, 2002).
The hydrated lime used in this study was a white powder described as high calcium
type CL 60 by the manufacturer and which was made in accordance to KS 1780-
3:2010 and certified by both BS EN ISO 14001:2004 and BS EN ISO 9001:2008.
The amount of lime was expected to be at 60% as suggested by type on package.
2.3.3.3 Water
Water is generally required to hydrate the binder, improve workability, and facilitate
compaction of any admixture. According to Arora (2004), O’Flaherty (2002) and
McNally (1998), the water should be potable and its chemical quality in terms of
salinity, pH and temperature should be known. The water should also be free from
harmful amounts of salts, alkalies, acids or organic matter; sulphates should be less
than 0.5%. However, the ability of quicklime to form alkaline solutions or
suspensions in water is key to modification of certain soils in such a way that the end
result is a benefit to road engineers (AustStab, 2002).
2.4 Soil Stabilization
Soil stabilization is a general term that is common with highway engineers. It is
defined as any treatment applied to a soil, including compaction, to alter one or more
of its properties for improved engineering performance of earthworks
(Mampearachchi et al., 2017; O’Flaherty, 2002; Hudson, 1997). Therefore, the main
objective of soil stabilization is to enhance quality of marginal materials and to
expedite construction through increased mechanical strength, stiffness, stability,
permeability, workability and durability; stability means reduced vulnerability of soil
to volume change and compressibility. Accordingly, the general economic and
environmental benefits of soil stabilization, notwithstanding the purpose for
stabilization, are as follows (Ejeta et al., 2017; Elsharief et al., 2013; Holt, 2010):

30
1) Use of poor non-renewable natural resources available locally,
2) Reduced demand on non-renewable natural resources,
3) Reduced borrow material to replace weak soils,
4) Reduced hauling cost and deterioration of local road networks, and
5) Cleaner environment from reduced noise, air, and water pollution caused by
construction plant, carbon and smoke emissions, and fuel and oil spillage.
Despite the many benefits of soil stabilization, McNally (1998) and Hudson (1997)
cautioned that stabilization should be employed when it is more economical to
overcome a deficiency in a readily available material than to bring in one that fully
complies with the specification requirements. They opined that stabilization should
be a last resort for upgrading marginal materials, and should be applicable only
where no economic alternative is available. They therefore asserted that the first
decision to be made if such borderline materials are encountered is whether
stabilization should be attempted at all! Nonetheless, successful stabilization of soils
depends on their physio-chemical properties that vary with soil composition (Little,
2009; Cook et al., 2001). Therefore to assist in decision-making, McNally (1998) and
Hudson (1997) indicated that suitability of a soil intended for stabilization should be
tested in a geotechnical laboratory for its easily measurable attributes like gradation,
plasticity, and strength. Too great an emphasis should, however, be placed on
obtaining a sufficiently dense mixture that meets stability needs whilst maximizing
use of the readily available low-cost soils, and not on achieving the ideal gradation
(O’Flaherty, 2002).
2.4.1 History of Soil Stabilization
Soil stabilization has been practiced for several millennia, especially after invention
of the wheel by the Sumerians at about 5,000 BC (O’Flaherty, 1997; Wignall et al.,
1999). Many ancient cultures like the Persians, Chinese, Incas and the Romans used
various techniques to improve soil suitability, some of which were so effective that
many of the roadways still exist today. Then, as now, poor soils could not be avoided
especially in flood plains, and neither were good materials always available
everywhere (Johannessen, 2008). Condition of the earth roads too varied with
climatic seasons, becoming rutted and impassable during wet seasons. This required

31
some degree of mitigation over weak sections of the roads and the most likely
remedial measure was to cover the muddy spots with granular material. This
procedure may have been improved over time to cover entire roads for better quality
and comfort. Thus, natural soils were probably partially removed and replaced to a
certain depth with a more durable layer of granular material, the probable origin of
road graveling seen today. However, lack of granular materials in some areas could
have led the ancient Mesopotamians and Romans to separately discover the method
of strengthening weak soils using pulverized limestone (O’Flaherty, 1997). The
ancient Egyptians and Ethiopians are also associated with use of gypsum. These
methods marked the birth of modern mechanical and or chemical (or lime)
stabilization of soils.
Modern soil stabilization began in the United States of America (USA) in the 1920's.
It was a chance discovery that rose from use of the highly toxic, liquid waste from
paper mills as dust palliative in earth/dirt roads. The surprise outcome of this creative
way of disposing the waste was a hardened surface to the dirt roads unlike other
untreated roads. However, it was not until decades later in the 1940's-60’s that the
reason for this change begun to be understood. After extensive private research, it
was established that the change was caused by a chemical reaction between the waste
solution and the clay particles in the soil. It was about this time when general
shortages of aggregates and fuel resources forced road engineers to consider
alternatives to the conventional techniques of mechanically replacing poor soils with
borrow aggregates possessing better engineering properties. This firmly established
cement, lime and bitumen as the traditional soil stabilizers globally; as a product of
limestone since 1824 AD, Portland cement is similar to lime (O’Flaherty, 2002).
Nonetheless, soil stabilization later fell out of favor, mainly due to faulty application
techniques and misunderstandings. Lime stabilization in particular suffered this fate
notwithstanding its being one of the oldest forms of stabilization that has a long and
successful history with clay subgrades (AustStab, 2002).
Soil stabilization has bounced back in recent years to become a popular trend in
many parts of the world like in Australia, India, United Kingdom (UK) and the USA
(Wilmot, 2006). This is driven primarily by environmental concerns and also by

32
increased global demand for raw materials, fuel and infrastructure like roads. This
time, however, soil stabilization is benefiting from advanced research, materials and
technology. Advancements in soil testing and research have led to the development
of new soil stabilization substances, and of improved original traditional stabilizers
with additional ingredients to make them effective in a much wider range of soil
types and conditions. The new non-traditional stabilizers include fly ash, cement kiln
dust (CKD), lime kiln dust (LKD), synthetic polymers, ionic stabilizers, and salts
(chlorides) of sodium and calcium. Research on ashes from agricultural waste,
molasses, lignin and tree resins is on-going. Mechanical stabilization has not been
left behind as there is also fiber reinforcement of soil using geosynthetics made from
polymeric materials like thermoplastics (Shuklar & Yin, 2006). Soil stabilization is
achieved by means of confinement of particle movement by the grid which also acts
as a tensioned membrane to provide high compressive and tensile strength of the
reinforced soil. There is also thermal and electrical treatment as well as grouting of
soils. Crushed waste from mining, quarrying and construction activities are also used
to a smaller scale in dust control and soil stabilization of local roads.
2.4.2 Methods of Soil Stabilization
There is a wide variety of soils that may be stabilized. A particular soil can often be
stabilized in a number of ways, each of which has its particular influence on
properties of different soils. This means that certain general correlations exist
between soil composition and soil response to various types of additives.
Nevertheless, the method of soil stabilization selected should be verified in the
laboratory before ordering of materials or construction. The treated soil can be
utilized as a modified subgrade, a sub-base replacement or even as base course in a
road pavement (Holt, 2010).
According to Rijn (2005), O’Flaherty (2002), Hudson (1997) and Matalucci (1962),
the techniques involved in improvement of soils involves compaction, dilution (or
blending), cementation, chemical reaction and waterproofing. Some stabilization
procedures employ a combination of these techniques. Moreover, all stabilization
methods fall into either (1) Mechanical or ‘granular’ stabilization, or (2) Chemical or
‘chemical admixture’ stabilization.

33
2.4.2.1 Mechanical Stabilization
Arora (2004) and McNally (1998) described mechanical stabilization as the process
of improving a soil by changing its gradation and sometimes plasticity. The method
involves soil blending and compaction where a raw soil is admixed with about 10-
50% of another contrasting soil to achieve a dense homogeneous mass (Little, 2009;
O’Flaherty, 2002; Cook et al., 2001). Nonetheless, recent works on sand stabilization
of clayey soils conducted by Kollaros and Athanasopoulou (2016) and Jjuuko et al.
(2011) showed that blending could go as high as 60-80% concentration of the
stabilizer. Up to 100% blending was deemed appropriate in this study.
Mechanical stabilization is the simplest method of stabilizing virtually any soil with
worldwide application and its essence is the use of locally available materials and
should be given first priority (Johannessen, 2008; Hudson, 1997). The process
depends on gradation, interlocking of aggregate particles, internal friction, plasticity
of some fines, and actual soil compaction. For this reason, the best aggregates are
those consisting of hard, durable and angular or ragged particles. Due to soil
variability, however, there is no absolute prescription regarding the nature and
amounts of fine material that can be used in granular-stabilized pavements.
2.4.2.2 Chemical Stabilization
Chemical stabilization uses hydraulic binders like cement, lime, fly ash, and CKD
mainly to alter the chemical properties of a wide range of clayey and granular soils
(Holt, 2010; O’Flaherty, 2002; Hudson, 1997). Synthetic chemicals like chloride and
sulphate salts can also be used as binders (Guyer, 2011; Cook et al., 2001).
According to Johannessen (2008), the soil becomes stabilized when cement or lime
reacts chemically with the soil particles to form cementitious hydrate gels that bind
them together. The gels are typically calcium aluminate hydrates (CAH) and calcium
silicate hydrates (CSH) which are as a result of three basic chemical reactions –
cation exchange, flocculation and agglomeration, and pozzolanic reaction. These
reactions depend on amount and type of clay mineral and calcium content and all are
nearly complete within 48-72 hours of mixing with water (Jawad et al., 2014;
O’Flaherty, 2002; Little, 1995). Organic soils cannot be stabilized satisfactorily
because they prevent the chemical reaction.

34
Chemical stabilization has been practiced for decades in road construction,
particularly where aggregates are scarce and haulage distances are significant, and it
eliminates the need to remove and replace inherently weak soil subgrades (Elsharief
et al., 2013; Holt, 2010). Over 90% of all chemical stabilization projects use the
traditional cement and lime or their combinations, while fly ash and CKD are
typically used as a partial replacement for the more common conventional binders.
Thus, the method is costly and should be considered only when using quality natural
or processed materials for soil blending is not feasible, more expensive or does not
produce a satisfactory treated soil material (Johannessen, 2008; Hudson, 1997).
a) Cement Stabilization
According to Arora (2004), soil-cement is the material obtained by mixing
pulverized soil with cement. The important factors that affect soil-cement are type of
soil, quantities of cement, water and admixtures added, and conditions of mixing,
compaction and curing. The cementing action is due to hydration when cement reacts
with siliceous soil. Cement also becomes more responsive in soil stabilization when
some common additives like lime, fly ash and salts like calcium chloride are used.
Granular soils with some fines are best treated with cement though presence of
organic matter interferes with hydration of cement, especially in sandy soils, causing
a reduction in strength (Johannessen, 2008; Arora, 2004). The actual cement content
is ascertained by laboratory tests, including unconfined compressive strength (UCS),
but a rough guide for different types of soils is 5-10% for gravels, 7-12% for sands,
12-15% for silts and 12-20% for clays in tropical climate.
b) Lime Stabilization
Lime is the oldest chemical stabilizer best used to improve road-making materials in
tropical climate (Jawad et al., 2014; Elsharief et al., 2013). It is more useful for
clayey soils and silts where it has a more rapid and marked effect (Johannessen,
2008; Arora, 2004). Lime reacts with silica and alumina in the clay to produce a
binding cement which creates long-lasting changes of structural benefits to the lime-
treated material (Jawad et al., 2014; NLA, 2005, 2006; Powrie, 2004). Like in
cement stabilization, this is affected by soil mineralogy, clay content, type and

35
content of lime, soil-lime mixing, compaction, curing conditions and presence of
deleterious matter (Guyer, 2011; AustStab, 2002). However, the material becomes
less plastic, much easier to compact, stronger, more friable and flexible but brittle.
Hydrated lime is widely used, either as a dry powder or as slaked lime, since it is
more safe and convenient to handle than quicklime. The amount of lime required is
normally 2-10% of the soil but as a rough guide, about 10% is used for heavy clays,
5-10% for soils with more than 50% fines, and 2-5% for clay-gravel material with
less than 50% fines. Additionally, lime is not effective for granular and sandy soils
but may be used in combination with clay, 10-20% fly ash or other pozzolanic
materials to make it more responsive. Lime has also been found to be more effective
with clay-gravel admixtures that exhibit considerable strength gain due to the self-
cementing action of the fines, than with cement stabilization (Holt, 2010; Cook et al.,
2001; Little, 1995).
c) Salt Stabilization
Salt stabilization mainly uses chlorides of calcium and sodium as well as sodium
silicate; calcium is more effective than sodium chloride. According to Arora (2004)
and O’Flaherty (2002), chlorides have excellent hygroscopic and deliquescent
properties – they absorb moisture from the air and get dissolved in it. They are not
cementing agents but are used as good lubricants in already mechanically stable
unsealed granular-stabilized pavements to increase compacted density, make the soil
impervious, retard development of ravelling and corrugation conditions, and as dust
palliative in warm climates. Salt stabilization also applies to treating of base and
subbase aggregates for roadwork but has not been tried on subgrades.
Arora (2004) indicated that salt stabilization is relatively inexpensive since the salts
are used in very small quantities of about 0.5% of calcium chloride, 1% of sodium
chloride, and 0.1-0.2% of sodium silicate, by weight of soil. However, the salts are
liable to leaching and their periodical re-application may be necessary. Moreover,
chlorides are not cementing agents (O’Flaherty, 2002). Thus, the long-term durability
of the method is doubtful and a salt-stabilized pavement must be already of well-
graded and densely compacted materials since the treated soil may lose strength

36
when exposed to weather and groundwater. Splash water from salt-stabilized roads
also has the undesirable corroding effect upon the steel in motor vehicles.
d) Other Chemicals
Chrome lignin is obtained from wood as a by-product of sulphite paper manufacture.
When 5-20% is added to a soil by weight, it slowly reacts to form a gel that causes
bonding of particles. According to Arora (2004), lignin is soluble in water and its
stabilizing effect is not permanent. Additionally, resins are natural polymers and
when added to a soil, reaction takes place to stabilize it: There are natural and
synthetic polymers.
2.4.2.3 Bituminous Stabilization
Bituminous stabilization is done with cut-back bitumen or bitumen emulsions as the
bonding and cementing agent (Arora, 2004). Its primary objective is to waterproof
the soil, reduce moisture and increase strength by bonding granular soil particles
together and plugging the voids in fine soils to reduce water absorption. The
stabilized product is known as sand-bitumen and soil-bitumen for granular and
cohesive soils, respectively. Like cement and lime stabilization, bituminous
stabilization is affected by soil type, bitumen content, mixing and compaction. The
amount of bitumen required is determined by trial but it is often about 4-7% by
weight of soil. However, the method expensive since bitumen is not readily
available.
2.4.2.4 Injection Stabilization
Injection stabilization, also known as grouting, is an in-situ method of improving
water resistance, strength and other properties of a natural soil deposit. In this
method, a bonding material is always forced or injected under pressure into the
natural soil deposit. The stabilizer used depends on type of soil and include clay,
cement, lime, sodium silicate as ‘water glass’, chrome lignin, polymer and bitumen
(Arora, 2004). The method is used to improve a soil deposit of considerable
thickness or depth of earth and cannot be disturbed, or where the treated area is close
to existing structures and other facilities.

37
During injection, stabilizing material moves through and fills the void spaces in the
soil. The method therefore depends on permeability of the soil and viscosity of
stabilizing material. Thus, the method of injection is not suitable for stabilizers of
high viscosity and for clays because of very low permeability. Also, there is always
some uncertainty in results obtained since the stabilizer may not be distributed
uniformly throughout the soil mass as desired. Moreover, grouting requires use of
specialized equipment and is best handled by specialty contractors. Nevertheless, the
method is generally economical, effective and friendly to the environment.
2.4.2.5 Thermal Stabilization
According to Arora (2004), thermal stabilization is done either by heating or cooling
a soil to markedly improve its properties. Heating leads to loss of free moisture and
an increase in strength; heating above 100ºC drives off adsorbed water is and results
in further increase in strength. Heating clay soils to about 200°C also significantly
reduce the potential for volume change and increase soil strength. When the soil is
heated to 400-600°C, it undergoes irreversible changes and becomes non-plastic,
non-expansive and the clay clods convert into aggregates. Above this, some fusion
and vitrification occurs to produce a brick-like material used as artificial aggregate.
Conversely, cooling causes a small loss of strength of clay soils but further cooling
freezes pore water that act as a cementing agent in soil stabilization. Strength of the
soil increases as more and more water freezes but no practical and economic methods
have been developed (Arora, 2004). Thermal stabilization is used in some special
cases like tunnelling.
2.4.2.6 Electrical Stabilization
Also known as electrochemical hardening, electrical treatment of a soil uses
electrodes and a direct electric current (DC) to alter the physico-chemical properties
of clay soils. A solution with a high concentration of preferred exchangeable cations
act as a stabilizing agent by the process of electro-osmosis and base exchange of clay
minerals when the electric current is passed. Removal of water considerably
increases strength of the soil and reduces both its swell pressure and amount of swell.
The method is expensive and is economical only for much localized areas like in
drainage of cohesive soils (Arora, 2004).

38
2.4.2.7 Geotextile Stabilization
Geotextiles are porous or mesh-fabrics of high tensile strength made mainly of
plastics, cotton, jute and wool. The fabrics have a grid form and are widely used in
areas exposed to flowing water like in embankments and earth dams. Fabrics are a
recent development and hence they are expensive and not readily available.
2.4.3 Selection of Method and Stabilizer
The responsibility to select or specify the correct stabilizing method, technique, and
quantity of material required for the prevailing conditions lies with engineers (Cook
et al., 2001). According to Guyer (2011) and Little (2009), selection of a given
stabilizer should be based on its effectiveness to improve properties of the selected
soil. O’Flaherty (2002) and Hudson (1997) added that the decision on method and
type of stabilizer to use is primarily a financial one though the skills, resources,
construction equipment and alternatives available are often considered. Some care is
also required in selecting a suitable stabilizer. Therefore, it is important to establish
type of chemical admixtures available for use, and if any special equipment or
training is required to successfully incorporate the selected admixture.
There may be more than one candidate stabilizer applicable for one soil type. Figure
2.11 represents a simple and excellent analysis of the technical procedure involved in
selection of the best stabilizer for fine soils.
Figure 2.11: Guideline to select suitable method of soil stabilization
(Source: O’Flaherty, 2002; Cook et al., 2001)

39
Guyer (2011), Holt (2010) and Little (2009) asserted that representative soil samples
must be prepared and tested in the laboratory for index properties and binder
concentration once a suitable stabilizing agent is determined. Presence of certain
types of salts and organic matter in the soil inhibits normal hydration process and
pozzolanic reaction, retarding the hardening and strength gain in stabilized soils. In
particular, soils with an organic content of 1-2% by weight may be difficult to
stabilize or may require uneconomical quantities of binder to stabilize. Similarly,
soils containing sulphates in excess of 0.3% or 3,000 ppm have potential to react
with calcium and aluminium to form expansive minerals. This would create soil
distress in lime stabilization, while heaving and disintegration may also occur,
leading to loss of strength. In this regard, Jawad et al. (2014) and Cook et al. (2001)
recommended that the possible impact of deleterious components of the soil must be
considered once an additive, particularly lime, has been selected. Thereafter,
laboratory results are used to develop a design mix for field stabilization that serve to
ensure optimum addition of a binder for purposes of meeting the desired minimum
engineering performance criteria.
2.4.4 Compaction
The technique of soil compaction normally accounts for less than 5% of the total
construction costs and is perhaps the least expensive method of improving soils
(Budhu, 2011; Rijn, 2005). It is also the most widely recognized form of stabilization
that improves mechanical stability and strength to varying degree. Nonetheless,
compaction alone is often not enough especially with fine-grained, cohesive soils
which are susceptible to swelling (Little, 1995). Despite this reality, a common
method of mechanically stabilizing an existing clay soil is to add gravel or other
granular materials that do not soften when wet or pulverize under traffic.
Nevertheless, compaction of soil stabilized with hydraulic binders is often marked by
an increase in OMC and a decrease in MDD but with higher strengths. These
compaction characteristics are illustrated in Figure 2.12 where slope of the curve also
represents sensitivity of soil admixture to addition of water (Jjjuko et al., 2014).

40
Figure 2.12: Effect of lime on compaction characteristics
(Source: Holt, 2010)
Lime is used in soil treatment for a variety of reasons and for a wide range of soils
(O’Flaherty, 2002, Wignall et al., 1999; Little, 1995). This versatile soil stabilizer is
used mainly to improve the plastic properties of the soil and is effective in most
cohesive and excessively clayey soils and plastic aggregates. Lime also substantially
reduces the ability of clay to hold water and creates a water barrier to capillary
moisture from below making it a significant and an unparalleled aid that is used to
treat wet and weak clay subgrades (NLA, 2001). Quicklime is particularly very
effective in drying wet soils and minimizing weather-related construction delays as it
hydrates to save time and money. Lime treatment is also used to increase stability,
impermeability, and load-bearing strength of weak soils. In particular, lime treatment
improves the tensile and flexural strength of the soil combined with reduced
shrinkage potential all of which substantially increases the gap-spanning capabilities
and reduces cracking tendencies of the stabilized soil respectively.
Lime stabilization is used primarily to upgrade poor clay soils into adequate
subgrade support or capping and is an economical approach to clay subgrade with
plasticity index (PI) exceeding 5%. Thus, lime stabilization may transform clay soils
into subbase, and even form a strong and high quality base course with marginal
granular base materials (Guyer, 2011) as envisaged in this study. It is therefore
applicable particularly where the natural soils are excessively (i) clayey and no better
material is economically available, (ii) wet and cannot be dried out (Ministry of
Transport and Communications [MoTC], 1987; Ministry of Roads and Public Works
[MoR&PW], 1986).

41
Nevertheless, lime may be used as a preliminary additive to reduce the plasticity or
alter gradation of a soil before adding the primary stabilizing agent (Hudson, 1997).
Vorobief and Murphy (2003) and O’Flaherty (2002) also held that there is normally
little value in adding lime to silty, sandy or gravelly soils with less than 10% clay
contents as the pozzolanic reaction will be minimal. Moreover, there is a critical lime
content beyond which there is no more strength gain and the strength either declines
or remains constant during the curing period which should be maintained at
temperatures above 10°C to avoid halting of the pozzolanic reaction. Lime also gains
strength quite rapidly initially but this slows to a fairly constant rate in the long-term.
It therefore requires about 14 days in hot weather and 28 days in cool weather to gain
significant strength but the effects of lime stabilization are typically measured after
28 days or longer (NLA, 2006; Hudson, 1997).
2.5 Material Testing
Gianfrancisco and Jenkins (2000), Skorseth and Selim (2000), and Morin et al.
(1971) held that all roads should be built of materials that will make them passable in
all kinds of weather. Nonetheless, different uses require different types of material
while the question of quality and adequacy of the available materials in road
structures has never been fully investigated in the tropics. Generally, one can simply
tell a little about them by feel or visual inspection but it is only by testing that real
quality of a material and its suitability for specific use can really be determined. For
this reason, Hudson (1997) discouraged the use of the ‘rule of thumb’ that is based
on visual inspection or apparent similarity to other soils in selecting a soil for
particular use. He also cautioned that misunderstanding soils and their properties can
lead to construction errors that are costly in effort and material.
Testing is often done prior to use of material and at the time of construction for
several benefits. Most importantly, testing increases knowledge of materials that
forms the basis for appropriate road design, for quality control purposes by
empowering decision-makers to specify good materials and know when to accept or
reject materials, and for better communication with contractors, consultants, and
others involved in road construction (Robinson & Thagesen 2004; Skorseth & Selim

42
2000). According to Gianfrancisco and Jenkins (2000) and Intech Associates (2002),
testing reduces the risk of future problems while research enables development of
more accurate predictions. However, the essential knowledge on the overall
characteristics of a material is no substitute for local experience. Additionally,
quality control is as important to the final product as is proper design.
Soils are naturally the oldest but most complex engineering materials that are never
homogeneous in character throughout the world, even when apparently similar to
soils in other regions (Das, 2011; Northmore et al., 1992a). According to Budhu
(2011), laboratory tests on invariably disturbed soil samples allow for better control
of the test conditions applied to the soil than in situ tests where sufficient care must
be taken to reduce testing disturbances that can significantly affect the test results. To
obtain good laboratory results, it is then absolutely critical to get adequate and truly
representative sample of materials in the field. However, sampling and testing is
costly whereas poor sampling techniques have often led to more controversy in
material testing than any other factor (Cook et al., 2001; Skorseth & Selim, 2000).
Laboratory testing programs are carried out mainly to determine properties that
normally reflect the expected performance characteristics of the material in service.
This includes the physical, mechanical, chemical and mineralogical characteristics
that are needed to determine strength, settlement, and stiffness parameters of soils for
design and construction (Budhu, 2011). They are also needed to classify soils as
shown in Figure 2.13, which are broadly described as ‘fine’ and ‘coarse’ depending
on the predominant size of particles within the soil. The fundamental investigative
laboratory tests for soils meant for roadworks include gradation, specific gravity,
plasticity, swelling, shrinkage, compaction, and shear strength as UCS, and
California Bearing Ratio [CBR] (Day, 2010; O’Flaherty, 2002; Cook et al., 2001;
Hudson, 1997; Wambura et al., 1991). The soils may also be tested for mineralogy,
clay activity, permeability and consolidation while granular materials may be tested
for particle shape, wearing resistance and crushing strength.

43
Figure 2.13: Common soil description systems based on particle size
(Source: Budhu, 2011)
Grading and plasticity of soils in particular are the intrinsic or ‘fingerprint’ properties
of a soil that serve as very useful tools for soil classification, and as a benchmark for
evaluating and comparing the probable soil behavior, and for providing correlations
with engineering properties (Das, 2011; Wesley, 2010; Northmore et al., 1992b).
Standards for the acceptance or rejection of materials placed in roads are therefore
invariably derived from particle-size distribution, Atterberg limits and the CBR
which are perhaps the best methods of making a rapid assessment of the properties of
a soil (Morin et al., 1971; Dixon & Robertson, 1970). Particle size analysis has many
uses in engineering and especially in the selection of soils and aggregates for
construction purposes since it highly influences the engineering properties like
maximum density, optimum water content, and strength and is also frequently used
for mix-design when stabilizing soils (Budhu, 2011; Day, 2010; O’Flaherty, 2002).
The activity of soil as defined by Skempton (1953) also serves as a good indicator of
potential shrink-swell problems associated with expansive soils (Das, 2011).
2.5.1 Soil Mineralogy
Besides the difference in grain size that alone tells very little about the physical
properties of fine soils, different types of soils can be identified with the aid of color,
mineralogy and chemical composition of a soil (Day, 2010; Verrujit, 2001). Clay
mineralogy, chemical composition and micro-structure are very significant factors
that largely control clay soil behavior and must clearly not be ignored in the
assessment of its behavior (Northmore et al., 1992a; Dixon & Robertson, 1970).

44
However, chemical composition does not give much quantitative information of a
soil but serves as a warning of its characteristics. In contrast, Budhu (2011) and Little
(1995) held that a look at soil mineralogy shows that grouping of soils according to
size is only a beginning in understanding soil behavior. Moreover, knowledge in soil
mineralogy actually provides an excellent background for an engineer seeking to
understand the unique phenomena involved in soil stabilization.
Clay minerals are essentially very tiny crystalline substances evolved primarily from
chemical weathering of certain rocks and are dominantly hydrous aluminosilicates
(Das, 2011; O’Flaherty, 2002; Powrie, 2004; Smoltczyk, 2003). Additionally, clay
minerals also contain other loosely bonded and exchangeable metallic ions called
cations which form the basis of soil stabilization with chemicals like lime. Clay
minerals of greatest interest comprise the very stable kaolinite, montmorillonite (or
smectite) with one of the largest specific surface and cation exchange capacity
(CEC), and illite. There are also lesser and rare clay minerals generally considered to
be amorphous and non-crystalline and include allophane and halloysite which are
particularly common in volcanic soils. Halloysite has a unique tubular shape. Table
2.5 shows characteristics of some common clay minerals.
Table 2.5: Typical characteristics of some clay minerals
Mineral Specific Surface
Area (m2/g)
Specific
Gravity, Gs
Clay Activity, A CEC
(mEq/100g)
Kaolinite 10-20 2.6 0.5 3-15
Halloysite 40 2.0-2.55 0.5-1 5-50
Chlorite 5-50 2.6-2.9 - 10-40
Illite 65-100 2.8 0.5-1 10-40
Allophane - - 0.5-1.2 25-50
Montmorillonite 100-800 2.65-2.80 1.7 60-150
Vermiculite 5-400 - - 100-150
(Source: Das, 2011; Smoltczyk, 2003; Geological Society of London [GSL], 1990)
All clay minerals are colloidal-sized and consist of many repetitive and flake-like
crystal sheets. Thus, the methods for studying mineralogy and geometrical structure
of clay particles are mostly X-Ray Diffraction (XRD), Differential Thermal Analysis
(DTA), optical microscopy, and scanning electron microscopy (Verrujit, 2001; Holtz
& Kovacs, 1981). Chemical analysis of soil samples is done by the rapid method of

45
X-Ray Fluorescence (XRF) spectroscopy (Das, 2011; Day, 2010). However, these
processes are rather complicated, expensive, and involve special equipment that is
not readily available to the geotechnical engineer. Thus, the predominant clay
mineral present in a soil can easily and inexpensively be determined from its activity
(A) as shown in Table 2.6, and from its plasticity index (PI) as illustrated in Figure
2.14 for some tropical residual soils. However, this approach may be inaccurate
where more than one clay mineral is present (Day, 2010; O’Flaherty, 2002).
Figure 2.14: Conventional plasticity locating some tropical residual soils
Source: Wesley (2010)
2.5.2 Lime
According to Little (2009, 1995) and O’Flaherty (2002), aggregates are used in road
pavements either on their own or in combination with a cementitious material like
lime but the percentage used must be determined by recognized laboratory testing or
empirical methods. It is however important to appreciate that different design
contents may be determined for the same soil as this depends upon the design
procedure used for testing and upon the objectives of the lime treatment. For
instance, the mix design protocol may be designed to optimize the potential for long-
term strength gain and durability of lime stabilized soils.
AustStab (2002) gave the common tests carried out in lime stabilization for roads as:
1) Determination of the quality of lime,
2) Determination of Available Lime Index, that is, the Lime Content.
3) Lime Demand Test,

46
4) Determination of California Bearing Ratio (CBR) and swell potential of
compacted material, and
5) Determination of the unconfined compressive strength.
2.5.2.1 Lime Quality and Available Lime
The quality of lime represents its grade and may be expressed in terms of its inherent
reactivity, its fineness (particle size), and its degree of purity. The grade indicates the
amount of lime that is chemically available to the users for most reactions.
According to NLA (2006), lime can react with moisture and carbon dioxide and
hence careful storage is required to maintain its integrity and produce reliable results.
AustStab (2002) defined the Available Lime Index as a measure of the amount of
calcium oxide present in a lime. The available lime is expressed as a percentage of
the ‘available quicklime [CaO]’ or ‘available hydrated lime [Ca(OH)2]’. However, it
varies with source and manufacturer which are represented by the brand name.
2.5.2.2 Initial Lime Consumption
Most lime develop a highly alkaline environment of about 12.4 pH when placed in a
water solution and the lowest lime content required to create this level of alkalinity in
the soil-lime solution is known as the Initial Consumption of Lime (ICL) or simply
the initial design lime content (AustStab, 2002; Cook et al., 2001; Hudson, 1997).
According to NLA (2006), it is important to appreciate that the ICL is also the
minimum lime percentage for stabilizing the soil. When introduced into a soil, lime
reacts with the soil and generally causes a significant change in the soil texture,
plasticity and compaction characteristics of the host soil proportional to
concentration of the binder (Jawad et al., 2014; Holt, 2010; Powrie, 2004). In this
regard, both the pH and the PI effectively become good indicators of the desirable
lime content of a soil-lime mixture.
Similarly, there are two methods for the determination of initial design lime content
which are presented as (Guyer, 2011; AustStab, 2002; Hudson, 1997):
1. Lime Demand Method – This is the preferred method which aims to obtain
the quantity of lime required to reach the desired pH level for satisfactory
cation exchange and to produce long-term chemical reactions.

47
2. Plasticity Method – This is the alternate method which is based on the
plasticity index and fraction of soil passing 425 μm (or No. 40) sieve, as
illustrated in Figure 2.15 for hydrated lime and soil with at least 10% fines.
These basic properties are easily obtained from the laboratory consistency and
gradation tests of the untreated soil. The method was adopted in the research
for its simplicity and possible expedient construction in the field when adopted.
Figure 2.15: Plasticity method for determining initial lime content
(Source: Hudson, 1997)
2.5.2.3 Lime Mix Design
According to O’Flaherty (2002) and Little (1995), the total benefits of lime
stabilization are reduced if insufficient lime is used since the proper stabilization may
not occur. For this reason, they asserted that generalizations and guesswork to the
amount of lime to be specified should never be allowed. The amount of lime is then
determined by conducting traditional laboratory tests on selected engineering
properties to establish the optimum amount required for each soil. Holt (2010) added
that one of the most important aspects of the mix design is to determine the OMC of
the blended or treated mix. Compaction is then one of the tests since lime addition
changes the compaction characteristics of the soil (Guyer, 2011; NLA, 2006).

48
In this respect, compaction should essentially be conducted on the lime-soil mixture
after estimating the initial lime content. To establish the ultimate design lime content,
Guyer (2011) and Hudson (1997) reported that the soil mixtures for compaction test
should be prepared at lime contents equal to ICL+ 2% and ICL + 4% for the standard
pH method, and at ICL ± 2% for the alternate plasticity method. They added that
each mixture should cure in sealed container for between one and two hours before
compaction. According to O’Flaherty (2002) and AustStab (2002), however, the lime
contents determined for hydrated lime should be reduced by about 25% to determine
the equivalent design content for quicklime, since the ratio of atomic masses for CaO
and Ca(OH)2 of 56 and 74 is (56/74=0.76) or 76%.
A small construction tolerance typically of 0.5-1% lime is normally added to the
laboratory-determined design lime content to allow for mixing inefficiencies in the
field. Moreover, the OMC for maximum strength of a lime-treated soil is not
necessarily the same as that for MDD. O’Flaherty (2002) also observed that the
OMC for strength tends to be higher than that for dry density with clayey soils while
the opposite may be true with silty soils.
2.5.3 Strength Tests
Holt (2010) advanced the view that strength criteria for soil stabilization is not
universal but is dependent upon the type of soil to be treated, where the soil is
treated, and the intended end use of the stabilized soil. He however reported that the
effect of soil stabilization is commonly assessed in terms of strength gain over a
certain period of time or cure. The shearing resistance also increases with
compaction, and with angularity and size of particle (O’Flaherty, 2002).
According to Little (1995) and Morin et al. (1971), the CBR and the Unconfined
Compression Strength (UCS) tests are the most common procedures used to assess
strength gains in stabilized soils and as design parameters in road pavements
universally. In particular, the UCS provides all the information necessary about the
mix design mixtures since the tensile and flexural strength characteristics, which are
also important considerations in pavement design, can be reliably predicted from the
test. Nonetheless, the UCS test has limited application as the basis for design of
stabilized materials and does not appear to have any clear correlation with CBR test.

49
Thus, the CBR approach is preferred by many pavement designers (Vorobieff &
Murphy, 2003).
2.5.3.1 California Bearing Ratio
Devised by O.J. Porter in 1938, the CBR test is an empirical index to evaluate
subgrade strengths but has been extended to cover the design and control of the
entire road pavements. The performance of pavements has also been correlated with
the CBR test more than with any other test. According to AustStab (2002), Hudson
(1997) and Morin et al. (1971), CBR test is the common strength test method that
provides a rapid and effective method for assessing the suitability of compacted soils.
It is also the best means of evaluating the effectiveness of stabilized materials. Thus,
considerable experience has been accumulated with the test in many parts of the
world, and the test is still popular for pavement design in most African countries.
The CBR is dependent on the type of soil used and its density and moisture content.
It is therefore basically a measure of the stiffness and shear strength for a compacted
material tested under simulated field conditions of pressure and highest moisture
(Venkatramaiah, 2006; Vorobieff & Murphy, 2003; O’Flaherty, 2002). According to
Blake (1994), the CBR is expressed as a percentage of a given penetrative force to
the standard force for crushed stone at penetrations of 2.5 and 5.0 mm respectively
and the higher of two values is adopted. Moreover, it forms the basis for determining
the thickness of soil and aggregate layers used in the structural design of pavements,
often known as thickness design.
2.5.3.2 Pavement Thickness Design
According to Cook et al. (2001), the purpose of structural design is to limit the
stresses induced in the subgrade by traffic to a safe level. It involves the
determination of the type and thickness of capping layer, subbase and base and is
dependent on the subgrade bearing capacity and the strength of paving materials
(Robinson & Thagesen, 2004; Little, 2009; Wignall et al., 1999). According to
Vorobieff and Murphy (2003) and (Johannessen (2008), existing pavement design
procedures are essentially an empirical science based primarily on CBR selection
criteria that also accommodates the use of marginal materials. They however held
that the expected levels of traffic density determine the choice of materials and

50
thickness of pavement layers. Accordingly, different road authorities have developed
design curves for flexible pavements to determine the appropriate thickness of
materials overlying a subgrade under different wheel loads and traffic conditions, as
given in Equation 2.1 (Venkatramaiah, 2006):
A
CBR
Wd
)(57.0 (2.1)
where d = Total thickness of construction (cm),
W = Maximum load on one wheel (kg),
A = Contact area of one tyre (cm2), and
CBR = Subgrade strength index.
The CBR approach is fast being replaced by use of the resilient modulus of the
subgrade whose laboratory procedures are tedious but can be approximated for 2-
13% CBR thus (Venkatramaiah, 2004; O’Flaherty, 2002; AustStab, 2002):
64.06.17 CBRE (2.2)
where E = Resilient Modulus in MPa,
CBR = Subgrade strength index.
The conventional thickness design for a road pavement based on CBR and estimated
design traffic is illustrated in Figure 2.16.
Figure 2.16: CBR thickness design chart for a granular road pavement
(Source: Vorobieff & Murthy, 2003)

51
As illustrated in Figure 2.17, the intensity of traffic stress normally spreads in a
pyramidal pattern throughout the depth of the pavement (Wignall et al., 1999). The
strength and quality of material required is therefore greatest at the wearing surface
and least at the subgrade levels. In this respect, MoTC (1987) listed six subgrade
bearing strength classes based on soaked CBR as shown in Table A7.7 of Appendix
III. Moreover, the qualifying strength for subbase and base are given in terms of
certain soaked CBR values. Locally, these are 30 and 80% respectively for natural
materials, and 60 and 160% for treated materials. Nevertheless, Cook et al. (2013;
2002) and Morin et al. (1971) observed that standards are set to ensure quality and
safety but there shall be circumstances in which full compliance with the normal
standards will lead to very high costs or environmental impact. They therefore
concluded that the conventional CBR requirements are often exceptionally high for
LVSRs, with treated base performing satisfactorily with reduced CBR of as low as
80-100% in many countries including Kenya. In effect, many countries have come
up with relaxed guidelines for LVSRs. Kenya has come up with the MoTI (2013)
design guidelines that accordingly comprise fourteen (14) types of LVSRs and five
(5) classes of traffic load to choose from.
Figure 2.17: Schematic distribution of traffic load through road pavement
(Source: Johannessen, 2008)

52
2.6 Summary of Empirical Review
Soils are distributed worldwide in a variety of types that depend on the geology,
topography and climate of a place (Kamtchueng et al., 2015; Johannessen, 2008;
Frempong & Tsidzi, 1999). In this respect, soils are never homogeneous in character
but are radically different from one another even when apparently similar to soils in
other regions (Das, 2011; Northmore et al., 1992a). Thus, tropical conditions lead to
a variety of natural soil deposits that vary considerably and are completely different
in material and engineering properties even in two very close locations (Jjuuko et al.,
2014; Venkatramaiah, 2006; Rollings et al., 2002; Verrujit, 2001). According to
Northmore et al. (1992a), it is therefore a misconception to consider red clay soils as
forming a distinct and clearly defined soil type whose properties can be broadly
generalized. Hence, most red soils of India, for instance, are quite different in
character from those found in Kenya in that they are generally hard, granular,
infertile and of low water holding capacity and hence difficult to cultivate (Qayoom
et. al., 2020; Aravind et al., 2019). In contrast, Kenyan red ‘coffee’ soils are
cultivable since they are soft, fine, highly hygroscopic and rich in nutrients (Wesley,
2009; Bommer et al., 2002; Rolt, 1979).
Soils are the oldest and most complex engineering materials that usually take up
about 70% of cost in road construction projects (Budhu, 2011; O’Flaherty, 2002). As
the principal road-making material, suitable local soils for earthworks are often
scarce and unavailable within economic haul distances from the road corridor
(Qayoom et. al., 2020; Johannessen, 2008). The red clay soil is abundant, reasonably
strong and stable but it is considered a marginal material in road construction due to
its unusual properties and unpredictable behavior (Elsharief et al., 2013; Wesley,
2010; Waweru et al., 1998; Northmore et al., 1992a). Additionally, soils are non-
renewable natural resources critical for our existence but which today’s society has
exploited in many ways in an unsustainable manner (Budhu, 2011; Hazelton &
Murphy, 2007). In this regard, soil stabilization is any technique employed to
promote the more efficient and sustainable use of locally available soils in road
construction (Mwaipungu & Allopi, 2014; Cook et al., 2013; Foster & Briceño-
Garmendia, 2010).

53
According to Johannessen (2008) and Wilmot (2006), soil stabilization uses a wide
range of techniques to improve properties of almost any soil and obtain a high
quality product that meets certain performance requirements. Generally, soil
stabilization is not only cost effective but it also reduces demand on resources, land
degradation and carbon emission (Holt, 2010; Vorobieff & Murphy, 2003; AustStab,
2002). However, the quality of treated soil is governed by soil type, its composition
and mineralogy, and the stabilization technique employed (Guyer, 2011; Arora,
2004; AustStab, 2002). Success of soil stabilization highly depends on testing and
verification that a soil is treatable in an economic manner (AustStab, 2002). The
selection of method of stabilization is a preserve of the engineer but it is dependent
upon the known characteristics of a soil, and on intended use and cost of the treated
material (Guyer, 2011; Little, 2009).
2.7 Theoretical Review of Past Studies on Red Clay Soil
A considerable body of knowledge exists on geotechnical properties of tropical red
clay soils, gathered from research activities conducted in several countries of the
SSA, South East Asia, and Latin America. In Kenya, such works have been
concentrated on the mineralogy, the abnormal behavior in some properties, and on
suitability of the soils as a construction material for embankments notably earth dams
covered by Terzaghi (1958), Dixon and Robertson (1970), and Bruggemann and
Gosden (2004). The results have shown that engineering properties of red clay soils
vary according to the nature of the parent rocks and local climatic regime, and that
the soils are of fair quality as raw materials for road construction (Kamtchueng et al.,
2015; Smart, 1973). According to Gidigasu (1991), however, transport and road
research in the tropics has received relatively little attention, and hence stabilization
of the red soils has been investigated to an even more limited extent. A
comprehensive review on this subject could therefore not be adequately prepared
from a handful of relevant past studies available.
Wesley (2009) indicated that red clay soils may be referred to as lateritic soils but he
cautioned that they should not be confused with the crusty laterite (locally known as
murram) itself. The two soils have different geological history, characteristics and

54
local variations but only share a common red color. In this regard, investigative
results from the widely researched laterite were considered to be inapplicable here.
Thus, the following is an attempt to give a brief summary on past research findings
by different researchers on red clay soils:
Waweru et al. (1998), Foss (1973) and Rolt (1979) are among many researchers
who worked on red clays and established that the soils in Kenya are found
between altitudes of 1200 and 2500 metres above sea level in areas like Nyeri
County with relatively high rainfall, good drainage conditions, fertile soils and
dense population densities.
Wesley (2009), Bruggemann and Gosden (2004), Foss (1973), Coleman et al.
(1964), and Terzaghi (1958) found red clay soil to contain 70-100% clay
minerals, principally 45-60% halloysite or kaolinite of kaolin group weathered
from feldspars and 14-23% iron oxide. Depending on humidity, halloysite may
be present as hydrated halloysite or metahalloysite, and iron oxide as goethite
(iron hydroxide) or haematite. The remainder is made up of small fractions of
goethite, gibbsite, and feldspars like orthoclase, plagioclase and microcline.
Xue et al. (2020), Elsharief et al. (2013), West & Dumbleton (1970), Coleman et
al. (1964), and Newill (1961) found the soil to have 12-82% clay, up to about
30% silt and 2-3% unweathered rock fragments as sand particles, specific surface
area of 90-100 m2/g and clay activity of 0.29-1.14 for soils containing kaolinite.
With an exception some Malaysian soils, red clay soil classifies as silt of high
plasticity (MH) and often plots abnormally below the A-line on plasticity chart.
Xue et al. (2020), Chen and Lu (2015), Brink (2015), Bruggemann & Gosden
(2004), Waweru et al. (1998), Northmore et al. (1992a), and Keter and Ahn
(1986) found red soil to have unusual properties, mainly attributed to the
presence of hydrated halloysite and relatively high amount of free iron oxide.
This includes high resistance to erosion and high slope stability at abnormally
high natural moisture content of 25-97% linked to the porous structure and large
specific area. Others are high index properties with specific gravity of 2.75-2.94,
liquid limit of 48-118%, plastic limit of 29-58%, plasticity index of 11-74%
which is much lower than for sedimentary clay with equal liquid limit.

55
Xue et al. (2020), Elsharief et al. (2013), Bruggemann & Gosden (2004), Dixon
& Robertson (1970), and Terzaghi (1958) further found red soil to have higher
permeability and angle of internal friction and lower compressibility than the
corresponding properties for a sedimentary clay with equal liquid limit. The average
coefficient of permeability was reported to be about 1×10⁻³
cm/sec in natural
state, and 4 ×10⁻⁷
cm/sec in compacted state. The soil has cohesion and an
exceedingly high shear strength with small friction angle ϕ′ of 11-41º and
cohesion c′ of about 26-62 kN/m2.
Wesley (2009), Waweru et al. (1998), Rolt (1979), Smart (1973), Coleman et al.
(1964), and Terzaghi (1958) found red soil to have a well-developed but porous
crumb structure chiefly formed of spongy particles cemented together by free
iron oxides. The soils have low compressibility, a low free swell of about 0.1-
1.7%, low MDD of about 1100-1450 kg/m3 and high OMC of 34-55% due to the
high natural moisture. They difficult to compact due to very poor workability but
are still much easier to handle than would otherwise have been with other clays.
Elsharief et al. (2013), Smart (1973), Coleman et al. (1964), and Terzaghi (1958)
further found the red soil to have low bearing strength when wetted. The low
soaked CBR value ranging 5-13% defines a relatively stable and good material
for subgrade and/or embankment in road construction.
Kamtchueng et al. (2015), Elsharief et al. (2013), Johannessen (2008), and Rolt
(1979) proposed replacement or improvement of the weak natural subgrade
provided by red soils. It was recommended that the simplest and most common
remedial measure for such subgrade is to cover it, or to partially remove and
replace it, with granular material. Nevertheless, it was also established that
quality materials suitable for subbase and base are usually scarce along a road
corridor and are only available in selected areas.
O’Flaherty (2002) revealed that granular stabilization of a soil usually takes 10-
50% of the better blending material. However, findings by Jjuuko et al. (2011)
and Kollaros and Athanasopoulou (2016) on sand stabilization of clayey soils
indicated that this could go as high as 60-80% of the mechanical stabilizer.

56
Newill (1961) and Beshewski (1963) investigated the suitability of stabilizing
Kenya’s red clay soil using Portland cement and hydrated lime. Matalucci (1962)
also successfully stabilized clay soil with gypsum. The report by Beshewski
(1963) is unavailable but the study was reportedly successful and implemented in
Mauritius for similar soils. Nonetheless, Newill (1961) stabilized the soil for base
to lightly-trafficked roads or LVRs using 5-10% Portland cement and hydrated
lime. He found 5% binder content as inadequate in effectively stabilizing the soil
for intended purpose and recommended use of 10% of either stabilizer.
2.8 Research Gap
According to Northmore et al. (1992a) and Morin et al. (1971), red clay soils are
very common throughout the tropical and sub-tropical regions of the world but the
question of quantity and quality tropical materials and their performance in road
pavements has never been fully investigated. In this regard, there has been limited in-
country and regional research on the soil, coupled with the problem of unpublished
and/or inaccessible data held especially by institutions (Gwilliam et al., 2008;
Rossiter, 2004; Dixon & Robertson, 1970). This conditions lead to a lack of
understanding on the character and adequacy of the soil as road construction
material. For this reason, the soil continues to be a major source of concern to many
road engineers and also a hindrance to fast road development (Jjuuko et al., 2014;
Rolt, 1979).
From the only available study on chemical stabilization of Kenyan red clay soils,
Newill (1961) recommended a 10% amount of either Portland cement or hydrated
lime for base course of LVRs. Matalucci (1962) established that lime stabilization of
a highly plastic ‘clay’ soil and that lime is effective in clay-gravel mixes due to a
pozzolanic reaction between lime and the available silica and some alumina in the
clay. He also found that about 2-5% hydrated lime by mass, almost without
exception, markedly increased strength and reduced plasticity of such soil. Similarly,
O’Flaherty (2002) indicated that much of the observed increase in strength in lime-
treated soils is obtained most commonly with about 3% hydrated lime for kaolinitic

57
soils and about 8% for montmorillonitic soils. Thus, the finding by Newill (1961)
was on the higher side and not very economical to use.
Wilmot (2006) affirmed that subgrade soil is an integral part of the road pavement
structure and that many pavement problems are attributed to subgrade rather than on
overlying road pavement layers. In particular, subgrades of red clay soil are
inherently weak and seasonally variable in strength and therefore provide one of the
major challenges with any pavement design in assignment of the design subgrade
strength (Chen & Lu, 2015; DoFEP, 2013; Vorobrieff & Murphy, 2003; Rolt, 1979).
However, Wilmot (2006) opined that almost all subgrades, including those with less
than 8% CBR, can be improved by stabilization to realize a host of structural,
economic and environmental benefits attached to use of stronger and reduced amount
of materials. According to Elsharief et al. (2013), and Vorobieff and Murphy (2003),
subgrade stabilization is much cheaper than to remove and replace a poor subgrade
material. Kollaros and Athanasopoulou (2016) added that subgrade of suitable
material also plays an important role in safe and cost effective pavement
construction.
Due to lack of recent research in stabilization of Kenyan red clay soil for use as
subgrade and subbase of lightly-trafficked roads, the findings by Newill (1961),
Matalucci (1962) and O’Flaherty (2002) provided the research gap for this study. In
this respect, performance of red clay soil both as subgrade and subbase of these low-
volume roads was enhanced by a combination of granular and chemical stabilization.
At first, O’Flaherty (2002) and Cook et al. (2001) were uncertain on suitability of
granular stabilization for highly plastic soils like red clay soil but Johannessen (2008)
later opined that it is more feasible to improve properties of local soils by mixing
rather than import materials from far away. This led Kollaros and Athanasopoulou
(2016) and Jjuuko et al. (2011) to successfully perform sand stabilization of clayey
soils. Pegged on this success with many practical benefits, this study tapped on
plasticity, cohesion and particulate size of red soil for bonding and filling into the
natural gravel skeleton. with Its high shear strength would further be enhanced by
interlock of the angular and tougher gravel that also acts as strong skeleton to the
finer soil to produce a a tight, dense and stronger matrix (O’Flaherty, 2002).

58
According to AustStab (2002), type of binder selected is of primary concern as it has
its own unique benefits and also impacts on project cost benefits. Thus, lime was the
preferred binder as it is cost effective and very efficient in stabilizing fine and highly
plastic soils and even soil-gravel admixtures. It also has long-lasting structural and
environmental benefits in a road project. Crack development is a source of weakness
and the beginning of pavement failure but lime, unlike cement, produces a more
flexible material less susceptible to cracking (Holt, 2010; NLA, 2005).
2.9 Conceptual Framework
According to Jabareen (2009) and Miles and Huberman (1994), conceptual
framework is usually a visual presentation like a diagram or flowchart that provides
an outline and flow of a study. As a mind map or blueprint, it forms the essence,
heart or foundation of a given study by explaining the main things to be studied
(concepts or variables) and the presumed relationship among them, and also by
providing an interpretative approach to reality rather than offering a theoretical
explanation. Nevertheless, the same authors concluded that conceptual frameworks
do not provide us with knowledge of hard facts due to their indeterminist in nature
and neither do they enable us to predict an outcome!
Figure 2.18 represents the conceptual framework for this study that undertook to
stabilize red soil for use in subgrade and subbase layers of a rural road. Thus, the
effectiveness of natural gravel and hydrated lime as stabilizers was investigated in a
two-stage laboratory process. The first was on the physical and chemical properties
of red soil, natural gravel and hydrated lime. The second stage was on select physical
and mechanical characteristics of the soil-gravel-lime admixtures as implied by the
vertical arrow in Figure 2.18 under ‘independent variables’. The test results or output
were then checked for compliance with local specifications for road construction
materials.

59
INDEPENDENT PROCESS DEPENDENT
VARIABLES VARIABLES
Figure 2.18: Conceptual framework for the study
Red Soil, Gravel
and Lime
Red soil soft,
fine, highly
plastic and
cohesive.
Natural gravel
hard, granular,
and non-plastic.
Hydrated lime
fine, alkaline,
caustic and non-
toxic chemical.
Admixture
Strength
Strength
Aggregate CV
Aggregate IV
CBR Strength
Soaked Swell
Effects
Higher Toughness
Higher Strength
Reduced Swell
More Durable
Lab Testing
Physical Properties
o Index tests
Chemical Properties
o XRF
o XRD
o Carbon
Material Properties
Physical
Specific Gravity
Particle Size
Consistency Limits
Free Swell Index
Clay Activity
Chemical
Element Composition
Clay Mineralogy
Organic Matter
Admixtures
(Soil + Gravel +
Lime)
Red soil is of low
compressibility
with low density
and low strength.
Natural gravel is
tough with high
density and high
strength.
Hydrated lime is
cementitious
compound of low
density with
exothermic
reaction in water.
Compacted Admixture
Compaction
Max Dry Density
Opt Moisture Cont
Design Lime
Effects
Lower Plasticity
Higher Density
Higher Stiffness
More Stable
Stabilization and
Testing
Soil Stabilization
o Mechanical (red
soil + gravel)
o Chemical (red soil
+ gravel + lime)
Lab Testing
oConsistency
oCompaction
oToughness
oBearing Strength

60
CHAPTER THREE
MATERIALS AND METHODS
3.1 Research Design
Research design is a practical framework that deals with one of many possible paths
used to ‘answer’ the research questions, as outlined in section 1.4. The tool is
developed in an iterative process to provide critical information and insights required
for the task. Figure 3.1 shows the research design framework for this study.
Figure 3.1: Research Design Framework
Quantitative Research Approach
Case Study – Nyeri County
Empirical Knowledge – Low on Stabilized Red Soil
Data Measurement and Collection
Methodical Techniques (observation, experimental); Frequency = 3
Materials Sampling
Type; Source; Technique; Self
Physical Properties
Visual Observation
Moisture Content
Specific Gravity
Particle Size Distrib.
Atterberg Limits
Soil Activity
Free Swell
Chemical Properties
Composition
Mineralogy
Strength Properties
Aggregate Crushing
Value (ACV)
Aggregate Impact
Value (AIV)
California Bearing
Ratio (CBR)
Data Analysis and Correlation
Narrative; Correlations - primary and secondary data
Conclusions and
Recommendations
Practical and Theoretical
Compaction Properties
Proctor Compaction
(MDD & OMC)
Modified Compaction
(MDD & OMC)
Design Lime Content
2 1 3

61
3.2 Materials Acquisition and Preparation
The red soil used in this study was obtained from a freshly opened building site about 13
km by road south of Nyeri Town in Othaya area of Nyeri County. Similarly, the natural
gravel was obtained from a commercial quarry situated about 10 km by road north of
Nyeri Town at Nyaribo trading centre. Both the red soil and natural gravel were taken as
bulk samples but at different depths of about 1.50m and 20m, respectively, from the
ground level. These depths were necessary to ensure that the soil samples were fairly
representative of similar red soils and natural gravel. Care was also taken to avoid any
contamination by the deleterious organic matter and to preserve field moisture levels,
the shape and distribution of particles (Smoltczyk, 2003). The hydrated lime was
obtained commercially as Rhino Lime manufactured and packed in 25 kg bags by the
Athi River Mining (ARM) of Nairobi. The manufacturer classified the high calcium
lime (CL) as CL 60 and recommended it for soil stabilization and road construction,
among other uses.
According to Day (2010), it is risky to put blind faith in laboratory tests, especially
when they are few in number. Thus, all laboratory test specimens were prepared in
triplicate (3 No) mainly from air-dried bulk samples. Other test specimens for soil
admixtures were prepared by blending the red soil with natural gravel at step
percentages of 0, 20, 40, 60, 80 and 100% tested without or with a predetermined
amount of hydrated lime. Distilled and tap water was also used where required.
3.3 Materials Physical and Chemical Characteristics
Information on the physical and chemical characteristics of materials used in the
study was obtained from the following two sources:
1) Visual examination during time of sampling in the field, and
2) Laboratory testing.
3.3.1 Visual Examination
According to Wesley (2010), the role of observation in understanding and evaluating
residual soils cannot be overemphasized. Some of the following visual examinations
were therefore considered during sampling of the red soil and natural gravel (Budhu,
2011; Venkatramaiah, 2006; Smoltczyk, 2003; Whitlow, 1995):

62
i) The natural color, feel and smell.
ii) Apparent consistency at field moisture content like very soft, soft, firm, stiff,
hard, crumby.
iii) Compactness instance loose, dense, or slightly cemented that is used for
estimation of field strength.
iv) Degree of weathering in newly exposed soil deposits such as unweathered or
slightly-, moderately-, highly- and fully-weathered.
v) Structure or manner of arrangement and state of aggregation of soil grains
such as homogenous (one in color and texture), inter-stratified (alternating
layers or bands of bedding planes), intact (non-fissured), or fissured
(direction, size and spacing).
vi) Texture or apparent particle size, shape and grading of the soil like flaky,
well-rounded, rounded or angular, and sub-rounded or sub-angular; well-
graded, poorly-graded or uniform/gap-graded.
3.3.2 Laboratory Tests
The laboratory tests were carried out mainly in accordance with procedures outlined
in British Standards [BS] 1377 (1990) and BS 1924 (1990) for the natural (RGN) and
lime-treated (RGT) soil admixtures respectively. The following types of laboratory
tests were conducted:
1) Physical tests that consist of index tests which are the most basic laboratory
tests like moisture content, specific gravity, particle size distribution, Atterberg
limits, and also clay activity and free swell index (Day 2010).
2) Chemical tests that comprised the XRF and XRD tests for chemical and
mineralogical composition.
The free swell index was conducted in accordance with the method proposed by
Holtz and Gibbs (1950). The XRF and XRD tests require properly trained personnel,
extreme care, and specialized laboratories. They were therefore carried out in Nairobi
at the State Department of Mines and Geological and at ICRAF respectively.
3.3.2.1 Moisture Content
(a) Experimental Setup

63
The moisture content, sometimes referred to as water content, was determined by the
conventional oven-drying or definitive method in accordance with Clause 3 of BS
1377-2:1990 and Clause 1.3 of BS 1924- 2:1990. This gravimetric method for
moisture content was carried out on small specimen of at least 30g, representative of
either field or laboratory condition. The specimen was dried for at least 12 hours
using in an electric drying oven capable of maintaining a temperature of 105±5°C.
(b) Data Collection and Analysis
Water content was determined by gravimetric method as the ratio of water in the soil
(Mw) to that of the dry soil particles or solids (Ms), as shown in Equation 3.1 thus
(BS 1377, 1990):
Moisture Content, 100
cb
ba
s
w
MM
MM
M
Mw (3.1)
where Ma = Mass of tin + wet soil specimen (g)
Mb = Mass of tin + oven-dry soil specimen (g)
Mc = Mass of moisture content tin (g)
Moisture content is often as expressed as a percentage and was reported to the
nearest 0.1%.
3.3.2.2 Specific Gravity
(a) Experimental Setup
The specific gravity of soil solids was determined by the small 100 ml glass
pycnometer (density bottle) method as outlined in Clause 8 of BS 1377-2:1990. The
method used 100g of soil particles finer than 2 mm from oven-dried specimen; any
particles larger than this were first crushed and passed through the 2 mm sieve.
Distilled water was also used but kerosene or white spirit is often preferred where
soils contain soluble salts.
(b) Data Collection and Analysis
The specific gravity of the soil solid particles was determined as shown in Equation
3.2 thus:
Specific Gravity, 2314
12
MMMM
MMGs
(3.2)

64
where M1 = Mass of empty density bottle (g)
M2 = Mass of bottle + oven-dry soil (g)
M3 = Mass of bottle + soil + water (g)
M4 = Mass of bottle full of water (g)
According to Smith (2014), Day (2010) and Craig (2004), the specific gravity is
numerically equal to particle density (ρs). The two parameters are often reported to
two decimal places and are related as represented by Equation 3.3 thus:
w
s
ws
ss
V
MG
(3.3)
3.3.2.3 Particle Size Distribution
(a) Experimental Setup
Grading for particle size distribution was performed on the red clay soil and natural
gravel only as outlined in Clause 9 of BS 1377-2:1990. Depending on nominal
particle size of a soil, the definitive wet sieving and sedimentation methods were
applied. The sieve analysis method was generally used on soil particles greater than
75 µm (or 0.075 mm) whereas the hydrometer analysis was used on particles finer
than this size. At least 200g-4kg of oven-dried soil was used for sieve analysis and
about 50g of soil passing 2mm was used for sedimentation analysis. The sieving and
sedimentation methods are illustrated in Figure 3.2.
Figure 3.2: Sieve stacking and hydrometer set for soil grain size analyses
(Source: Day, 2010)

65
(b) Data Collection and Analysis
For sieve analysis, the percent finer or passing by dry weight was calculated using
Equation 3.4 as follows (Day, 2010):
S
DS
M
RP 100100 (3.4)
where P = percent dry soil passing a given sieve size
RDS = cumulative amount of dry soil retained on the sieve (g), as total mass on
sieve and all coarser sieves (g).
Ms = dry mass of the soil at the start of the test (g)
In sedimentation analysis, particle size for each corrected hydrometer reading and its
corresponding percent finer or passing by initial dry weight of soil specimen was
calculated on the basis of Stokes Law that assume spherical soil particles (Day,
2010).
The combined results for sieve and sedimentation analyses – where applicable –
were plotted as a smooth curve on the conventional semi-logarithmic graph with the
sieve or particle size as abscissa on a logarithmic scale, and the percentages finer as
ordinate on an arithmetic scale (Murthy, 2012; O’Flaherty, 2002; Smoltczyk, 2003).
Certain grading characteristics proposed by Hazen (1893) and known as the
uniformity coefficient (Cu) and the coefficient of curvature (Cc) were then computed
using Equations 3.5 and 3.6 thus:
Uniformity coefficient, 10
60
D
DCu (3.5)
Coefficient of curvature,
1060
2
30
DD
DCc
(3.6)
where D10, D30, and D60 = particle diameters for soil mass finer than or passing 10,
30 and 60 per cent, respectively.
3.3.2.4 Consistency Limits
(a) Experimental Setup
The consistency limits were formulated by Atterberg (1911) and comprise the liquid
limit (LL), the plastic limit (PL), linear shrinkage (LS) together with their related

66
derivatives like plasticity index. All the tests were carried on the fraction of air-dry
soil or admixture passing through the 425 μm (or 0.425 mm) sieve. About 300 g of
this material was taken and tested in accordance with either BS 1377- 2:1990 or BS
1924-2:1990 for natural and treated specimens, respectively.
i) Liquid Limit
The liquid limit test was determined by the definitive cone penetrometer method as
illustrated in Figure 3.3 and in accordance with Clause 4 of BS 1377-2:1990 and
Clause 1.4 of BS 1924-2:1990.
Figure 3.3: Fall cone penetrometer for liquid limit test
(Source: Smith, 2014)
ii) Plastic Limit
The plastic limit test was determined in accordance with Clause 5 of BS 1377-2:1990
and Clause 1.4 of BS 1924-2:1990 by the only conventional method.
Plasticity Index
The plasticity index (PI) was determined in accordance with Clause 5 of BS 1377-
2:1990. This is a derived parameter based on the results obtained for liquid and
plastic limits.

67
iii) Linear Shrinkage
The volumetric method for shrinkage limit outlined in Clause 6 of BS 1377-2:1990
was skipped due to personal safety and environmental concerns. The alternative one-
dimensional linear shrinkage was determined in accordance with the same clause
using a half-cylinder mold similar to one illustrated in Figure 3.4.
Figure 3.4: Schematic illustration of linear shrinkage mold
(Source: Whitlow, 1995)
Budhu (2011) demonstrated that shrinkage limit of a soil can be estimated from its
liquid limit (LL) and plasticity index (PI) using Equation 3.7 thus:
Shrinkage Limit, 5.434.46
5.454.46
PI
LLSL (3.7)
(b) Data Collection and Analysis
i) Liquid Limit
Liquid limit was determined from a linear graph as moisture content at 20 mm
penetration of a standard cone.
ii) Plastic Limit
Plastic limit of soil was determined as the average moisture content of crumbled
pieces.
iii) Plasticity Index
Plasticity index (PI) was computed as the numerical difference between the reported
liquid and plastic limits of the soil. It was obtained in percentage form using
Equation 3.8 thus:
Plasticity Index (%), PLLLPI (3.8)

68
iv) Linear Shrinkage
Linear shrinkage, expressed as a percentage, was computed as the ratio of change in
length to initial specimen length of soil using Equation 3.9 thus:
Linear shrinkage, 1000
0
L
LLLS
f (3.9)
where L0 = Initial wet length of specimen (= internal length of mold)
Lf = Final oven-dry length of specimen
3.3.2.5 Soil Activity and Free Swell Index
(a) Experimental Setup
i) Soil Activity
Soil activity is an index that represents plasticity of the entire soil mass due to
presence of clay minerals (Arora, 2004). It is derived in the manner introduced by
Skempton (1953) using both the plasticity index of the soil and its graded percentage
by weight of particles less than 2 µm.
ii) Free Swell Index
Fine soils are susceptible to volume change in the presence of water and this depends
on amount of fines and type of clay mineral present (Budhu, 2011). Free swell index
is an indicator to volume but its determination is not covered by some of the
international standards institutions like the British Standards Institution (BSI) and the
American Society for Testing and Materials (ASTM). It was determined in
accordance with the test procedure proposed by Holtz and Gibbs (1956). About 60 g
of soil specimen passing through 425 μm sieve was obtained from air-dry soil. The
test was conducted in duplicate using distilled water and kerosene. Exactly 10 cm3 of
the soil specimen was carefully poured into 100 cm3 graduated glass measuring
cylinder filled with either distilled water or kerosene. The final volume of settled soil
in either case was measured after 24 hours.
(b) Data Collection and Analyses
i) Soil Activity

69
The activity of soil was derived from information on particle size and consistency of
a soil. It was obtained as the ratio of plasticity index to the percentage by weight of
soil particles less than 2µm (or clay), as illustrated in Equation 3.10 thus:
Activity, %Clay
PIA (3.10)
However, the expression for activity was modified by Seed et al. (1962), especially
for artificially prepared specimen, to Equation 3.11 thus:
Modified Activity, nClay
PIAm
(3.11)
where n = 5 for natural soils, and n = 10 for artificial mixtures.
ii) Free Swell Index
Holtz and Gibbs (1956) defined the free swell index as the difference in volumes of
soil in water and in kerosene expressed as a ratio to volume of soil in kerosene. Thus,
free swell index is expressed by Equation 3.12 as follows:
Free Swell Index = 100
k
kw
V
VV (3.12)
where Vw = Final volume of soil in water (cm3
or ml), and
Vf = Final volume of soil in kerosene (cm3 or ml)
3.3.2.6 Chemical and Mineral Composition Tests
(a) Experimental Setup
i) Chemical Composition
The XRF test was conducted using a handheld automatic machine type ‘Bruker,
model S1 Titan’ in accordance to standard operating procedures. The machine used
test specimens of about 20 g in powder form. Thus, red soil and lime were simply
passed through an appropriate sieve size while the gravel was converted into a fine
powder by passing it through a jaw-crusher and milling machine.
ii) Mineralogical Composition
The XRD test was carried out using a computerized ‘D2 Phaser Diffractometer’
according to its standard operating procedure. Accordingly, the total and organic

70
carbon for red soil were determined using the Flash 2000 Elemental Analyzer
manufactured by ‘Thermal Scientific’.
(b) Data Collection and Analyses
i) Chemical Composition
The automatic XRF machine type ‘Bruker model S1 Titan’ tested and analyzed
specimens internally. It therefore displayed the results on a screen and also stored the
same in memory for retrieval and printing but only printed copies were provided.
ii) Mineralogical Composition
The complete mineralogical composition results for the red soil were provided in a
tabulated form and also as a diffractogram plot.
3.4 Materials Compaction Characteristics
3.4.1 Materials
The test specimens comprised the neat red soil and also soil-gravel admixtures at step
percentages of 20, 40, 60, 80 and 100%. Other specimens consisted of soil-gravel
admixtures treated with predetermined amount of hydrated lime. Appropriate amount
of tap water was also used during mixing.
3.4.2 Laboratory Tests
The laboratory tests comprised the following:
1) Standard compaction test on natural red soil for lack of the more common
vibrating hammer,
2) Modified compaction test on the natural red soil and on stabilized soil-gravel-
lime admixtures, and
3) Design lime content for lime-treated admixtures through compaction.
3.4.2.1 Compaction Tests
(a) Experimental Setup
Two methods of compaction were carried out in accordance with Clause 3 of BS
1377-4:1990 for the neat soil-gravel admixtures and Clause 2.1 of BS 1924-2:1990
for lime-treated admixtures. Figure 3.5 illustrates the details of standard or Proctor

71
compaction. Modified compaction uses the same mold but a 4.5kg rammer to
compact material into 5 layers.
Figure 3.5: Apparatus for and standard method of compaction
(Source: Smith, 2014; Budhu, 2011; Johannessen, 2008)
(b) Data Collection and Analysis
The bulk density of compacted specimen was computed using Equation 3.13 thus:
Bulk Density, V
MMw
12 (3.13)
where M2 = Mass of mold + compacted wet specimen (Mg)
M1 = Mass of empty mold (Mg)
V = Internal volume of mold (m3)
The dry density was determined using Equation 3.14 thus:
Dry Density, ww
ww
d
100
100
1001
(3.14)
where ρw = Bulk density of compacted specimen (Mg/cm3)
w = Moisture content of specimen
The dry density was plotted against moisture content to obtain a smooth compaction
curve for each soil admixture. The readings at the apex of the curve were taken as
MDD and OMC for the soil.
3.4.2.2 Optimal and Design Lime Content
(a) Experimental Setup

72
Based on the premise that a given initial lime content does not necessarily produce
the utmost MDD, the procedure proposed by Hudson (1997) was used. Thus,
modified compaction tests were conducted about the laboratory MDD for lime
treated soil admixtures at ICL ± 2% for the plasticity method as described in section
2.5.2.3.
(b) Data Collection and Analysis
The MDD for each of the three points was determined and the results plotted against
the lime content. Strength of soil normally increases with density and hence the lime
content was taken as the amount that produced the highest MDD. The design lime
content was adjusting by a small margin of 0.5-1% to cater for field tolerances
(O’Flaherty, 2002; AustStab, 2002) and was reported to the nearest 0.1%.
3.5 Materials Strength
3.5.1 Materials
The test specimens comprised the neat red soil and also soil-gravel admixtures at step
percentages of 20, 40, 60, 80 and 100%. Other specimens consisted of soil-gravel
admixtures treated with predetermined amount of hydrated lime. Appropriate amount
of tap water was also used during mixing.
3.5.2 Strength Tests
The following mechanical laboratory tests were conducted to determine different
types of strength of the materials:
1) The Aggregate Crushing Value (ACV) test on natural gravel,
2) The Aggregate Impact Value (AIV) test on natural gravel, and
3) The CBR on soil-gravel-lime admixtures.
3.5.2.1 ACV Test
(a) Experimental Setup
The ACV test was carried out on clean and oven dry aggregate passing 14 mm sieve
and retained on 10 mm sieve in accordance with the procedure outlined in BS 812-
110:1990.

73
(b) Data Collection and Analysis
The mass of aggregate filling the mold was determined. The total mass of crushed
material passing 2.36 mm sieve was also obtained. Thus, the ACV value was
determined and expressed as a percentage using Equation 3.15 thus:
Aggregate Crushing Value, 1001
2 M
MACV (3.15)
where M1 = Mass of oven-dried aggregates filling the mold (g)
M2 = Mass of crushed fraction passing 2.36 mm sieve (g)
The average ACV was reported to the nearest whole number.
3.5.2.2 AIV Test
(a) Experimental Setup
The AIV test was carried out on clean and oven dry aggregate passing 14 mm sieve
and retained on 10 mm sieve in accordance with the procedure outlined in BS 812-
112:1990. The AIV testing machine is shown in Plate 3.1.
Plate 3.1: The AIV testing machine

74
(b) Data Collection and Analysis
The mass of aggregate filling the steel cup was determined. The total mass of
impacted material passing 2.36 mm sieve was also taken. Thus, the AIV value was
determined and expressed using Equation 3.16 thus:
Aggregate Impact Value, 1001
2 M
MAIV (3.16)
where M1 = Mass of oven-dried aggregates filling the cup (g)
M2 = Mass of impacted fraction passing 2.36 mm sieve (g)
The average AIV was reported to one decimal place.
3.5.2.3 CBR Test
(a) Experimental Setup
The CBR test was carried out on all types of soil admixtures in accordance with
Clause 7 of BS 1377-4:1990 for natural soil admixtures and Clause 4.5 of BS 1924-
2:1990 for lime-treated soil admixtures. The specimen was allowed to mature and
then soaked in water as shown in Figure 3.5, and its swelling monitored.
Figure 3.6: Schematic illustration of CBR soaking assembly
(Source: BS 1377, 1990)

75
(b) Data Collection and Analysis
The forces resisted by, or the load applied on, the compacted material was measured
and recorded against specific plunger penetrations. The load was plotted against
penetration and corrections made to this stress-strain curve (Jjuuko et al., 2014) where
necessary. The arbitrary CBR coefficient was then computed at a penetration of 2.5
mm and 5.0 mm as the ratio of the applied force to a standard force, expressed as a
percentage according to Equation 3.17 thus:
California Bearing Ratio, 100B
ACBR (3.17)
where A = Penetration load on test specimen (kg)
B = Penetration load on standard sample (kg)
The average CBR was computed at each penetration and the higher of the two values
so obtained was reported as the CBR value for the material (Blake, 1994). Figure 3.7
illustrates the laboratory setup for testing a specimen for CBR.
Figure 3.7: Schematic illustration of CBR test assembly
(Source: Budhu, 2011)

76
CHAPTER FOUR
RESULTS AND DISCUSSION
4.1 Material Properties of Red Soil-Gravel-Lime Admixtures
The characteristics of red soil, natural gravel and hydrated lime, as outlined in
section 3.3, are presented under the following sub-headings: – Field Observations,
Physical and Chemical Properties, and Classification.
4.1.1 Field Observations
Visual examinations, as discussed in section 3.2.1, were carried out, without any
instrument or laboratory facility, to identify soil in the field (Das, 2011). Such
observations that define the mass characteristics of a natural soil deposit were made
on the two residual soil deposits at the point and time of sampling. The observations
are summarized in Table A7.3 of Appendix I.
According to Craig (2004) and Smoltczyk (2003), mass characteristics describe the
in-situ soil structure and generally indicate the likely behavior of soil. These
characteristics can influence the engineering behavior of soil to a considerable
extent. More specifically, soil color and smell are very important in identifying
different types of soil just like its texture does (Day, 2010; Venkatramaiah, 2006).
Nevertheless, mass characteristics of a soil are not frequently used in geotechnical
engineering since they only qualify as secondary material characteristics.
4.1.1.1 Red Soil
Based on visual examination, the clay soil had a light reddish-brown color when dry,
and a granular appearance with particles less than about 10 mm all that agreed with
findings by Gichaga et al. (1987), Coleman et al. (1964) and Newill (1961). The soil
was fully weathered, homogeneous in color and texture and also had a firm, dense
and unstratified a structure. It lacked smell and vegetative matter when freshly
exposed which were indicative of pure and non-organic subsoil. Moreover, the red
color was typical of haematite probably derived from basalt rock, pointing to an
oxidized soil as presented by Coleman et al. (1964) and Budhu (2011), respectively.
77
4.1.1.2 Natural Gravel
The natural gravel lacked smell when fresh and was predominantly grey in color but
with a greenish tinge. The gravel was moderately-weathered and exhibited an inter-
stratified structure and a well-marked columnar jointing and hackly fracture when
freshly loosened. Its visual examination revealed a hard and slightly cemented,
material composed of coarse-grained and very angular particles. According to Budhu
(2011), the grey color and lack of smell suggested an unoxidized and non-organic
material respectively. The greenish tinge pointed to origins in the olivine basalts of
Laikipian Series (Hinga et al., 2019; Fairburn, 1966; Shackleton, 1945).
4.1.1.3 Hydrated Lime
The hydrated lime was obtained commercially as a fine white powder; the color
indicated a calcareous material as suggested by Budhu (2011). From the packaging,
it was found to be comparatively lighter in weight than cement. It however proved to
be irritating when inhaled especially during mixing with dry soil-gravel admixtures.
4.1.2 Physical Properties
The physical properties were determined experimentally as outlined in section 3.3.2
and constitute the principal material characteristics of a soil. They represent
laboratory tests used to identify type soil and are well known as index properties that
include water content, specific gravity, gradation and Atterberg limits. These
parameters are also used to design foundations like subgrade and to determine the
use of soils as a construction material (Budhu, 2011).
4.1.2.1 Moisture Content
Water forms a fundamental part of natural soil and often contain dissolved minerals
(Budhu, 2011; Day, 2010) The average moisture content for the bulk samples were
obtained as 23.5% for the red soil and 11.7% for the natural gravel. In this regard, the
bulk samples were extracted in a fairly dry state while the low values suggest that the
soils were largely inorganic. Also known as water content, the moisture for red soil
also fell below the high field moisture contents for tropical volcanic soils of 60-100%
reported by Rollings et al. (2002).

78
According to Northmore et al. (1992b) and Day (2010), moisture content of a soil
represents the weight of free water contained in a soil sample and can vary from
essentially 0% for dry soil up to 1200% for organic soil such as fibrous peat. Water
also has a greater effect on the engineering properties of the soil than any other
constituent (Budhu, 2011). According to Gianfrancisco and Jenkins (2000) and
Terzaghi (1958), water content provides valuable information on possible problems
like foundation settlement and compaction of earthworks.
4.1.2.2 Specific Gravity
The specific gravity is a dimensionless number that relates the intrinsic density of
solid mineral particles present in a soil to the density of water (Smith, 2014; Day,
2010; Northmore et al., 1992b). The average specific gravity for the red soil, natural
gravel and hydrated lime were obtained as 2.79, 2.73 and 2.35, respectively. Specific
gravity for blended soil-gravel admixtures (denoted as RGN) ranged from 2.79-2.73
whereas that of soil-gravel-lime admixtures (denoted as RGT) ranged from 2.77-
2.71. Figures 4.1 represent the specific gravity results and are also tabulated in Table
A7.8 of Appendix IV.
Figure 4.1: Variation in specific gravity with addition of gravel and lime
Specific gravity generally decreased with increasing gravel content and with addition
of hydrated lime in soil-gravel admixture. It, however, declined markedly after about
60% gravel content as the soil-gravel-lime admixtures became more gravelly in
character. Results for majority of soil-gravel-lime admixtures were above the normal
range of 2.55-2.75 spelt out by Smith (2014) and Day (2010) for most soils. This
range generally indicates an organic matter and metallic material at its lower and
higher ends, respectively. With least value of 2.71, all the admixtures classified as
2.70
2.72
2.74
2.76
2.78
2.80
0 20 40 60 80 100
Gravel Content in Red Soil (%)
Sp
ecif
ic G
ravit
y
RGN
RGT

79
metallic materials. Specific gravity of 2.79 for red soil agreed with values reported
by Coleman et al. (1964) and Newill (1961) for similar soils. The specific gravity for
hydrated lime of 2.35 lay slightly above its normal range of 2.0-2.2 given by Little
(1995) but probably due to manufacturing and/or laboratory limitations.
According to O’Flaherty (2002), specific gravity depends mainly on soil mineralogy
but is independent of unbound moisture content and voids It. is numerically equal to
particle density which is defined as the average mass per unit volume of the solid
particles with units as Mg/m3. It is also required for design and construction purposes
particularly in the computation and interpretation of certain test results like
sedimentation and voids ratio, respectively (Blake, 1994; Northmore et al., 1992b).
In practice, specific gravity of 2.65 for quartz as the most abundant type of soil
mineral is commonly used but a slightly higher value of 2.70 is often assumed for
common clay particles. Kamtchueng et al. (2015) added that specific gravity is
proportional to the degree of laterization of tropical soils and can be applied to
determine the extent of chemical weathering of such soils. Thus, the red clay soil
with a higher specific gravity was apparently more evolved or weathered than the
natural gravel, as detailed in section 4.2.2.6. Moreover, Gidigasu (1974) indicated
that specific gravity is useful in rating the field performance of lateritic aggregate as
road construction material. Thus, soil-gravel-lime admixtures with specific gravity
above 2.85 were rated as ‘excellent’, those within 2.85-2.75 bracket as ‘good’, and
those within the range of 2.75-2.58 including natural gravel as ‘fair’. Nevertheless,
existing design standards are silent on possible specific gravity values for different
local road construction materials.
4.1.2.3 Particle Size Distribution
The particle size distribution of a soil is best presented as a graphical curve that
actually defines the relative amounts of clay, silt, sand and gravel within the soil
(Hazelton & Murphy, 2007; Craig, 2004; Smoltczyk, 2003). According to Sherwood
(1967), results are then reported in terms of percentage clay, silt, sand and gravel
particles in the soil. As shown in Table A7.3 of Appendix I, red soil comprised 34%
clay, 20% silt, 44% sand and 2% fine gravel that described the soil as ‘silty clayey
SAND with some fine gravel’. Similarly, the natural gravel consisted of 1% silt, 10%

80
sand and 89% gravel described as ‘sandy GRAVEL with trace silt’. Moreover, slope
and shape of the grading curve is described by certain geometric values known as
uniformity (Cu) and curvature (Cc) coefficients. The effective size (d10) was
established for the gravel only as 2 mm and hence its Cu and Cc coefficients were
obtained as (˃5) at 9.2 and within 1-3 at 2.3, respectively, for a well-graded soil. The
grading curves for the red soil and natural gravel are presented in Figure 4.2 and
evaluation of gravel as an aggregate in Figure A7.1 of Appendix I.
Figure 4.2: Combined grading curves for red soil and gravel
A grading curve is not only useful in itself as a means of describing a soil but it is
also closely related to many of its geotechnical properties like textural classification,
drainage and compaction (Budhu, 2011; Hazelton & Murphy, 2007; Smoltczyk,
2003). From the shape of grading curves and/or coefficients, both the red soil and
natural gravel were well-graded. Based on the coefficients, the gravel qualified for
use as natural subbase material as specified by MoRPW (1986). Similarly, the soil
satisfied the requirements for maximum particle size of 0.5-10 mm given by MoTC
(1987). Both red soil and natural gravel also met the maximum content of particles
finer than 0.075 mm of 50 and 40%, respectively. Nonetheless, the 34% clay content
of red soil was below the 50-90% reported for similar soils by Sherwood (1967),
Newill (1961) and Terzaghi (1958). They explained that such low clay content and
resultant high silt or sand contents are likely due to errors in the test and not due to
aggregation of soil particles which is eliminated by chemical treatment before soil
testing. At over 80% fines passing 425 µm, the soil far exceeded the specified
minimum 15% required to justify its stabilization with lime according to MoTC
(1987) and Newill (1961). Moreover, the maximum size of 50mm for natural gravel

81
was beyond the 10-15 mm recommended for lime treated materials (MoTC, 1987).
This necessitated the removal of the more coarse particles during soil stabilization to
reduce the amount of sand and fines required to fill the voids in the red soil-gravel
admixture, as reported by Frempong & Tsidzi (1999).
Ejeta et al. (2017) and O’Flaherty (2002) advanced the view that too great an
emphasis should not be placed on achieving the ideal gradation with regard to
blending combinations but rather on obtaining a mixture that is sufficiently dense to
meet stability needs whilst maximizing the use of readily available low-cost soils. In
this respect, the grading curves for red soil and natural gravel served as the respective
lower and upper limits or grading envelopes for all soil-gravel admixtures. The red
soil served as a filler and binder to the cohesionless natural gravel, and aided in
reduction of the voids and permeability and in an increase in the density and strength
of the soil-gravel admixtures (Budhu, 2011; Johannessen, 2008; O’Flaherty, 2002).
The gravel also improved bearing strength of the admixtures through increased
internal friction and particle interlock.
4.1.2.4 Consistency or Atterberg Limits
Atterberg (1911) proposed the consistency limits which generally represent the
plasticity characteristics of the whole soil, referred to as ‘plastic modulus’, and are
considerably affected by moisture content (Day, 2010; Powrie, 2004). Table 4.1
represents results for all soil consistency limits, PI and its associated ICL as
discussed in section 4.3.2.
Table 4.1: Results for consistency limits and initial lime demand
Gravel
Cont. (%)
Natural Admixtures – RGN (%) Treated Admixtures - RGT %)
LL PL PI LS *PM ICL LL PL PI LS *PM
0 74.3 44.2 30.1 15.7 2472 4.60 59.1 47.0 12.0 8.2 986
20 67.3 42.2 25.1 12.4 1669 3.91 54.6 44.0 10.6 7.1 704
40 60.2 38.2 22.0 11.3 1122 3.31 50.4 41.2 9.2 6.2 469
60 53.5 33.8 19.7 10.2 697 2.90 46.4 38.2 8.1 5.1 287
80 46.8 28.8 18.0 9.5 358 2.50 41.5 34.3 7.2 4.1 143
100 41.8 24.2 17.6 8.6 76 2.38 37.9 31.3 6.6 3.3 28
Key: RGN = Natural red soil and gravel admixtures
RGT = Lime treated red soil and gravel admixtures

82
PM = Plastic Modulus = Plasticity Index (PI) × Percent passing 0.425 mm sieve (estimated*)
Consistency of a soil is defined as the degree of its firmness and is therefore a
measure of its resistance to mechanical deformation or flow (Murthy, 2012). The
consistency limits provide a valuable tool for evaluating, characterizing or comparing
and classifying residual soils, and also for indicating the amount and type of clay
mineral present (O’Flaherty, 2002; Wignall et al., 1999). The plasticity index (PI), in
particular, is widely used as a quality-measuring tool for pavement materials.
i) Liquid Limit
The liquid limit is the percentage water content at which the soil flows under its own
weight like a viscous mud, with very little strength (Budhu, 2011; Das, 2011). As
shown in Table 4.1, the liquid limit values decreased with gravel content and lime
ranging from 74.3-41.8% for the RGN soil admixtures and from 59.1-37.9% for the
RGT soil admixtures. The liquid limit for red soil of 74.3% was within the typical
range of 40-100% and above given by Murthy (2012) and O’Flaherty (2002) for clay
soils of volcanic origin. Similar soils within Kenya’s central highlands had recorded
liquid limit in the range of 65-105% as reported by Sherwood (1967), Coleman et al.
(1964), Newill (1961) and Terzaghi (1958). They found the index properties of red
clay soil to be a function of mixing time, and increase with prolonged mixing due to
break down of all aggregations, and to the consequent increase in clay content.
ii) Plastic Limit
Plastic limit is the moisture content at which a soil becomes too dry to exhibit plastic
behavior – the ability to be rolled and molded without breaking apart – when it
becomes friable and crumbly (Budhu, 2011). The respective plastic limit values for
the RGN and RGT soil admixtures shown in Table 4.1 ranged from 44.2-24.2% and
from 47.0-31.3%. The plastic limit for red soil at 44.2% fell within the 35-70% range
for similar red clay soils worked to mixing effect for the liquid limit (Sherwood,
1967; Coleman et al., 1964; Terzaghi, 1958). However, the red soil used in this study
did not pose any difficulty in determination of the plastic limit as reported by Newill
(1961) for the Sasumua red soil where the thread of soil first crumbled at diameters
of about 12 mm but finally crumbled at diameters of 3 mm with continued rolling of

83
the crumbled portions. The plastic limits reduced progressively and the various soil
admixtures gradually converted into the more workable, stronger and crumbly silt
soil but without reaching the non-plastic state as also found by Jawad et al. (2014)
and Morin et al. (1971).
iii) Plasticity Index
Plasticity index is defined as the range of water content over which the soil exhibits
plastic behavior and deforms plastically; it is equal to the numerical difference in
liquid limit and plastic limit (Craig, 2012; Budhu, 2011). The derived PI values for
the RGN ranged from 30.1-17.6% as shown in Table 4.1 and also illustrated in
Figure 4.3. The plasticity index for RGT soil admixtures ranged from 12.0-6.6% and
was linearly related to the amount of clay fraction present as reported by Skempton
(1953). The PI for natural and treated red soil of 30.1% and 12% compared well with
values of 18-56% and 10%, respectively, reported by Sherwood (1967), Newill
(1961) and Terzaghi (1958) for similar clay soils.
Figure 4.3: Variation in PI with gravel and lime stabilizers
Key: PI_N = Plasticity Index of natural red soil and gravel admixtures
PI_T = Plasticity Index of lime treated red soil and gravel admixtures
Plasticity of a soil is the property that allows it to undergo rapid deformation without
rupture, volume change or elastic rebound. It is notable that existing design standards
address the consistency of a soil in terms of its PI and not the liquid and plastic
limits. The addition of gravel and lime to red soil effectively reduce the PI since this
reduced the liquid limit but increased the empirically established plastic limit (Little,
1995). It was evident then that the PI decreased progressively with increasing gravel
0
10
20
30
40
0 20 40 60 80 100
Gravel Content in Red Soil (%)
Pla
sti
cit
y I
nd
ex f
or
Ad
mix
ture
(%
)
PI_N
PI_T

84
content and added lime. The PI also dropped significantly upon the addition of lime
to the soil-gravel admixtures, as it was expected, but this change reduced with
increasing gravel content. In general, the change in PI was more pronounced in soil-
gravel admixtures, and smaller and more regular in lime-treated admixtures. The
results also demonstrated that the hydrated lime was much more effective than
natural gravel in stabilizing the red soil for plasticity.
PI is an indirect measure of clay content and type of clay mineral present in a soil; it
is therefore used to classify clays, to roughly approximate clay content, and to
estimate the strength of a cohesive soil expressed as its CBR (O’Flaherty, 2002;
Sherwood, 1967). This is one of the most common and widely used soil indices,
especially in quality control of road construction materials, to predict the behavior of
a fine soil. According MoRPW (1986) the maximum PI for clayey and silty sands as
well as natural gravel used for subbase in wet areas (with mean annual rainfall
exceeding 500 mm) should be 5-12% and 15%, respectively. Thus, only the RGT
admixtures with PI of less than 15% satisfied these plasticity requirements.
iv) Linear shrinkage
Linear shrinkage is the percentage decrease in the length of a bar of soil dried in an
oven from the liquid limit (Hazelton & Murphy, 2007). From Table 4.1, the linear
shrinkage values for the RGN and RGT admixtures ranged from 15.7-8.6% and from
8.2-3.3% respectively. The RGN admixtures values fell outside the normal range of
2-8% proposed by Budhu (2011) whereas the RGT admixtures were within the
range. The results also demonstrated that linear shrinkage behaved in a manner
similar to that of the PI upon the addition of the two red soil stabilizers. He also
reported that the shrinkage limit is useful for the determination of the swelling and
shrinking capacity of soils. In this regard, the potential volume change of soils can be
deduced from its PI and linear shrinkage as presented in Table A7.8 of Appendix IV.
As a result, majority of the blended soil-gravel admixtures and natural gravel
classified as materials of ‘low’ volume change potential. Notably, red clay soil
classified as a soil of medium volume change potential and therefore requires
cautious use as a foundation for small structures including road pavements.

85
4.1.2.5 Clay Activity and Free Swell Index
Skempton (1953) used the term ‘activity’ to quantify the plasticity of the clay
fraction of a fine grained soil. He indicated that activity is a function of plasticity
index and the quantity of colloidal clay particles present in a soil. To avoid possible
effect of lime on colloidal activity (Ac), the parameter was determined for the RGN
admixtures only. Results for the soil admixtures ranged between 0.37 and 2.1 for the
natural red soil and gravel, respectively, as illustrated in Figure 4.4 and tabulated in
Table A7.8 of Appendix IV. Thus, there was a marked increase in activity of clay
fraction beyond 40% gravel content in RGN admixtures.
Figure 4.4: Variation in colloidal activity of natural soil and gravel admixtures
Clay activity is useful in description and identification of clay minerals, and as a
good indicator of potential shrink-swell problems associated with expansive clays
(Das, 2011). In this respect, the clay fraction in RGN admixtures with up to 70%, 70-
85% and over 85% gravel content was described as ‘inactive’, ‘normal’ and ‘active’,
respectively, as proposed by Skempton (1953) and outlined in Table 4.2.
Table 4.2: Clay activity and relationship with clay minerals and free swell
Clay Description Activity, Ac Clay Minerals Activity, Ac Free Swell (%)
Inactive <0.75 Kaolinite 0.35-0.5 5-60
Normal 0.75-1.25 Illite 0.5-1.3 15-120
Active 1.25-2 Ca-Smectite 0.5-2.0 45-145
Very Active >6 Na-Smectite 4-7 1400-1600
(Source: Budhu, 2011)
Skempton (1953) held that clay activity remains constant when clay of a particular
mineralogy is mixed with coarser material, like the natural gravel. Moreover, he
0.0
0.4
0.8
1.2
1.6
2.0
2.4
0 20 40 60 80 100
Gravel Content (%)
Co
llo
idal
Acti
vit
y (
A)

86
quoted an activity of 0.33-0.46 for kaolinite whose presence was suggested by the
low activity of 0.37 for the ‘inactive or inert’ red clay soil. According to West and
Dumbleton (1970) and Wesley (2009), this is common in residual soils derived from
igneous rocks like basalt where the soils are likely to be fairly coarse-grained with a
small clay fraction as was the case reported in section 4.2.2.3. It is also associated
with the presence of poorly ordered kaolinite along with clay-sized but non-clay
minerals of gibbsite and goethite in the clay fraction. Conversely, natural gravel had
an ‘active’ clay fraction which gave an activity of about 2.
The results for free swell index, also known as differential free swell index, for the
RGN and RGT soil admixtures ranged from 0-2.4% and from 4-12.7%, respectively.
The free swell index for red soil and natural gravel were 0% and 2.4% respectively.
The free swell index results are presented in Figure 4.5 and tabulated in Table A7.8
of Appendix IV. The results show that the values for RGN admixtures were
moderate and fairly low. However, the values for RGT admixtures increased
tremedously upon the addtion of lime with a peak of 12.7% at about 67% gravel
content. This effect of lime suggested a reduction in density of soil admixtures which
was also reflected as a drop in the specific gravity of lime-treated admixtures
presented in Figure 4.1 under section 4.2.2.2.
Figure 4.5: Variation in free swell index with gravel content and lime
Free swell index is an indicator of possible volume change of a soil during shrinking
or swelling. According to Skempton (1953), the significant volume change of a soil
is a function of colloidal activity and depends on amount and type of clay present.
The 0% free swell index for red soil compared well with its free swell of 0.1-1.7%
0
2
4
6
8
10
12
14
0 20 40 60 80 100
Gravel Content in Red Soil (%)
Free
Sw
ell I
nd
ex (
%)
RGN
RGT

87
reported by Waweru et al. (1998). Holtz and Gibbs (1956) reported that soils with a
free swell value below 50% seldom exhibit appreciable volume change even under
light loadings like road pavements. Thus, all the soil-gravel admixtures were
considered to be non-expansive road construction materials.
4.1.2.6 Soil Composition and Mineralogy
According to Jawad et al. (2014) and Little (2009), mineralogical and chemical
composition of a soil is used to assess its CEC and reactivity with the selected
stabilizer. This creates cementitious materials that effectively improve workability,
compressibility, strength and durability of the soil. However, the presence of organic
matter in a soil, even in small proportions, is likely to inhibit the soil reactivity
required for gain in strength by binding a substantial amount of water into the soil.
i) Chemical Composition
The mean chemical composition results obtained by means of XRF method are
tabulated in Table 4.3 for the red clay soil, natural gravel and hydrated lime. The full
chemical analyses results are also shown in Table A7.4 of Appendix II.
Table 4.3: Chemical composition of the red soil, gravel and hydrated lime
Determination Mean Percentage (%)
Red Soil Natural Gravel Hydrated Lime
Silica, SiO2 40.672 50.748 -
Alumina, Al2O3 26.649 13.413 1.858
Iron, Fe2O3 25.396 13.727 0.492
Titanium, TiO2 4.018 3.526 0.058
Sulphide, SO2 0.713 0.379 0.654
Phosphite, P2O2 0.693 1.382 1.180
Manganese, Mn2O4 0.451 0.216 0.023
Calcium, Ca(OH)2 0.429 13.622 95.371
Potassium, K2O 0.226 2.494 -
Zirconium, Zr 0.200 0.070 0.028
Cerium, Ce 0.146 - -
Chloride, Cl 0.078 - 0.110
Total 99.671 99.578 99.774
Total Carbon 0.347 - -
(Courtesy: Department of Mines and Geology, Nairobi)

88
Both red soil and natural gravel consisted of silica as the principal compound at
40.7% and 50.7%, respectively, together with other oxides. The chemical
composition of red soil generally compared well with that of Nyeri clay as presented
under section 2.3.1. That of the hydrated lime was simply 95.4% calcium hydroxide
and 4.6% of other oxides. The calcium hydroxide was equivalent to 72.5% calcium
oxide and it was also noted that the natural gravel and red soil had registered 13.6%
and a mere 0.4% of additional calcium oxide respectively. A trace of organic carbon
was also found in the red soil at 0.35% just like the content reported by Coleman et
al. (1964), Newill (1961) and Terzaghi (1958) for the Nyeri and Sasumua red clays.
The geochemical index or S-S ratio for red soil was 0.78 (<1.33) and 1.87 (range
1.33-2.0) for natural gravel. Thus, the red clay soil classified as a highly weathered
laterite soil after Rossiter (2004) criteria, and in agreement with Nyeri red clay
investigated by Coleman et al. (1964). Similarly, the natural gravel classified as
partially weathered lateritic gravel. Non-lateritic soil has an S-S ratio above 2.0.
According to Robinson and Thagesen (2004), and based on silica content, the red soil
existed predominantly as quartz whose specific gravity is 2.65. With silica content of
less than 55%, the natural gravel classified as ‘basic’ rock which was extrusive and
fine-grained basalt of the Laikipian Series. Sherwood (1967) pointed out that free
iron oxide acts as a cementing agent while carbonates and organic matter may also
bind the soil particles together. However, there were no carbonates in red soil and
organic carbon content was very low. Thus, high iron oxide content was responsible
for aggregation of the red clay soil. Organic carbon is also responsible for high
plasticity, shrinkage, compressibility, deformation and low strength of soils and can
inhibit the reaction between calcium and the clay mineral surface (Little, 1995). The
low organic carbon content at 0.35% was strikingly similar to that of Sasumua clay
reported by Newill (1961). It was well below 3% for subgrade, 2% for subbase and
1% for base specified by MoTC (1987) and MoRPW (1986). It was also below the
critical level of 1-2% proposed by O’Flaherty (2002) and Little (1995); 1%
maximum is recommended in lime stabilization (Little, 2009). According to
specialist interpretation, the low organic content meant that the red soil lacked any
form of lime treatment – agricultural or otherwise – in the recent past.

89
ii) Mineralogy
Soil mineralogy is a particularly decisive factor that influences the moisture
characteristics and mechanical behavior of soils (Smoltczyk, 2003; Coleman et al.,
1964). According to Little (1995), the XRD spectrum that is used to identify clay
minerals is a function of the angle of reflection of an x-ray beam. In effect, the XRD
analysis of the red soil was represented by the diffractogram shown in Figure A7.2 of
Appendix II whose interpretation gave the percentage mineral composition of the red
soil as detailed in Table 4.4. As already indicated by colloidal activity of the red soil,
the results again confirmed kaolinite the predominant clay mineral in the soil. This
also enhanced report by local community that the soil had a history of pottery-
making which highly depend on kaolinitic clay. The feldspars microcline (or
orthoclase) and albite, as well as quartz and hematite followed closely in that order.
Table 4.4: XRD results for the red soil
Mineral Amount (%) Specific Gravity* Remark*
Kaolinite 47.9 2.61-2.66 Silicate clay mineral of low activity
Microcline 18.4 2.54-2.57 Feldspars, the second most common
silicate clay minerals Albite 12.6 2.62-2.76
Quartz 11.6 2.65 Most common silicate clay mineral
Hematite 9.5 5.2-5.3 Cause of reddish-brown color in soil
TOTAL 100 - -
(Courtesy: International Centre for Research in Agro-Forestry [ICRAF], Nairobi; *Day, 2010)
Rollings et al. (2002) reported that mineralogical analysis of tropical red soils often
finds a high content of allophane or halloysite clay minerals but these were missing
in the red soil under study. However, its mineralogical composition was largely in
agreement with findings by Bruggemann and Gosden (2004), Dixon and Robertson
(1970) and Terzaghi (1958) that red clay soils consist principally of halloysite, silica
as ordinary quartz, ferric oxide as hematite and also small quantities of kaolinite,
gibbsite, goethite, and certain feldspars. As observed by Northmore et al. (1992b),
Coleman et al. (1964) and Newill (1961), the XRD plot lacked a peak definition of
minerals – a phenomenon common with red soils found in Kenya. This also infers a
poorly-ordered (or non-crystalline) structure indicative of kaolinite or halloysite, the

90
two similar clay minerals expected to weather from feldspar minerals. Nonetheless,
the mineralogical results for red soil agreed with the findings by Terzaghi (1958) that
the soil consisted of 70-100% clay minerals.
Jawad et al. (2014) and O’Flaherty (2002) reported that kaolinite is a stable but
relatively inactive clay mineral. Kaolinitic soils are therefore characterized by low
expansion potential, CEC, and low pozzolanic strength development irrespective of
the lime type, content, or length of curing. Such soils are also sensitive to remolding
and drying, and also difficult to compact in the field (Kamtchueng et al., 2015;
Gidigasu, 1974). Microcline and albite are alkaline feldspars of potassium and
sodium, respectively. Feldspars are a large family of aluminosilicate minerals very
common in extrusive igneous rocks like basalt and granite and make up about 80%
of the Earth’s crust. Albite is the pivot mineral of two series of feldspars known as
anorthoclase and plagioclase, as illustrated in Figure A7.3 of Appendix II.
Microcline and albite are fairly hard and are widely used in manufacture of glass and
ceramics and as fillers in paints, plastics and rubber.
According to Mitchell and Soga (2005), prior knowledge of what minerals are in a
soil provides intuitive insight as to its behavior. They added that mineralogy is the
primary factor controlling the size, shape, and properties of soil particles that, in turn,
determine the possible ranges of physical and chemical properties of any given soil.
Moreover, clay and organic matter in a soil usually influence properties in a manner
far greater than their abundance. In this respect, the consistency, chemical reaction,
cementation, workability and bearing strength of soil-gravel admixtures would all be
affected. In particular, the CEC of kaolinite would determine the reactivity of clay
and more so the pozzolanic reaction upon addition of hydrated lime. The presence of
deleterious matter in the form of organic or sulphate contents would retard hardening
and reduce the strength gain in lime-stabilized admixtures as reported by many
authors like Jawad et al. (2014), Guyer (2011), Little (2009) and O’Flaherty (2002).
This was not expected to happen as organic matter was very low in content or absent.
4.1.3 Soil Classification
A soil classification system is a universal language based on soil grading and
plasticity that all geotechnical engineers understand and use to eliminate the

91
ambiguity in communicating and comparing the characteristics of a soil (Budhu,
2011; Craig, 2004). According to Das (2011), there are many soil classification
systems but the USCS is used worldwide in geotechnical engineering, and the
AASHTO system mostly in road pavements. These two systems are presented as
Tables A7.1 and A7.2 in Appendix I. The USCS classified the red soil as sandy SILT
of high plasticity (MH) and the natural gravel as well-graded gravel (GW). Similarly,
the AASHTO system classified the red soil as clayey soil (A-7-5), and the natural
gravel as clayey sand and GRAVEL (A-2-7). The AASHTO system also rated the
red soil and gravel as ‘poor’ and ‘good’ subgrade material respectively.
Fine cohesive soils like the red soil are also classified using a plasticity chart as
shown in Figure 4.6. The A-line represents the boundary between clays (C) and silts
(M), and the U-line represents the uppermost limit that provides a good check for
erroneous test data (Day, 2010). Thus, the consistency of fines in all soil-gravel
admixtures plotted normally under the U-line as illustrated in Figure 4.7.
Nonetheless, the RGN admixtures plotted at a higher level and a wider scatter than
the RGT admixtures. This difference reflected on the effectiveness of gravel and lime
treatment on red clay soil. The red soil with a liquid limit of 74.3% and a PI of 30.1%
also plotted below the A-line and further to the right as SILT of high plasticity (MH).
This corresponded to findings by Foss (1973) and Day (2010) for other kaolin clays
and indicated a silt-like character of red clay soil.
Figure 4.6: Typical plasticity chart
(Source: Das, 2011)

92
Figure 4.7: Plotting of soil admixtures on the plasticity chart
(Source: Author)
The red soil is often described as a clay soil but plotted below the A-line which is
definitely abnormal but not strange for many fine tropical soils developed from
igneous rocks like basalt (Bruggemann & Gosden, 2004; Rollings et al., 2002;
Waweru et al., 1998; West & Dumbleton, 1970; Terzaghi, 1958). In this respect,
Wesley (2009) asserted that many residual soils behave like silty clays for
engineering purposes, and rightly fall into the category of silty clay on plasticity
chart. Additionally, the AASHTO classification system rated the red clay soils as
poor subgrade material. Nevertheless, Little (1995) opined that MH and CH soils are
among those that are potentially capable of being stabilized with lime.
A modified plasticity chart may also be used to quickly and inexpensively identify
mineralogy of a clay soil as illustrated in Figure 4.8. The red soil plotted below the
A-line, and was confirmed as predominantly kaolinite for the third time.
Figure 4.8: Location of common clay minerals on plasticity chart
(Source: Day, 2010; Holtz & Kovacs, 1981)

93
4.2 Compaction Characteristics of Red Soil-Gravel-Lime Admixtures
Compaction, as outlined in section 3.4.2, is the mechanical process of increasing the
density of a soil, by packing the solid particles closer together to reduce volume of
air in the soil, in order to improve essential engineering properties such as strength,
stability and permeability (Craig, 2004; O’Flaherty, 2002). According to Budhu
(2011), two related laboratory compaction procedures are used to investigate the
maximum dry density and optimum moisture content of a soil. These are the Proctor
or standard compaction, and the modified compaction.
4.2.1 Standard and Modified Compaction
The average results for the standard compaction of natural red soil was a MDD of
1255 kg/m3 and an OMC of 39.3%. For modified compaction of the natural soil-
gravel (RGN) admixtures, the MDD ranged from 1325-2016 kg/m3 whereas the
OMC was in the range of 35.9-14.6%. The corresponding results for the soil-gravel-
lime (RGT) admixtures, at design lime content, were a MDD of 1272-2006 kg/m3
and OMC of 37.4-15.1%. Figure 4.9 illustrates the variation in the MDD and OMC
for the RGN and RGT admixtures. The same results are also tabulated in Table A7.8
of the Appendix IV.
Figure 4.9: Variation in MDD and OMC of soil admixtures with gravel and lime
Key: MDD_N, OMC_N = MDD and OMC for Natural red soil and gravel admixtures
MDD_T, OMC_T = MDD and OMC for lime-Treated red soil and gravel admixtures
1200
1400
1600
1800
2000
2200
0 20 40 60 80 100Gravel Content in Red Clay (%)
Maxim
um
Dry
Den
sit
y (
kg
/m3)
0
5
10
15
20
25
30
35
40O
pti
mu
m M
ois
ture
Co
nte
nt
(%)
MDD_N
MDD_T
OMC_N
OMC_T
94
Coleman et al (1964) attributed the low compactibility of red soil to its nature
represented by high clay content, a large specific surface area, high moisture holding
capacity, and a porous surface of hematite. He added that loss of water by drying of
soil also gives rise to abnormally high moisture content and low dry density of the
compacted red soil. The MDD and OMC results obtained for natural red soil, upon
its standard compaction, lay within the respective ranges of 1153-1363 kg/m3 and 50-
32% reported on red clay soils by Gichaga et al. (1987), and Dixon and Robertson
(1970). The OMC was also less than its plastic limit of 44.2%, as observed by
Terzaghi (1958). Upon modified compaction, the MDD for red soil at standard
compaction actually increased by about 6% from 1255 to 1325 kg/m3 while the
corresponding OMC dropped by about 9% from 39.3 to 35.9%. This agreed with
Rijn (2005) findings that MDD of a soil generally increases by 5-10% when 4.5
times the standard effort becomes the applied compactive energy. According to
Budhu (2011) and Craig (2004), this is the general effect whenever the compactive
effort is raised, and vice versa.
Figure 4.9 further demonstrated that the modified MDD increased, and OMC
decreased, as the RGN admixtures became more granular and less plastic. These
results were generally within the values for clayey and silty soils, and also granular
soils. The MDD was in the range of 1550-2060 kg/m3 and the OMC in the range of
35-15% as reported by Johannessen (2008) and Wignall et al. (1999). It was also
evident that the RGT admixtures attained a slightly lower MDD, and a slightly
higher OMC, than the RGN admixtures for the same compactive effort. Jawad et al.
(2014), Rijn (2005) and O’Flaherty (2002) attributed this phenomenon to an increase
in void ratio due to the resultant flocculation and textural change of soil admixture
when treated with lime or cement. According to Powrie (2004), Craig (2004) and
Cook et al. (2001), the addition of lime also makes the soil more stiff and difficult to
compact and this raises the water content and lowers the dry density.
Soil compaction is extensively employed in construction of embankments and road
pavements. The laboratory compaction results are relevant in control and evaluation
of such field compaction of earthworks where the MDD and OMC represent 100% of
field compaction and suitable moisture content for a given soil, respectively (Budhu,

95
2011; O’Flaherty, 2007). Many road agencies specify relative compactions of at least
95% the laboratory MDD for subbases and 98% for bases while the compacting
water content should be within 80-105% of the OMC (Wambura et al., 1991; MoTC,
1987). According to Craig (2004) and Little (1995), higher relative compactions are
advantageous to obtain and hence other laboratory test specimens were prepared at
100% MDD. Such test specimens were used to determine optimal or design lime
content and bearing strength of different soil admixtures.
4.2.2 Lime Demand
The initial consumption of lime, based on the PI and percent passing 0.425 mm of
RGN admixtures, ranged between 4.6% and 2.4% of hydrated lime as it was shown
in Table 4.1. This amount included a small construction tolerance of 0.5% as
proposed by O’Flaherty (2002) and AustStab (2002). The ICL so obtained was then
adjusted for the maximum possible MDD by means of compaction at three points
about this lime content for the RGT admixtures. As a result, the design lime content
for the admixtures ranged from 4.7-2.2% of hydrated lime. Nevertheless, the ICL for
100% natural gravel was approximated from the chart also shown in Figure 2.14 and
whose application is limited to at least 3% PI and 10% fines in an admixture.
According to, addition of 2-5% of hydrated lime by weight, and. The variation in
ICL and design lime content with gravel content in the red soil is shown in Figure
4.10. This demonstrates that both the ICL and design lime content reduced with
increasing gravel content in an admixture. The design lime content obtained was
within 2-5% hydrated lime by weight reported by Matalucci (1962) to have, almost
without exception, an increase in soil strength and a marked decrease in PI. Further,
design lime content was generally adequate for stabilization of a kaolinitic clay that
require 1-3% by mass of lime to achieve full flocculation potential of the clay as
reported by O’Flaherty (2002), AustStab (2002) and Hudson (1997). The results for
hydrated lime content in natural materials were roughly within the ranges
recommended by MoTC (1987) and MoRPW (1986) of 2-4% for subbase and 4-6%
for roadbase. It was apparent that the design lime contents were generally applicable
in subbase but could only be determined in collaboration with CBR strength test, as
summarized in Table 4.6 under section 4.4.2.2.

96
Figure 4.10: Variation in demand for hydrated lime with gravel content
4.3 Strength of Red Soil-Gravel-Lime Admixtures
4.3.1 Aggregate Crushing and Impact Values
The determination of the mechanical strength of natural gravel was outlined in
section 3.5.2. Both the ACV and AIV provide a relative measure of aggregate
toughness. The difference between individual test results were established to be
within the respective allowable tolerances of 0.07 and 0.15 times the mean value for
ACV and AIV specified by BS 812 (1990). The average results obtained for the two
aggregate properties are presented in Table 4.5 and Table A7.9 of Appendix IV.
Table 4.5: Mechanical properties of natural gravel
Property Mean Value
(%)
Limiting Value*
(%)
Remark*
ACV 24 30 For pavement wearing surface
45 For other use
AIV 20 30 For pavement wearing surface
45 For other use
(Source*: BS 882, 1992)
Cocks et al. (2015) posited that the performance of a material as a subbase or base
course is largely dependent upon its strength and stiffness which may be reasonably
inferred from the simple index tests for particle size distribution and PI. These come
mainly from mechanical interlock and toughness of the constituent particles. Both
the ACV and AIV of the natural gravel fell below the limiting value of 30% for
pavement wearing course and the gravel satisified the requirements of stone Class A
2
3
4
5
0 20 40 60 80 100
Gravel Content in Red Soil (%)
Lim
e D
em
an
d (
%) Initial
Design

97
(MoTC, 1987; MoRPW, 1986). This meant that the natural gravel was generally safe
against fragmentation and its quality superseded the one required for either subbase
or base materials. The high quality of gravel also removed the general caution placed
by MoTC (1987) over use of natural gravels derived from weathered igneous rocks
and perceived to be of poor quality, particularly basalt and phonolite. This also
confirmed the finding by Cocks et al. (2015) and O’Flaherty (2002) that conventional
criteria based on classification tests often have the disadvantage of excluding some
materials capable of giving satisfactory performance.
According to BS 812-111 (1990), the AIV can be used to estimate more conveniently
the alternative and tedious Ten Percent Fines (TPF) value of an aggregate. The TPF,
in turn, is also related to the Los Angeles Abrasion (LAA) test which is often the
reference test for the determination of resistance to fragmentation of pavement
aggregates but it was not performed for lack of the equipment.
4.3.2 California Bearing Ratio
O’Flaherty (2002) indicated that the CBR of a soil is an empirical or arbitrary index
of its shear strength. The CBR test was based on either standard or modified method
of compaction with its applicable MDD and OMC as outlined under section 3.5.2. As
further discussed in section 2.5.3.2, the CBR so obtained is used universally in
classification of subgrade soil or in thickness (that is, structural) design of road
pavements, respectively.
4.3.2.1 Subgrade Classification
According to Ministry of Transport and Infrastructure [MoT] (2013), subgrade
strength in wet areas like Nyeri is determined based on CBR at 100% MDD of
standard compaction and 4 days soak. The average soaked CBR for the red soil at
standard compaction was 10.6% with a swell factor of 0.89%. These values were
within the values specified by MoTC (1987) of 5-30% CBR and a swell factor less
than 2% for any soil to qualify as a direct subgrade material. The CBR of red soil
was also within the range of 2-15% reported by Wambura et al. (2003) for most
Kenyan soils. The red soil therefore classified as subgrade Class S3 which did not
require removal or overlying with a a higher quality material since it was adequately
strong for direct support of a road pavement. Nevertheless, Holt (2010) and MoTC

98
(1987) suggested that subgrade soils Class S2 and S3 may receive an improved
subgrade (or capping layer) of subgrade material classes S2 to S5, relative to cost.
Contrary to the rating of the red clay soil by the AASHTO classification system as a
poor subgrade material, its subgrade class proved otherwise. Its qualification as a
good natural subgrade also agreed with the findings by Elsharief et al. (2013),
Wesley (2010), Bruggemann and Gosden (2004), Rolt (1979) and Smart (1973) on
similar soils. They found that the red soil is remarkably stronger and surprisingly
favorable as a subgrade material than it is normally considered, which is beneficial in
terms of increased bearing strength, reduced overlying layer thickness, and
minimized surface levels at certain critical locations (AustStab, 2002). This further
proved many authors right in their common view that uniform criteria for
classification of soils do not exist, and that this also fails to reconcile with properties
of tropical soils because of local variations and characteristics (Cocks et al., 2015;
Venkatramaiah, 2006; O’Flaherty, 2002; Verrujit, 2001; Northmore et al., 1992a).
4.3.2.2 Design Bearing Strength
Test specimens were prepared and tested as outlined in section 3.5.2.3. The soaking
period was either 4 days or 7 days after specifications for natural or treated test
specimens, respectively (MoTC, 1987; MoRPW, 1986). Soaked CBR values ranged
from 16.8-112.6% for RGN admixtures and from 31.5-138.5% for RGT admixtures.
These test results are presented in Figure 4.11, and in Table A7.8 of Appendix IV.
Figure 4.11: CBR values for neat and lime-treated soil admixtures
Key: CBR_N = CBR for natural (N) red soil and gravel admixtures
0
20
40
60
80
100
120
140
160
0 20 40 60 80 100
Gravel Content in Red Soil (%)
So
aked
CB
R V
alu
e (
%)
CBR_N
CBR_T

99
CBR_T = CBR for lime treated (T) red soil and gravel admixtures
The corresponding swell factors, as at the end of soaking period, ranged from 0.84-
0.31% for RGN admixtures and from 0.79-0.29% for RGT admixtures. Figure 4.12 is
a representation of these swelling results.
Figure 4.12: Swelling factor for different soil admixtures
It was evident from Figures 4.11 and 4.12 that the soaked CBR and swell factor
values differed in variation with increasing gravel content in red soil. Thus, the CBR
increased progressively, while the swell factor decreased, with increasing gravel
content in the soil. Addition of hydrated lime to the soil-gravel admixtures had a
similar effect with increasing gravel content but was accompanied by a further
increase in CBR but a reduced swell factor. Additionally, there was a significant
change in CBR at about 60% gravel content for both RGN and RGT admixtures.
After this point, and as the admixtures became more gravelly in composition, the
CBR for RGN admixtures increased steadily while that of RGT admixtures increased
marginally. This point probably marked the limit of influence of both the fine red soil
and hydrated lime in the admixtures. According to Cook et al. (2001) and Hudson
(1997), fine soils may contribute towards improved internal friction of an admixture
while some natural gravel may exhibit considerable strength gain with lime
treatment. They explained that the latter case is due to formation of a natural cement
in a pozzolanic reaction that occurs between lime and the available silica and
probably some alumina in the clay. The trend of both CBR curves appears to
corroborate the two different effects of clay and lime in gravel.
0.2
0.3
0.4
0.5
0.6
0.7
0.8
0.9
0 20 40 60 80 100
Gravel Content in Red Soil (%)
So
aked
Sw
ell
Facto
r (%
)
Swell_N
Swell_T

100
The soaked CBR and swell factors presented here are applicable in wet areas like
Nyeri County with a mean annual rainfall over 500 mm, after MoTC (1987) and
MoRPW (1986) specifications. These two values are highly influenced by the type of
material, method of compaction and the compacted dry density obtained (Jawad et
al., 2014; MoTC, 1987; Morin et al., 1971). For instance, the CBR of the natural red
soil rose from 11.6% to 16.8% with a mere change in method of compaction from
standard to modified type. This was also prove that compaction translates into
instantaneous strength gains and reduced permeability for the natural subgrade soil as
held by Jawad et al. (2014). This outcome suggested that red soil could be improved
to subgrade Class 4 by simply raising the compactive effort to that of modified
method.
Both MoTC (1987) and MoRPW (1986) further specified that all natural materials
with at least 30 and 80% soaked CBR at 95% MDD qualify for use as subbase and
base course materials, respectively, of a standard road pavement. Nevertheless, the
subbase layer may not be used in rare cases when the subgrade strength is 30% CBR
or class S6. Cement or lime treated natural materials with at least 60 and 160%
soaked CBR at 95% MDD also qualify for similar application, respectively. It was
observed from the soaking phase that the soil-gravel admixtures compacted into
stable and dense mass with minimum swell potential and water ingress. The MoTC
(1987) and MoRPW (1986) design standards are silent on limits of the swell factors
but this was expected to be less than 2% specified for a subgrade, and below which
all the soaked swell factors fell.
4.3.2.3 Application in Road Pavement Design
Roadway design standards usually rely on strength test results to approve
construction materials. Performance of pavement layers depend on subgrade strength
and an improved subgrade is often beneficial in increasing bearing strength at
reduced cost and thinner pavement (Holt, 2010; Vorobieff & Murphy, 2003;
O’Flaherty, 2002; MoTC, 1987). All admixtures with a CBR of 15-30% qualified for
use as improved subgrade classes S5 and S6. Suitable mix proportions for for use as
subbase and base course materials were derived from Figures 4.10 and 4.11. This
was based on MoTC (1987) and MoRPW (1986) criteria that qualify both natural and

101
treated materials for such application. Accordingly, Table 4.6 summarizes the
diferent mix proportions that qualified for use as subgrade, improved subgrade,
subbase and even base material. This demonstrated that some of the soil-gravel
admixtures were not only useful in LVRs but also in high volume roads.
Table 4.6: Material mix proportions for different road pavement layers
Pavement Layer
CBR Range
(%)
Gravel
Content (%)
Red Soil
Content (%)
Lime Content
(%)
Natural Materials (RGN)
Normal Subgrade 5-15 0 100 -
Improved Subgrade 15-30 0-31 100-69 -
Subbase 30-80 31-87.4 69-12.6 -
Base ˃80 87.4-100 12.6-0 -
Lime-Treated Materials (RGT)
Normal Subgrade 10-30 Not Applicable
Improved Subgrade 30-60 0-32.2 95.3-64.2 4.7-3.58
Subbase 60-160 32.2-97.8 64.2-0 3.58-2.2
Base ˃160 Not Achieved
Results in Table 4.6 shows that none of the soil admixtures had a soaked CBR of less
than 15%. Therefore, all the admixtures were of high quality and applicable at least
as improved subgrade material. Further, the RGN admixtures performed so well that
the highest soaked CBR in the range was beyond 80% and qualified the material as
basecourse, which was outside the scope of this study. Incidentally, this was a feat
that the RGT admixtures could not realize since its highest CBR was below the
minium 160% required. Assuming the average values to represent a range of
applicable mixes, then the improved subgrade would be constituted of either 84.5%
red soil and 15.5% natural gravel or consist of 79.8% red soil, 16.1% natural gravel
and 4.1% hydrated lime. Similarly, the subbase would be constituted of either 40.8%
red soil and 59.2% natural gravel or consist of 32.1% red soil, 65.0% natural gravel
and 2.9% hydrated lime. Finally, the base would be constituted of only 6.3% red soil
and 93.7% natural gravel since the lime-treated natural admixtures failed to meet the
strength requirements of the base. Thus, incorporation of the red soil in various soil
admixtures reduced progressively, as expected, as the strength requirements for a
pavement layer increased.

102
Even though most of the RGN admixtures qualified in terms of strength for use as
subbase and base materials, they were eliminated on the basis of plasticity
requirements. The plasticity of these admixtures generally fell beyond the maximum
plasticity index of 15% allowed for wet areas by the MoTC (1987) and MoRPW
(1986). This outcome justified the use of hydrated lime in lowering the high
plasticity of neat soil-gravel admixtures. The optimal mixes therefore consisted of
79.8% red soil, 16.1% natural gravel and 4.1% hydrated lime for an improved
subgrade, and 32.1% red soil, 65.0% natural gravel and 2.9% hydrated lime for the
subbase.

103
CHAPTER FIVE
CONCLUSIONS AND RECOMMENDATIONS
5.1 CONCLUSIONS
In view of the laboratory results and their discussion, the following conclusions were
made.
1) Material Properties
The red soil was identified as highly-weathered ‘laterite’ with kaolinite as
predominant clay mineral. It was described as ‘clayey silty SAND’ which classified
as MH and as poor subgrade material A-7-5, after USCS AASHTO soil classification
systems. Similarly, the grayish natural gravel was identified as partially-weathered
‘lateritic gravel’. It was described as ‘sandy GRAVEL’ which classified as GW and
good subgrade material A-2-7 according to the two respective classification systems.
The hydrated lime in a fine white powder form consisted mainly of 72.5% calcium
oxide by weight, equivalent to 95.4% calcium hydroxide, and other minor
constituents.
2) Compaction Characteristics
The red soil compacted easily into a dense mass with a MDD of 1255 kg/m3 and an
OMC of 39.3% after standard compaction. The MDD for soil-gravel admixtures
increased from 1325-2016 kg/m3 while OMC decreased from 35.9-14.6% with
increasing gravel content. The treated soil-gravel-lime admixtures had a slight
reduction in MDD which ranged from 1272-2006 kg/m3, and an increase in OMC
that ranged from 37.4-15.1%. The amount of hydrated lime required was based on
soil plasticity and decreased with increasing gravel content from 4.7-2.2% by weight.
Addition of gravel and hydrated lime to red clay soil also had an effect of greatly
increasing the MDD and decreasing OMC of admixtures. Moreover, most
admixtures compacted with relative ease and to higher densities and reduced
moisture though it became more difficult as gravel content increased.

104
3) Material Strength
Based on standard compaction, the red soil was strong enough to support a road
pavement after classifying as subgrade soil class S3 with a soaked CBR of 11%. The
soil also had a soaked CBR of 17% upon modified compaction and this was
equivalent to subgrade soil class S4 that simply eliminated the need of any improved
subgrade. The bearing strength of the all admixtures generally increased with
increasing gravel content and with the addition of lime. The corresponding soaked
CBR ranged from 16.8-112.6% and from 31.5-138.5%, respectively. Similarly, all
swell factors generally reduced and ranged from 0.84-0.31% and from 0.79-0.29%,
respectively. These values were well below the maximum 2% allowed for in design.
4) General Conclusion
The lateritic gravel is effective in stabilizing red clay soil by lowering its plasticity
and increasing its strength. Moreover, these parameters are significantly improved by
the addition of hydrated lime to meet requirements for use as subgrade and subbase
of LVRs. According to MoTC (1987) specifications, the natural gravel qualified as
Stone Class A, with an ACV value of 24%. The natural and treated admixtures with
30-80% and 60-160% CBR, respectively, qualified as both subbase and base
materials. However, all the natural admixtures were eliminated from this application
based on the plasticity index criteria. Thus, the optimal mixes for soil-gravel-lime
admixtures consisted of 79.8% red soil, 16.1% natural gravel and 4.1% hydrated lime
for an improved subgrade, and 32.1% red soil, 65.0% natural gravel and 2.9%
hydrated lime for the subbase. This demonstrated the success of double stabilization
of red clay soil using natural gravel and hydrated lime to produce a fairly wide range
of satisfactory materials for improved subgrade and subbase of LVSRs.
5.2 RECOMMENDATIONS
The following recommendations were arrived at from the findings of this study:
a) For Application
1) Natural gravel and hydrated lime have different capacities – lime is more
effective – in lowering the high plasticity of red soil and result in non-rigid or
plastic soil not susceptible to cracking.

105
2) Higher compacted densities can be realized by adding natural gravel and
hydrated lime to red soil but lime could be beneficial in reduction of self weight
though at a higher water demand.
3) The stability and bearing strength of red soil are substantially increased by
adding natural gravel and hydrated lime with the latter giving even better results
regardless of reduced density.
b) For Further Research
1) The products of this study may be tried as surfaces to footpaths, tracks and roads
in remote and steep rural areas prone to soil erosion.
2) Additional research may be conducted on the soil-gravel admixtures using a
higher amount of lime than determined here, or Portland cement to realize much
stronger stabilized admixtures that qualify as road base material.

106
REFERENCES
AfDB (2011). Africa Infrastructure Knowledge Program; Handbook on
Infrastructure Statistics. Washington D.C: The World Bank.
Arora, K.R. (2004). Soil Mechanics and Foundation Engineering. (6th ed.). Delhi:
Standard Publishers.
AustStab (2002). Lime Stabilization Practice. Technical Note No 1. Artarmon, New
South Wales.
Aravind, V., Boobesh, A., Gnanamanikandan, K., Jawahar Sundhar, A., & Raman, P.
(2019). Stabilization of Red Soil using Lime and Fly Ash. International
Journal of Engineering Research and Technology, 7(6), 1-3.
Attewill, L., & Morey, J. (1994). The Use of Jet Grouting for the Cut-Off of Thika
Dam, Kenya. 13th International Conference of Soil Mechanics and
Foundation Engineering, 1791-1795.
Baker, B.H. (1967). Geology of Mount Kenya. Geological Report No. 79. Kenya
Geological Survey, Nairobi.
Mampearachchi, W.K., Bandara, W.W., & Sampath, K.H.S.M. (2017). Cement
Stabilized Soil as a Road Base Material for use in Sri Lankan Roads.
Engineer, 50(1), 21-29.
BLA, (2010). Sustainable Development Report 2010. London: Mineral Products
Association.
Blake, L.S., (Ed.). (1994). Civil Engineer’s Reference Book. (4th ed.). Oxford:
Butterworth-Heinemann.
Bommer, J. J., Rolo, R., Mitroulia, A., & Berdousis, P. (2002). Geotechnical
properties and seismic slope stability of volcanic soils. 12th European
Conference on Earthquake Engineering, Paper Reference 695. London:
Elsevier Science.
BSI [British Standards Institution] (1990). Stabilized materials for civil engineering
purpose. Methods of test for cement-stabilized and lime-stabilized materials,
BS 1924: Part 2. London.

107
BSI (1990). Methods of test for soils for civil engineering purposes. BS 1377.
London.
BSI (1990). BS 812-110 Testing aggregates - Methods for determination of
aggregate crushing value (ACV). London.
BSI (1990). BS 812-112 Testing aggregates - Methods for determination of
aggregate impact value (AIV). London.
BSI (1992) BS 882 Specification of Natural Aggregates for Concrete. London.
Brink, G.E., (2015). Engineering Geological Evaluation of Transported Tropical
Red Soils (Doctorate Thesis). University of Pretoria.
Bruggemann, D.A., & Gosden, J.D. (2004). The performance of Thika Dam, Kenya.
Proceedings of the 13th Conference of the British Dam Society and the
ICOLD European Club meeting held at the University of Kent, Canterbury,
421-432. Thomas Telford Publishing.
Budhu M. (2011). Soil Mechanics and Foundations. (3rd ed.). New Jersey: John
Wiley & Sons.
Chen, K. & Lu, Z., (2015). The Shear Strength Characteristics of Red Clay. 5th
International Conference on Advanced Design and Manufacturing
Engineering, 1291-95. Atlantis Press.
Cocks, G., Keeley, R., Leek, C., Foley, P., Bond, T., Cray, A., Paige-Green, P.,
Emery, S., Clayton, R., McInnes, D., & Marchant, L. (2015). The use of
naturally occurring materials for pavements in Western Australia. Australian
Geomechanics Journal, 50(1), 43-106.
Coleman, J.D., Farrar, D.M., & Marsh A.D. (1964). The moisture characteristics,
composition and structural analysis of a red clay soil from Nyeri, Kenya.
Geotechnique, 14(3), 262-276.
Collier, P., Kirchberger, M., & Söderbom, M. (2013). The cost of road infrastructure
in developing countries. Centre for the Study of African Economies (CSAE),
University of Oxford.

108
Cook, J. R., Bishop, E.C., Gourley, C.S., & Elsworth, N.E. (2001). Promoting the
use of marginal materials. Report No. PR/INT/205/2001. London: Transport
Research Laboratories (TRL).
Cook, J. R., Petts, R.C., & Rolt, J. (2013). Rural Road Surfacing and Pavements
Guidelines; AFCAP-GEN-099. London: AFCAP/DfID.
Craig, R.F. (2004). Soil Mechanics. (7th ed.). London: Spon Press.
Das, B.M. (2006). Principles of Geotechnical Engineering. (5th ed.). Toronto:
Nelson.
Day, R.W. (2010). Foundation engineering Handbook. New York: McGraw-Hill
Education.
Dixon, H.H., & Robertson, R.H.S. (1971). Some engineering experiences in tropical
soils. Quarterly Journal of Engineering Geology and Hydrogeology 3(3),
137-150.
DoFEP (2013). Nyeri County Integrated Development Plan 2013-2017. Nairobi,
Kenya.
DoFEP (2018). Nyeri County Integrated Development Plan 2018-2022. Nairobi,
Kenya.
Ejeta, A., Quezon, E.T., & Getachew, K. (2017). Engineering Properties Of
Mechanically Stabilized Subbase Material Using Natural Gravel Around
Jimma Quarry Sites for Unpaved Road Construction. Global Scientific
Journals, 5(5): 93-102.
Elsharief, A.M., Elhassan, A.A.M., & Mohamed, A.E.M. (2013). Lime stabilization
of tropical soils from Sudan for road construction. International Journal of
Geotechnique, Construction Materials and Environment (GEOMATE), 4(2),
533-538.
Fairburn, W.A. (1966). Geology of the Fort Hall Area. Report No. 73. Nairobi:
Ministry of Natural Resources, Wildlife and Tourism.
Faiz, A. (2012). The Promise of Rural Roads: Review of the Role of Low-Volume
Roads in Rural Connectivity, Poverty Reduction, Crisis Management, and

109
Livability. Transportation Research Circular No. E-C167. Washington D.C:
Transportation Research Board.
Foss, I. (1973). Red Soil from Kenya as a Foundation Material. Proceedings: 8th
International Conference on Soil Mechanics and Foundation Engineering,
73-80.
Foster, V., & Briceño-Garmendia, C. (Eds.). (2010). Africa’s Infrastructure: A Time
for Transformation. Washington D.C: The World Bank.
Frempong, E.M., & Tsidzi, K.E.N. (1999). Blending of marginally suitable tropical
sub-base materials for use in base course construction. Construction and
Building Materials 13(3), 129-141.
Fukubayashi, Y., & Kimura, M. (2017). Spot Improvement of Rural Roads Using a
Local Resource-Based Approach: Case Studies from Asia and Africa.
International Development, 89-117.
Gianfrancisco, S., & Jenkins, S. (2000). Gravel Roads Part II: Back to Basics.
Bozeman: Montana State University.
Gichaga, F.J., Sahu, B.K., Visweswaraiya, T.G., & Atibu, F.S. (1987). Problems of
Red Coffee Soils in Kenya. Proceedings: 8th Asian Regional Conference on
Soil Mechanics, and Foundation Engineering, 173-176.
Gidigasu, M.D. (1974). Identification of Problem Laterite Soils in Highway
Building: A Review. Kumasi, Ghana: Building and Research Institute.
Gidigasu, M.D. (1991). Characterization and use of tropical gravels for pavement
construction in West Africa. Geotechnical and Geological Engineering, 9(3),
219-260.
Greening, T., & O’Neill, P. (2010). Traffic-Generated Dust from Unpaved Roads: an
Overview of Impacts and Options for Control. 1st AFCAP Practitioners
Conference, 1-18.
Guyer, J.P. (2011). Introduction to Soil Stabilization for Pavements. New York:
Continuing Education and Development Incorporation.

110
Gwilliam, K., Foster,V., Archondo-Callao, R., Briceño-Garmendia, C., Nogales, A.,
and Sethi, K. (2008). The Burden of Maintenance: Roads in Sub-Saharan
Africa. AICD Background Paper BP-14. Washington D.C: The World Bank.
Gwilliam, K., Foster,V., and Briceño-Garmendia, C., (2011). Africa's Transport
Infrastructure: Mainstreaming, Maintenance and Management. Washington
D.C: The World Bank.
Hazelton, P.A., & Murphy, B.W. (2007). Interpreting Soil Test Results.
Collingwood: CSIRO Publishing.
Hinga, G.N., Mang’uriu, G.N., & Kabubo, C.K., (2019). Effects of Natural Gravel
and Lime on the Primary Characteristics of Red Soil as Construction
Material for Low-Volume Road. International Journal of Innovative
Research in Science, Engineering and Technology, 8(1), 492-500.
Holt, C. (2010). Chemical Stabilization of Inherently Weak Subgrade Soils for Road
Construction. The 2010 Annual Conference of the Transportation
Association of Canada, 1-20.
Holtz, R.D., & Kovacs, W.D. (1981). An Introduction to Geotechnical Engineering.
New Jersey: Prentice Hall.
Hudson, J.B. (1997). Military Soil Engineering, Field Manual 5-410. Washington
D.C: Department of the Army.
Intech Associates (2002). Rural Road Surfacing: Draft gravel Guidelines. London:
TRL.
Jabareen, Y. (2009). Building a Conceptual Framework: Philosopy, Definitions and
Procedure. International Journal of Qualitative Methods 8(4), 49-62.
Jaetzold R., Schmidt, H., Hornetz, B., & Shisanya, C. (2006). Farm Management
Handbook of Kenya: Volume II, Part II-B2 Central Province. Nairobi:
Ministry of Agriculture.
Jawad, I.T., Taha, M.R., Majeed, Z.H., & Khan, T.A. (2014). Soil Stabilization
Using Lime: Advantages, Disadvantages and Proposing a Potential
Alternative. Research Journal of Applied Sciences, Engineering and
Technology 8(4), 510-520.

111
Jjuuko, S., Kalumba, D., & Bagampadde, U. (2011). Use of Locally Available Sand
in Stabilization of Clayey Ugandan Soils. Proceedings of the 16th National
Technology Conference.
Jjuuko, S., Kalumba, D., Bbira, S., & Bamutenda J. B. (2014). Blending of
marginally suitable lateritic soils for use in base construction. XIV
Colombian Geotechnical Congress and IV South American Young
Geotechnical Engineers Conference, 1-9.
Johannessen, B. (2008). Building Rural Roads. Bangkok: International Labor
Organization (ILO).
Kamtchueng, B. T., Onana, V. L., Fantong, W.Y., Ueda, A., Ntouala, R.F.D.,
Wongolo, M.H.D., Ndongo, G.B., Ze, A.N., Kamgang, V.K.B., & Ondoa,
J.M. (2015). Geotechnical, chemical and mineralogical evaluation of lateritic
soils in humid tropical area (Mfou, Central-Cameroon): Implications for road
construction. International Journal of Geo-Engineering 6(1), 1-21.
KNBS (2019). Kenya Population and Housing Census Volume I: Population by County
and Sub-County. Nairobi.
Kollaros, G., & Athanasopoulou, A. (2016). Sand as a Soil Stabilizer. Bulletin of the
Geological Society of Greece, 50(2), 770-777.
Keter, J.K.A., & Ahn, P.M. (1986). Profile characteristics, and form and surface
activity of inorganic phosphorous in a deep red Kenya coffee soil (Nitosol).
Journal of Soil Science, 37(1), 89-97.
Knoop L., Sambalino F., & Steenbergen, F. (2012). Securing Water and Land in the
Tana Basin: A resource book for water managers and practitioners.
Wageningen: UNEP/3R Water Secretariat.
Lebo, J., & Schelling, D. (2001). Design and Appraisal of Rural Transport
Infrastructure: Ensuring Basic Access for Rural Communities. Technical
Paper No. 496. Washington D.C: World Bank.
Lennox, R., & MacKenzie, M. (2008). Eco-Road Building for Emerging Economies:
An Initial Scan for Promising Alternative Technologies. London:
DfID/Global Transport Knowledge Partnership (gTKP).

112
Little, D.N. (1995). Handbook for Lime Stabilization of Pavement Subgrades and
Base Courses. Texas: Texas Lime Association.
Little, D.N., (2009). Recommended Practice for Stabilization of Subgrade Soils and
Base Materials. NCHRP Document 144. Washington D.C: Transportation
Research Board.
Matalucci, L.V., (1962). Laboratory Experiments in the Stabilization of Clay with
Gypsum (Masters Thesis). Oklahoma State University, Oklahoma.
McNally, G.H., (1998). Soil and Rock Construction Materials. London: E&FN Spon.
Miles, M.B., & Huberman, A.M. (1994). Qualitative Data Analysis: An Expanded
Sourcebook. (2nd ed.). Beverley Hills: Sage.
Mitchell, J.K., & Soga, K. (2005). Fundamentals of Soil Behavior. (3rd ed). New
Jersey: John Wiley & Sons.
Morin, W.J., Todor, P.C., & Revinson, R.S. (1971). Laterite and Lateritic Soils and
Other Problem Soils of Africa. Report AID/csd-2164. Washington
D.C:USAID.
MoPND (2005). Nyeri District Strategic Plan 2005-2010 for Implementation of the
National Population Policy for Sustainable Development. Nairobi, Kenya:
Author.
MoR & PW (1986). Standard Specifications for Road and Bridge Construction.
Nairobi.
MoT (2009). Integrated National Transport Policy. Nairobi.
MoTC (1987). Road Design Manual Part III: Materials & Pavement Design for New
Roads. Nairobi.
MoTI (2013). Design Guidelines for Low Volume Sealed Roads. Nairobi.
MoWTC (2016). Low Volume Roads Manual. Dar es Salaam.
Murthy, V.N.S. (2012). Geotechnical Engineering: Principles and Practices of Soil
Mechanics and Foundation Engineering. New Delhi: Dhanpat Rai & Sons.
Muturi, P.M. (2015). A Review of Nyeri County-Kenya Strategic Plan 2013-2017.
International Journal of Economics, Commerce and Management 3(5), 1364-
1405.

113
Mwaipungu, R.R., & Allopi, D. (2014). The sustainability of gravel roads as depicted
by sub Saharan Africa’s standard specifications and manuals for road works:
Tanzania case study. WIT Transactions on the Built Environment 138, 581-
592.
Newill, D. (1961). A laboratory investigation of two red clays from Kenya.
Geotechnique 11(4), 302-318.
NLA (2005). Lime Treated Soils. Technical Digest. Arlington.
NLA (2006). Mixture Design and Testing Procedures for Lime Stabilized Soil.
Technical Brief. Arlington.
Northmore, K.J., Culshaw, M.G., & Hobbs, P.R.N. (1992a). Engineering geology of
tropical red clay soils: Project background, study areas and sampling sites.
Technical Report WN/93/11. Nottingham: British Geological Survey.
Northmore, K.J., Entwisle, D.C., Hobbs, P.R.N., Jones, L.D., & Culshaw, M.G.
(1992b). Engineering geology of tropical red clay soils: Geotechnical
characterization, index properties and testing procedures. Technical Report
WN/93/12. Nottingham: British Geological Survey.
Nwachukwu, A.A. (2013). Constraints to Sustainable Rural Transport Infrastructure
development in Enugu State, Nigeria. Journal of Sustainable Development in
Africa. 15(2), 41-54.
O’Flaherty, C.A. (Ed.). (1997). Transport Planning and Traffic Engineering.
London: Arnold.
O’Flaherty, C.A. (Ed.). (2002). Highways: The Location, Design, Construction and
Maintenance of Road Pavements. (4th ed.). Oxford: Butterworth-Heinman.
Paige-Green, P. (2007). Improved material specifications for unsealed roads.
Quarterly Journal of Engineering Geology & Hydrogeology 40(2), 175–179.
Petts R., Cook, J., & Tuam, P.G. (2006). Rural Road Paving for Manageable
Maintenance. Revue HTE No 134, 21-30. Hanoi.
Pinard M.I., & Greening, P.A.K. (2004). Sustainable Provision of Low-Volume
Sealed Roads. Proceedings of the 8th
Conference on Asphalt Pavements for
Southern Africa, Paper No 33. Sun City, South Africa.

114
Powrie W. (2004). Soil Mechanics: Concepts and Applications. (2nd ed.). London:
Spon Press.
Qayoom R.S., Yadav, V. & Kumar A. (2020). Stabilization of Red Soil used as a
Sub-Base Material. International Journal of Scientific and Technology
Research 9(2), 4539-4544.
Rijn, J. (2005). Labour Based Road Works. Indevelopment (Source:
http:www.independent.nl/PDF file labour based road works.pdf.html).
Riverson, J., Gaviria, J., & Thriscutt, S. (1992). Rural Roads in Sub-Saharan Africa;
Lessons from World Bank Experiences. Technical Paper TP 141. Washington
D.C: The World Bank.
Robinson, R., & Thagesen, B. (2004). Road Engineering for Development. (2nd ed.).
London: Spon Press.
Rollings, M.P., Rollings, R.S., & Sharp, K.G. (2003). Tropical Pavement Materials.
Proceedings of the 21st ARRB and 11th REAAA Conference, 1-2. Cairns.
Rolt, J. (1979). Engineering standards of the Kenyan rural access roads. Report No.
PA1090/79. London: PTRC Education and Research Services.
Rossiter, D.G. (2004). Digital soil resource inventories: status and prospects. Soil
Use and Management 20(3), 296–301.
Roughton International (2016). Low Volume Roads. Hampshire.
Shackleton, R. M. (1945). Geology of the Nyeri Area. Report No 12. Kenya
Geological Survey, Nairobi.
Sherwood, P. T. (1967). Classification tests on African red clays and Keuper Marl.
Quarterly Journal of Engineering Geology and Hydrogeology 1(1), 47-55.
Shuklar, S.K., & Yin, J.H. (2006). Fundamentals of Geosynthetic Engineering.
London: CRC Press.
Skorseth, K., & Selim, A.A. (2000). Gravel Roads: Maintenance and Design
Manual. South Dakota Local Transportation Assistance Program. Brookings:
South Dakota State University.
Smart, P. (1973). Structure of a red clay soil from Nyeri, Kenya. Quarterly Journal
of Engineering Geology and Hydrogeology 6(2), 129-139.

115
Smith, I. (2014). Smith’s Elements of Soil Mechanics. (9th ed.). Chichester: John
Wiley & Sons.
Smoltczyk, U. (2003). Geotechnical Engineering Handbook: Elements and
Structures (Vol. 3). Berlin: Ernst & Sohn.
Sogomo, J.K. (2010). Low Cost Bitumen Standard Roads in Kenya. 1st AFCAP
Practitioners Conference, 1-9.
Terzaghi, K. (1958). Design and Performance of the Sasumua Dam. Proceedings of
the Institution of Engineers 9(4), 369-394.
Thompson, A.O. (1964). Geology of the Kijabe Area. Report No 67. Kenya
Geological Survey, Nairobi.
Venkatramaiah, C. (2006). Geotechnical Engineering. New Delhi: New Age
International Limited.
Verrujit, A. (2001). Soil Mechanics. Delft University of Technology.
Vorobieff, G., & Murphy, G. (2003). A new approach to pavement design using lime
stabilized subgrades. 21st ARRB Conference, 1-10.
Xue, K., Wang, S., Hu, Y., & Li, M. (2020). Creep behavior of red-clay under
triaxial compression. Frontiers in Earth Science 7, (Paper No 345) 1-11.
Wambura, J.H.G., Odera, M.S., & Ikindu, D.R. (1991). Pavement design and
construction specifications developed for low-cost, low-volume roads in
Kenya. International conference on low volume roads, 58-65. Raleigh.
Wasike, W.S.K. (2001). Road infrastructure policies in Kenya: Historical trends and
current challenges. Working Paper No 1. Nairobi: Kenya Institute for Public
Policy Research and Analysis (KIPPRA).
Waweru, S.G., Asano, E., & Kimura, M. (1998). Problematic soils in Kenya.
Proceedings of the International Symposium on Problematic Soils-Tohoku,
325-328.
Wesley, L. (2009). Behaviour and Geotechnical Properties of Residual Soils and
Allophane Clays. Obras y Proyectos, 6, 5-10.

116
Wesley, L.D. (2010). Geotechnical Engineering in Residual Soils. New Jersey: John
Wiley & Sons.
West, G. & Dumbleton, M.J. (1970). The mineralogy of tropical weathering
illustrated by some Malaysian soils. Quarterly Journal of Engineering
Geology and Hydrogeology 3, 25-40.
Whitlow, R.(1995). Basic soil mechanics. (3rd ed.). London: Longman.
Wignall, A., Kendrick, P.S., Ancill, R., & Copson, M. (1999). Roadwork: Theory
and Practice. (4th ed.). Oxford: Butterworth-Heinemann.
Wilmot T.D. (2006). The importance of stabilization techniques for pavement
construction. 22nd ARRB Conference, 1-11.

117
APPENDICES
Appendix I: Soil Description and Classification
Table A7.1: Unified Soil Classification System (USCS)
Unified Soil Classification System (USCS) - from ASTM D 2487
Major Divisions Group Symbol Typical Names
Course-Grained
Soils More than 50%
retained on the 0.075 mm (No. 200) sieve
Gravels
50% or more of course fraction
retained on the
4.75 mm (No. 4) sieve
Clean
Gravels
GW Well-graded gravels and gravel-sand mixtures,
little or no fines
GP Poorly graded gravels and gravel-sand
mixtures, little or no fines
Gravels
with Fines
GM Silty gravels, gravel-sand-silt mixtures
GC Clayey gravels, gravel-sand-clay mixtures
Sands 50% or more of
course fraction passes the 4.75
(No. 4) sieve
Clean Sands
SW Well-graded sands and gravelly sands, little or
no fines
SP Poorly graded sands and gravelly sands, little or
no fines
Sands
with Fines
SM Silty sands, sand-silt mixtures
SC Clayey sands, sand-clay mixtures
Fine-Grained Soils More than 50%
passes the 0.075
mm (No. 200) sieve
Silts and Clays Liquid Limit 50% or less
ML Inorganic silts, very fine sands, rock four, silty
or clayey fine sands
CL Inorganic clays of low to medium plasticity,
gravelly/sandy/silty/lean clays
OL Organic silts and organic silty clays of low
plasticity
Silts and Clays Liquid Limit greater than 50%
MH Inorganic silts, micaceous or diatomaceous fine sands or silts, elastic silts
CH Inorganic clays or high plasticity, fat clays
OH Organic clays of medium to high plasticity
Highly Organic Soils PT Peat, muck, and other highly organic soils
Prefix: G = Gravel, S = Sand, M = Silt, C = Clay, O = Organic Suffix: W = Well Graded, P = Poorly Graded, M = Silty, L = Clay, LL < 50%, H = Clay, LL > 50%

118
Table A7.2: AASHTO Soil Classification System
AASHTO Soil Classification System - from AASHTO M 145
General Classification Granular Materials 35% or less passing the 0.075 mm sieve
Silt-Clay Materials >35% passing the 0.075 mm sieve
Group Classification
A-1
A-3
A-2
A-4 A-5 A-6
A-7
A-1-a A-1-b A-2-4 A-2-5 A-2-6 A-2-7 A-7-5
A-7-6
Sieve Analysis, % passing
2.00 mm (No. 10) 50 max --- --- --- --- --- --- --- --- --- ---
0.425 (No. 40) 30 max 50 max 51 max --- --- --- --- --- --- --- ---
0.075 (No. 200) 15 max 25 max 10 max 35 max 35 max 35 max 35 max 36 min 36 min 36 min 36 min
Characteristics of fraction passing 0.425 mm (No. 40)
Liquid limit --- --- 40 max 41 min 40 max 41 min 40 max 41 min 40 max 41 min
Plasticity index 6 max N.P. 10 max 10 max 11 min 11 min 10 max 10 max 11 min 11 mina
Usual types of significant
constituent materials
stone fragments,
gravel and sand fine sand silty or clayey gravel and sand silty soils clayey soils
General rating as a
subgrade excellent to good fair to poor
aPlasticity index of A-7-5 subgroup is equal to or less than the LL - 30. Plasticity index of A-7-6 subgroup is greater than LL - 30
Basic Characteristics of Soils
The description and classification of red soil and natural gravel, based on particle
size distribution results, are summarized in Table A7.3.
Table A7.3: Basic characteristics of red soil and natural gravel
Property/Material Red Soil Natural Gravel
Color Reddish Brown Grey
Texture Firm, Homogeneous Hard, Jointed
Weathering Full Partial
Parent Rock Volcanic, Basalt Volcanic, Basalt
Particle Size – a) Clay (%) 34 0
- b) Silt (%) 20 1
- c) Sand (%) 44 10
- d) Gravel (%) 2 89
Soil Description Clayey silty SAND Sandy GRAVEL
Classification - USCS MH GW
- AASHTO A-7-5 A-2-7
AASHTO Rating as Subgrade Poor Good
Kenyan Subgrade Strength Class S3 S6
Figure A7.1, however, represents the evaluation of natural gravel used in subbase
and base for possible fragmentation after its placement and compaction, as stipulated
by GoK (1986) and presented in section 2.3.2. The natural gravel, in its uncompacted

119
condition, is denoted as RGN 100. Resistance of the gravel to fragmentation may
also be deduced from the low ACV and AIV values presented in Table A7.9.
Figure A7.1: Plotting of natural gravel in grading envelopes for aggregates
Grading Envelope - RGN 100 Gravel
0
10
20
30
40
50
60
70
80
90
100
0.01 0.1 1 10 100
Particle Size (mm)
So
il P
assin
g (
%)
Upper
RGN 100_Av
Lower

120
Appendix II: Chemical and Mineralogical Composition
Table A7.4: Chemical composition of research materials
Department of Mines and Geology, Nairobi
Material Type Red Soil Natural Gravel Lime
Element Nature % % %
Silica, SiO2 40.672 50.748 -
Iron, Fe 25.396 13.727 0.492
Aluminium, Al2O3 26.649 13.413 1.858
Titanium, Ti 4.018 3.526 0.058
Sulphur, S 0.713 0.379 0.654
Phosphorous, P2O2 0.693 1.382 1.180
Manganese, Mn 0.451 0.216 0.023
Calcium, CaO, *(OH)2 0.429 13.622 *95.371
Potassium, K2O 0.226 2.494 -
Zirconium, Zr 0.200 0.070 0.028
Cerium, Ce 0.146 - -
Chloride, Cl 0.078 0.001 0.110
Niobium, Nb 0.062 0.015 -
Stronium, Sr 0.058 0.207 0.268
Barium, Ba 0.058 0.129 -
Zinc, Zn 0.021 0.014 0.001
Copper, Cu 0.012 0.020 0.003
Nickel, Ni 0.007 0.008 -
Yttrium, Y 0.006 0.008 -
SUM 99.895 99.989 100.046
(Courtesy: Department of Mines and Geology, Nairobi)
Table A7.5: Complete mineralogical analysis data on red soil
ICRAF, Nairobi
SSN icr177385 Site Othaya
Element %
Kaolinite 47.9
Microcline 18.4
Albite 12.6
Quartz 11.6
Hematite 9.5
Total Carbon 0.347
Acidified Carbon 0.327
Total Nitrogen 0.036
Acidified Nitrogen 0.035
(Courtesy: ICRAF, Nairobi)
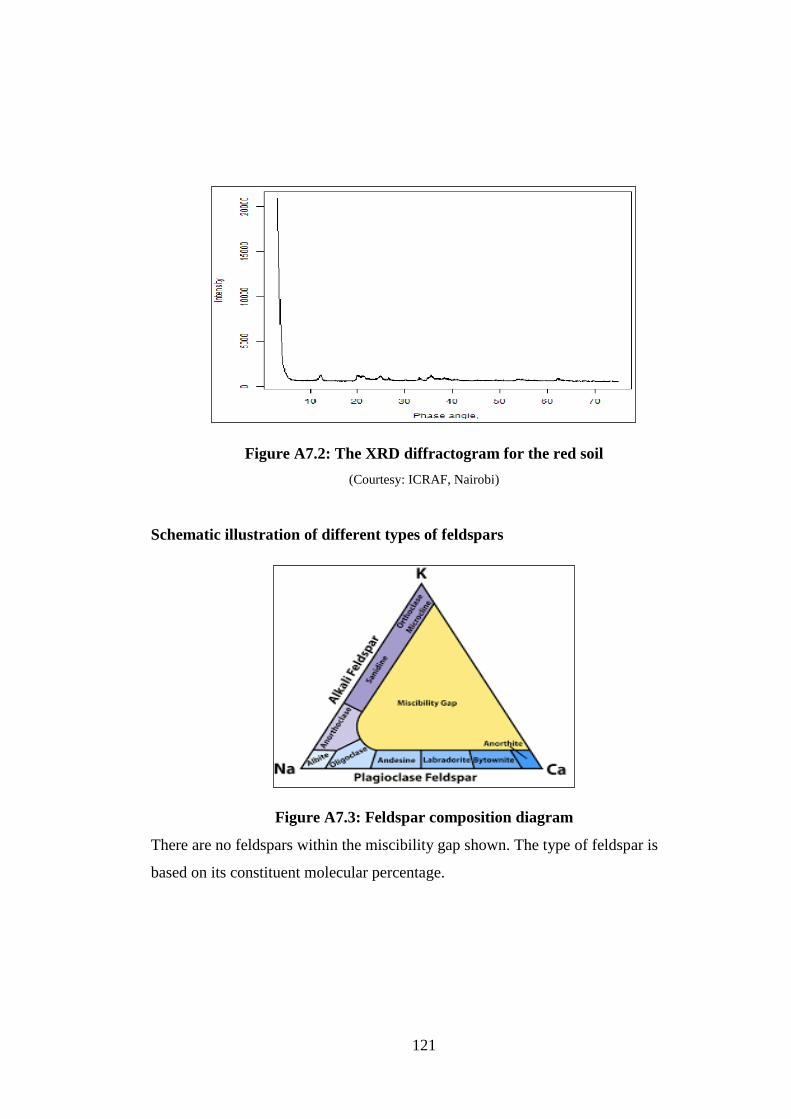
121
Figure A7.2: The XRD diffractogram for the red soil
(Courtesy: ICRAF, Nairobi)
Schematic illustration of different types of feldspars
Figure A7.3: Feldspar composition diagram
There are no feldspars within the miscibility gap shown. The type of feldspar is
based on its constituent molecular percentage.

122
Appendix III: Established Material Properties
Table A7.6: Potential volume change of soils by plasticity and climate
Potential Volume
Change
Humid Climate Arid & Semi-Arid Climate
PI % LS % PI % LS %
Low 0-30 0-12 0-15 0-5
Medium 30-50 12-18 15-30 5-12
High ˃50 ˃18 ˃30 ˃12
(Source: Hazelton & Murphy, 2007)
Table A7.7: Subgrade Beaing Strength Classes and Elastic modulus
Soil Class CBR Elastic Modulus
Range (%) Median (%) Kg/cm2 kN/m
2 (× 10
3)
S1 2-5 3.5 150 15
S2 5-10 7.5 500 50
S3 7-13 10 650 65
S4 10-18 14 900 90
S5 15-30 22.5 1250 125
S6 ≥30 - 2500 250
(Source: MoTC, 1987)

123
Appendix IV: Summarized Laboratory Results and Quality of Materials
Table A7.8: Summary of laboratory results for soil admixtures
Parameter Soil-Gravel Admixture (RGN)
Gravel Content % 0 20 40 60 80 100
Specific Gravity 2.79 2.79 2.78 2.77 2.75 2.73
Estimated Fines (<425 µm) % 82.1 66.5 51.0 35.4 19.9 4.30
Colloidal Activity % 0.37 0.38 0.45 0.60 1.10 2.10
Free Swell Index % 0 0.36 0.71 1.24 1.94 2.63
Liquid Limit (Cone) % 74.3 67.3 60.2 53.5 46.8 41.8
Plastic Limit % 44.2 42.2 38.2 33.9 28.8 24.2
Linear Shrinkage % 15.7 12.4 11.3 10.2 9.5 8.6
Plasticity Index % 30.1 25.1 22/0 19.7 18.0 17.6
Initial Lime % 4.60 3.91 3.31 2.90 2.50 2.38
Maximum Dry Density kg/m3 1325 1523 1707 1835 1945 2016
Optimum Moisture Content % 35.9 27.1 21.5 19.3 17.2 14.6
California Bearing Ratio CBR % 16.8 26.3 36.2 48.1 70.2 112.6
CBR Swell Factor % 0.84 0.68 0.55 0.45 0.37 0.31
Parameter Soil-Gravel-Lime Admixture (RGT)
Gravel Content % 0 20 40 60 80 100
Specific Gravity 2.77 2.76 2.76 2.75 2.73 2.71
Estimated Fines (<425 µm) % - - - - - -
Colloidal Activity % - - - - - -
Free Swell Index % 4.00 6.69 10.27 12.73 12.45 11.76
Liquid Limit (Cone) % 59.1 54.6 50.4 46.4 41.5 37.9
Plastic Limit % 47.0 44.0 41.2 38.3 34.3 31.3
Linear Shrinkage % 8.2 7.1 6.2 5.1 4.1 3.3
Plasticity Index % 12.0 10.6 9.2 8.1 7.2 6.6
Design Lime % 4.7 4.0 3.3 2.8 2.4 2.2
Maximum Dry Density kg/m3 1272 1476 1667 1805 1931 2006
Optimum Moisture Content % 37.4 28.5 22.5 20.2 17.9 15.1
California Bearing Ratio CBR % 31.5 46.5 73.8 115.0 130.2 138.5
CBR Swell Factor % 0.79 0.66 0.52 0.42 0.34 0.29
Table A7.9: Density and bearing strength of natural materials
Parameter Limit * Red Soil Natural Gravel
Proctor Maximum Dry Density (kg/m3) - 1255 -
Optimum Moisture Content (%) - 39.3 -
Proctor California Bearing Ratio (%) ≥ 2 10.6 -
Proctor Swelling Factor (%) < 2 0.89 -
Aggregate Crushing Value (%) < 45 - 23.97
Aggregate Impact Value (%) < 45 - 20.09
(*Source: MoTC, 1987; BS 882, 1992)

124
Table A7.10: Summarized Rating for Properties of Research Materials
Property Natural Materials Requirements Suitability
Red Soil Gravel Lime Limit Reference
Color Brown Gray White None Budhu (2011) Suitable
Moisture Content (%) 23.5 11.7 - 0-1200 Day (2010) Suitable
Specific Gravity 2.79 2.73 2.35 2.55-2.75 Smith (2014); Day (2010) Suitable
Gravel Fraction (%) 2 89 - None Suitable
Sand Fraction (%) 44 10 - None Suitable
Silt Fraction (%) 20 1 - None Suitable
Clay Fraction (%) 34 - - 50-80 Newill (1961); Terzaghi (1958) Unsuitable
Free Swell Index (%) 0 2.4 - 50 Holtz & Gibbs (1956) Suitable
Clay Activity 0.37 2 - Inactive/Active Skempton (1953) Suitable
Organic Matter (%) 0.35 - - 3-1 MoTC (1987); MoRPW (1986) Suitable
Clay Mineral, main Kaolinite - - None ICRAF Suitable
Chemical Compound, main Quartz, SiO2 Quartz, SiO2 Ca(OH)2 None State Dept of Mines Suitable
Free Lime as CaO (%) - - 72.5 50min MoRPW (1986) Suitable
Residue on 0.2 mm (%) - - 0.83 1max MoRPW (1986) Suitable
Residue on 0.075 mm (%) - - 1.8 10max MoRPW (1986) Suitable
Geological Description Recent Deposit Olivine Basalt - None Fairburn (1966); Shackleton (1945) Suitable
Textural Description Silty SAND Sandy GRAVEL Powder None Craig (2004) Suitable
USCS Classification Silt (MH) Gravel (GW) - None ASTM D 2487 Suitable
AASHTO Classification Clayey (A-7-5) Gravel (A-2-7) - None AASHTO M145 Suitable
AASHTO Rating as Subgrade Poor* Good - None AASHTO M145 Soil Unsuitable

125
Table A7.11: Summary of Material Properties for Subbase
Property Red Soil Gravel Materials Requirements Suitability
RGN RGT RGN RGT Limit Reference
Uniformity Coefficient (No) - - 9 - 5min MoTC (1987); MoRPW (1986) Suitable
Maximum Particle Size (mm) 5 - 50 - 63max; 10-50 MoRPW (1986) Suitable
Passing 2 mm (%) 98 - 11 - 95max MoTC (1987); MoRPW (1986) Suitable
Passing 0.425 mm (%) 82 - 4* - 15min MoTC (1987); MoRPW (1986) Grv Unsuitable
Passing 0.075 mm (%) 54 - 2* - 10-30; 50max MoTC (1987); MoRPW (1986) Grv Unsuitable
Plasticity Index, wet area (%) 30.1* 17.6* 12.0 6.6 5-12; 15max MoTC (1987); MoRPW (1986) Neat Unsuitable
Plasticity Modulus (%) 2472 986 75 28 2,500; 250max MoTC (1987); MoRPW (1986) Suitable
Linear Shrinkage (%) 15.7* 8.2 8.6 3.3 12max Hazelton & Murphy (2007) Soil Unsuitable
Hydrated Lime Required (%) - 4.7 - 2.2 2-4 MoTC (1987); MoRPW (1986) Suitable
Organic Matter (%) 0.35 - - - 2max MoTC (1987); MoRPW (1986) Suitable
MDD (Standard) (kg/m3) 1255 - - - None Suitable
OMC (Standard) (%) 39.3 - - - None Suitable
Subgrade Soaked CBR (%) 10.6 - - - 5-30 MoTC (1987); MoRPW (1986) Suitable
- CBR Swell factor (%) 0.89 - - - 2 max MoTC (1987); MoRPW (1986) Suitable
Subgrade Strength Class S3 - - - S2-S5 MoTC (1987); MoRPW (1986) Suitable
MDD (Modified) (kg/m3) 1325 1272 2016 2006 None Suitable
OMC (Modified) (%) 35.9 37.4 14.6 15.1 None Suitable
Subbase Soaked CBR (%) 16.8* 31.5 112.6 138.5 30-80 MoTC (1987); MoRPW (1986) Suitable
- CBR Swell factor (%) 0.84 0.79 0.31 0.29 2 max* MoTC (1987); MoRPW (1986) Suitable
Aggr Crushing Value (%) - - 24 - 35max MoTC (1987) Suitable
Aggregate Impact Value (%) - - 20 - 45max BS 882 (1992) Suitable

126
Appendix V: Stabilization Effect on Soil Plasticity and CBR
Reduction in plasticity index of any soil-gravel admixture was based on the value for
the neat red soil. The effect of natural gravel on PI was proportional to the gravel
content as shown in Figure A7.4. However, the net effect of hydrated lime dropped
with increasing gravel content. The combined effect of double stabilization stood at
about 60% of the neat red soil and no admixture became non-plastic.
Figure A7.4: Improvement in soil plasticity with stabilization method
Based on the CBR for neat red soil, the bearing strength was highly dependent on the
gravel content. Beyond about 25% gravel content, the net effect of hydrated lime was
exceeded by that of gravel as presented in Figure A7.5.
Figure A7.5: Gain in CBR with stabilization method
0
10
20
30
40
50
60
70
0 20 40 60 80 100
Gravel Content in Red Soil (%)
Stab
iliz
atio
n E
fect
on
Pla
stic
ity
(%)
Lime (Net)
Gravel (Total)
0
100
200
300
400
500
600
0 20 40 60 80 100Gravel Content in Red Soil (%)
Stab
iliz
atio
n E
ffe
ct o
n C
BR
(%
)
Gravel (Total)
Lime (Net)
Lime Stabilization