staar algebra 1 eoc rceporting ategory assessment items · staar algebra 1 eoc name: reporting...
TRANSCRIPT
Algebra 1
STAAR Algebra 1 EOC
Assessment Items
RCeporting
ategory5Includes 12 Multiple Choice
• Domain and Range of Exponential Functions• Graphing Exponential Functions and Identifying Key
Features• Writing and Interpreting Exponential Functions• Writing Exponential Functions to Fit Data
STAAR Algebra 1 EOC Name:
Reporting Category #5 TEK A.9 C (R)
1. An exponential function passes through the points (0, 5), (1, 4.25), and (2, 3.6125). Which function represents the same relationship?
A 𝑓 𝑥 = 5(0.15)𝑥
B 𝑓 𝑥 = 5(0.85)𝑥
C 𝑓 𝑥 = 0.15(5)𝑥
D 𝑓 𝑥 = 0.85(5)𝑥
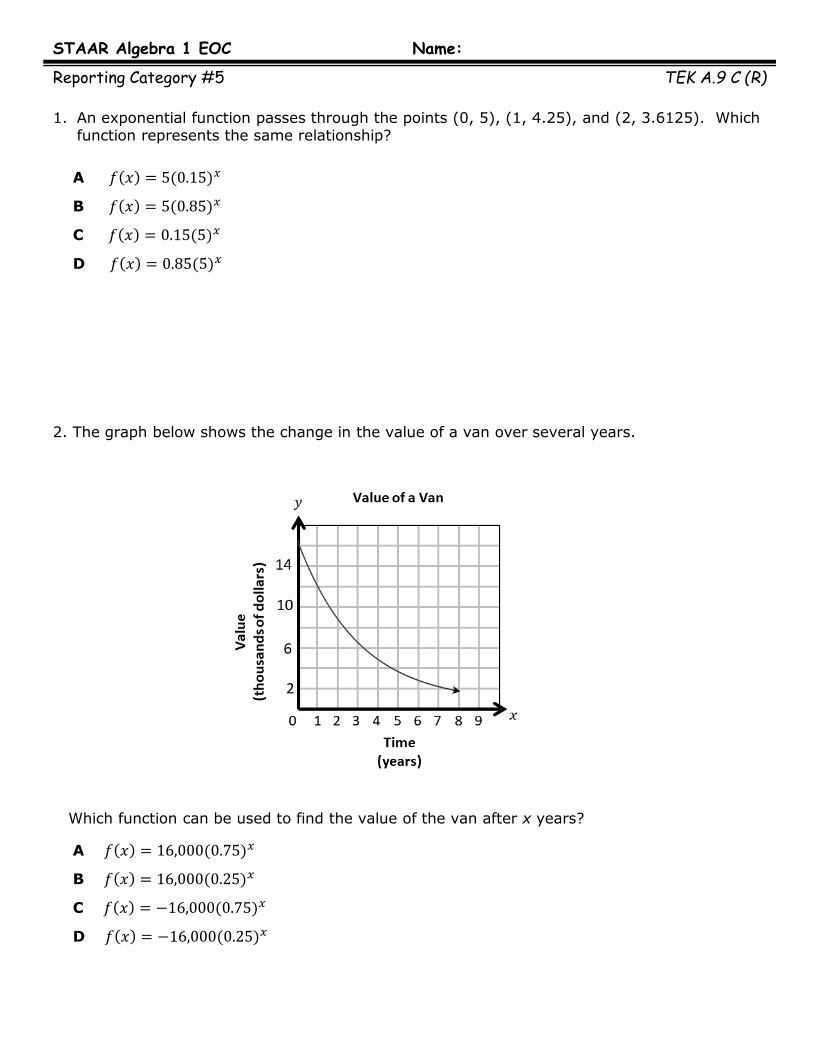
2. The graph below shows the change in the value of a van over several years.
Which function can be used to find the value of the van after x years?
A 𝑓 𝑥 = 16,000(0.75)𝑥
B 𝑓 𝑥 = 16,000(0.25)𝑥
C 𝑓 𝑥 = −16,000(0.75)𝑥
D 𝑓 𝑥 = −16,000(0.25)𝑥
STAAR Algebra 1 EOC Name:
Reporting Category #5 TEK A.9 C (R)
3. There were 200 visitors to an online website in January. Since then, visitors to this website have increased at a rate of 10% per month. At this rate of growth, which function an be used to determine the monthly number of visitors to the website m months after January?
A 𝑔 𝑚 = 200(0.1)𝑚
B 𝑔 𝑚 = 200(0.9)𝑚
C 𝑔 𝑚 = 200(10)𝑚
D 𝑔 𝑚 = 200(1.1)𝑚
STAAR Algebra 1 EOC Name:
Reporting Category #5 TEK A.9 D (R)
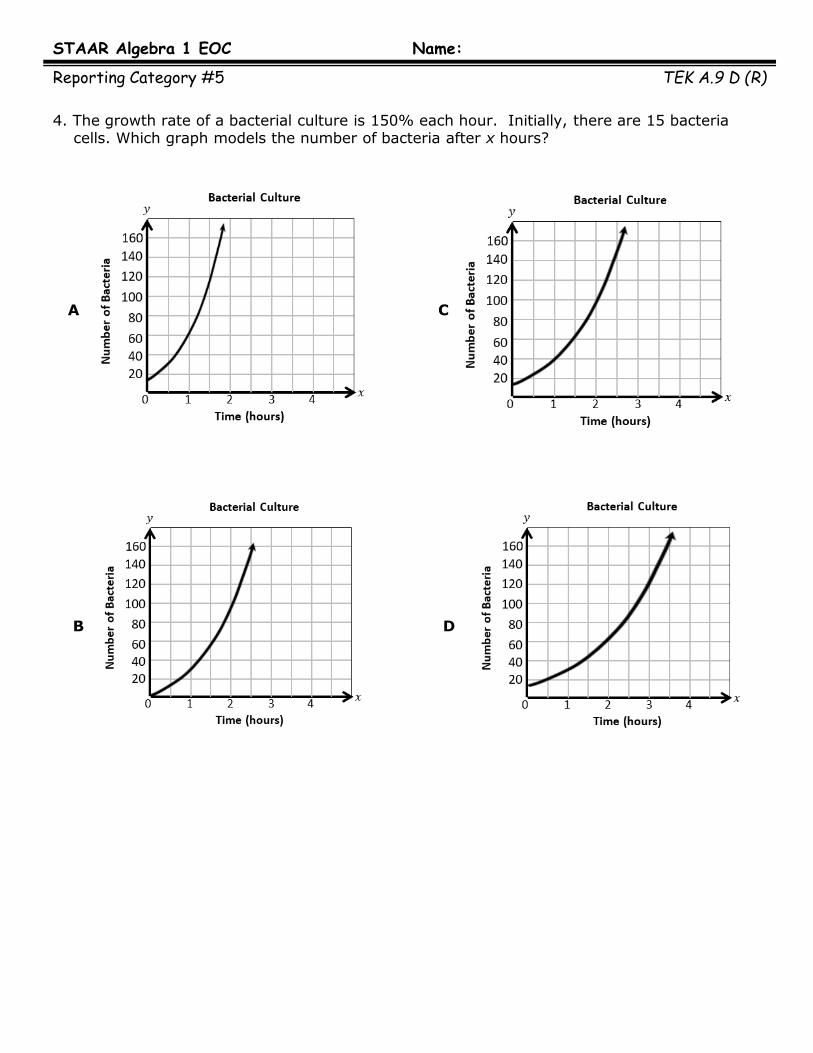
4. The growth rate of a bacterial culture is 150% each hour. Initially, there are 15 bacteria cells. Which graph models the number of bacteria after x hours?
A C
B D

STAAR Algebra 1 EOC Name:
Reporting Category #5 TEK A.9 D (R)
5. What is the asymptote of the exponential function graphed on the grid?
A 𝑦 = −4
B 𝑦 = 4
C 𝑦 = 9
D 𝑦 = 0
6. A construction company purchased a new vehicle. The graph below shows the approximate value of the vehicle after x years.
Based on the graph, which statement appears to be true?
A The value of the vehicle is $38,000 at the end of 4 years.
B The company purchased the vehicle for $64,000.
C The value of the vehicle decreases by $3,000 each year.
D Every year the value of the car decreases by 35% each year.
STAAR Algebra 1 EOC Name:
Reporting Category #5 TEK A.9 A (S)
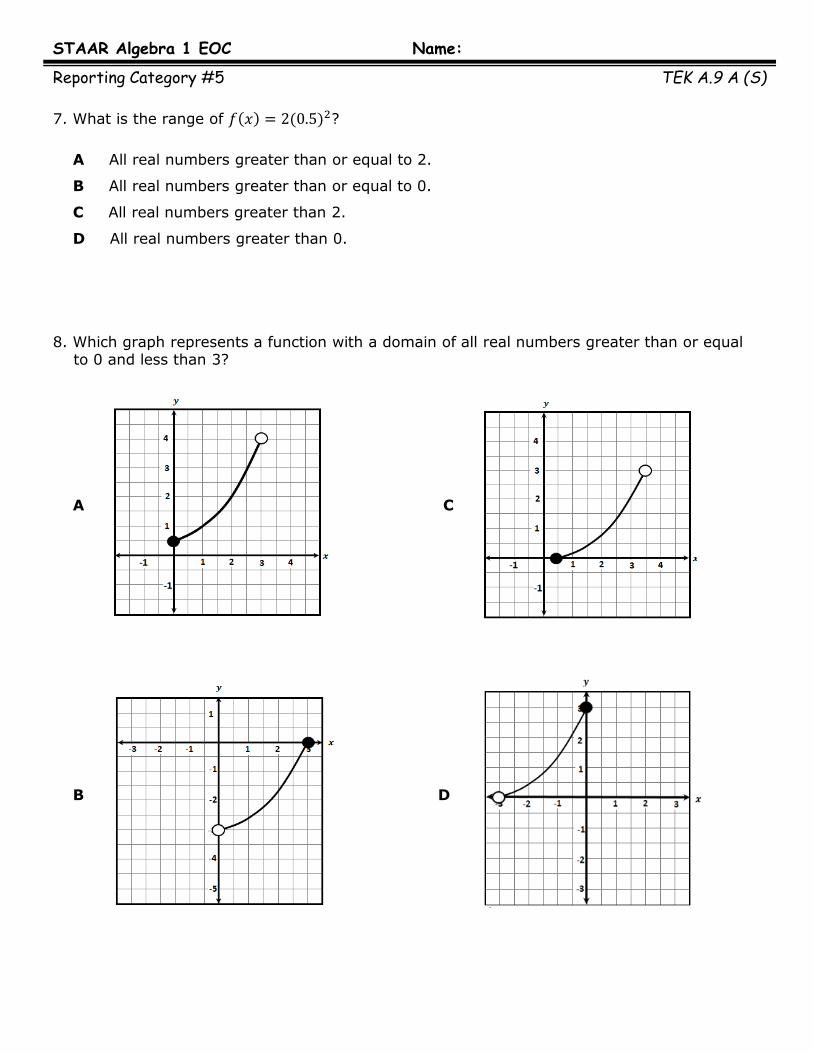
7. What is the range of 𝑓 𝑥 = 2(0.5)2?
A All real numbers greater than or equal to 2.
B All real numbers greater than or equal to 0.
C All real numbers greater than 2.
D All real numbers greater than 0.
8. Which graph represents a function with a domain of all real numbers greater than or equal to 0 and less than 3?
A C
B D

STAAR Algebra 1 EOC Name:
Reporting Category #5 TEK A.9 B (S)
9. An antique wedding ring was sold at an auction. The value of the ring can be found by using the formula 𝑓 𝑥 = 120(1.15)𝑥, where 𝑓(𝑥) represents the value of the ring after x years. What is the initial value of the ring?
A $115
B $120
C $138
D $235
10. The table below shows the amount of radioactive substance in milligrams remaining after x days.
Which situation best represents the data in the table?
A The amount of radioactive substance remaining decreases by approximately 93% per
day.
B The amount of radioactive substance remaining decreases by approximately 5.5%
per day.
C The amount of radioactive substance remaining decreases by approximately 7% per
day.
D The amount of radioactive substance remaining decreases by approximately 0.07%
per day.

STAAR Algebra 1 EOC Name:
Reporting Category #5 TEK A.9 E (S)
11. The table shows the number of CDs purchased at a store after x years.
Which function best models the data?
A 𝑦 = 79,000(0.63)𝑥
B 𝑦 = 79,000(0.1)𝑥
C 𝑦 = 120,500(0.63)𝑥
D 𝑦 = 120,500(1.58)𝑥
12. The number of visitors to a new art museum after x months can be modeled by the exponential function graphed on the grid.
Based on the data, which is closest to the number of visitors at the end of 6 months?
A 48
B 55
C 100
D 70
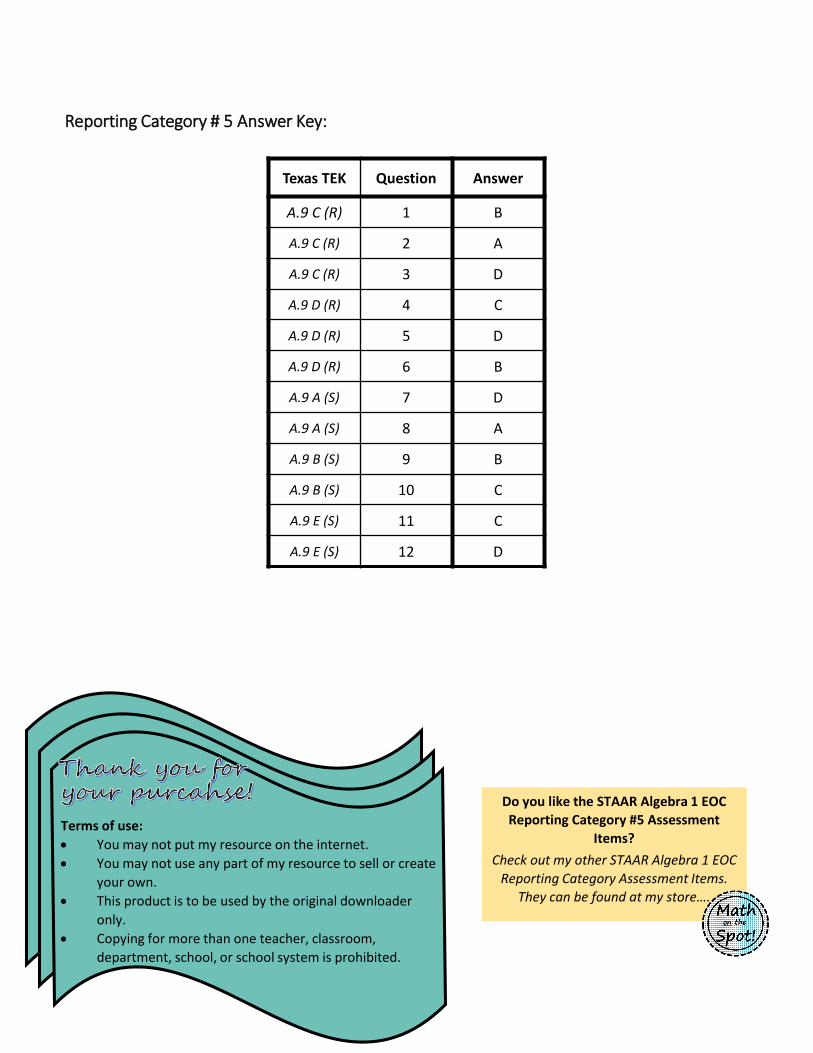
Reporting Category # 5 Answer Key:
Texas TEK Question Answer
A.9 C (R) 1 B
A.9 C (R) 2 A
A.9 C (R) 3 D
A.9 D (R) 4 C
A.9 D (R) 5 D
A.9 D (R) 6 B
A.9 A (S) 7 D
A.9 A (S) 8 A
A.9 B (S) 9 B
A.9 B (S) 10 C
A.9 E (S) 11 C
A.9 E (S) 12 D
Terms of use:
You may not put my resource on the internet.
You may not use any part of my resource to sell or create
your own.
This product is to be used by the original downloader
only.
Copying for more than one teacher, classroom,
department, school, or school system is prohibited.
Do you like the STAAR Algebra 1 EOC Reporting Category #5 Assessment
Items?
Check out my other STAAR Algebra 1 EOC
Reporting Category Assessment Items.They can be found at my store….