staar end-of-course (eoc) assessments
TRANSCRIPT

End-
of-C
ours
e A
sses
smen
ts
2021 TEXAS STUDENT ASSESSMENT PROGRAM INTERPRETING ASSESSMENT REPORTS 3.1
STAAR End-of-Course (EOC) Assessments
Program OverviewRefer to the table in the General Information section that includes the assessments available for the EOC program.
STAAR EOCThe STAAR EOC assessments measure students’ academic performance in core high school courses (Algebra I, English I, English II, Biology, U.S. History). These assessments became part of the graduation requirements beginning with the freshman class of 2011–2012. Algebra II and English III will be available in spring 2021 for districts to administer as optional assessments.
Students are required to take the STAAR EOC assessments for courses in which they’re enrolled as part of their graduation requirements.
Paper and online administrations are available for the STAAR EOC assessments.
STAAR with Embedded SupportsEmbedded supports (e.g., text-to-speech and content and language supports) are available on STAAR assessments for eligible students as individual embedded online accommodations. Paper administrations with embedded supports are also available for eligible students requiring a paper administration of STAAR. Paper administrations with embedded supports require approval of the Texas Education Agency (TEA) and contain only some of the supports available in the online assessments with embedded supports.
The Speech-To-Text (STT) tool is available online for students who meet the eligibility criteria for Basic Transcribing or Spelling Assistance, AND for whom Speech-To-Text is the most appropriate method of delivery for these supports.
Only available for tests with a composition open entry response box (grades 4 & 7 writing, and English I, English II, and English III, and grade 4 Spanish writing).
STAAR Refreshable BrailleOnline screen reader support for refreshable braille displays is available for eligible students as an individual online accommodation.
STAAR American Sign Language VideoAmerican Sign Language videos are available online for eligible students as individual embedded online accommodations.
End-
of-C
ours
e A
sses
smen
ts
2021 TEXAS STUDENT ASSESSMENT PROGRAM INTERPRETING ASSESSMENT REPORTS 3.2
Assessment ScoresThe following gives a brief description of the scores provided for the STAAR EOC assessments. For more detailed technical information about assessment scores, refer to the Technical Digest, available on T E A’s Student Assessment Division webpage.
Raw ScoreThe raw score is the number of items answered correctly on an assessment. By itself, the raw score has limited utility; it can be interpreted only in reference to the total number of items on a subject-area assessment, and raw scores should not be compared across administrations.
The raw score is reported by overall assessment and by reporting category.
Scale ScoreThe scale score is used for all STAAR EOC assessments. Refer to the table in the General Information section that includes the assessments available for the EOC program.
The scale score is a statistic that allows a comparison of scores by adjusting for variations in the difficulty of the forms used in different administrations. Thus, the scale score can be used to determine whether a student achieved Approaches, Meets, or Masters Grade Level performance, to compare one student to another taking the same assessment, and to compare cohorts of students taking the same assessment in different years. However, the scale score cannot be used to evaluate a student’s progress across grades or courses.
Performance StandardsThe following gives a brief description of the performance levels used on the STAAR EOC assessments.
Masters Grade LevelPerformance in this category indicates that students are expected to succeed in the next grade or course with little or no academic intervention. Students in this category demonstrate the ability to think critically and apply the assessed knowledge and skills in varied contexts, both familiar and unfamiliar.
* For Algebra II and English III, this level of performance also indicates students are well prepared for postsecondary success.

End-
of-C
ours
e A
sses
smen
ts
2021 TEXAS STUDENT ASSESSMENT PROGRAM INTERPRETING ASSESSMENT REPORTS 3.3
Meets Grade LevelPerformance in this category indicates that students have a high likelihood of success in the next grade or course but may still need some short-term, targeted academic intervention. Students in this category generally demonstrate the ability to think critically and apply the assessed knowledge and skills in familiar contexts.
** For Algebra II and English III, this level of performance also indicates students are sufficiently prepared for postsecondary success.
Approaches Grade LevelPerformance in this category indicates that students are likely to succeed in the next grade or course with targeted academic intervention. Students in this category generally demonstrate the ability to apply the assessed knowledge and skills in familiar contexts.
Did Not Meet Grade LevelPerformance in this category indicates that students are unlikely to succeed in the next grade or course without significant, ongoing academic intervention. Students in this category do not demonstrate a sufficient understanding of the assessed knowledge and skills.
Appropriate Score UsesSTAAR EOC assessment results have several uses, both for individual students and for comparing the performance of groups. A more detailed explanation of appropriate score uses can be found in the Technical Digest, available on T E A’s Student Assessment Division webpage.
Individual StudentsThe STAAR EOC scale score indicates whether a student has met a performance level and how far the student’s achievement is above or below a performance level. All students not achieving Approaches Grade Level performance on a STAAR EOC assessment must be offered additional instruction.
Assessment results can be used to compare the performance of an individual student to the performance of a de mographic group, a program group, or an entire campus or district in a particular course. For example, the scores for a Hispanic student in a gifted and talented program could be compared to the average scores of Hispanic students, to other gifted and talented students, or to all the students at the campus being assessed in the course.

End-
of-C
ours
e A
sses
smen
ts
2021 TEXAS STUDENT ASSESSMENT PROGRAM INTERPRETING ASSESSMENT REPORTS 3.4
Groups of StudentsAssessment scores can be used to compare the performance of different demographic or program groups. All STAAR EOC scores can be analyzed within the same course for any single administration to determine which demographic or program group had the highest average scale score, the lowest percentage achieving each performance level, the highest percentage achieving Masters Grade Level performance, etc.
Other scores can be used to help evaluate the academic performance of demographic or program groups in core academic areas. For example, aggregations of reporting-category data can help districts and campuses identify areas of potential academic weakness for a group of students. This same methodology can be applied to an entire campus or district.
In addition, all assessment scores can be compared to regional and statewide performance within the same course for any administration.
Cautions for Score UseSeveral cautions must be kept in mind when analyzing the STAAR EOC assessment results. More detailed technical information describing cautions for score use is provided in the Technical Digest, available on T E A’s Student Assessment Division webpage.
Scale ScoresScale scores allow for a comparison of assessment scores, within a course, across administrations. For example, if a student takes the STAAR Algebra I assessment in May and takes the assessment again in June, the scores from those administrations could be compared.
The scale score cannot be used to compare assessment scores across courses. For example, it is not appropriate to say that a 3800 on the STAAR Biology assessment represents the same level of achievement as a 3800 on the STAAR Algebra I assessment.
Using Reporting-Category InformationReporting-category information at the individual student level should be used with caution due to the limited number of items in each reporting category. When aggregated at the campus or district level, such information might be useful in helping campuses identify skill areas in which further diagnosis is warranted. As with all assessments given at a single point in time, the data generated from this snapshot should be used in conjunction with other evaluations of performance to provide an in-depth portrait of student achievement. Once an area of possible weakness has been identified, supplementary data should be gathered to further define what instructional intervention would be most effective.
End-
of-C
ours
e A
sses
smen
ts
2021 TEXAS STUDENT ASSESSMENT PROGRAM INTERPRETING ASSESSMENT REPORTS 3.5
Furthermore, because each STAAR EOC assessment is equated only at the total assessment level and there have been changes to the curriculum and the assessment, year-to-year comparisons of reporting-category performance should be made cautiously. The assessment is constructed to make the difficulty of a given reporting category similar for each administration of a STAAR EOC assessment. However, some fluctuations in the difficulty of the reporting categories do occur at every administration. Observing trends in reporting-category performance over time, identifying patterns of performance in clusters of reporting categories assessing similar skills, and comparing campus or district reporting-category performance to that of the region or state are appropriate uses of group reporting-category information.
Raw Score Distribution for Essay QuestionsBecause the essay questions from different administrations could be different items, the raw score distributions across administrations are not directly comparable.
Program EvaluationStandardized assessments are a valuable tool for evaluating programs. However, any assessment can furnish only one part of the picture. The STAAR EOC assessments are not able to identify, let alone measure, every factor that contributes to the success or failure of a program. Assessment results can be most helpful if considered as one component of an evaluation system.
The Passing Standard and Items CorrectThe passing standards for STAAR EOC are related to two factors: (1) the difficulty of the items on the assessments and (2) the number of items students have to answer correctly to pass. The standard is set on the original form of each course assessment. When different items are used in another administration, the difficulty of the items, and thus the overall difficulty of the assessment, might fluctuate. To compensate for slight changes in difficulty, the number of items needed to pass the assessment is adjusted.
Report FormatsStandard and additional reports are available for the STAAR EOC assessments. Assessment reports are provided automatically to districts. Additional services for assessment reports are also available for a fee to districts. A district must submit a request through the STAAR Assessment Management System to receive additional copies of the STAAR report card or Confidential Student Label.
Reports that include “confidential” in the title contain student-level results. All other reports present assessment results in an aggregated format. More information about the confidentiality of students’ assessment results is contained in the General Information section.
End-
of-C
ours
e A
sses
smen
ts
2021 TEXAS STUDENT ASSESSMENT PROGRAM INTERPRETING ASSESSMENT REPORTS 3.6
Note that the sample reports included in this guide are for illustration only. They are provided to show the basic layout of the reports and the information they provide. Some information might not correspond to real values.
ResourcesRefer to the General Information section of this guide and T E A’s Student Assessment Division webpage for additional STAAR EOC informa tion and resources.

End-
of-C
ours
e A
sses
smen
ts
2021 TEXAS STUDENT ASSESSMENT PROGRAM INTERPRETING ASSESSMENT REPORTS 3.7
Assessment ReportsInformation contained in the assessment reports is sufficient to satisfy mandatory reporting requirements (refer to the General Information section). The following section of the guide describes the STAAR EOC assessment reports that districts receive:
STAAR Report Card 3.8
Confidential Student Label 3.14
Confidential Campus Roster 3.17
Summary Report 3.22
Constructed Responses Summary Report 3.26
Confidential Images of Essays 3.29
Confidential Student Item Analysis Report 3.32
Item Analysis Summary Report 3.35
Electronic Individual Student Record File (Confidential) 3.37

End-
of-C
ours
e A
sses
smen
ts
2021 TEXAS STUDENT ASSESSMENT PROGRAM INTERPRETING ASSESSMENT REPORTS 3.8
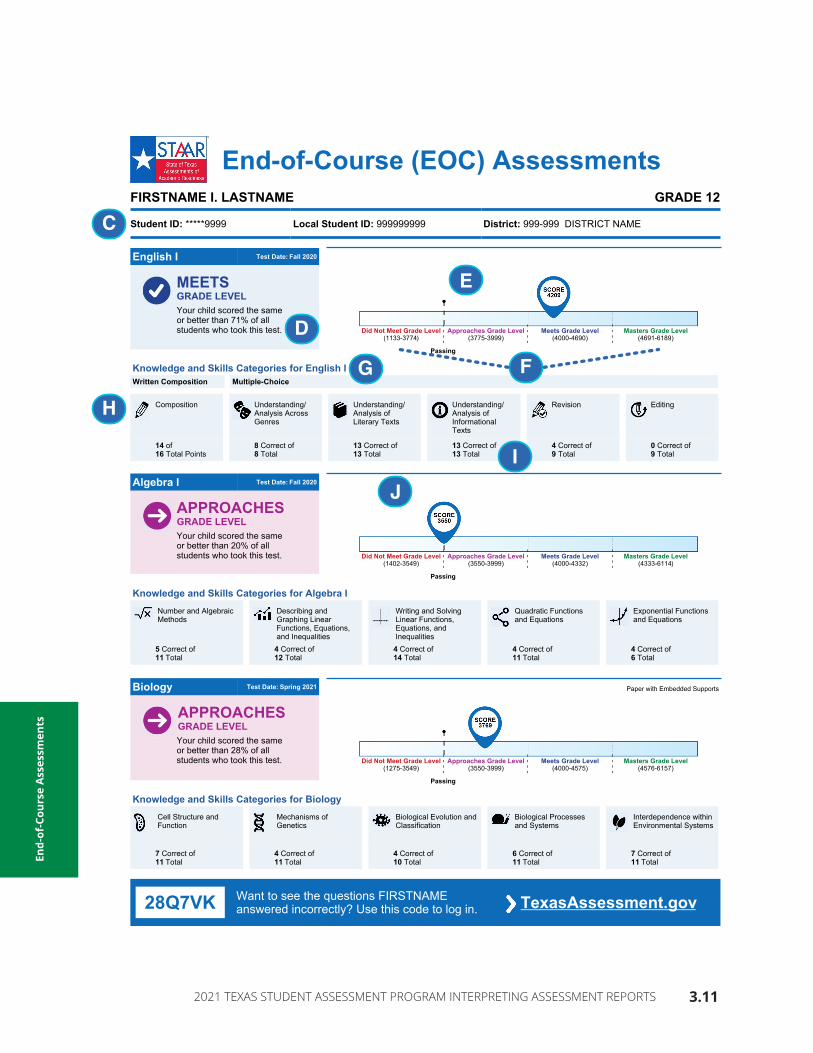
STAAR Report CardExamples shown: STAAR Grade 12
A separate STAAR Report Card is provided for each student for whom a STAAR EOC answer document or online record was submitted. Information from this report is useful when reporting assessment results to students and parents. Results for students taking one or more STAAR subjects will be combined on the same STAAR Report Card.
A. Performance At a GlanceThis shows the student’s performance levels for all the EOC assessments the student has taken to date. If the student has taken one test more than once, his or her best performance level for that test will be shown in this section.
B. Student Portal InformationThis provides the web address and access code for parents and students to access information from the STAAR Report Card online.
C. Student and School Identification InformationThe top of the STAAR Report Card contains identification information, for both the student (name, identification number, etc.) and the school (district, class group, etc.). For confidentiality, the student identification number (PEIMS) is indicated by five asterisks followed by the last four digits of the ID number. The grade and the report date are also indicated.
D. PercentileThis shows the percentage of students who scored below the student’s score when comparing the student’s performance to all Texas students who took the same test last year. For more information about last year’s scoring distribution, visit T E A’s STAAR Frequency Distributions webpage.
E. Student’s Scale ScoreThis is the student’s scale score, which is an indicator of his or her performance on the test. The STAAR scale score allows you to compare the student’s score with the score ranges of the Did Not Meet Grade Level, Approaches Grade Level, Meets Grade Level, and Masters Grade Level performance. The scale score indicates how far above or below these performance standards that the student has achieved.
F. Scale Score BarThis bar shows how well students could perform on the test. The placement of the student’s scale score shows where he or she actually performed on the test. The scores needed to achieve Approaches Grade Level, Meets Grade Level, and Masters Grade Level performance are also marked on the scale score bar.
G. Reporting CategoriesThe content and skills tested on each STAAR assessment are grouped together. Each group is called a reporting category. The categories for each subject are listed in this review description section.

End-
of-C
ours
e A
sses
smen
ts
2021 TEXAS STUDENT ASSESSMENT PROGRAM INTERPRETING ASSESSMENT REPORTS 3.9
H. Weighted ScoreThis shows the points the student earned on the written composition out of the total points possible in the English tests. The process of weighting assessment scores emphasizes the contribution of the written composition when computing the final score. The raw score for English I, English II, and English III are calculated by adding the number of multiple choice items answered correctly to the weighted composition score [Number of multiple choice items answered correctly + (written composition score x 2)].
If a student had 44 of the 52 multiple choice items correct and received a score of 6 on the written composition, the student’s total raw score would be 56 out of possible 68 possible raw score points [44 + (6 x 2)].
I. Answered CorrectlyThis shows the number of questions the student answered correctly out of the total number of questions tested in each reporting category.
J. STAAR Progress MeasureThe STAAR Progress Measure is reported for students taking the Algebra I assessment for the first time if their 2018–2019 mathematics assessment was STAAR. The STAAR Progress Measure is reported for students taking the English II assessment for the first time if they took the English I assessment for the first time in the 2018–2019 accountability year. It is based on a comparison of a student’s English I or previous mathematics assessment score with his or her English II or Algebra I score. This measure gives you information about how much the student improved in the subject. Individual student progress is then categorized as Limited, Expected, or Accelerated.
Additional information about the STAAR Progress Measures can be found in the STAAR Resources section on TEA’s website.
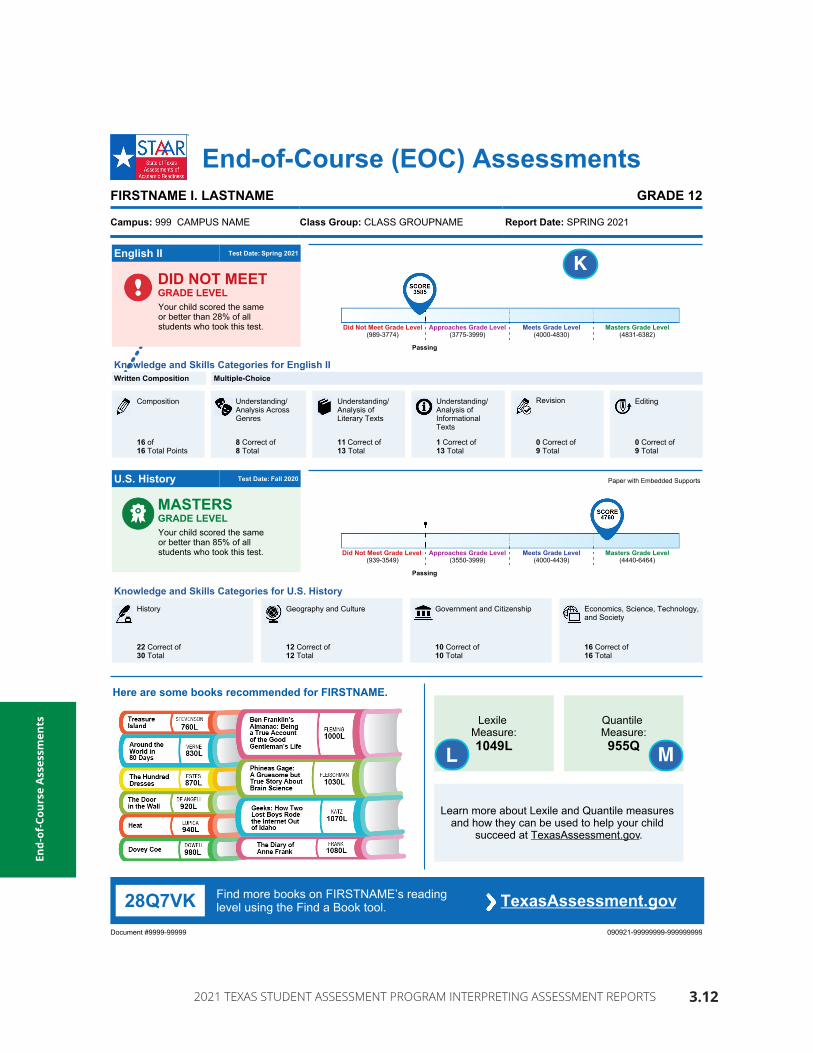
K. Test InformationThis shows whether the student took the STAAR assessment with embedded supports on paper or took the STAAR assessment online with or without embedded supports.
L. Lexile Measure The Lexile measure indicates the difficulty of the materials that the student should be able to read successfully. The Lexile measure for STAAR students is reported in the range of Beginning Reader (BR or 0L) to a positive value in each grade (e.g., 1100L at grade 3, 1200L at grade 4, and so on).
M. Quantile Measure The Quantile measure indicates the progress made in learning mathematics content and what new mathematics content they may be ready to learn next. The Quantile measure for STAAR students is reported in the range of Emerging Mathematician (EM or 0L) to a positive value in each grade (e.g., 400Q at grade 3, 500Q at grade 4 and so on).
N. Resources These are strategies for college and career planning.

End-
of-C
ours
e A
sses
smen
ts
2021 TEXAS STUDENT ASSESSMENT PROGRAM INTERPRETING ASSESSMENT REPORTS 3.10
Confidential 2021 STAAR Report Card for:
FIRSTNAME LASTNAMEFIRSTNAME’S PERFORMANCE AT A GLANCE
MeetsGrade Level
Test Date: Fall 2020
English I
ApproachesGrade Level
Test Date: Fall 2020
Algebra I
ApproachesGrade Level
Test Date: Spring 2021
Biology
Did Not MeetGrade Level
Test Date: Spring 2021
English II
MastersGrade Level
Test Date: Fall 2020
U.S. History
Go to TexasAssessment.gov and log in to learn more.
FIRSTNAME'SUNIQUE ACCESS
CODE 28Q7VKFrom The CommissionerTests are a part of life. Our kids will take tests to get a driver's license, to get into college, and even to get certain jobs. As a parent of four myself, I know that no one test can tell me everything about my children. But the STAAR tests have been designed to provide useful information about how much our children have learned academically and how well prepared they are for what comes next.
Students who meet or master grade level by high school graduation have more than a 60% chance of passing their college classes, substantially increasing their lifetime earnings and prospects for success. This report is intended to give you information on how well your child learned this year's academic material in school and how you can help them learn even more.
Maximize Time During Parent Teacher ConferencesSample Questions to Ask the Teacher:• .What do you see as my child’s strengths?• .What does my child seem to be the most interested in at school?• .Does my child get along well with their classmates?• .What is the most important thing that I can be doing to prepare my child
for college, a career, or the military?• .Is my child giving his/her best effort?• .What could my child be doing that he/she is not already doing?• .What do you think are the biggest challenges for my child, and how can
I help him/her with those challenges?
What the Results MeanThis report shows how well your child did on the STAAR. There are four levels of Performance.
MASTERS GRADE LEVELMastery of the course knowledge and skills is shown — student is on track for college and career readiness.
MEETS GRADE LEVELStrong knowledge of course content — student is prepared to progress to the next grade.
APPROACHES GRADE LEVELSome knowledge of course content but may be missing critical elements — student needs additional support in the coming year.
DID NOT MEET GRADE LEVELNo basic understanding of course expectations is shown — student may need significant support in the coming year.
Mike Morath, Commissioner of Education
A
B
End-
of-C
ours
e A
sses
smen
ts
2021 TEXAS STUDENT ASSESSMENT PROGRAM INTERPRETING ASSESSMENT REPORTS 3.11
End-of-Course (EOC) AssessmentsFIRSTNAME I. LASTNAME GRADE 12
Student ID: *****9999 Local Student ID: 999999999 District: 999-999 DISTRICT NAME
28Q7VK Want to see the questions FIRSTNAME answered incorrectly? Use this code to log in. TexasAssessment.gov
RUI = 0 ReportDocID = 9999999999999999_0046000605090699_0045410604000728_0045380602027987_0044980605273353
English I Test Date: Fall 2020
MEETSGRADE LEVELYour child scored the same or better than 71% of all students who took this test. Did Not Meet Grade Level
(1133-3774)Approaches Grade Level
(3775-3999)Meets Grade Level
(4000-4690)Masters Grade Level
(4691-6189)
Passing
Knowledge and Skills Categories for English IWritten Composition Multiple-Choice
Composition Understanding/ Analysis Across Genres
Understanding/ Analysis of Literary Texts
Understanding/ Analysis of Informational Texts
Revision Editing
14 of16 Total Points
8 Correct of8 Total
13 Correct of13 Total
13 Correct of13 Total
4 Correct of9 Total
0 Correct of9 Total
Algebra I Test Date: Fall 2020
APPROACHESGRADE LEVELYour child scored the same or better than 20% of all students who took this test. Did Not Meet Grade Level
(1402-3549)Approaches Grade Level
(3550-3999)Meets Grade Level
(4000-4332)Masters Grade Level
(4333-6114)
Passing
Knowledge and Skills Categories for Algebra INumber and Algebraic Methods
Describing and Graphing Linear Functions, Equations, and Inequalities
Writing and Solving Linear Functions, Equations, and Inequalities
Quadratic Functions and Equations
Exponential Functions and Equations
5 Correct of11 Total
4 Correct of12 Total
4 Correct of14 Total
4 Correct of11 Total
4 Correct of6 Total
Biology Test Date: Spring 2021 Paper with Embedded Supports
APPROACHESGRADE LEVELYour child scored the same or better than 28% of all students who took this test. Did Not Meet Grade Level
(1275-3549)Approaches Grade Level
(3550-3999)Meets Grade Level
(4000-4575)Masters Grade Level
(4576-6157)
Passing
Knowledge and Skills Categories for BiologyCell Structure and Function
Mechanisms of Genetics
Biological Evolution and Classification
Biological Processes and Systems
Interdependence within Environmental Systems
7 Correct of11 Total
4 Correct of11 Total
4 Correct of10 Total
6 Correct of11 Total
7 Correct of11 Total
D
H
I
J
G
C
E
F
End-
of-C
ours
e A
sses
smen
ts
2021 TEXAS STUDENT ASSESSMENT PROGRAM INTERPRETING ASSESSMENT REPORTS 3.12
End-of-Course (EOC) AssessmentsFIRSTNAME I. LASTNAME GRADE 12
Campus: 999 CAMPUS NAME Class Group: CLASS GROUPNAME Report Date: SPRING 2021
Here are some books recommended for FIRSTNAME.
Lexile Measure:1049L
Quantile Measure:955Q
Learn more about Lexile and Quantile measures and how they can be used to help your child
succeed at TexasAssessment.gov.
28Q7VK Find more books on FIRSTNAME’s reading level using the Find a Book tool. TexasAssessment.gov
Document #9999-99999 090921-99999999-999999999
English II Test Date: Spring 2021
DID NOT MEETGRADE LEVELYour child scored the same or better than 28% of all students who took this test. Did Not Meet Grade Level
(989-3774)Approaches Grade Level
(3775-3999)Meets Grade Level
(4000-4830)Masters Grade Level
(4831-6382)
Passing
Knowledge and Skills Categories for English IIWritten Composition Multiple-Choice
Composition Understanding/ Analysis Across Genres
Understanding/ Analysis of Literary Texts
Understanding/ Analysis of Informational Texts
Revision Editing
16 of16 Total Points
8 Correct of8 Total
11 Correct of13 Total
1 Correct of13 Total
0 Correct of9 Total
0 Correct of9 Total
U.S. History Test Date: Fall 2020 Paper with Embedded Supports
MASTERSGRADE LEVELYour child scored the same or better than 85% of all students who took this test. Did Not Meet Grade Level
(939-3549)Approaches Grade Level
(3550-3999)Meets Grade Level
(4000-4439)Masters Grade Level
(4440-6464)
Passing
Knowledge and Skills Categories for U.S. HistoryHistory Geography and Culture Government and Citizenship Economics, Science, Technology,
and Society
22 Correct of30 Total
12 Correct of12 Total
10 Correct of10 Total
16 Correct of16 Total
K
L M

End-
of-C
ours
e A
sses
smen
ts
2021 TEXAS STUDENT ASSESSMENT PROGRAM INTERPRETING ASSESSMENT REPORTS 3.13
RESOURCES TAILORED FOR FIRSTNAMEPlan for College
Learning about Colleges and Degree Programs
• .Visit colleges and universities that interest you and meet with visiting college admissions representatives at your school.
• .Familiarize yourself with college admissions requirements, application deadlines, and tuition costs.
Preparing for College in High School• .Enroll in advanced coursework, such as
Advanced Placement and International Baccalaureate classes, and dual credit options offered by a local community college.
• .Prepare for the SAT and/or ACT. • .Learn about ways to pay for college (e.g.,
available scholarships, the FAFSA and TASFA).
Building a College Resume• .Take on leadership roles within extracurricular
activities and community service opportunities (colleges look for students who are active leaders in their schools).
• .Practice writing a college application essay.
Prepare for a Career
Exploring Career Options• .Research local or regional demand for
careers and occupations aligned to your coursework and endorsement.
• .Interview or explore videos of career professionals who can explain their work responsibilities and requirements for success.
• .Talk with a recruiter about military enlistment options.
Planning a Course of Study• .Explore associates degree or post-secondary
career certification programs aligned with your Career and Technical Education (CTE) coursework.
• .Enroll in a capstone CTE practicum course that offers real-world experiences and/or work-based learning opportunities (e.g., apprenticeships, job-shadowing, or paid internships).
Exploring Career-based Opportunities• .Take advantage of opportunities to intern or
job-shadow at a local business or other organization.
• .Consider participating in summer career skill-building programs hosted by businesses or other organizations.
College and Career Planning Suggested Questions To Ask Your High School Counselor
1. When is the next opportunity to attend a college tour or meet with a college admissions representatives? 2. Where can I get assistance completing college applications (and essays) needed for Apply Texas and the
Common App? 3. Which community college programs have the best career training programs related to my endorsement and
coursework? 4. What other college credit and career prep classes can I take in 12th grade? Which dual credit, AP, or
International Baccalaureate courses will help me achieve my goals? 5. What are the exam schedules for the ACT and SAT? What college exam prep does our district offer? 6. Where can I find information about summer internships with local businesses/organizations? 7. Where can I learn about completing the FAFSA and TASFA? How do I create a PIN? 8. Where can I find information about potential college scholarship opportunities?
Confidential 2020 STAAR Report Card for:
FIRSTNAME LASTNAMEFIRSTNAME’S PERFORMANCE AT A GLANCE
MeetsGrade Level
Test Date: Summer 2019
English I
MastersGrade Level
Test Date: Summer 2019
Algebra I
ApproachesGrade Level
Test Date: Summer 2018
Biology
MastersGrade Level
Test Date: Summer 2018
English II
Did Not MeetGrade Level
Test Date: Spring 2020
U.S. History
Go to TexasAssessment.gov and log in to learn more.
FIRSTNAME'SUNIQUE ACCESS
CODE 28Q5KJFrom The CommissionerTests are a part of life. Our kidswill take tests to get a driver'slicense, to get into college,and even to get certain jobs.As a parent of four myself,I know that no one test cantell me everything about mychildren. But the STAAR testshave been designed to provideuseful information about howmuch our children have learnedacademically and how wellprepared they are for whatcomes next.
Students who meet or mastergrade level by high schoolgraduation have more than a60% chance of passing theircollege classes, substantiallyincreasing their lifetime earningsand prospects for success.This report is intended to giveyou information on how wellyour child learned this year'sacademic material in school andhow you can help them learneven more.
Maximize Time During Parent Teacher ConferencesSample Questions to Ask the Teacher:• .What do you see as my child’s strengths?• .What does my child seem to be the most interested in at school?• .Does my child get along well with their classmates?• .What is the most important thing that I can be doing to prepare my child
for college, a career, or the military?• .Is my child giving his/her best effort?• .What could my child be doing that he/she is not already doing?• .What do you think are the biggest challenges for my child, and how can
I help him/her with those challenges?
What the Results MeanThis report shows how well your child did on the STAAR. There are four levels of Performance.
MASTERSGRADE LEVELMastery of the course knowledge and skills is shown — student is on track for college and career readiness.
MEETSGRADE LEVELStrong knowledge of course content — student is prepared to progress to the next grade.
APPROACHESGRADE LEVELSome knowledge of course content but may be missing critical elements — studentneeds additional support in the coming year.
DID NOT MEET GRADE LEVELNo basic understanding of course expectations is shown — student may need significant support in the coming year.
Mike Morath, Commissioner of Education
N

End-
of-C
ours
e A
sses
smen
ts
2021 TEXAS STUDENT ASSESSMENT PROGRAM INTERPRETING ASSESSMENT REPORTS 3.14
Confidential Student LabelExample shown: STAAR EOC Grade 9
An adhesive Confidential Student Label is provided for each student for whom a STAAR EOC answer document or online record was submitted. Cumulative history results are shown for each EOC course, and these labels should be placed on the student’s permanent record. Districts also have the option of not receiving labels.
Available: STAAR EOC results are combined on one label per student.
A. Student Identification InformationIdentification information shown at the top of the label includes the student name, student identification number (as used for P E I M S), birth date, district number and name, campus number and name, and grade.
B. Test DateThe date when the student passed or the student’s most recent performance status is given for each course.
C. Scale ScoreThe scale score corresponding to the student’s raw score is shown. Refer to Assessment Scores in the Program Overview for additional information about the STAAR EOC scale scores. The raw score conversion tables for all STAAR administrations can be found on TEA’s Performance Reporting Department webpage.
D. Test ResultsIn place of a scale score, a variety of report comments might appear for each course, indicating the student’s performance status or scoring information.
Possible messages are listed below. Changes in policy might result in different messages.
•
ABSENT The student was absent during the assessment.
• NOT SCORED The student’s answer document was coded “O” for other reasons such as illness or administration irregularities.
• SUBSTITUTE ASSESSMENT If the student has valid substitute assessment indicated and has not passed the STAAR EOC subject.
E. Performance LevelThe label indicates for each course whether the student achieved the Did Not Meet Grade Level, Approaches Grade Level, Meets Grade Level, or Masters Grade Level performance. Refer to Performance Standards in the Program Overview for additional information about these standards.

End-
of-C
ours
e A
sses
smen
ts
2021 TEXAS STUDENT ASSESSMENT PROGRAM INTERPRETING ASSESSMENT REPORTS 3.15
F. InfoInformation about the assessment is provided whenever the student is assessed with something other than the general STAAR assessment. The information is indicated by one or two characters, and the description of the characters used will also be listed on the label.
Possible messages are listed below. Changes in policy might result in different messages.
e Online with Embedded Supports An online assessment with embedded supports was indicated for this subject.
o Online with No Embedded Supports An online assessment with no embedded supports was indicated for this subject.
pe Paper with Embedded Supports A paper assessment with embedded supports was indicated for this subject.

End-
of-C
ours
e A
sses
smen
ts
2021 TEXAS STUDENT ASSESSMENT PROGRAM INTERPRETING ASSESSMENT REPORTS 3.16
Info Test Date Scale Score Performance Level
Algebra I Fall20 3550 ApproachesBiology pe Spr21 3769 ApproachesEnglish I Fall20 4209 MeetsEnglish II Spr21 3585 Did Not MeetU.S. History Fall20 4760 Masters
p,p,p,p,EOC CONFIDENTIALSTUDENT: LASTNAME FIRSTNAME ISTUDENT ID (PEIMS): 999999999DISTRICT: 999-999 DISTRICT NAME DOB: 09/09/99CAMPUS: 999 CAMPUS NAME GRADE: 9
p pe = Paper with Embedded Supports
A
BF D E
C

End-
of-C
ours
e A
sses
smen
ts
2021 TEXAS STUDENT ASSESSMENT PROGRAM INTERPRETING ASSESSMENT REPORTS 3.17
Confidential Campus RosterExample shown: STAAR English II
The Confidential Campus Roster is available for each course assessed at each campus and lists every student for whom a STAAR EOC answer document or online record was submitted. This report provides detailed student-level results for each course assessment.
The Confidential Campus Roster (Students Not Achieving Approaches Grade Level) is available for each course assessed at each campus and lists every student for whom a STAAR EOC answer document or online record was submitted, but did not pass the course assessment.
The Confidential Campus Roster (All Out-of-School Examinees) is available for each course assessed at each campus for which there were out-of-school examinees and lists each out-of-school examinee for whom a STAAR EOC answer document or online record was submitted.
Students NOT included in the reporting-category summary results of the reports: - STAAR with Embedded Supports paper administrations- Braille- American Sign Language video
A. Campus Identification InformationThe top of the report contains identification information for the campus. The course, report date, and date of testing are also indicated. The date of testing will be the season and year the assessment occurred. The logo in the upper left-hand corner indicates the program reported.
B. Student InformationStudents are identified by name and student identification number (as used for P E I M S).
C. GradeThe student’s enrolled grade at the time of the assessment is indicated.
D. Scale ScoreThe scale score corresponding to the student’s raw score is shown. Refer to Assessment Scores in the Program Overview for additional information about the scale scores. The raw score conversion tables for all STAAR EOC administrations can be found on TEA’s Assessment Scoring and Reporting webpage.

End-
of-C
ours
e A
sses
smen
ts
2021 TEXAS STUDENT ASSESSMENT PROGRAM INTERPRETING ASSESSMENT REPORTS 3.18
E. Performance Levels
� Approaches•
If the student met Approaches, “YES” is shown.• If the student did not meet Approaches, “NO” is shown.• If a score code other than “S” is present, “---” is shown.
� Meets•
If the student achieves Meets, “YES” is shown.• If the student did not achieve Meets, “NO” is shown.• If a score code other than “S” is present, “---” is shown.
� Masters•
If the student achieves Masters, “YES” is shown.• If the student did not achieve Masters, “NO” is shown.• If a score code other than “S” is present, “---” is shown.
F. STAAR Progress MeasureThe STAAR Progress Measure is reported for students taking the Algebra I assessment for the first time if their 2018–2019 mathematics assessment was STAAR. The STAAR Progress Measure is reported for students taking the English II assessment for the first time if they took the English I assessment for the first time in the 2018–2019 accountability year. It is based on a comparison of a student’s English I or previous mathematics assessment score with his or her English II or Algebra I score. This measure gives you information about how much the student improved in the subject. Individual student progress is then categorized as Limited, Expected, or Accelerated.
Additional information about the STAAR Progress Measures can be found in the STAAR Resources section on T E A’s website.

End-
of-C
ours
e A
sses
smen
ts
2021 TEXAS STUDENT ASSESSMENT PROGRAM INTERPRETING ASSESSMENT REPORTS 3.19
G. Results for Each Reporting Category
Algebra I, Algebra II, Biology, and U.S. HistoryReporting category titles appear in the column headings. The number of items assessed in each reporting category is indicated below the reporting category titles. The number of items correct out of the total number of items for each reporting category is shown in the column headed “Number of Items Correct.”
English I, English II, and English IIIReporting category titles appear in the column headings. The number of points possible in each reporting category is indicated below the reporting category titles. The number of points scored out of the total possible points possible for each reporting category is shown in the column headed “Number of Points Scored.”
MessagesIn place of reporting-category-level data, a variety of report messages might appear, indicating the student’s performance status or scoring information.
Possible messages are listed below. Changes in policy might result in different messages.
•
NOT SCORED The student’s answer document was coded “O” for reasons such as illness during the assessment and administration irregularities.
• NOT TESTED—ABSENT The student was absent during the assessment.
• NOT SCORED—PREVIOUSLY ACHIEVED APPROACHES GRADE LEVEL The student previously achieved the Approaches Grade Level performance.
H. InfoInformation about the assessment is provided whenever the student was administered an online assessment with embedded supports, an online assessment with no embedded supports, or a paper assessment with embedded supports. The information is indicated by characters or a symbol, and the description of the characters or symbol is shown in the legend.
I. Total Students Listed and Total Students TestedTotal Students Listed indicates the number of students included on the report. Total Students Tested indicates the total number of students that took this assessment.
J. Average Scale ScoreOn the final page of the report, this number represents the average scale score of the total number of students tested on the report.
K. Performance Results•
Number On the final page of the report, this number represents the total number of “YES” results for the entire report.
• Percent On the final page of the report, this number represents the percentage of “YES” results for all students tested on the report.

End-
of-C
ours
e A
sses
smen
ts
2021 TEXAS STUDENT ASSESSMENT PROGRAM INTERPRETING ASSESSMENT REPORTS 3.20
L. Average Reporting Category ResultsThese columns summarize reporting-category-level data for all scored assessments. For each reporting category, the average number and the percentage of items students answered correctly are calculated. The average number of items correct is the total number of items correct divided by the total number of students assessed. The average percentage of items correct is the average total number of items correct divided by the total number of items assessed.
M. Process NumberThe process number found in the bottom-right corner of the report is a unique number, per administration, that is assigned to the report by the testing contractor. Refer to this number if questions arise about the report.

End-
of-C
ours
e A
sses
smen
ts
2021 TEXAS STUDENT ASSESSMENT PROGRAM INTERPRETING ASSESSMENT REPORTS 3.21
NO
T S
CO
RE
DN
OT
TES
TED
-AB
SE
NT
NO
T TE
STE
D-A
BS
EN
T
STA
TE O
F TE
XAS
ASS
ESSM
ENTS
OF
AC
AD
EMIC
REA
DIN
ESS
Con
fiden
tial C
ampu
s R
oste
rEN
GLI
SH II
All
Stud
ents
Dat
e of
Tes
ting:
SP
RIN
G 2
021
Dis
tric
t: 99
9-99
9 D
ISTR
ICT
NA
ME
Cam
pus:
999
CA
MP
US
NA
ME
Rep
ort D
ate:
SP
RIN
G 2
021
Lege
nd---
=
No
Info
rmat
ion
Ava
ilabl
epe
= P
aper
with
Em
bedd
ed S
uppo
rts.
Dat
a ar
e no
t inc
lude
d in
the
repo
rtin
g ca
tego
ry s
umm
ary
info
rmat
ion.
o =
Onl
ine
with
no
Embe
dded
Sup
port
se
= O
nlin
e w
ith E
mbe
dded
Sup
port
s. B
raill
e or
Am
eric
an S
ign
Lang
uage
vid
eo re
sults
are
not
incl
uded
in th
e re
port
ing
cate
gory
sum
mar
y in
form
atio
n.Pr
ogre
ss M
easu
re: 0
=Lim
ited,
1=E
xpec
ted,
2=A
ccel
erat
ed
Info
Stud
ent
Stud
ent-I
D(P
EIM
S)G
r
Scale Score
Approaches
Meets
Masters
STAARProgress Measure
Res
ults
for E
ach
Rep
ortin
g C
ateg
ory
12
34
56
Und
erst
andi
ng/
Ana
lysi
s A
cros
s G
enre
s
Und
erst
andi
ng/
Ana
lysi
s of
Li
tera
ry T
exts
Und
erst
andi
ng/
Ana
lysi
s of
In
form
atio
nal
Text
sC
ompo
sitio
nR
evis
ion
Editi
ng
Num
ber o
f Poi
nts
Poss
ible
813
1316
99
Num
ber o
f Poi
nts
Scor
ed
oLA
STN
AM
EFI
RS
TNA
ME
I99
9999
999
0997
1N
ON
ON
O0
00
00
0o
LAS
TNA
ME
FIR
STN
AM
EI
9999
9999
909
971
NO
NO
NO
00
00
00
oLA
STN
AM
EFI
RS
TNA
ME
I99
9999
999
0997
1N
ON
ON
O0
00
00
0o
LAS
TNA
ME
FIR
STN
AM
EI
9999
9999
909
2641
NO
NO
NO
00
00
09
oLA
STN
AM
EFI
RS
TNA
ME
I99
9999
999
0926
41N
ON
ON
O0
00
09
0
oLA
STN
AM
EFI
RS
TNA
ME
I99
9999
999
0928
35N
ON
ON
O0
013
00
0o
LAS
TNA
ME
FIR
STN
AM
EI
9999
9999
909
2835
NO
NO
NO
013
00
00
oLA
STN
AM
EFI
RS
TNA
ME
I99
9999
999
0999
90N
ON
ON
O8
00
00
0o
LAS
TNA
ME
FIR
STN
AM
EI
9999
9999
909
---
---
---
---
---
oLA
STN
AM
EFI
RS
TNA
ME
I99
9999
999
09--
---
---
---
---
-
oLA
STN
AM
EFI
RS
TNA
ME
I99
9999
999
0929
12N
ON
ON
O0
00
09
6LA
STN
AM
EFI
RS
TNA
ME
I99
9999
999
09--
---
---
---
---
-a a a a a a a a a a a a a a a a a a a a a a a a a a a a a a a a
292
TOTA
L ST
UD
ENTS
LIS
TED
: 190
AVE
RA
GE:
3290
AVE
RA
GE
TOTA
L ST
UD
ENTS
TES
TED
: 165
NU
MB
ER:
4538
215.
06.
34.
08.
51.
81.
1PE
RC
ENT:
2723
1362
4931
5320
12
Pag
e 8
of 8
0909
2021
-999
9999
9-99
9999
999
A
H
F
CD
L
B
J
I
E
G
KM

End-
of-C
ours
e A
sses
smen
ts
2021 TEXAS STUDENT ASSESSMENT PROGRAM INTERPRETING ASSESSMENT REPORTS 3.22
Summary ReportExamples shown: STAAR Algebra I (Retested Students), STAAR English I (All Students)
The Summary Report is available for each course assessed at each campus and district and contains aggregate information about every student for whom a STAAR EOC answer document or online record was submitted.
Standard Summary Reports: - All Students - First-Time Tested Students - Retested Students
Students NOT included in the reporting-category level and written composition results of the reports: - STAAR with Embedded Supports paper administrations- Braille- American Sign Language video
A. Campus or District Identification InformationThe top of the report contains identification information for the campus or district. The course, report date, and date of testing are also indicated. The date of testing will be the season and year of administration. The logo in the upper left corner of the summary report indicates the program reported.
B. Administration SummaryThis section of the report lists the number and percentage of students who were assessed, the number and percentage of students who were not assessed (broken down by students who were absent and other), and total number of documents submitted.
C. LegendTo maintain student confidentiality, no data are reported if fewer than five students were assessed. The legend indicates this by showing “---.”
D. Demographic Groups and Program InformationDemographic and program categories are listed on the left side of this section. Results for students for whom no demographic or program information was available are included in the “No Information Provided” categories.
E. Number of Students TestedThe number of students assessed is provided for each demographic group.
F. Average Scale ScoreThe average scale score is displayed for each demographic group. Refer to Assessment Scores in the Program Overview for additional information about the STAAR EOC scale scores.

End-
of-C
ours
e A
sses
smen
ts
2021 TEXAS STUDENT ASSESSMENT PROGRAM INTERPRETING ASSESSMENT REPORTS 3.23
G. Did Not Meet, Approaches, Meets, and Masters Grade LevelThe number and percentage of students who achieved the Did Not Meet, Approaches, Meets, and Masters Grade Level performance are displayed for each program and demographic group.
Masters Grade Level indicates that students demonstrate mastery of the course knowledge and skills. They are on-track for college and career readiness. Meets Grade Level indicates that students demonstrate strong knowledge of course content. They are prepared to progress to the next grade. Approaches Grade Level indicates that students demonstrate some knowledge of course content, but may be missing critical elements. They need additional support in the coming year. Did Not Meet Grade Level indicates that the students demonstrate no basic understanding of course expectations. They may need significant support in the coming year. Refer to Performance Standards in the Program Overview for additional information about these standards.
H. Results for Each Reporting Category These columns summarize reporting-category-level data for all scored assessments. For each reporting category, the average number (#) and the percentage (%) of items students answered correctly are calculated. The average number of items correct is the total number of items correct divided by the total number of students assessed. The average percentage of items correct is the average total number of items correct divided by the total number of items assessed.
I. Written Composition SummaryThe English assessments include an essay with scores ranging from 0 to 8. The number of possible points for the essay item is 16. The average number of points in the first column should be interpreted as the average number of points scored for all scored assessments for each demographic group. The percentage scored in the second column should be interpreted as the average points scored converted to a percentage for each demographic group. Detailed rubric and score point information can be found in the scoring guides on T E A’s Student Assessment Division webpage.
J. Process Number The process number found in the bottom-right corner of the report is a unique number, per administration, that is assigned to the report by the testing contractor. Refer to this number if questions arise about the report.

End-
of-C
ours
e A
sses
smen
ts
2021 TEXAS STUDENT ASSESSMENT PROGRAM INTERPRETING ASSESSMENT REPORTS 3.24
Ret
este
d St
uden
ts
STA
TE O
F TE
XAS
ASS
ESSM
ENTS
OF
AC
AD
EMIC
REA
DIN
ESS
Sum
mar
y R
epor
tA
LGEB
RA
ID
ate
of T
estin
g:
Dis
tric
t: S
PR
ING
202
1C
ampu
s: 99
9-99
9 D
ISTR
ICT
NA
ME
Rep
ort D
ate:
99
9 C
AM
PU
S N
AM
ES
PR
ING
202
1
Lege
nd---
= N
o D
ata
Rep
orte
d Fo
r Few
er T
han
Five
Stu
dent
s
Adm
inis
trat
ion
Sum
mar
y
Num
ber
Perc
ent
Stud
ents
Tes
ted
Stud
ents
Not
Tes
ted
Oth
erTo
tal D
ocum
ents
Sub
mitt
ed
Abs
ent
8389 0
011
10 9310
0
Number ofStudents Tested
AverageScale Score
Did Not Meet
Approaches
Meets
Masters
#%
#%
#%
#%
Res
ults
for E
ach
Rep
ortin
g C
ateg
ory*
12
34
5
Number and Algebraic Methods
Describing and Graphing Linear Functions, Equations, and Inequalities
Writing and Solving Linear Functions, Equations,and Inequalities
Quadratic Functions and Equations
Exponential Functions and Equations
Num
ber o
f Ite
ms
Test
ed11
1214
116
Avg
. # o
f Ite
ms
/ % C
orre
ct#
%#
%#
%#
%#
%A
ll St
uden
ts83
2742
8310
00
00
00
01.
816
1.8
152.
518
1.2
111.
017
Mal
e43
2751
4310
00
00
00
02.
018
1.8
152.
317
1.0
91.
119
Fem
ale
4027
3240
100
00
00
00
1.5
141.
715
2.8
201.
413
0.8
14N
o In
form
atio
n Pr
ovid
ed0
---
---
---
---
---
---
---
---
---
---
---
---
---
---
---
---
---
---
---
His
pani
c/La
tino
2427
3124
100
00
00
00
1.4
131.
210
2.8
201.
715
0.9
15A
mer
ican
Indi
an o
r Ala
ska
Nat
ive
631
026
100
00
00
00
6.3
582.
722
0.7
50.
76
0.7
11A
sian
930
349
100
00
00
00
2.2
202.
319
2.4
171.
312
2.0
33B
lack
or A
fric
an A
mer
ican
1028
3010
100
00
00
00
1.6
152.
723
1.9
141.
312
1.8
30N
ativ
e H
awai
ian
or O
ther
Pac
ific
Isla
nder
631
736
100
00
00
00
3.8
351.
815
4.5
321.
715
1.5
25W
hite
827
868
100
00
00
00
0.1
12.
319
2.5
181.
413
0.5
8Tw
o or
Mor
e R
aces
1422
0514
100
00
00
00
0.8
70.
86
2.0
140.
55
0.5
9N
o In
form
atio
n Pr
ovid
ed6
2604
610
00
00
00
00.
55
2.3
193.
827
0.3
30.
23
Econ
omic
ally
5127
7051
100
00
00
00
1.9
171.
613
2.4
171.
312
1.3
21D
isad
vant
aged
828
658
100
00
00
00
1.0
93.
126
2.6
190.
87
0.5
824
2641
2410
00
00
00
01.
715
1.7
143.
021
1.1
100.
69
Title
I, P
art A
3227
4932
100
00
00
00
2.5
231.
714
1.9
140.
98
0.8
1422
2867
2210
00
00
00
01.
514
1.8
153.
122
1.5
141.
220
2926
3929
100
00
00
00
1.1
101.
916
2.9
201.
312
1.0
17M
igra
nt18
2966
1810
00
00
00
03.
733
1.9
162.
518
0.9
90.
813
2927
7829
100
00
00
00
1.6
141.
513
2.9
201.
614
0.8
1436
2601
3610
00
00
00
01.
09
1.9
162.
317
1.0
91.
321
Lim
ited
Engl
ish
2228
9022
100
00
00
00
3.3
302.
420
2.3
160.
98
0.8
13Pr
ofic
ient
630
576
100
00
00
00
3.0
271.
08
4.5
321.
09
0.8
143
---
---
---
---
---
---
---
---
---
---
---
---
---
---
---
---
---
---
---
2--
---
---
---
---
---
---
---
---
---
---
---
---
---
---
---
---
---
---
-2
---
---
---
---
---
---
---
---
---
---
---
---
---
---
---
---
---
---
---
2--
---
---
---
---
---
---
---
---
---
---
---
---
---
---
---
---
---
---
-24
2747
2410
00
00
00
01.
211
1.6
142.
619
1.7
150.
712
2426
3824
100
00
00
00
1.2
112.
117
2.9
211.
413
1.0
16B
iling
ual
2329
2223
100
00
00
00
3.2
292.
319
2.9
201.
09
0.8
1425
2801
2510
00
00
00
01.
614
1.5
132.
921
1.6
150.
813
3525
8135
100
00
00
00
1.0
91.
613
2.1
151.
110
1.3
21ES
L27
2566
2710
00
00
00
00.
98
1.3
102.
115
1.4
121.
016
1929
1619
100
00
00
00
3.1
281.
714
2.8
200.
87
0.6
1037
2781
3710
00
00
00
01.
716
2.2
182.
719
1.3
121.
321
Spec
ial E
duca
tion
2229
0922
100
00
00
00
3.2
292.
319
2.8
200.
98
0.7
1223
2773
2310
00
00
00
01.
715
1.7
142.
719
1.3
120.
814
3826
2638
100
00
00
00
1.0
91.
513
2.3
171.
312
1.3
21G
ifted
/Tal
ente
d19
2977
1910
00
00
00
03.
532
2.5
212.
417
0.9
80.
712
2327
7323
100
00
00
00
1.7
151.
714
2.7
191.
312
0.8
1441
2615
4110
00
00
00
01.
09
1.5
132.
618
1.3
121.
220
At-R
isk
1829
6618
100
00
00
00
3.7
331.
916
2.5
180.
99
0.8
1323
2773
2310
00
00
00
01.
715
1.7
142.
719
1.3
120.
814
4226
2842
100
00
00
00
1.0
91.
815
2.5
181.
312
1.2
20
Yes No
No
Info
rmat
ion
Pro
vide
dP
artic
ipan
tsN
onpa
rtici
pant
sN
o In
form
atio
n P
rovi
ded
Yes No
No
Info
rmat
ion
Pro
vide
dC
urre
nt L
EP
Non
-LE
P (M
onito
red
1st Y
ear)
Non
-LE
P (M
onito
red
2nd
Yea
r)N
on-L
EP
(Mon
itore
d 3r
d Y
ear)
Non
-LE
P (M
onito
red
4th
Yea
r)N
on-L
EP
(Pos
t Mon
itorin
g)O
ther
Non
-LE
PN
o In
form
atio
n P
rovi
ded
Par
ticip
ants
Non
parti
cipa
nts
No
Info
rmat
ion
Pro
vide
dP
artic
ipan
tsN
onpa
rtici
pant
sN
o In
form
atio
n P
rovi
ded
Yes No
No
Info
rmat
ion
Pro
vide
dP
artic
ipan
tsN
onpa
rtici
pant
sN
o In
form
atio
n P
rovi
ded
Yes No
No
Info
rmat
ion
Pro
vide
d
* R
esul
ts fo
r stu
dent
s w
ho to
ok th
e te
st w
ith th
e B
raill
e, A
mer
ican
Sig
n La
ngua
ge v
ideo
s ac
com
mod
atio
n, o
r the
pap
er S
TAA
R w
ith e
mbe
dded
sup
ports
are
not
in
clud
ed in
the
repo
rting
cat
egor
y re
sults
.09
0921
-999
9999
9-99
9999
999
A
C D
B
HJ
FE
G

End-
of-C
ours
e A
sses
smen
ts
2021 TEXAS STUDENT ASSESSMENT PROGRAM INTERPRETING ASSESSMENT REPORTS 3.25
All
Stud
ents
STA
TE O
F TE
XAS
ASS
ESSM
ENTS
OF
AC
AD
EMIC
REA
DIN
ESS
Sum
mar
y R
epor
tEN
GLI
SH I
Dat
e of
Tes
ting:
D
istr
ict:
SP
RIN
G 2
021
Cam
pus:
999-
999
DIS
TRIC
T N
AM
ER
epor
t Dat
e:
999
CA
MP
US
NA
ME
SP
RIN
G 2
021
Lege
nd---
= N
o D
ata
Rep
orte
d Fo
r Few
er T
han
Five
Stu
dent
s
Adm
inis
trat
ion
Sum
mar
y
Num
ber
Perc
ent
Stud
ents
Tes
ted
Stud
ents
Not
Tes
ted
Oth
erTo
tal D
ocum
ents
Sub
mitt
ed
Abs
ent
181
89 13
1020 204
100
Number ofStudents Tested
AverageScale Score
Did Not Meet
Approaches
Meets
Masters
#%
#%
#%
#%
Res
ults
for E
ach
Rep
ortin
g C
ateg
ory*
12
34
56
Understanding/Analysis Across Genres
Understanding/Analysis ofLiterary Texts
Understanding/Analysis ofInformationalTexts
Composition
Revision
Editing
Num
ber o
f Poi
nts
Poss
ible
813
1316
99
Num
ber o
f Poi
nts
Scor
ed#
%#
%#
%#
%#
%#
%A
ll St
uden
ts18
134
1012
267
5933
4726
2112
5.1
646.
550
4.4
348.
855
1.9
220.
911
Mal
e90
3593
5966
3134
2629
1517
4.7
596.
349
4.1
329.
962
2.2
241.
315
Fem
ale
9132
2963
6928
3121
236
75.
569
6.6
514.
736
7.7
481.
719
0.6
6N
o In
form
atio
n Pr
ovid
ed0
---
---
---
---
---
---
---
---
---
---
---
---
---
---
---
---
---
---
---
---
---
His
pani
c/La
tino
5334
1631
5822
4220
388
154.
962
6.6
515.
341
9.1
573.
033
1.2
13A
mer
ican
Indi
an o
r Ala
ska
Nat
ive
1434
6511
793
212
141
76.
278
7.6
584.
031
8.0
500.
910
0.6
7A
sian
1234
778
674
332
171
87.
999
8.6
664.
535
7.4
460.
910
0.9
10B
lack
or A
fric
an A
mer
ican
1632
6612
754
253
190
05.
063
6.9
533.
225
8.5
531.
820
0.0
0N
ativ
e H
awai
ian
or O
ther
Pac
ific
Isla
nder
1533
0411
734
272
131
73.
847
5.1
392.
520
7.7
480.
89
0.8
9W
hite
933
356
673
331
111
115.
669
6.8
525.
341
6.7
421.
011
0.9
10Tw
o or
Mor
e R
aces
2934
3919
6610
349
315
175.
063
5.9
454.
736
9.3
582.
225
1.3
15N
o In
form
atio
n Pr
ovid
ed33
3467
2473
927
824
412
4.6
585.
946
3.9
309.
761
1.6
170.
910
Econ
omic
ally
104
3505
6663
3837
3130
1212
5.5
697.
154
4.8
379.
157
2.3
261.
011
Dis
adva
ntag
ed17
3298
1165
635
424
16
5.3
666.
852
5.2
407.
849
1.5
160.
67
6032
7945
7515
2512
208
134.
455
5.4
413.
527
8.6
541.
416
0.9
11Ti
tle I,
Par
t A80
3434
4961
3139
2430
79
5.3
676.
852
5.2
409.
157
2.2
250.
910
3536
4922
6313
3712
346
176.
277
6.6
514.
535
9.1
572.
124
1.2
1366
3255
5177
1523
1117
812
4.3
546.
046
3.3
268.
352
1.5
170.
910
Mig
rant
3534
7422
6313
3710
294
114.
759
5.9
454.
333
9.8
612.
527
1.2
1451
3391
3467
1733
1325
48
6.1
777.
054
5.2
407.
849
1.9
210.
78
9533
9766
6929
3124
2513
144.
759
6.4
494.
131
9.0
561.
820
1.0
11Li
mite
d En
glis
h25
3584
1560
1040
728
416
5.1
647.
658
4.8
3710
.163
2.1
241.
517
Prof
icie
nt9
3338
889
111
111
111
4.9
616.
046
3.9
306.
943
1.0
110.
910
737
674
573
433
432
295.
771
4.3
334.
333
8.3
523.
033
3.0
338
3370
563
338
338
113
5.1
645.
643
3.9
308.
654
1.9
210.
00
2435
5516
678
338
334
174.
961
5.0
384.
030
9.5
592.
730
1.2
1324
3555
1667
833
833
417
4.9
615.
038
4.0
309.
559
2.7
301.
213
4534
4728
6217
3813
294
96.
176
7.5
585.
441
8.5
532.
123
0.8
963
3236
4673
1727
1219
58
4.5
566.
348
3.9
308.
653
1.5
170.
67
Bili
ngua
l36
3533
2364
1336
1028
411
5.1
646.
751
4.4
3410
.163
2.4
271.
213
5334
2234
6419
3615
287
135.
974
7.0
545.
341
7.7
482.
123
0.9
1092
3355
6571
2729
2224
1011
4.7
586.
147
3.9
308.
956
1.7
190.
910
ESL
4834
7229
6019
4015
316
136.
176
7.2
555.
442
8.3
522.
325
1.1
1233
3472
2267
1133
824
618
4.3
545.
643
3.5
279.
761
1.8
201.
416
100
3360
7171
2929
2424
99
4.9
626.
550
4.3
338.
755
1.8
210.
78
Spec
ial E
duca
tion
4135
3824
5917
4113
326
155.
063
6.6
514.
736
9.5
592.
629
1.3
1547
3408
3166
1634
1226
49
6.2
777.
256
5.3
417.
949
1.9
210.
89
9333
5567
7226
2822
2411
124.
658
6.0
463.
830
9.0
561.
719
0.9
10G
ifted
/Tal
ente
d34
3513
2162
1338
1029
412
5.0
626.
450
4.4
349.
761
2.5
281.
314
4734
0831
6616
3412
264
96.
277
7.2
565.
341
7.9
491.
921
0.8
910
033
7670
7030
3025
2513
134.
758
6.1
474.
031
8.9
561.
820
0.9
10A
t-Ris
k33
3522
2061
1339
1030
412
4.9
616.
449
4.5
359.
861
2.6
291.
314
4834
0032
6716
3312
254
86.
075
7.1
555.
240
8.0
501.
921
0.8
910
033
7870
7030
3025
2513
134.
859
6.2
484.
031
8.8
551.
820
0.9
10
Yes No
No
Info
rmat
ion
Pro
vide
dP
artic
ipan
tsN
onpa
rtici
pant
sN
o In
form
atio
n P
rovi
ded
Yes No
No
Info
rmat
ion
Pro
vide
dC
urre
nt L
EP
Non
-LE
P (M
onito
red
1st Y
ear)
Non
-LE
P (M
onito
red
2nd
Yea
r)N
on-L
EP
(Mon
itore
d 3r
d Y
ear)
Non
-LE
P (M
onito
red
4th
Yea
r)N
on-L
EP
(Pos
t Mon
itorin
g)O
ther
Non
-LE
PN
o In
form
atio
n P
rovi
ded
Par
ticip
ants
Non
parti
cipa
nts
No
Info
rmat
ion
Pro
vide
dP
artic
ipan
tsN
onpa
rtici
pant
sN
o In
form
atio
n P
rovi
ded
Yes No
No
Info
rmat
ion
Pro
vide
dP
artic
ipan
tsN
onpa
rtici
pant
sN
o In
form
atio
n P
rovi
ded
Yes No
No
Info
rmat
ion
Pro
vide
d
* R
esul
ts fo
r stu
dent
s w
ho to
ok th
e te
st w
ith th
e B
raill
e, A
mer
ican
Sig
n La
ngua
ge v
ideo
s ac
com
mod
atio
n, o
r the
pap
er S
TAA
R w
ith e
mbe
dded
sup
ports
are
not
in
clud
ed in
the
repo
rting
cat
egor
y re
sults
.09
0921
-999
9999
9-99
9999
999
C D
B
HJ
FE
G
AI

End-
of-C
ours
e A
sses
smen
ts
2021 TEXAS STUDENT ASSESSMENT PROGRAM INTERPRETING ASSESSMENT REPORTS 3.26
Constructed Responses Summary Report Examples shown: STAAR English I (All Students)
The Constructed Responses Summary Report is provided for each district and campus and shows the number and percentage of students receiving each rating for the written composition.
Available: STAAR EOC
Standard Summary Reports: - All Students - First-time Tested Students - Retested Students
Students NOT included in the reports: - STAAR with Embedded Supports paper administrations- Braille- American Sign Language video
A. Campus or District Identification InformationThe top of the report contains identification information for the campus or district. The course, report date, and the date of testing are also indicated.
B. Written Composition Rating SummaryA breakdown of the number and percentage of students who achieved each rating on the written composition is shown. Detailed rubric and score point information can be found in the Assessment Scoring and Reporting webpage.
Composition ratings are shown below.
0 = Nonscorable (summed score: 0 out of a possible 8)
2 = Very Limited (summed score: 2 out of a possible 8)
3 = Between Very Limited and Basic (summed score: 3 out of a possible 8)
4 = Basic (summed score: 4 out of a possible 8)
5 = Between Basic and Satisfactory (summed score: 5 out of a possible 8)
6 = Satisfactory (summed score: 6 out of a possible 8)
7 = Between Satisfactory and Accomplished (summed score: 7 out of a possible 8)
8 = Accomplished (summed score: 8 out of a possible 8)
End-
of-C
ours
e A
sses
smen
ts
2021 TEXAS STUDENT ASSESSMENT PROGRAM INTERPRETING ASSESSMENT REPORTS 3.27
C. Number of Papers The number of students receiving each rating is shown in the column with the heading “#.” The total number is shown at the bottom of this column.
The percentage of the total number of students receiving each composition rating (0, 2–8) is shown in the column with the heading “%.” The total percentage is shown at the bottom of this column. The percentage of the students on the “Total” row will always be 100.
D. GraphThe graph shows a visual representation of the percentage of students receiving each composition rating.
E. Process NumberThe process number found in the bottom-right corner of the report is a unique number, per administration, that is assigned to the report by the testing contractor. Refer to this number if questions arise about the report.

End-
of-C
ours
e A
sses
smen
ts
2021 TEXAS STUDENT ASSESSMENT PROGRAM INTERPRETING ASSESSMENT REPORTS 3.28
Writ
ten
Com
posi
tion
Rat
ing
Sum
mar
y*
Expo
sito
ry C
ompo
sitio
n
Each
com
posi
tion
has
been
sco
red
inde
pend
ently
by
two
read
ers.
The
writ
ten
com
posi
tion
ratin
g of
0-8
repr
esen
ts th
e su
mm
atio
n of
thes
e sc
ores
.
--- =
No
Dat
a R
epor
ted
For F
ewer
Tha
n Fi
ve S
tude
nts
Rat
ing
#%
039
22
211
6
318
10
417
10
514
8
611
6
731
18
834
19
Tota
l17
510
0
PERCENT
0909
21-9
9999
999-
9999
9999
9*
Res
ults
for s
tude
nts
who
took
the
test
with
the
Bra
ille,
Am
eric
an S
ign
Lang
uage
vid
eos
acco
mm
odat
ion,
or t
he p
aper
STA
AR
with
em
bedd
ed s
uppo
rts a
re
not i
nclu
ded
in th
is re
port.
All
Stud
ents
STA
TE O
F TE
XAS
ASS
ESSM
ENTS
OF
AC
AD
EMIC
REA
DIN
ESS
Con
stru
cted
Res
pons
es S
umm
ary
Rep
ort
ENG
LISH
ID
ate
of T
estin
g:
Dis
tric
t: S
PR
ING
202
1C
ampu
s: 99
9-99
9 D
ISTR
ICT
NA
ME
Rep
ort D
ate:
99
9 C
AM
PU
S N
AM
ES
PR
ING
202
1
A
C
E
DB

End-
of-C
ours
e A
sses
smen
ts
2021 TEXAS STUDENT ASSESSMENT PROGRAM INTERPRETING ASSESSMENT REPORTS 3.29
Confidential Images of EssaysExample shown: STAAR English I Essay
The Confidential Images of Essays includes written compositions. Districts might find it helpful to use the Confidential Images of Essays in conjunction with the corresponding released STAAR tests.
Available: STAAR
A. Assessment InformationThe program, content area, and season and year of the assessment scored is indicated.
B. Student Identification InformationThe top of the report contains identification information for the student. The student name, date-of-birth, and PEIMS identification is shown. For confidentiality, the student identification number (PEIMS) is indicated by five asterisks followed by the last four digits of the ID number.
C. Written Composition ScoreComposition ratings are shown below.
0 = Nonscorable
2 = Very Limited
3 = Between Very Limited and Basic
4 = Basic
5 = Between Basic and Satisfactory
6 = Satisfactory
7 = Between Satisfactory and Accomplished
8 = Accomplished
Essay The essay text from the answer document or online record is shown.
End-
of-C
ours
e A
sses
smen
ts
2021 TEXAS STUDENT ASSESSMENT PROGRAM INTERPRETING ASSESSMENT REPORTS 3.30
MessagesIn place of the essay, a variety of report messages might appear, indicating the student’s performance status. Possible messages are listed below. Changes in policy might result in different messages.
•
Not Tested—Absent The student was absent during the assessment
• Not Scored The student’s answer document or online record was coded “OTHER” for reasons such as illness during the assessment and administration irregularities.
• Not Scored—Previously Achieved Approaches Grade Level The student previously achieved the Approaches Grade Level performance.
Detailed rubric and score point information can be found in the scoring guides on T E A’s Student Assessment Division webpage.
D. Document Number and Process NumberThe document number found in the bottom-left corner of the report is a unique number, per administration, that is assigned to the student’s record by the testing contractor. Refer to this number if questions arise about the student’s results. The process number found in the bottom-right corner of the report is a unique number, per administration, that is assigned to the report by the testing contractor.

End-
of-C
ours
e A
sses
smen
ts
2021 TEXAS STUDENT ASSESSMENT PROGRAM INTERPRETING ASSESSMENT REPORTS 3.31
9999999999999999_P1 Page 1 of 1 090919-99999999-999999999
STATE OF TEXAS ASSESSMENTS OF ACADEMIC READINESS SPRING 2021
ENGLISH I - WRITTEN COMPOSITION
NAME: LASTNAME, FIRSTNAME I. DOB: 09/09/99
PEIMS ID: *****9999 Written Composition Score: 4 4 = Basic
A
D
CB

End-
of-C
ours
e A
sses
smen
ts
2021 TEXAS STUDENT ASSESSMENT PROGRAM INTERPRETING ASSESSMENT REPORTS 3.32
Confidential Student Item Analysis ReportExample shown: STAAR Algebra I
This report provides detailed student-level results for each course tested. Indicated on this report is the reporting category measured by each test item, the correct answer, and which answer choice the student selected for the item. The information in this report might be useful to students, parents, and teachers for identifying content area or skills students might find difficult and for exploring possible reasons why incorrect answer choices were made. Districts might find it helpful to use the Confidential Student Item Analysis Report in conjunction with the 2021 released STAAR tests.
A. Student and School Identification InformationThe top of the report contains identification information, both for the student (name,identification number, etc.) and the school (district, class group, etc.). For confidentiality, thestudent identification number (PEIMS) is indicated by five asterisks followed by the last four digitsof the ID number. The report date, date of testing, and grade are also indicated. The date oftesting will be the season and year of administration.
B. Test ResultsThis section gives the student’s scale score and indicates the performance level the studentachieved. Refer to Assessment Scores in the Program Overview for additional information aboutthe STAAR scale scores. The raw score conversion tables for all STAAR administrations can befound on TEA’s Performance Reporting Department webpage. Refer to Performance Standardsin the Program Overview for additional information about these standards.
Information about the assessment is provided whenever the student is assessed with somethingother than the general STAAR assessment. The information is indicated by characters inparenthesis next to the subject.
Possible messages are listed below. Changes in policy might result in different messages.
e Online with Embedded SupportsAn online assessment with embedded supports was indicated for this subject.
o Online with No Embedded SupportsAn online assessment with no embedded supports was indicated for this subject.
pe Paper with Embedded SupportsA paper assessment with embedded supports was indicated for this subject.
C. Item NumberThe item number corresponds to the item number of the released test for that course.
End-
of-C
ours
e A
sses
smen
ts
2021 TEXAS STUDENT ASSESSMENT PROGRAM INTERPRETING ASSESSMENT REPORTS 3.33
D. Reporting CategoryThe number of the reporting category measured by each test item is listed. An abbreviated listing of reporting categories can be found on the STAAR Report Card. The complete wording of each reporting category for every assessment is found on T E A’s Student Assessment Division webpage.
E. Correct AnswerThe correct answer choice for each test item is shown.
F. Student’s AnswerThe student’s answer choice is shown for each test item. A plus sign (+) in this column indicates that the student selected the correct answer. NR in this column indicates that the student did not answer. For items that are not multiple-choice items, the letter “A” represents the correct answer and the letter “B” represents an incorrect answer. Scores for essay questions are not included; student’s scores for these items are available on the STAAR Report Card.
G. MessagesIn place of item analysis data, a variety of report messages might appear. Possible messages are listed below. Changes in policy might result in different messages.
•
NOT SCORED The student’s answer document was coded “OTHER” for reasons such as illness during the assessment and administration.
• NOT TESTED—ABSENT The student was absent during the assessment.
• NOT SCORED—PREVIOUSLY ACHIEVED APPROACHES GRADE LEVEL The student previously achieved the Approaches Grade Level performance.
H. Document Number and Process NumberThe document number found in the bottom-left corner of the report is a unique number, per administration, that is assigned to the student’s record by the testing contractor. Refer to this number if questions arise about the student’s results. The process number in the bottom-right corner of the report is a unique number, per administration, that is assigned to the report by the testing contractor.

End-
of-C
ours
e A
sses
smen
ts
2021 TEXAS STUDENT ASSESSMENT PROGRAM INTERPRETING ASSESSMENT REPORTS 3.34
STATE OF TEXAS ASSESSMENTS OF ACADEMIC READINESS Confidential Student Item Analysis Report
ALGEBRA I
Date of Birth: District: Student ID (PEIMS): Campus:
Local Student ID:
FIRSTNAME I. LASTNAME09/09/99*****9999999999999
999-999 DISTRICT NAME999 CAMPUS NAME
Report Date:Date of Testing:
Grade:
SUMMER 2021SPRING 20219
† = Item is not a multiple-choice item. For this item, the letter "A" represents the correct answer and "B" represents an incorrect answer.+ = student answered correctly NR = student did not answer Additional information about this student’s performance and a listing of the reporting categories are found on the Confidential STAAR Report Card.
Document # 1000-41743 090919-99999999-999999999
ALGEBRA IScale Score: 3702
Performance Level: Approaches
ItemReporting Category
Correct Answer
Student's Answer
1 . 3 C +2. 1 G +3. 2 D +4. 5 G +5. 4 C +6. 1 F +7. 4 C +8. 3 G +9. 1 C +
10. 3 J +11. 1 A +12 . 2 G +13. 3 D +14.† 4 A +15 . 3 A +16 . 2 H +17. 5 B +18 . 4 H +19. 2 A +20 .† 1 A +21 . 2 C +22. 4 J +23 . 5 A +24 . 3 G NR25. 2 D NR26. 4 F NR27.† 2 A NR28. 1 H NR29. 4 B NR30. 3 H NR31. 1 B NR32. 3 J NR33. 5 A +34 .† 3 A NR35. 2 B NR36. 1 F NR37. 3 C NR38. 4 G NR39. 3 D NR40. 5 F +41 . 4 C NR42.† 2 A NR43. 3 A NR44. 1 J NR45. 2 B NR46. 5 H NR47. 3 B NR48. 4 F NR49. 1 B NR50. 4 J NR51. 2 A NR52. 3 H NR53. 1 D NR54. 2 G NR
F
G
A
B
D EC
H

End-
of-C
ours
e A
sses
smen
ts
2021 TEXAS STUDENT ASSESSMENT PROGRAM INTERPRETING ASSESSMENT REPORTS 3.35
Item Analysis Summary ReportExample shown: STAAR Algebra I, Biology and U.S. History
This report shows the item number, the reporting category measured by the item, and the percentage of students selecting each possible answer choice for that test item. This summary report is provided for all students. Districts might find it helpful to use the Item Analysis Summary Report in conjunction with the corresponding released STAAR tests.
Available: STAAR
A. Campus Identification InformationThe top of the report contains identification information for the campus. The course assessed, report date, and assessment date are also indicated.
B. Number of Students TestedThe number of students assessed is provided.
C. Item NumberThe item number corresponds to the item number on the test for that course.
D. Reporting CategoryThe number of the reporting category measured by each test item is listed. An abbreviated listing of reporting categories can be found on the Summary Report. The complete wording of each reporting category for every assessment is found on T E A’s Student Assessment Division webpage.
E. Percent RespondingThe percentage of students responding to each answer choice is shown for each test item. The correct answer is indicated by an asterisk. To maintain student confidentiality, no data are reported if fewer than five students were assessed.
F. Percent Not RespondingThe percentage of students who did not respond to this item is shown in the column with the double-asterisk heading. To maintain student confidentiality, no data are reported if fewer than five students were assessed.
G. Process NumberThe print number in the bottom-right corner of the report is a unique number, per administration, that is assigned to the report by the testing contractor. Refer to this number if questions arise about the report.

End-
of-C
ours
e A
sses
smen
ts
2021 TEXAS STUDENT ASSESSMENT PROGRAM INTERPRETING ASSESSMENT REPORTS 3.36
† = Item is not a multiple-choice item. For this item, the letter "A" represents the correct answer and "B" represents an incorrect answer.* = Correct answer choice ** = Percent of students who did not answerA listing of the reporting categories is found on the Summary Report.*** = Results for students who took the test with the Braille, American Sign Language videos accommodation, or the paper STAAR with embedded supports are not included in the percent responding results.
090921-99999999-999999999
ALGEBRA I***Number of Students Tested: 163
PERCENT RESPONDINGITEM RC A/F B/G C/H D/J **
1 . 3 1 1 75* 1 212 . 1 1 74* 3 0 233 . 2 1 1 1 72* 244 . 5 1 67* 3 0 295 . 4 1 1 67* 1 296 . 1 67* 3 1 0 297 . 4 1 1 62* 1 358 . 3 1 70* 3 0 269 . 1 1 1 61* 1 35
10 . 3 1 1 1 65* 3111. 1 58* 3 1 0 3812 . 2 1 67* 3 0 3013 . 3 1 1 1 60* 3614 .† 4 58* 4 0 0 3815 . 3 53* 3 1 0 4316 . 2 1 1 61* 1 3517 . 5 1 62* 3 0 3518 . 4 1 1 52* 1 4419 . 2 57* 3 1 0 4020 .† 1 52* 4 0 0 4521 . 2 1 1 50* 1 4622 . 4 1 1 1 45* 5123 . 5 59* 3 1 0 3724 . 3 1 47* 3 0 5025 . 2 1 1 1 43* 5326 . 4 39* 3 1 0 5727 .† 2 37* 4 0 0 5928 . 1 1 1 43* 1 5329 . 4 1 32* 3 0 6430 . 3 1 1 40* 1 5731 . 1 1 38* 3 0 5832 . 3 1 1 1 33* 6333 . 5 52* 3 1 0 4434 .† 3 28* 4 0 0 6935 . 2 1 32* 3 0 6436 . 1 32* 3 1 0 6437 . 3 1 1 23* 1 7438 . 4 1 27* 3 0 6939 . 3 1 1 1 19* 7740 . 5 44* 3 1 0 5241 . 4 1 1 22* 1 7442 .† 2 27* 4 0 0 6943 . 3 14* 3 1 0 8244 . 1 1 1 1 26* 7045 . 2 1 22* 3 0 7446 . 5 1 1 38* 1 5847 . 3 1 12* 3 0 8448 . 4 17* 3 1 0 7949 . 1 1 21* 3 0 7550 . 4 1 1 1 12* 8451 . 2 16* 3 1 0 8152 . 3 1 1 9* 1 8753 . 1 1 1 1 16* 8054 . 2 1 12* 3 0 84
BIOLOGY***Number of Students Tested: 159
PERCENT RESPONDINGITEM RC A/F B/G C/H D/J **
1 . 2 1 63* 3 0 332 . 1 1 1 1 63* 333 . 4 1 63* 3 0 334 . 5 54* 3 1 0 425 . 4 1 1 60* 1 366 . 3 1 62* 3 0 347 . 1 60* 3 1 0 368 . 2 1 1 1 60* 369 . 5 52* 3 1 0 44
10 . 1 1 1 1 57* 3911. 3 1 60* 3 0 3612 . 2 1 1 56* 1 4013 . 5 1 1 1 48* 4814 . 2 52* 3 1 0 4415 . 4 1 1 1 59* 3716 . 2 50* 3 1 0 4617 . 5 1 1 1 44* 5218 . 3 1 1 57* 1 3919 . 1 1 1 1 54* 4220 . 5 1 39* 3 0 5721 . 3 52* 3 1 0 4422 . 4 1 1 54* 1 4223 . 3 1 1 1 49* 4724 . 2 46* 3 1 0 5025 . 5 1 1 1 34* 6226 . 1 1 51* 3 0 4527 . 5 1 1 27* 1 6928 . 3 42* 3 1 0 5429 . 2 1 1 43* 1 5330 . 4 1 52* 3 0 4431 . 3 1 1 38* 1 5832 . 2 1 1 1 39* 5733 . 4 1 1 48* 1 4834 . 1 1 45* 3 0 5135 . 3 1 1 2 33* 6236 . 2 1 1 38* 1 5837 . 1 1 1 42* 1 5438 . 2 1 32* 3 0 6439 . 4 1 1 46* 1 5040 . 1 1 40* 3 0 5641 . 5 1 1 1 23* 7342 . 3 29* 3 1 0 6743 . 1 1 1 1 38* 5844 . 5 1 18* 3 0 7845 . 4 1 1 1 42* 5446 . 1 1 1 33* 1 6347 . 4 1 38* 3 0 5848 . 1 1 1 28* 1 6849 . 5 1 14* 3 0 8250 . 4 1 1 34* 1 6251 . 3 1 25* 3 0 7252 . 2 1 1 1 28* 6853 . 5 10* 3 1 0 8654 . 4 1 1 30* 1 66
U.S. HISTORY***Number of Students Tested: 195
PERCENT RESPONDINGITEM RC A/F B/G C/H D/J **
1 . 4 1 65* 2 0 322 . 2 60* 2 1 0 373 . 1 1 1 76* 1 214 . 4 1 1 1 63* 335 . 2 1 1 1 59* 386 . 2 1 57* 2 0 407 . 1 1 1 1 74* 238 . 4 1 1 61* 1 359 . 1 1 1 1 72* 24
10 . 4 1 1 59* 1 3811. 4 56* 2 1 0 4112 . 1 1 1 1 71* 2613 . 3 49* 2 1 0 4814 . 2 1 1 1 54* 4215 . 4 52* 2 1 0 4516 . 4 1 1 1 49* 4817 . 4 1 1 1 48* 4918 . 1 68* 2 1 0 2919 . 2 1 1 1 53* 4420 . 4 1 1 45* 1 5221 . 1 1 1 65* 1 3222 . 1 1 62* 2 0 3523 . 2 51* 2 1 0 4624 . 1 59* 2 1 0 3825 . 3 1 48* 2 0 4926 . 2 1 1 48* 1 4927 . 1 1 1 1 55* 4228 . 1 1 1 51* 1 4629 . 1 49* 2 1 0 4830 . 2 1 1 46* 1 5131 . 1 1 47* 2 0 5032 . 1 44* 2 1 0 5233 . 4 1 1 43* 1 5434 . 3 1 1 47* 1 5035 . 3 1 1 1 46* 5136 . 3 1 1 44* 1 5337 . 2 1 44* 2 0 5338 . 1 1 41* 2 0 5639 . 1 1 1 40* 1 5740 . 1 1 1 38* 1 5941 . 1 37* 2 1 0 6042 . 4 1 1 1 41* 5643 . 4 39* 2 1 0 5844 . 1 1 1 35* 1 6145 . 4 1 33* 2 0 6446 . 2 1 42* 2 0 5547 . 3 1 1 41* 1 5648 . 1 1 1 1 34* 6249 . 1 1 33* 2 0 6350 . 2 1 1 39* 1 5851 . 3 1 1 1 38* 5952 . 1 32* 2 1 0 6553 . 1 1 1 22* 1 7554 . 1 1 1 1 20* 7755 . 3 1 1 35* 1 6156 . 1 19* 2 1 0 7857 . 3 1 32* 2 0 6558 . 1 1 16* 2 0 8059 . 1 1 1 1 14* 8360 . 4 1 1 1 27* 7061 . 4 24* 2 1 0 7362 . 1 1 1 1 12* 8563 . 2 1 1 37* 1 6064 . 4 1 1 22* 1 7565 . 1 1 10* 2 0 8766 . 1 1 1 8* 1 8967 . 1 6* 2 1 0 9168 . 3 1 1 30* 1 67
STATE OF TEXAS ASSESSMENTS OF ACADEMIC READINESS Item Analysis Summary Report
Date of Testing: SPRING 2021Report Date: SUMMER 2021District: 999-999 DISTRICT NAME
999 CAMPUS NAMECampus: A
B
G
FD
EC

End-
of-C
ours
e A
sses
smen
ts
2021 TEXAS STUDENT ASSESSMENT PROGRAM INTERPRETING ASSESSMENT REPORTS 3.37
Electronic Individual Student Record File (Confidential)
The Electronic Individual Student Record File contains individual data records for each student for whom an answer document or online record was submitted. The student record includes identification and demographic data as well as assessment scores. Reporting-category-level data are also included.

End-
of-C
ours
e A
sses
smen
ts
2021 TEXAS STUDENT ASSESSMENT PROGRAM INTERPRETING ASSESSMENT REPORTS 3.38
Additional ReportsAssessment reports may be requested for rerun. There is a fee for rerun requests that result from a district error, such as a misgridded answer document. There will be NO charge for rerun requests resulting from a contractor error, such as nonreceipt of reports. The following reports are available for rerun:
•
STAAR Report Card
• Confidential Student Label
• Confidential Campus Roster—All Students
• Confidential Campus Roster—Students Not Achieving Approaches Grade Level
Additional printed copies of student reports are available for download and printing from the Assessment Management System after scoring is complete. Districts can request additional printed copies be sent to them for a fee:
•
STAAR Report Card (Spring Administration Only)
• Confidential Student Label
About using Alternate Assessments for TAKS, TAAS, and TEAMSBeginning with the 2017–2018 school year, former TAKS, TAAS, and TEAMS examinees can take the appropriate part of the alternate assessment he or she needs as one way to fulfill testing graduation requirements. More information on the Texas Administrative Code can be found on TEA’s Student Assessment webpage.
TAKS/TAAS/TEAMS Report CardThe report shows how well you did on the STAAR assessment. Passed means your score met the passing standard on the assessment. Did Not Pass means your score did not meet the passing standard on the assessment. Your most recent TAKS/TAAS/TEAMS report card can be found by logging into the Texas Assessment Student Portal.