spreading of polar and atlantic water masses into the ... · spreading of polar and atlantic water...
TRANSCRIPT

Spreading of Polar and Atlantic Water Masses
into the inner Nordic Seas Analyses of hydrographic measurements from Argo floats and Seagilders
Katrin Latarius, Ursula Schauer and Torsten Kanzow
Argo User Workshop 2015, March 16-17, Brest, France

Outline of the following..
I. Large scale: Interannual to longer-term variability of salinity/freshwater in the Greenland Sea Basin Data: measurements with Argo floats
II. Mesoscale: Intrusion of freshwater from the ice edge/East Greenland Current to the inner Greenland Sea Basin Data: high resolution Seaglider sections

The Nordic Seas – where Polar and Atlantic water masses meet
E.P. Oberlander, WHOI

The Nordic Seas – Schematic of the system
Latarius & Quadfasel, submitted to DSR 2015

The Nordic Seas – Focus on the Greenland Sea

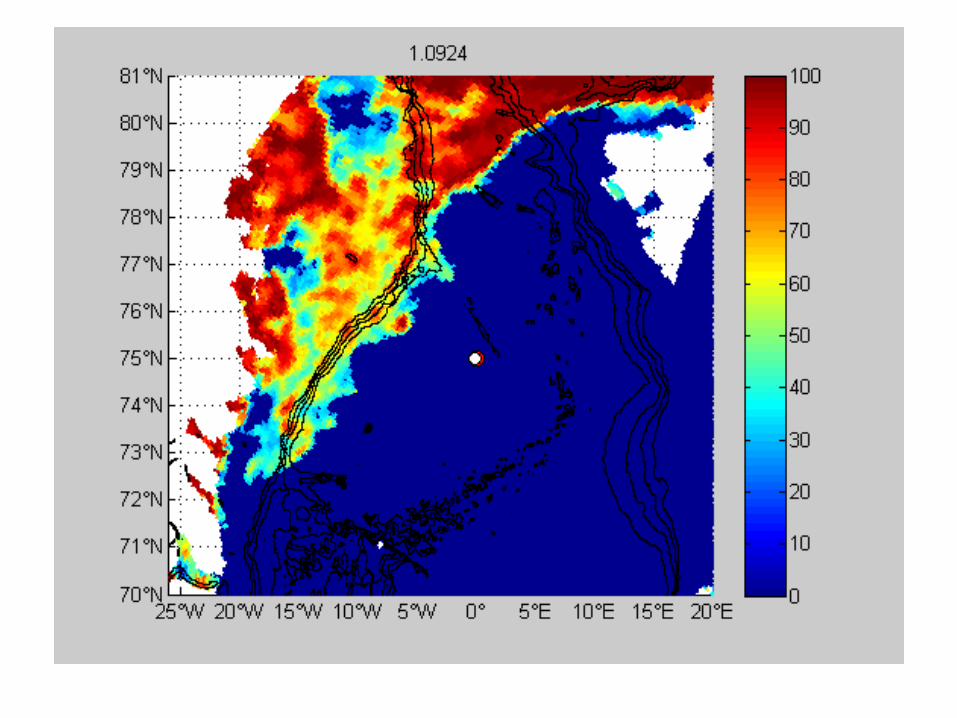
Argo float measurements in the northwestern Nordic Seas
Greenland Sea Basin: 1396 profiles 2001 to 2015 on average: 9 profiles per month
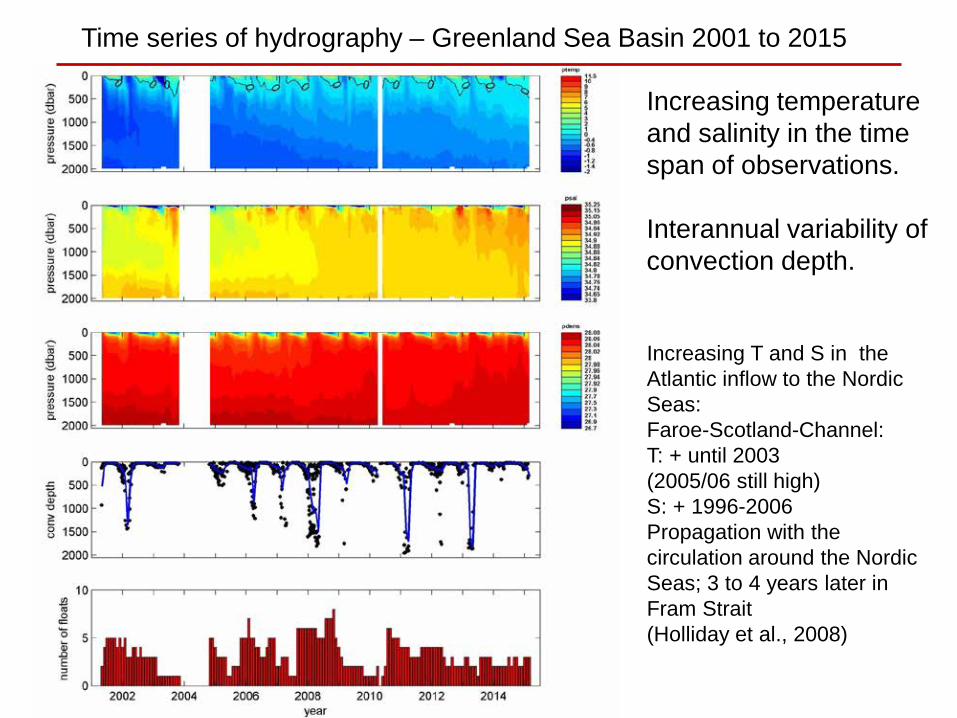
Time series of hydrography – Greenland Sea Basin 2001 to 2015
Increasing temperature and salinity in the time span of observations. Interannual variability of convection depth. Increasing T and S in the Atlantic inflow to the Nordic Seas: Faroe-Scotland-Channel: T: + until 2003 (2005/06 still high) S: + 1996-2006 Propagation with the circulation around the Nordic Seas; 3 to 4 years later in Fram Strait (Holliday et al., 2008)

Focus on salinity time series from the Greenland Sea

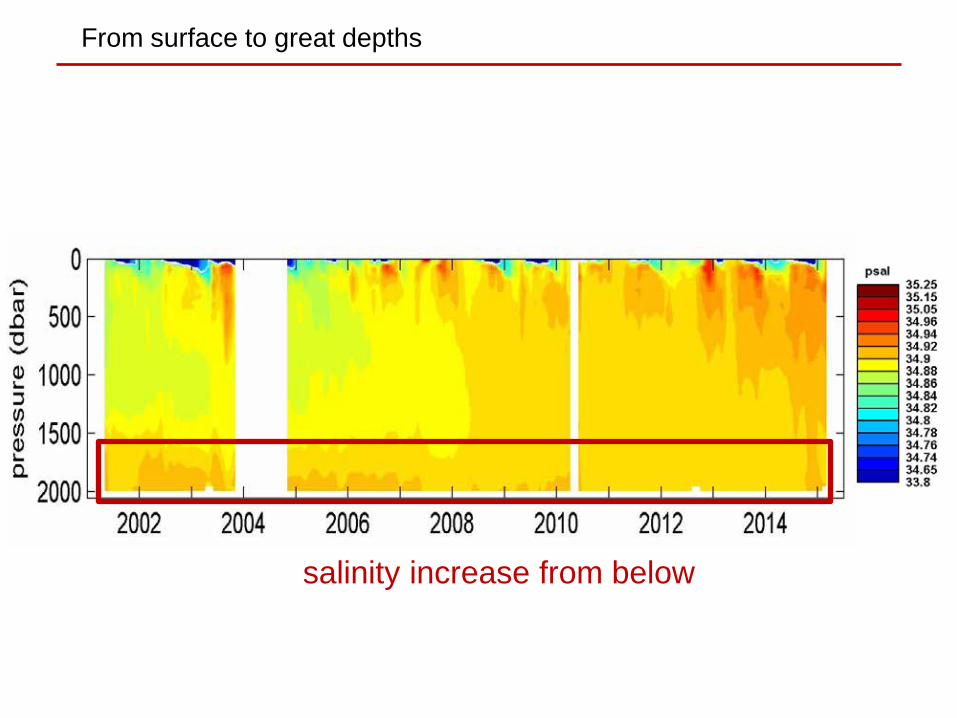
From surface to great depths
freshwater in the surface layer

From surface to great depths
salinity changes in the Atlantic layer
spreading in the vertical forced by convection
From surface to great depths
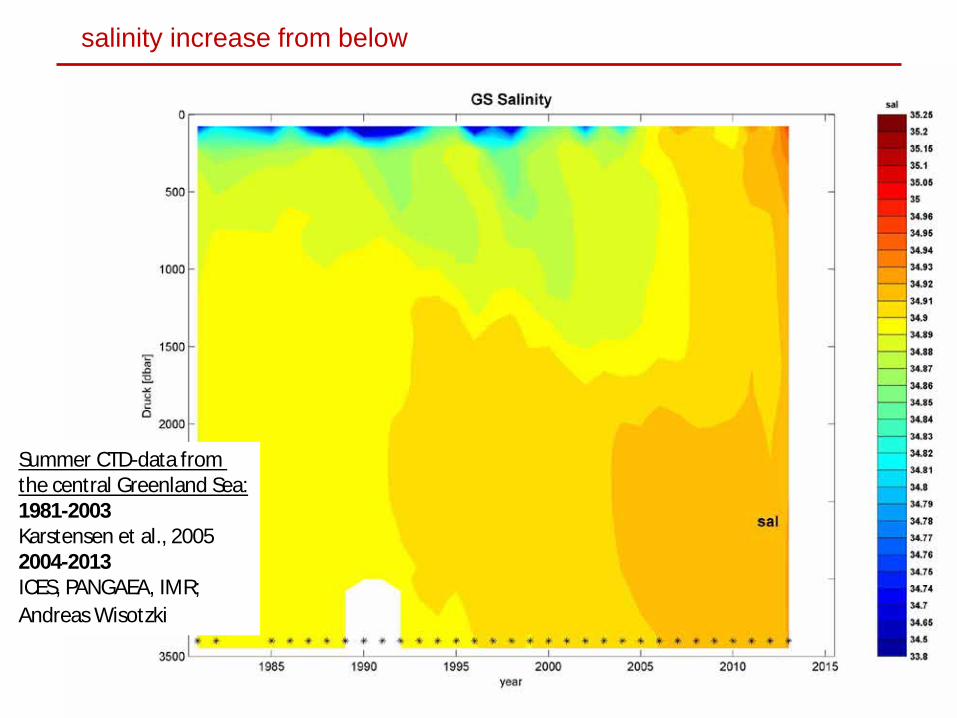
salinity increase from below

freshwater in the surface layer:

freshwater in the surface layer:
Sigma 28.0 27.6

freshwater in the surface layer:
Sigma 28.0 27.6
?

freshwater in the surface layer: summary
Relation between surface salinity and convection depth but also heat loss to the atmosphere, wind field, stratification below the surface layer influence the convection depth Another open question: Where is the variability of freshwater in the surface layer coming from Sources of freshwater: Liquid outflow from the Arctic Ocean (via Fram Strait) Ice melt, locally and remote

salinity changes in the Atlantic layer

salinity changes in the Atlantic layer
Lateral input of Atlantic Water is concentrated in 50 to 600 m (Latarius, 2013)

salinity changes in the Atlantic layer

salinity increase from below
salinity increase from below
Summer CTD-data from the central Greenland Sea: 1981-2003 Karstensen et al., 2005 2004-2013 ICES, PANGAEA, IMR; Andreas Wisotzki

salinity increase from below
Somavilla et al., 2013 Isopycnal spreading of Arctic Ocean deep waters into the inner Greenland Sea Salinity 2000 m to bottom 1995 to 2010 S: +0.01

salinity increase from below
CTD
Argo
Salinity increase in the Atlantic layer and from below met in the last years

From Argo floats to gliders
from large scale to mesoscale..
Lherminier et al., 1999: Pot. T 420m, CTD
N. Serra, pers cummunication, 2010: Snapshot, MITgcm, 4 km hor resolution
vel 500m depth, pot Vorticity red-positiv, blue-negative
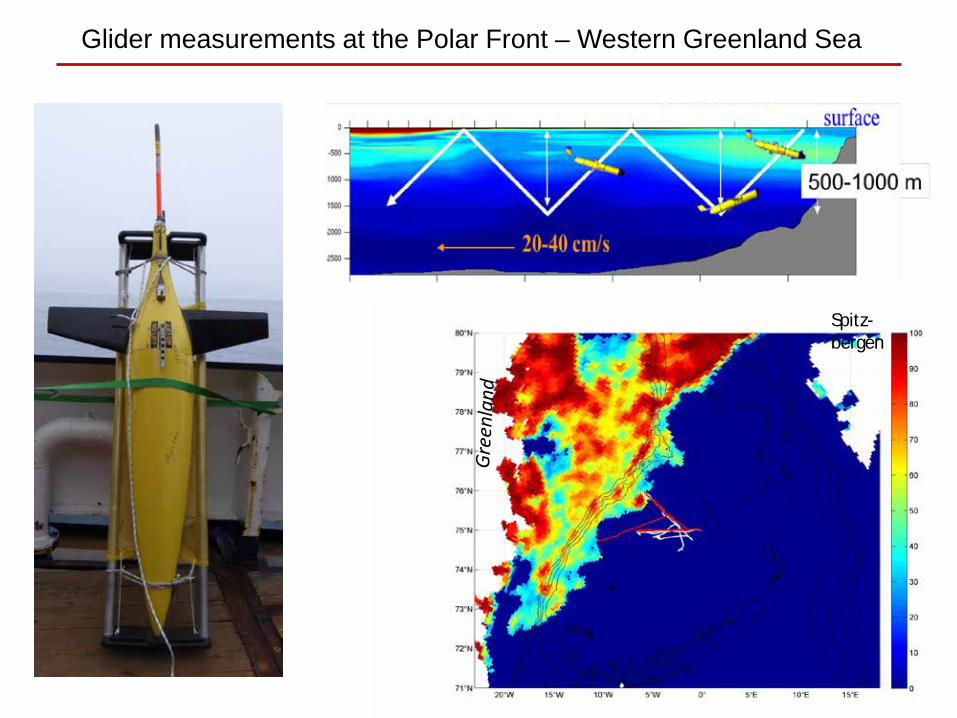
Glider measurements at the Polar Front – Western Greenland Sea
Spitz- bergen

Glider measurements at the Polar Front – Western Greenland Sea
Altogether: 60 days of mission with 2 gliders 700 dives (0-500m or 0-1000m) 4 E to W-sections 6 SE to NW sections
in the following: concentration on SE to NW salinity sections..
Ice

9 days
ICE ICE

9 days
558/120-192
7 days

6 days
558/192-244
13 days

8 days
558/244-306
8 days

16 days
127/101-168
6 days

Glider sections between Polar Front and central Greenland Sea
Smean (surface to sigma 27.5) = 33.0 ~ 7 days S: -0.18 Smean (surface to sigma 27.5) = 32.82 ~ 9 days S: +0.37 Smean (surface to sigma 27.5) = 33.19

Glider sections between Polar Front and central Greenland Sea
Smean (surface to sigma 27.5) = 33.00 ~ 0 days S: -0.05 Smean (surface to sigma 27.5) = 32.95 ~ 6 days S: -0.09 Smean (surface to sigma 27.5) = 32.86

Glider sections between Polar Front and central Greenland Sea
„freshwater features“ have horizontal scales of 10 to 40 km matches well with the baroclinic Rossby-Radius

Hovmüller diagram build from the glider sections
14 years of Argo float measurements in the Nordic Seas enable to observe long term and large scale development of the system. The combination with observations from below 2000m and with observations with higher resolution in space and time opens the perspective for interpretation.

..
end

I. freshwater in the surface layer: