spp-ercot coordinated lubbock power and light coordinated lpl... · avoided or new project analysis...
TRANSCRIPT

ERCOT Public
06/26//2017
SPP-ERCOT Coordinated Lubbock Power and Light Integration Impact Analysis
Version 1.0

SPP-ERCOT Coordinated Lubbock Power and Light Integration Impact Analysis ERCOT Public
© 2017 ERCOT
All rights reserved.
Document Revisions
Date Version Description Author(s) Reviewed By
06/23/2017 1.0 Final Draft A. Benjamin Richardson, Ajay
Pappu, Ying Li, Yang Zhang,
Sandeep Sharma, Chad
Thompson, Dave Maggio, Ramya
Nagarajan
Jeff Billo, Prabhu
Gnanam
SPP-ERCOT Coordinated Lubbock Power and Light Integration Impact Analysis ERCOT Public
© 2017 ERCOT
All rights reserved. 1
Table of Contents
1. Executive Summary ............................................................................................................ 2
2. Overview ............................................................................................................................. 3
3. Assumptions and Performance Criteria .............................................................................. 4
3.1. Load Flow Assumptions ............................................................................................... 5
3.2. Production Cost and NPV Assumptions ....................................................................... 6
3.3. Dynamic Study Assumptions ........................................................................................ 7
3.4. Study Criteria ................................................................................................................ 9
4. Production Cost Analysis .................................................................................................. 11
4.1. Impacts on the Panhandle System Strength and Export Limits ................................ 11
4.2. Impact on Production Cost of converting LP&L Units to Synchronous Condensers . 11
4.3. Impact on Production Cost of Integrating Lubbock .................................................... 12
4.4. Customer Impacts ...................................................................................................... 14
5. Avoided or New Project Analysis ...................................................................................... 15
6. Operational Costs and Reliability Impact Assessment ..................................................... 17
6.1. Operations .................................................................................................................. 17
6.2. Markets ....................................................................................................................... 17
7. Ancillary Service Impact Assessment............................................................................... 18
8. Congestion Rights Impact Assessment ............................................................................ 22
9. SSR Impact Analysis ........................................................................................................ 23
9.1. Study Cases and Topology Check ............................................................................. 23
9.2. Study Results.............................................................................................................. 23
10. Conclusion ........................................................................................................................ 24
APPENDIX A ........................................................................................................................... 27
APPENDIX B ........................................................................................................................... 27
APPENDIX C .......................................................................................................................... 27
APPENDIX D .......................................................................................................................... 28

SPP-ERCOT Coordinated Lubbock Power and Light Integration Impact Analysis ERCOT Public
© 2017 ERCOT
All rights reserved. 2
1. Executive Summary
On July 19, 2016, Public Utility Commission of Texas (PUCT and/or Commission) Chairman Nelson filed a memo in Project No. 45633, Project to Identify Issues Pertaining to Lubbock Power & Light’s Proposal to Become Part of the Electric Reliability Council of Texas, for discussion at the July 20, 2016 Open Meeting.1 Project No. 45633 addresses the proposed move of a portion of the Lubbock Power and Light (LP&L) system from the Southwest Power Pool (SPP) grid into the Electric Reliability Council of Texas, Inc. (ERCOT) System. Former Chairman Nelson’s memo recommended either a joint study by ERCOT and SPP on the tangible costs and benefits of the proposed transition, or alternatively, individual studies by ERCOT and SPP under a collaboration effort to use a single methodology for determining costs and benefits, with analyses on how inputs and assumptions differ with respect to the respective studies. It was decided at the July 20, 2016 Open Meeting that ERCOT and SPP would coordinate on the parameters for utilizing a single methodology for determining costs and benefits, while conducting individual studies on the impacts of the proposed LP&L transition out of SPP and into the ERCOT region. Accordingly, ERCOT has worked closely with SPP to determine a common scope and assumptions to guide its study. This report presents ERCOT’s findings concerning the various issues presented in former Chairman Nelson’s memo. SPP is expected to present their portion of the analysis in a separate study report to be filed with the Commission. ERCOT’s findings show that ERCOT’s annual production cost is expected to increase by approximately $74 million and $77 million with LP&L integrated into ERCOT in 2020 and 2025, respectively. This is primarily owing to the fact that the portion of the LP&L facilities being proposed for integration into ERCOT is composed of Load that will be served on the ERCOT System. However, Transmission Facilities that are included in the ERCOT preferred transmission option for integrating LP&L into ERCOT (i.e., Option 4ow2) will facilitate more power from low-cost Generation Resources in the Panhandle to reach the ERCOT market. Even if LP&L were not integrated into ERCOT and the construction of the Option 4ow or similar Transmission Facilities were to move forward, those facilities alone would increase the Panhandle export limit, and thereby decrease ERCOT production costs. ERCOT’s analysis indicated that no planned system improvement projects in the 2016 Regional Transmission Plan (RTP) or 2016 Long-Term System Assessment (LTSA) (current trends scenario) could be avoided or deferred by integrating LP&L into ERCOT, nor would any additional ERCOT System improvement projects be needed - beyond the Option 4ow Transmission Facilities - to integrate LP&L into the ERCOT System. Further, based on its findings, ERCOT does not recommend converting the LP&L Coke Units 1 and 2 to Synchronous Condenser Units. Evaluation of impacts related to ERCOT operations, Ancillary Services, and Congestion Revenue Rights (CRR) revealed that there are no existing 115 kV Transmission Facilities in ERCOT, and therefore, no 115 kV voltage class systems/designations/models are currently available for use by ERCOT Operations staff. Adding the 115 kV voltage class to ERCOT will have a minor, but noted impact since it will require adding this new voltage class to ERCOT’s existing tools. It will also require further review of system functionality and the addition of binding document language to ensure proper coverage. ERCOT expects minimal impact to Ancillary Services and reserve requirements both from a cost and reliability perspective. Impacts on CRRs will depend on congestion patterns. Although it is likely that a decision to move forward with LP&L’s integration into ERCOT would be made before any affected CRRs would be auctioned (since the farthest CRR auction is 36 months out), a decision to move forward with the construction of the necessary Transmission Facilities would need to be made at least 36 months in advance of the CRR auction to avoid CRR impacts..
1 Project to Identify Issues Pertaining to Lubbock Power & Light’s Proposal to Become Part of the Electric Reliability Council of
Texas, Project No. 45633, Open Meeting, July 20, 2016, Agenda Item No. 30 Memo from Chairman Nelson (Jul 19, 2016). 2 Project No. 45633, ERCOT Letter to Commissioners – LP&L System Study (Jun. 17, 2016), see pg. 24.

SPP-ERCOT Coordinated Lubbock Power and Light Integration Impact Analysis ERCOT Public
© 2017 ERCOT
All rights reserved. 3
2. Overview
This report presents ERCOT’s findings and analyses concerning the issues presented in former Chairman Nelson’s memo. Over the course of several months, ERCOT and SPP have had detailed discussions to compare study methodologies, develop an agreed upon study scope, and arrive at consistent study input assumptions to complete the requested coordinated studies. The agreed upon scope and study assumptions are described in the SPP-ERCOT Coordinated Lubbock ERCOT Integration Study Scope, as filed with the Commission on February 2, 2017 (Appendix A).3 During this time it was also recognized that due to differences in established study methods and market structures entire consistency between ERCOT and SPP coordinated studies would not be possible. ERCOT’s report addresses each of the following study items as requested in former Chairman Nelson’s memo with the exception of items 7 and 12, which ERCOT is unable to address as previously noted in the SPP-ERCOT Coordinated Lubbock ERCOT Integration Study Scope, as filed with the Commission on February 2, 2017 (Appendix A).
1. A production cost analysis for ERCOT and SPP. 2. An analysis of the impacts on the transmission system that includes an evaluation of the
estimated economic impacts of the proposed integration. For SPP, this should also include evaluation of costs necessary to disconnect a portion of the LP&L system from SPP.
3. Analysis of avoided projects or new projects as a result of moving the LP&L Load to ERCOT and the estimated costs of those projects.
4. An evaluation of the impacts on operations, both from a cost and reliability perspective, on the ERCOT and SPP systems.
5. An evaluation of the impacts on ancillary services-both from a cost and reliability perspective. 6. An evaluation of the impacts on congestion rights. 7. An evaluation of the cost and reliability impacts on all customer classes in ERCOT and SPP.
This was not fully evaluated in this report; however, some data and analysis is offered herein that may be relevant enough to provide some insight into customer impacts.
8. Any other potential reliability impacts on both the ERCOT and SPP systems. 9. A study of sub synchronous resonance impacts and any attendant cost implications, including
potential cost savings. 10. An evaluation of power flow and system contingency for both the ERCOT and SPP systems. 11. An evaluation of LP&L,'s proposal to use some of its existing generation as synchronous
condensers. 12. (Not evaluated in this report) An evaluation of LP&L's ability to ensure that comingling of the
SPP and ERCOT systems will not occur. ERCOT cannot perform this evaluation however LP&L may be able to perform this evaluation for the PUCT.
3 Project No. 45633, Letter to Chairman and Commissioners (Feb. 2, 2017).
SPP-ERCOT Coordinated Lubbock Power and Light Integration Impact Analysis ERCOT Public
© 2017 ERCOT
All rights reserved. 4
3. Assumptions and Performance Criteria
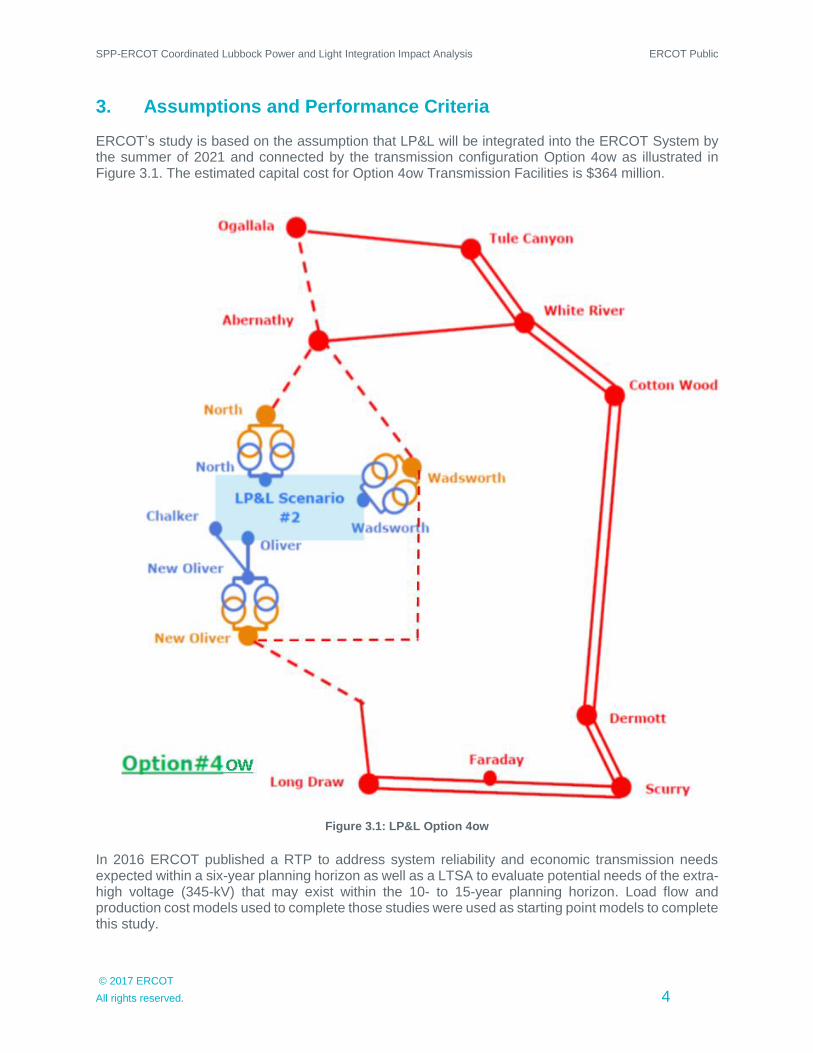
ERCOT’s study is based on the assumption that LP&L will be integrated into the ERCOT System by the summer of 2021 and connected by the transmission configuration Option 4ow as illustrated in Figure 3.1. The estimated capital cost for Option 4ow Transmission Facilities is $364 million.
Figure 3.1: LP&L Option 4ow
In 2016 ERCOT published a RTP to address system reliability and economic transmission needs expected within a six-year planning horizon as well as a LTSA to evaluate potential needs of the extra-high voltage (345-kV) that may exist within the 10- to 15-year planning horizon. Load flow and production cost models used to complete those studies were used as starting point models to complete this study.
SPP-ERCOT Coordinated Lubbock Power and Light Integration Impact Analysis ERCOT Public
© 2017 ERCOT
All rights reserved. 5
3.1. Load Flow Assumptions
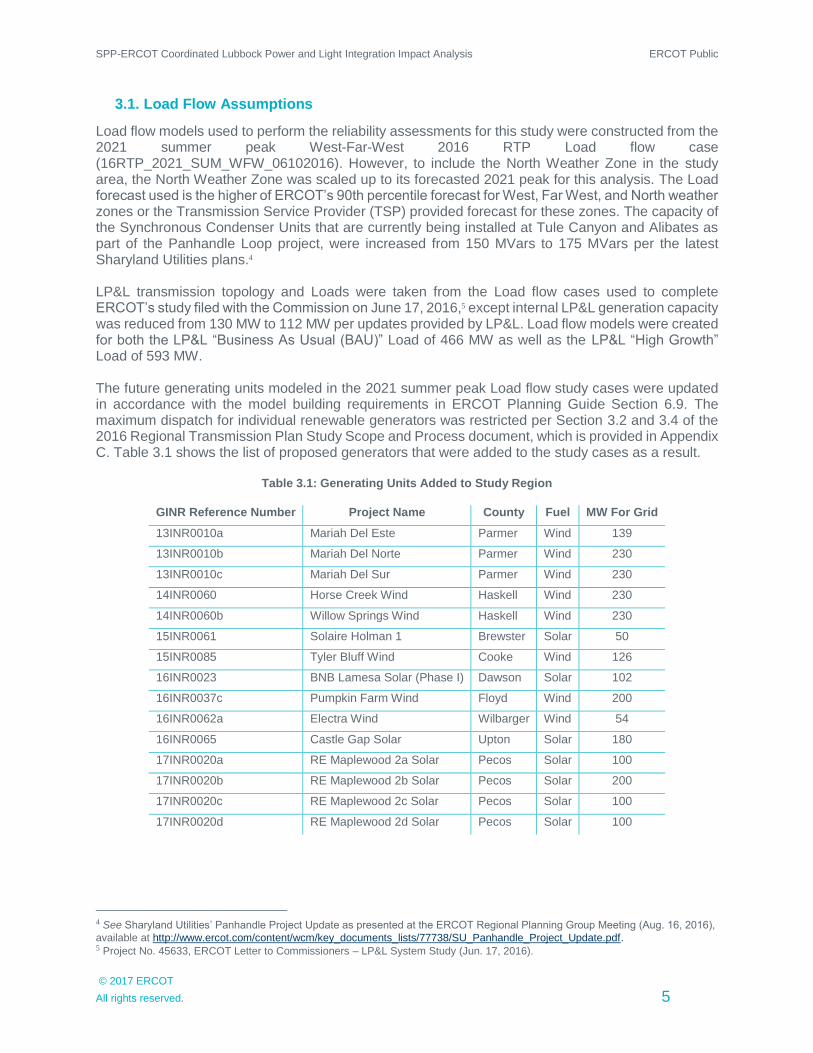
Load flow models used to perform the reliability assessments for this study were constructed from the 2021 summer peak West-Far-West 2016 RTP Load flow case (16RTP_2021_SUM_WFW_06102016). However, to include the North Weather Zone in the study area, the North Weather Zone was scaled up to its forecasted 2021 peak for this analysis. The Load forecast used is the higher of ERCOT’s 90th percentile forecast for West, Far West, and North weather zones or the Transmission Service Provider (TSP) provided forecast for these zones. The capacity of the Synchronous Condenser Units that are currently being installed at Tule Canyon and Alibates as part of the Panhandle Loop project, were increased from 150 MVars to 175 MVars per the latest Sharyland Utilities plans.4 LP&L transmission topology and Loads were taken from the Load flow cases used to complete ERCOT’s study filed with the Commission on June 17, 2016,5 except internal LP&L generation capacity was reduced from 130 MW to 112 MW per updates provided by LP&L. Load flow models were created for both the LP&L “Business As Usual (BAU)” Load of 466 MW as well as the LP&L “High Growth” Load of 593 MW. The future generating units modeled in the 2021 summer peak Load flow study cases were updated in accordance with the model building requirements in ERCOT Planning Guide Section 6.9. The maximum dispatch for individual renewable generators was restricted per Section 3.2 and 3.4 of the 2016 Regional Transmission Plan Study Scope and Process document, which is provided in Appendix C. Table 3.1 shows the list of proposed generators that were added to the study cases as a result.
Table 3.1: Generating Units Added to Study Region
GINR Reference Number Project Name County Fuel MW For Grid
13INR0010a Mariah Del Este Parmer Wind 139
13INR0010b Mariah Del Norte Parmer Wind 230
13INR0010c Mariah Del Sur Parmer Wind 230
14INR0060 Horse Creek Wind Haskell Wind 230
14INR0060b Willow Springs Wind Haskell Wind 230
15INR0061 Solaire Holman 1 Brewster Solar 50
15INR0085 Tyler Bluff Wind Cooke Wind 126
16INR0023 BNB Lamesa Solar (Phase I) Dawson Solar 102
16INR0037c Pumpkin Farm Wind Floyd Wind 200
16INR0062a Electra Wind Wilbarger Wind 54
16INR0065 Castle Gap Solar Upton Solar 180
17INR0020a RE Maplewood 2a Solar Pecos Solar 100
17INR0020b RE Maplewood 2b Solar Pecos Solar 200
17INR0020c RE Maplewood 2c Solar Pecos Solar 100
17INR0020d RE Maplewood 2d Solar Pecos Solar 100
4 See Sharyland Utilities’ Panhandle Project Update as presented at the ERCOT Regional Planning Group Meeting (Aug. 16, 2016),
available at http://www.ercot.com/content/wcm/key_documents_lists/77738/SU_Panhandle_Project_Update.pdf. 5 Project No. 45633, ERCOT Letter to Commissioners – LP&L System Study (Jun. 17, 2016).

SPP-ERCOT Coordinated Lubbock Power and Light Integration Impact Analysis ERCOT Public
© 2017 ERCOT
All rights reserved. 6
3.2. Production Cost and NPV Assumptions
To perform the economic assessment, the 2019 UPLAN model from the 2016 RTP was used to create a 2020 production cost model with ERCOT Loads scaled up to match the 2016 RTP Load forecast for 2020. The 2026 UPLAN model from the 2016 LTSA Current Trends scenario was used to create a 2025 production cost model with ERCOT Loads scaled down to match the 2016 LTSA Load forecast for 2025. ERCOT transmission projects expected to be in-service by 2020 were added to the 2020 scenario to reflect the expected 2020 transmission topology. The 2025 transmission topology remained the same as the topology in the 2016 LTSA Current Trends 2026 economic case. Hourly power flow across the North and East DC ties were set to match flows modeled by SPP. The 2016 RTP recommended a new 175 MVar Synchronous Condenser Unit at the Windmill station. ERCOT assumed that this Synchronous Condenser Unit would be in service in both the 2020 and 2025 models (except as noted in Sections 4 and 5). Internal LP&L transmission topology and generating unit capacities were constructed to match the Load flow model. The LP&L BAU Load was used in the economic assessment. Hourly LP&L Load profiles for 2020 and 2025 were provided by LP&L. No changes were made to the internal LP&L topology or generation between the 2020 and the 2025 production cost models. The Panhandle Export Interface limit was set to 90% of the estimated Weighted Short Circuit Ratio (WSCR) stability limit within the ERCOT production cost models to allow for a 10% operating margin. The 2025 production cost model included generation assumptions from the current trends scenario based on the 2016 LTSA Scope. Table 3.2 shows the list of proposed generators that were added to the 2020 scenario in accordance with the model building requirements in ERCOT Planning Guide Section 6.9.
Table 3.2: Generating Units Added to the 2020 Scenario
GINR Reference Number Project Name County Fuel MW For Grid
15INR0049 Javelina 2 Wind Zapata Wind 200
15INR0082 Flat Top Wind I Comanche Wind 200
15INR0061 Solaire Holman 1 Brewster Solar 50
16INR0023b BNB Lamesa Solar B Dawson Solar 102
17INR0020b RE Maplewood 2b Solar Pecos Solar 200
16INR0009 Point Comfort Calhoun Natural Gas 100
Net Present Value (NPV) calculations are based the 2.5% escalation and an 8% discount rates that were agreed upon with SPP.

SPP-ERCOT Coordinated Lubbock Power and Light Integration Impact Analysis ERCOT Public
© 2017 ERCOT
All rights reserved. 7
3.3. Dynamic Study Assumptions
3.3.1. Weighted Short-Circuit Ratio
The Panhandle region in ERCOT has system strength and stability challenges due to the amount of non-synchronous generation located in the area. Maintaining a WSCR greater than or equal to 1.5 under normal system conditions is recommended for Panhandle system strength and stability based on previous detailed studies of the region. The WSCR is an index based on short circuit levels for the strength of a cluster of buses. If generation output in the Panhandle were to be sufficiently high such that the WSCR were to fall below 1.5, it could lead to control system instability in the Panhandle region under contingency conditions.
WSCR is defined as:
2)(
)*(
N
i
RMWi
N
i
RMWiSCMVAi
P
PS
WSCR
Where SSCMVAi is the short circuit capacity at bus i before the connection of non-synchronous generation. PRMWi is the MW dispatch of non-synchronous generation connected to bus i and N is the number of buses of a cluster.
The latest WFW 2021 summer peak case from the 2016 RTP was used for the WSCR calculation. The substations in the Panhandle and associated wind generation capacities included in the calculation are summarized in Table 3.2.
Table 3.3: Panhandle Wind Generation Capacity by Transmission Station
Panhandle Transmission Station Wind Generation Capacity (MW)
Cottonwood 257.3
White River 900.3
Tule Canyon 510.0
Ogallala 300.0
Windmill 1,262.9
AJ Swope 355.0
Alibates 749.2
Railhead 409.0
Gray 462.6
Total 5,206.3
The following assumptions were used in the WSCR calculation:
Conventional generating units in Lubbock and West Texas were de-committed to
simulate the most stressed system condition from a voltage stability and system
strength perspective
All existing series capacitors in West Texas were modeled as in-service
The Panhandle output limit based on the WSCR calculation was determined by
proportionally reducing the output with respect to the capacity of all Panhandle
wind generating units

SPP-ERCOT Coordinated Lubbock Power and Light Integration Impact Analysis ERCOT Public
© 2017 ERCOT
All rights reserved. 8
3.3.2. Dynamic Stability models
The ERCOT Dynamic Working Group (DWG) Future Year 2018 High Wind Low Load dynamic dataset was used as the start case to develop the stability study case. The following changes were made to the start case to create the study cases:
Addition of the LP&L transmission system with LP&L Option 4ow; LP&L system
Load modeled at approximately 593 MW to represent the high Load growth
scenario
Addition of the second circuit on the Panhandle loop: Alibates – AJ Swope –
Windmill – Ogallala – Tule Canyon 345kV line
Addition of 175 MVA of Synchronous Condenser Units connected at 345 kV at
Alibates and Tule Canyon
Wind generating units in the Panhandle and West Texas that met Planning Guide
Section 6.9 requirements by the end of February 2017 were modeled in the study
case, as shown in Table 3.4
Wind generating units in the Panhandle were dispatched at a uniform percentage
of their capacity while maintaining a WSCR of 1.5 in the Panhandle
Conventional generating units in West Texas and the Panhandle were turned off
Table 3.4: Panhandle Wind Generating Units
Project Name Capacity (MW)
Grandview Phase I (Conway Windfarm) 211
Colbeck's Corner W (Grandview Phase II) 200
Mariah Del Norte 230
Spinning Spur Wind Two 161
Hereford Wind 200
Jumbo Road Wind 300
Miami Wind 1 Project 289
Longhorn Energy Center North 200
South Plains I 200
South Plains II Phase a 152
South Plains II Phase b 149
Panhandle Wind 1 218
Panhandle Wind 2 191
Route66 Wind 150
Wake Wind 257
Spinning Spur W 3 194
Briscoe Wind 150
Grandview W 3 188
Mariah Del Este 139
Mariah Del Sur 230
Swisher Wind 300
Longhorn South 160
Salt Fork 1 Wind 174
Falvez Astra W 163
Cotton Plains Wind 50
Old Settler Wind 150
Pumpkin Farm Wind 200

SPP-ERCOT Coordinated Lubbock Power and Light Integration Impact Analysis ERCOT Public
© 2017 ERCOT
All rights reserved. 9
The dynamic modeling parameters for the LP&L system Load and generating units, including two LP&L synchronous condensers (referred to as LP&L condensers in the report) converted from retired LP&L generators, were provided by LP&L.
The stability cases contained all existing and planned facilities in the study region, including reactive resources and control equipment. The automatic operation of these facilities designed to provide dynamic control of electrical system quantities were simulated in the study. The total capacity of Panhandle wind generating units modeled in the stability study case was 5,206 MW.
3.4. Study Criteria
3.4.1. Steady-State Criteria
For the reliability analysis, the following thermal and voltage limits were enforced:
Rate A under pre-contingency conditions for 60 kV and above transmission lines and for
transformers with a low side voltage of 60 kV and above
Rate B under post-contingency conditions for 60 kV and above transmission lines and for
transformers with a low side voltage of 60 kV and above
0.95 p.u. voltage under pre-contingency conditions for 100 kV and above transmission
lines and for transformers with a low side voltage of 100 kV and above
0.90 p.u. voltage under post-contingency conditions for 100 kV and above transmission
lines and for transformers with a low side voltage of 100 kV and above
1.05 p.u. voltage under pre- and post-contingency conditions for 100 kV and above
transmission lines and for transformers with a low side voltage of 100 kV and above
The study region monitored for this study was the combined ERCOT North, West and Far-West weather zones along with the LP&L network and all facilities proposed to interconnect LP&L with ERCOT. Certain thermal and voltage violations within the study region that were physically and electrically remote from the proposed LP&L interconnect with ERCOT were deemed unrelated and not considered in this study. The following contingencies were simulated based on NERC TPL-001-4 and ERCOT Planning Criteria:6
P0
P1 and P7
P3: G-1+N-1 only
P6: X-1+N-1 and selected N-1-1 only
P2, P4, and P5
6 ERCOT Planning Guide, Section 4, Transmission Planning Criteria, available at
http://www.ercot.com/content/wcm/current_guides/53526/04_050115.doc.

SPP-ERCOT Coordinated Lubbock Power and Light Integration Impact Analysis ERCOT Public
© 2017 ERCOT
All rights reserved. 10
3.4.2. Dynamics Criteria
The system performance requirements defined in NERC TPL-001-4 and the ERCOT Planning Guide were also utilized to assess the dynamic performance. Select ERCOT transmission buses were monitored in dynamic simulations for frequency and voltage deviations. All generating units were monitored for angular separation. Relay actions recorded in the simulation log files were processed to summarize the operation of any relays that were included in the model (e.g., synchronous generators that were tripped due to machine angle swings in excess of 180 degrees, wind turbines tripped by voltage protection relays, etc.).

SPP-ERCOT Coordinated Lubbock Power and Light Integration Impact Analysis ERCOT Public
© 2017 ERCOT
All rights reserved. 11
4. Production Cost Analysis
Production cost simulations were completed to compare total ERCOT production cost with and without LP&L system integration into ERCOT, as well as to estimate the potential production cost benefit of increasing the ERCOT Panhandle export limit by converting selected LP&L generating units into Synchronous Condenser Units. This section describes how integrating LP&L into ERCOT affects Panhandle export limits, with and without converting LP&L units to Synchronous Condenser Units, and shows how total ERCOT production costs are affected by such changes.
4.1. Impacts on the Panhandle System Strength and Export Limits
The WSCR was calculated to evaluate the impact of LP&L integration with LP&L Option 4ow, as well as the conversion of two retired LP&L generators to Synchronous Condenser Units on the system’s strength in the Panhandle region. The definition of the Panhandle interface for base case and LP&L Option 4ow are described in Appendix B of ERCOT’s LP&L integration study report, as filed with the Commission June 17, 2016.7 For the purpose of this study, the interface definition was based on the system conditions and generation projects included in the study case, and may need to be revised based on future system topology and generation additions in the Panhandle region.
The Panhandle export limit was 4,032 MW to maintain a WSCR of 1.5 for the base case (without LP&L and the associated LP&L Option 4ow). The Panhandle export capabilities based on a WSCR of 1.5 are listed in Table 4.1. The results in Table 4.1 indicate that the integration of LP&L system into ERCOT will enhance system strength in the Panhandle region, and therefore improve the Panhandle export capability.
Table 4.1 Lubbock Integration Impact on the Panhandle Export Capability
Case WSCR Panhandle Export Limit (MW)
Base (without LP&L and without 175 MVar synchronous condenser at Windmill) 1.5 4,032
Option 4ow (without LP&L synchronous condensers and without 175 MVar synchronous condenser at Windmill) 1.5 4,519
Option 4ow (with LP&L synchronous condensers and without 175 MVar synchronous condenser at Windmill) 1.5 4,602
4.2. Impact on Production Cost of converting LP&L Units to Synchronous Condensers
LP&L’s Coke Units 1 and 2 natural gas fired steam turbines are currently not in-service and have been classified as “cold storage” status by LP&L. LP&L has suggested that these units could be converted into Synchronous Condenser Units, and reactivated to provide dynamic reactive support and increase system inertia near the Panhandle. LP&L has provided a preliminary cost estimate of $6.5 million per unit to reactivate Coke Units 1 and 2, and convert them to Synchronous Condenser Units, for a total of $13 million. As shown in Table 4.1 above, the Panhandle export limit could be increased by converting the Coke Units into Synchronous Condenser Units. ERCOT estimates that converting these units to Synchronous Condenser Units could increase the Panhandle export limit by approximately 83 MW.
7 Project No. 45633, ERCOT Letter to Commissioners – LP&L System Study (Jun. 17, 2016).
SPP-ERCOT Coordinated Lubbock Power and Light Integration Impact Analysis ERCOT Public
© 2017 ERCOT
All rights reserved. 12
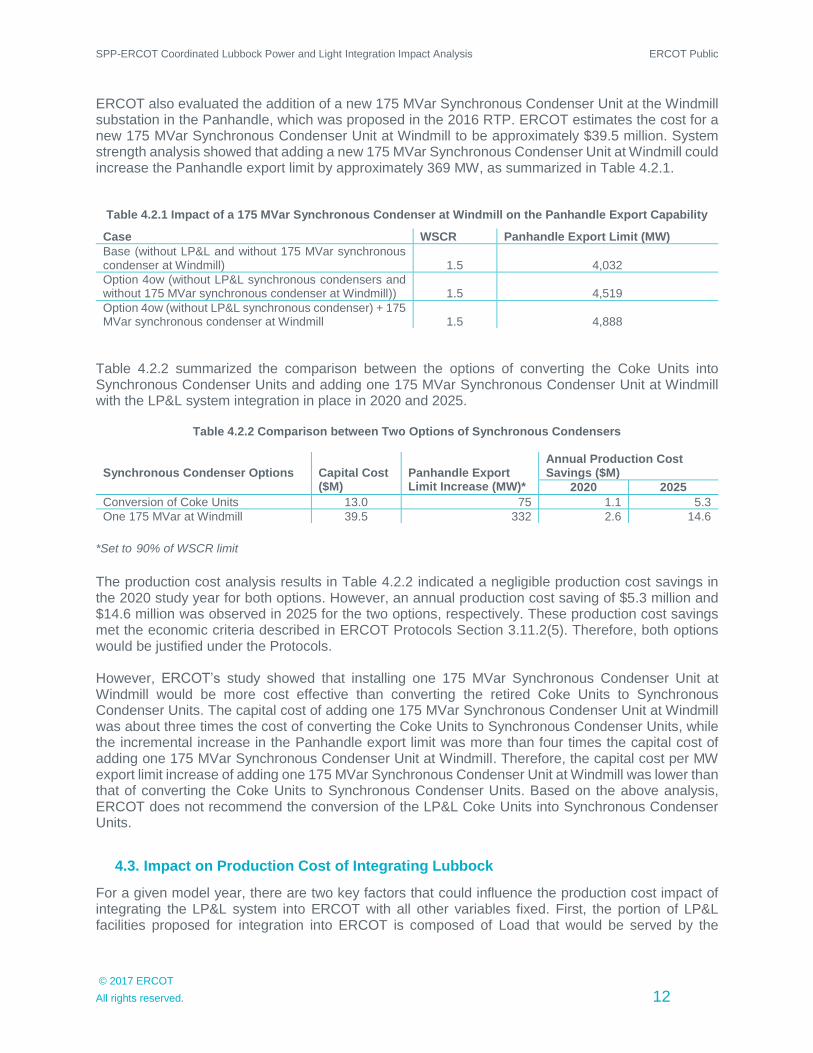
ERCOT also evaluated the addition of a new 175 MVar Synchronous Condenser Unit at the Windmill substation in the Panhandle, which was proposed in the 2016 RTP. ERCOT estimates the cost for a new 175 MVar Synchronous Condenser Unit at Windmill to be approximately $39.5 million. System strength analysis showed that adding a new 175 MVar Synchronous Condenser Unit at Windmill could increase the Panhandle export limit by approximately 369 MW, as summarized in Table 4.2.1.
Table 4.2.1 Impact of a 175 MVar Synchronous Condenser at Windmill on the Panhandle Export Capability
Case WSCR Panhandle Export Limit (MW)
Base (without LP&L and without 175 MVar synchronous condenser at Windmill) 1.5 4,032
Option 4ow (without LP&L synchronous condensers and without 175 MVar synchronous condenser at Windmill)) 1.5 4,519
Option 4ow (without LP&L synchronous condenser) + 175 MVar synchronous condenser at Windmill 1.5 4,888
Table 4.2.2 summarized the comparison between the options of converting the Coke Units into Synchronous Condenser Units and adding one 175 MVar Synchronous Condenser Unit at Windmill with the LP&L system integration in place in 2020 and 2025.
Table 4.2.2 Comparison between Two Options of Synchronous Condensers
Synchronous Condenser Options
Capital Cost ($M)
Panhandle Export Limit Increase (MW)*
Annual Production Cost Savings ($M)
2020 2025
Conversion of Coke Units 13.0 75 1.1 5.3
One 175 MVar at Windmill 39.5 332 2.6 14.6
*Set to 90% of WSCR limit The production cost analysis results in Table 4.2.2 indicated a negligible production cost savings in the 2020 study year for both options. However, an annual production cost saving of $5.3 million and $14.6 million was observed in 2025 for the two options, respectively. These production cost savings met the economic criteria described in ERCOT Protocols Section 3.11.2(5). Therefore, both options would be justified under the Protocols. However, ERCOT’s study showed that installing one 175 MVar Synchronous Condenser Unit at Windmill would be more cost effective than converting the retired Coke Units to Synchronous Condenser Units. The capital cost of adding one 175 MVar Synchronous Condenser Unit at Windmill was about three times the cost of converting the Coke Units to Synchronous Condenser Units, while the incremental increase in the Panhandle export limit was more than four times the capital cost of adding one 175 MVar Synchronous Condenser Unit at Windmill. Therefore, the capital cost per MW export limit increase of adding one 175 MVar Synchronous Condenser Unit at Windmill was lower than that of converting the Coke Units to Synchronous Condenser Units. Based on the above analysis, ERCOT does not recommend the conversion of the LP&L Coke Units into Synchronous Condenser Units.
4.3. Impact on Production Cost of Integrating Lubbock
For a given model year, there are two key factors that could influence the production cost impact of integrating the LP&L system into ERCOT with all other variables fixed. First, the portion of LP&L facilities proposed for integration into ERCOT is composed of Load that would be served by the
SPP-ERCOT Coordinated Lubbock Power and Light Integration Impact Analysis ERCOT Public
© 2017 ERCOT
All rights reserved. 13
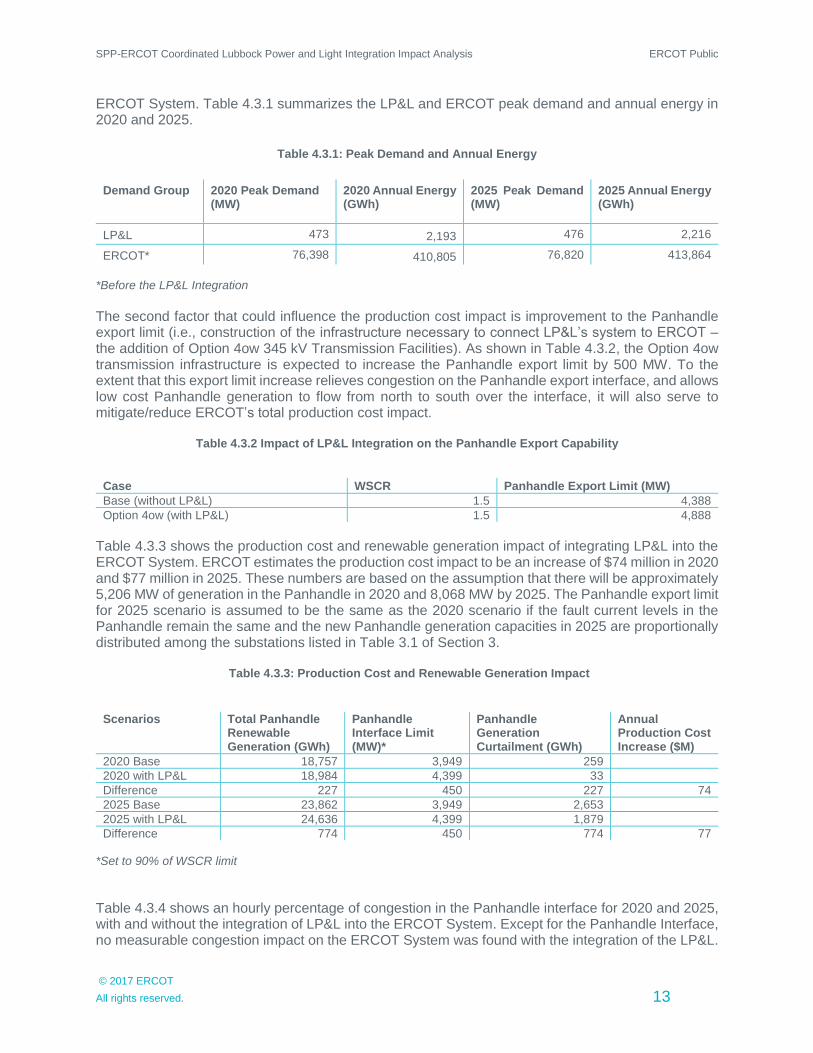
ERCOT System. Table 4.3.1 summarizes the LP&L and ERCOT peak demand and annual energy in 2020 and 2025.
Table 4.3.1: Peak Demand and Annual Energy
Demand Group 2020 Peak Demand (MW)
2020 Annual Energy (GWh)
2025 Peak Demand (MW)
2025 Annual Energy (GWh)
LP&L 473 2,193 476 2,216
ERCOT* 76,398 410,805 76,820 413,864
*Before the LP&L Integration The second factor that could influence the production cost impact is improvement to the Panhandle export limit (i.e., construction of the infrastructure necessary to connect LP&L’s system to ERCOT – the addition of Option 4ow 345 kV Transmission Facilities). As shown in Table 4.3.2, the Option 4ow transmission infrastructure is expected to increase the Panhandle export limit by 500 MW. To the extent that this export limit increase relieves congestion on the Panhandle export interface, and allows low cost Panhandle generation to flow from north to south over the interface, it will also serve to mitigate/reduce ERCOT’s total production cost impact.
Table 4.3.2 Impact of LP&L Integration on the Panhandle Export Capability
Case WSCR Panhandle Export Limit (MW)
Base (without LP&L) 1.5 4,388
Option 4ow (with LP&L) 1.5 4,888
Table 4.3.3 shows the production cost and renewable generation impact of integrating LP&L into the ERCOT System. ERCOT estimates the production cost impact to be an increase of $74 million in 2020 and $77 million in 2025. These numbers are based on the assumption that there will be approximately 5,206 MW of generation in the Panhandle in 2020 and 8,068 MW by 2025. The Panhandle export limit for 2025 scenario is assumed to be the same as the 2020 scenario if the fault current levels in the Panhandle remain the same and the new Panhandle generation capacities in 2025 are proportionally distributed among the substations listed in Table 3.1 of Section 3.
Table 4.3.3: Production Cost and Renewable Generation Impact
Scenarios Total Panhandle Renewable Generation (GWh)
Panhandle Interface Limit (MW)*
Panhandle Generation Curtailment (GWh)
Annual Production Cost Increase ($M)
2020 Base 18,757 3,949 259
2020 with LP&L 18,984 4,399 33
Difference 227 450 227 74
2025 Base 23,862 3,949 2,653
2025 with LP&L 24,636 4,399 1,879
Difference 774 450 774 77 *Set to 90% of WSCR limit
Table 4.3.4 shows an hourly percentage of congestion in the Panhandle interface for 2020 and 2025, with and without the integration of LP&L into the ERCOT System. Except for the Panhandle Interface, no measurable congestion impact on the ERCOT System was found with the integration of the LP&L.

SPP-ERCOT Coordinated Lubbock Power and Light Integration Impact Analysis ERCOT Public
© 2017 ERCOT
All rights reserved. 14
Minor congestion was found inside LP&L on the Oliver New to Oliver 115 kV line with congestion for 0.3% of the time in 2020 and 0.2% of the time in 2025.
Table 4.3.4: Congestion (% of hours) on the Panhandle Interface
Year Base With LP&L
2020 10.1% 2.1%
2025 25.5% 14.8%
4.4. Customer Impacts
ERCOT is not able to provide a complete evaluation of the cost and reliability impacts on all customer classes in ERCOT. Nevertheless, in an effort to provide some insight into potential customer impacts, production cost analyses were performed to compare LMP values with and without LP&L integration into the ERCOT System. Appendix B provides average LMP impacts for all modeled busses in the ERCOT Region with and without LP&L integration into the ERCOT System for the years 2020 and 2025 (note: these can also be aggregated to the substation level). Additionally, Load weighted average LMP prices in ERCOT are provided in the tables below. ERCOT’s analysis of production costs indicates that the annual Load weighted average LMPs are slightly increased with the integration of LP&L into the ERCOT System. Tables 4.4.1 and 4.4.2 summarize the annual Load weighted average LMP in 2020 and 2025.
Table 4.4.1: Annual Load Weighted Average LMP – System Wide
2020
($/MWh) 2025
($/MWh)
System Wide - Base 35.25 44.61
System Wide - with LP&L 35.27 44.65
System Wide only on all non-LP&L Load buses - with LP&L 35.28 44.66
Table 4.4.2: Annual Load Weighted Average LMP – by Congestion Management Zone
Load Zone 2020 Base
($/MWh) 2020 with LP&L
($/MWh) 2025 Base ($/MWh)
2025 with LP&L ($/MWh)
LP&L n/a 33.69 n/a 43.30
LZ_HOUSTON 36.58 36.61 45.24 45.28
LZ_NORTH 34.18 34.22 44.39 44.43
LZ_SOUTH 35.05 35.05 44.54 44.59
LZ_WEST 34.55 34.66 43.45 43.50
Table 4.4.3 can also be used to estimate payments from Load paying customers within the LP&L footprint.
Table 4.4.3 LP&L Payments
2020 (million$)
2025 (million$)
LP&L as its own Load zone 75.70 98.77
LP&L as part of the West Load Zone 77.92 99.05
SPP-ERCOT Coordinated Lubbock Power and Light Integration Impact Analysis ERCOT Public
© 2017 ERCOT
All rights reserved. 15
5. Avoided or New Project Analysis
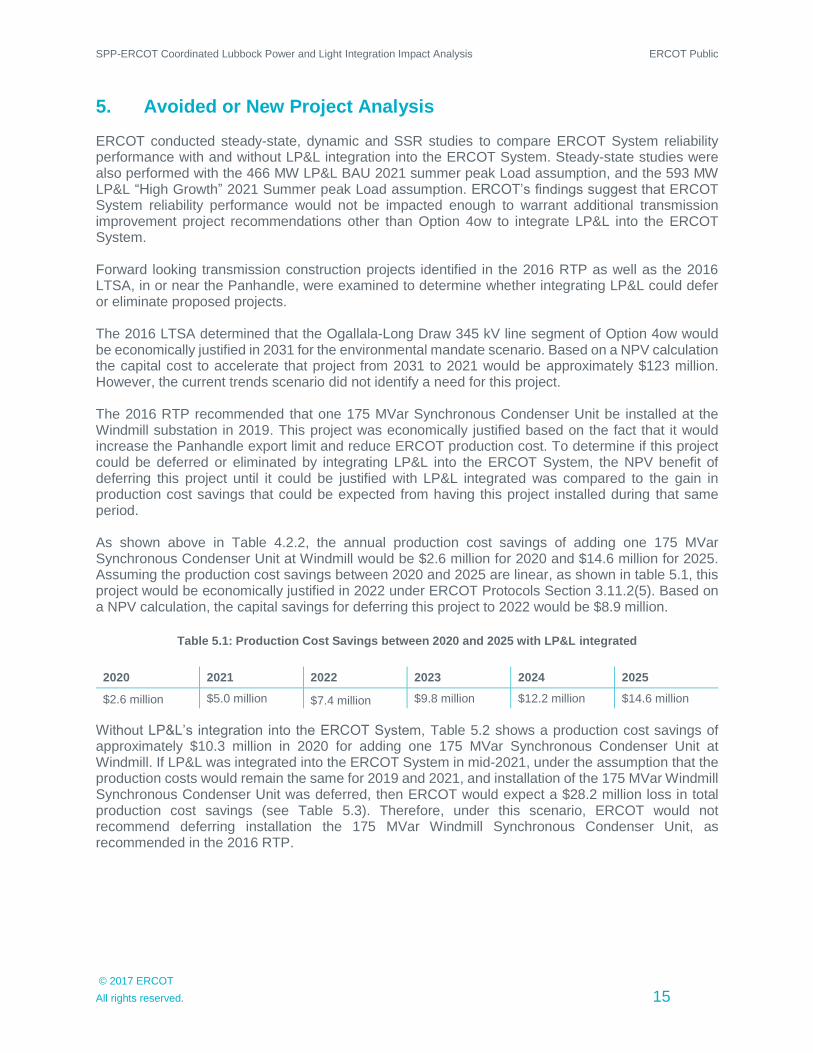
ERCOT conducted steady-state, dynamic and SSR studies to compare ERCOT System reliability performance with and without LP&L integration into the ERCOT System. Steady-state studies were also performed with the 466 MW LP&L BAU 2021 summer peak Load assumption, and the 593 MW LP&L “High Growth” 2021 Summer peak Load assumption. ERCOT’s findings suggest that ERCOT System reliability performance would not be impacted enough to warrant additional transmission improvement project recommendations other than Option 4ow to integrate LP&L into the ERCOT System. Forward looking transmission construction projects identified in the 2016 RTP as well as the 2016 LTSA, in or near the Panhandle, were examined to determine whether integrating LP&L could defer or eliminate proposed projects. The 2016 LTSA determined that the Ogallala-Long Draw 345 kV line segment of Option 4ow would be economically justified in 2031 for the environmental mandate scenario. Based on a NPV calculation the capital cost to accelerate that project from 2031 to 2021 would be approximately $123 million. However, the current trends scenario did not identify a need for this project. The 2016 RTP recommended that one 175 MVar Synchronous Condenser Unit be installed at the Windmill substation in 2019. This project was economically justified based on the fact that it would increase the Panhandle export limit and reduce ERCOT production cost. To determine if this project could be deferred or eliminated by integrating LP&L into the ERCOT System, the NPV benefit of deferring this project until it could be justified with LP&L integrated was compared to the gain in production cost savings that could be expected from having this project installed during that same period. As shown above in Table 4.2.2, the annual production cost savings of adding one 175 MVar Synchronous Condenser Unit at Windmill would be $2.6 million for 2020 and $14.6 million for 2025. Assuming the production cost savings between 2020 and 2025 are linear, as shown in table 5.1, this project would be economically justified in 2022 under ERCOT Protocols Section 3.11.2(5). Based on a NPV calculation, the capital savings for deferring this project to 2022 would be $8.9 million.
Table 5.1: Production Cost Savings between 2020 and 2025 with LP&L integrated
2020 2021 2022 2023 2024 2025
$2.6 million $5.0 million $7.4 million $9.8 million $12.2 million $14.6 million
Without LP&L’s integration into the ERCOT System, Table 5.2 shows a production cost savings of approximately $10.3 million in 2020 for adding one 175 MVar Synchronous Condenser Unit at Windmill. If LP&L was integrated into the ERCOT System in mid-2021, under the assumption that the production costs would remain the same for 2019 and 2021, and installation of the 175 MVar Windmill Synchronous Condenser Unit was deferred, then ERCOT would expect a $28.2 million loss in total production cost savings (see Table 5.3). Therefore, under this scenario, ERCOT would not recommend deferring installation the 175 MVar Windmill Synchronous Condenser Unit, as recommended in the 2016 RTP.

SPP-ERCOT Coordinated Lubbock Power and Light Integration Impact Analysis ERCOT Public
© 2017 ERCOT
All rights reserved. 16
Table 5.2: Production Cost Saving in 2020 before LP&L integration
Case Panhandle Export Limit (MW)*
Production Cost Saving ($ M)
Base (without LP&L and without 175 Mvar synchronous condenser at Windmill 3629 -
Base (without LP&L) + 175 Mvar synchronous condenser at Windmill 3949 10.3
*Set to 90% of WSCR limit
Table 5.3: Loss of Production Cost Savings if deferring the project to 2022
2019 2020 2021 (before LP&L) 2021 (after LP&L)
$10.3 million $10.3 million $5.1 million (half of $10.3 M) $2.5 million (half of $5 M in Table 5.1)
It should also be noted that in October 2016, Sharyland Utilities submitted the South Plains Project for review by the ERCOT Regional Planning Group (RPG). This project would create a new Ogallala-Long Draw 345 kV line path. Although ERCOT did not find a need for this project in the 2016 RTP, ERCOT’s review of the RPG proposal had not been completed at the time of this report. If LP&L is integrated into the ERCOT System, the need for the South Plains Project would be superseded. The South Plains project has an estimated cost of $251 million.

SPP-ERCOT Coordinated Lubbock Power and Light Integration Impact Analysis ERCOT Public
© 2017 ERCOT
All rights reserved. 17
6. Operational Costs and Reliability Impact Assessment
6.1. Operations
In reviewing the potential operational costs and reliability impacts of integrating LP&L into the ERCOT System, ERCOT identified potential operating costs associated with adding a new 115 kV voltage class into the ERCOT System. The addition of a new voltage class would require updates to ERCOT’s Network Operations Model, Energy Management System (EMS), Macomber Map, and the State Estimator. ERCOT also anticipates the need to add Lubbock telemetry requirements to ensure adequate situational awareness in Real-Time for assessment by the State Estimator. Additional modeling considerations include the addition/establishment of: (i) Resource Nodes for LP&L Generation Resources that will be added into the ERCOT System; (ii) new electrical buses for incorporation into the market Hubs, Load Zones, and other market models, reports, and extracts; and (iii) Load distribution factors for the incorporated LP&L Load. These considerations are typical for the addition of similar equipment added to the ERCOT System during the normal course of business. The addition of the Option 4ow Transmission Facilities would increase the transient and voltage stability in the Panhandle as explained in Section 4.1. These Transmission Facilities would also have a stability benefit during the outage of 345 kV lines in the Panhandle.
6.2. Markets
Should LP&L be incorporated into the ERCOT System and require ERCOT to establish/integrate a new voltage class, additional review of system functionality and binding document language would be necessary to ensure congestion management in ERCOT’s EMS and Market Management System (MMS) (e.g., the maximum shadow price cap for 115 kV equipment will need to be determined).
SPP-ERCOT Coordinated Lubbock Power and Light Integration Impact Analysis ERCOT Public
© 2017 ERCOT
All rights reserved. 18
7. Ancillary Service Impact Assessment
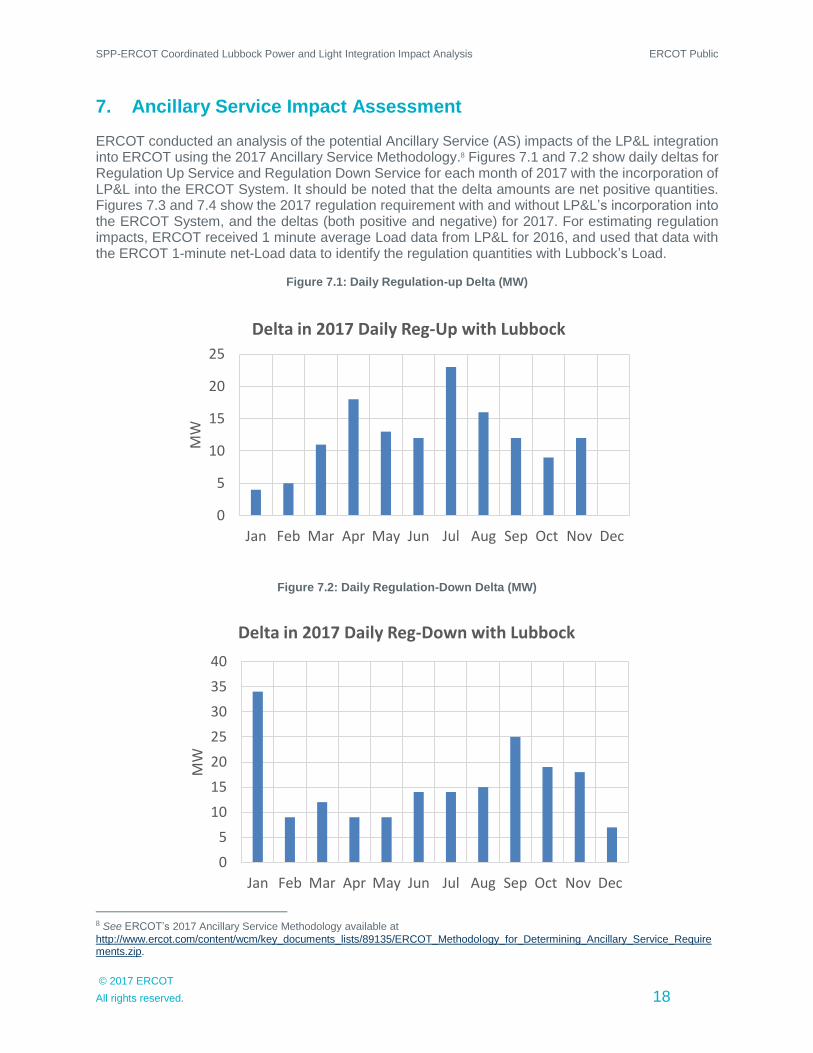
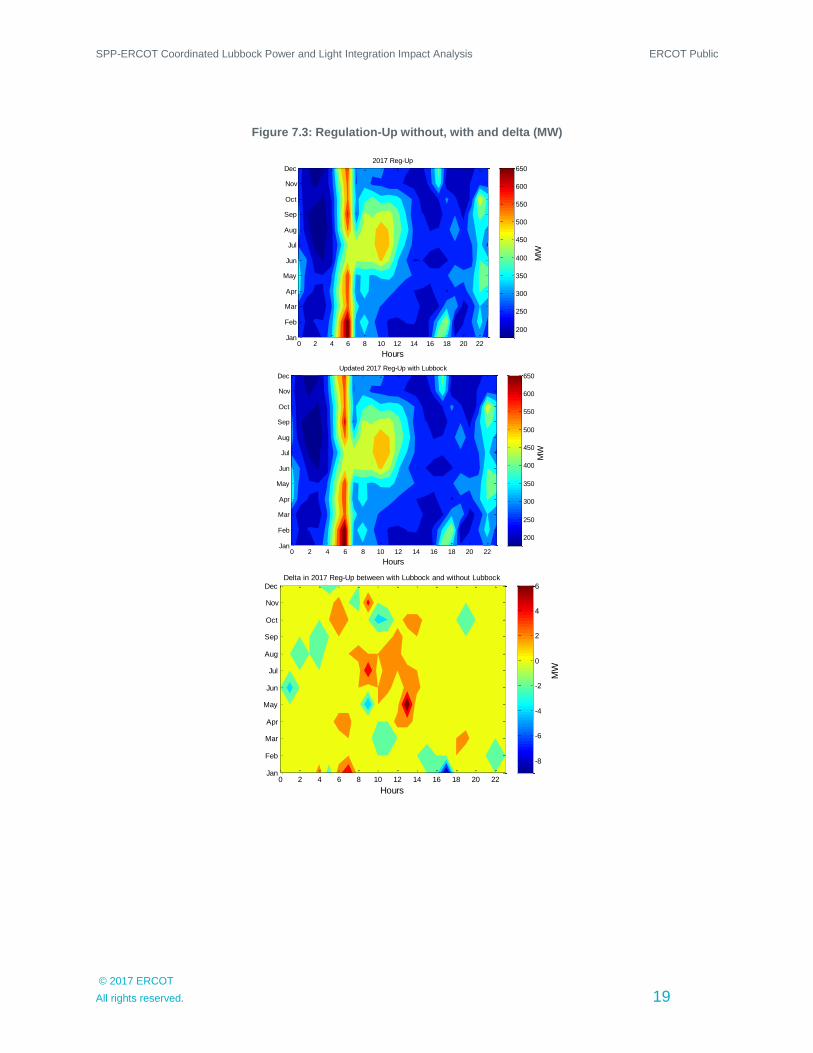
ERCOT conducted an analysis of the potential Ancillary Service (AS) impacts of the LP&L integration into ERCOT using the 2017 Ancillary Service Methodology.8 Figures 7.1 and 7.2 show daily deltas for Regulation Up Service and Regulation Down Service for each month of 2017 with the incorporation of LP&L into the ERCOT System. It should be noted that the delta amounts are net positive quantities. Figures 7.3 and 7.4 show the 2017 regulation requirement with and without LP&L’s incorporation into the ERCOT System, and the deltas (both positive and negative) for 2017. For estimating regulation impacts, ERCOT received 1 minute average Load data from LP&L for 2016, and used that data with the ERCOT 1-minute net-Load data to identify the regulation quantities with Lubbock’s Load.
Figure 7.1: Daily Regulation-up Delta (MW)
Figure 7.2: Daily Regulation-Down Delta (MW)
8 See ERCOT’s 2017 Ancillary Service Methodology available at
http://www.ercot.com/content/wcm/key_documents_lists/89135/ERCOT_Methodology_for_Determining_Ancillary_Service_Requirements.zip.
0
5
10
15
20
25
Jan Feb Mar Apr May Jun Jul Aug Sep Oct Nov Dec
MW
Delta in 2017 Daily Reg-Up with Lubbock
0
5
10
15
20
25
30
35
40
Jan Feb Mar Apr May Jun Jul Aug Sep Oct Nov Dec
MW
Delta in 2017 Daily Reg-Down with Lubbock
SPP-ERCOT Coordinated Lubbock Power and Light Integration Impact Analysis ERCOT Public
© 2017 ERCOT
All rights reserved. 19
Figure 7.3: Regulation-Up without, with and delta (MW)
Hours
MW
2017 Reg-Up
0 2 4 6 8 10 12 14 16 18 20 22Jan
Feb
Mar
Apr
May
Jun
Jul
Aug
Sep
Oct
Nov
Dec
200
250
300
350
400
450
500
550
600
650
Hours
MW
Updated 2017 Reg-Up with Lubbock
0 2 4 6 8 10 12 14 16 18 20 22Jan
Feb
Mar
Apr
May
Jun
Jul
Aug
Sep
Oct
Nov
Dec
200
250
300
350
400
450
500
550
600
650
Hours
MW
Delta in 2017 Reg-Up between with Lubbock and without Lubbock
0 2 4 6 8 10 12 14 16 18 20 22Jan
Feb
Mar
Apr
May
Jun
Jul
Aug
Sep
Oct
Nov
Dec
-8
-6
-4
-2
0
2
4
6
SPP-ERCOT Coordinated Lubbock Power and Light Integration Impact Analysis ERCOT Public
© 2017 ERCOT
All rights reserved. 20
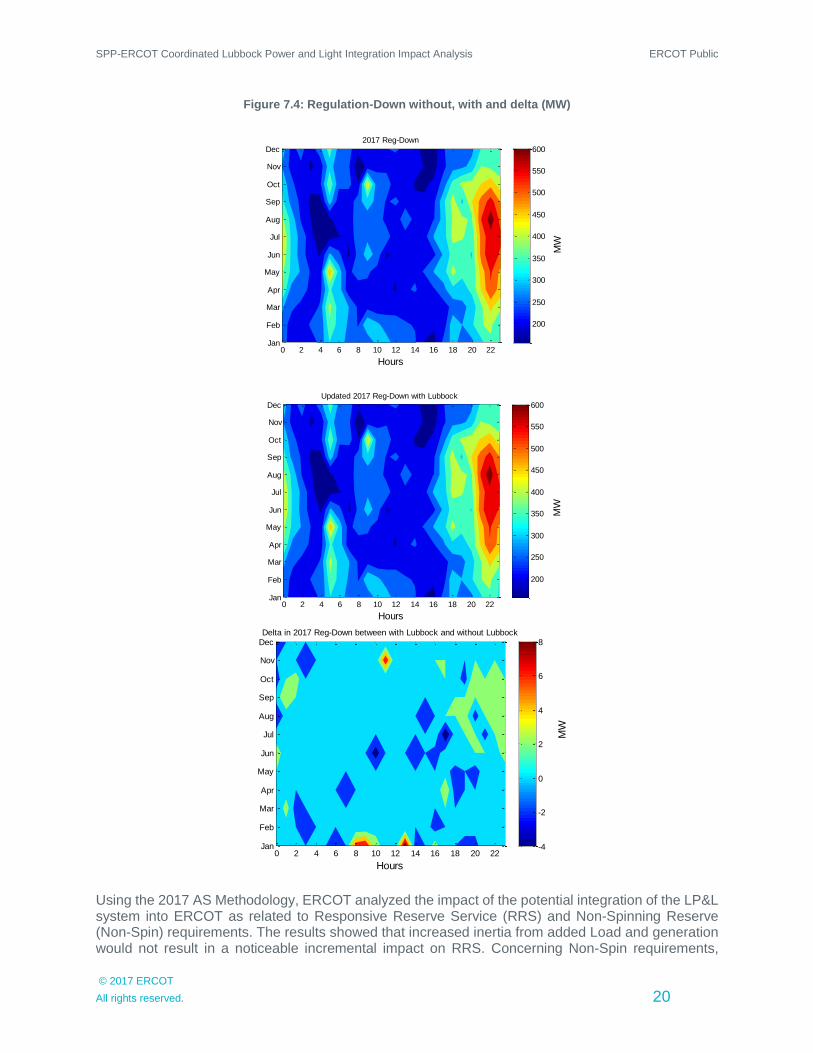
Figure 7.4: Regulation-Down without, with and delta (MW)
Using the 2017 AS Methodology, ERCOT analyzed the impact of the potential integration of the LP&L system into ERCOT as related to Responsive Reserve Service (RRS) and Non-Spinning Reserve (Non-Spin) requirements. The results showed that increased inertia from added Load and generation would not result in a noticeable incremental impact on RRS. Concerning Non-Spin requirements,
Hours
MW
2017 Reg-Down
0 2 4 6 8 10 12 14 16 18 20 22Jan
Feb
Mar
Apr
May
Jun
Jul
Aug
Sep
Oct
Nov
Dec
200
250
300
350
400
450
500
550
600
Hours
MW
Updated 2017 Reg-Down with Lubbock
0 2 4 6 8 10 12 14 16 18 20 22Jan
Feb
Mar
Apr
May
Jun
Jul
Aug
Sep
Oct
Nov
Dec
200
250
300
350
400
450
500
550
600
Hours
MW
Delta in 2017 Reg-Down between with Lubbock and without Lubbock
0 2 4 6 8 10 12 14 16 18 20 22Jan
Feb
Mar
Apr
May
Jun
Jul
Aug
Sep
Oct
Nov
Dec
-4
-2
0
2
4
6
8

SPP-ERCOT Coordinated Lubbock Power and Light Integration Impact Analysis ERCOT Public
© 2017 ERCOT
All rights reserved. 21
LP&L’s integration could lead to less wind generation curtailment in the Panhandle region, which would likely improve wind forecast performance, and potentially decrease Non-Spin requirements. However, the improved capacity factor from wind generation could increase net Load variability, and consequently increase Non-Spin requirements. Although ERCOT is unable to quantify the net effect on Non-Spin requirements, ERCOT would not expect a noticeable increase in Non-Spin requirements. Overall, if LP&L is integrated into the ERCOT System, ERCOT does not anticipate a noticeable increase in either RRS or Non-Spin requirement quantities. Looking at 2016, the simple average prices in the Day Ahead Market (DAM) for AS by type were $3.39/MWh for Non-Spin, $5.69/MWh for Regulation Down, $7.63/MWh for Regulation Up, and $11.13/MWh for RRS. If integrated, LP&L’s Load would pay its share of the AS costs. However, since the LP&L demand is approximately 0.5% of ERCOT demand, the total effect is expected to be negligible.

SPP-ERCOT Coordinated Lubbock Power and Light Integration Impact Analysis ERCOT Public
© 2017 ERCOT
All rights reserved. 22
8. Congestion Rights Impact Assessment
The integration of the LP&L system into ERCOT could cause positive or negative impacts to CRR values, depending on congestion patterns. If a separate Load Zone is not created for LP&L, and LP&L’s Load is absorbed into LZ_WEST, then values for CRRs sourcing or sinking in LZ_WEST will be altered for CRRs previously sold (i.e., before the integration) for future years (i.e., years following integration). A decision regarding the integration of the LP&L system into ERCOT, as well as information regarding the timing of any such integration, in advance of CRR Auctions covering that same time period would allow Market Participants to consider such impacts in the development of their CRR transaction strategies. Although it is likely that a decision to move forward with LP&L’s integration into ERCOT would be made before any affected CRRs would be auctioned (since the farthest CRR auction is 36 months out), a decision to move forward with the construction of the necessary Transmission Facilities would need to be made at least 36 months in advance of the CRR auction to avoid CRR impacts.

SPP-ERCOT Coordinated Lubbock Power and Light Integration Impact Analysis ERCOT Public
© 2017 ERCOT
All rights reserved. 23
9. SSR Impact Analysis
ERCOT conducted a Subsynchronous Resonance (SSR) impact analysis to assess SSR vulnerability impacts for existing and planned ERCOT generation with the integration of the LP&L system into ERCOT. ERCOT examined whether the proposed system change would create any new risks for generation through different transmission paths to series capacitors in the study area, and if it could potentially decrease risks associated therewith.
9.1. Study Cases and Topology Check
To analyze the SSR impact of LP&L’s integration into the ERCOT System, ERCOT evaluated the 2016 RTP 2021 summer peak WFW case and compared it to the same case with Option 4ow added. A topology check was conducted in the evaluation of both cases. The series capacitors used in ERCOT’s study included9:
1) Cross Texas 2) Gauss 3) Kirchoff 4) Kopperl and Romney 5) Edison and Oersted
The other series capacitors (Del Sol, Cenizo, Rio Hondo and North Edinburgh) located in the Lower Rio Grande Valley are electrically far away and unlikely to be affected by the LP&L integration. A Generation Resource is considered to be potentially vulnerable to SSR in the topology check if it becomes radial to a series capacitor(s) in the event of less than or equal to 14 concurrent transmission outages.
9.2. Study Results
Compared to the other series capacitors included in the study, the Cross Texas series capacitors will have a greater SSR impact to generators in Panhandle because they are located within the Panhandle. The integration of LP&L into the ERCOT System would result in an increased number of outages for Panhandle generators to become radial to the Cross Texas series capacitors. The number of outages for some Panhandle generators to become radial to the Edison and Oersted series capacitors would be reduced from N-20 (no LP&L) to N-14 (with LP&L). Since most Panhandle generators are significantly distanced from the Edison and Oersted series capacitors, and have SSR mitigation and/or protection plans in place, ERCOT does not believe that there would be a SSR impact with respect to the Edison and Oersted series capacitors. ERCOT’s topology check did not reveal any new risks, and therefore additional frequency scan analyses were not performed. If the LP&L system is integrated into ERCOT, ERCOT does not expect additional SSR vulnerability concerns, and believes that LP&L’s integration could lead to a decrease in risk of SSR vulnerability for some Panhandle generators.
Please refer to Appendix D for additional detail concerning SSR vulnerability impacts.
9 Note: The other series capacitors (Del Sol, Cenizo, Rio Hondo and North Edinburgh) located in the Lower Rio Grande Valley are
electrically far away and unlikely to be affected by the LP&L integration.

SPP-ERCOT Coordinated Lubbock Power and Light Integration Impact Analysis ERCOT Public
© 2017 ERCOT
All rights reserved. 24
10. Conclusion
In summary, and with respect to the issues presented in former Chairman Nelson’s memo, ERCOT has made the following findings under the assumption that LP&L will be integrated into the ERCOT System:
1. A production cost analysis for ERCOT and SPP.
The annual ERCOT production cost is expected to increase by approximately $74 million in 2020, and $77 million in 2025.
2. An analysis of the impacts on the transmission system that includes an evaluation of
the estimated economic impacts of the proposed integration. For SPP, this should also include evaluation of costs necessary to disconnect a portion of the LP&L system from SPP.
ERCOT’s study is based on the assumption that LP&L will be integrated into the ERCOT System by the summer of 2021 and connected by the transmission configuration Option 4ow. The estimated capital cost for Option 4ow Transmission Facilities is $364 million.
3. Analysis of avoided projects or new projects as a result of moving the LP&L Load to ERCOT and the estimated costs of those projects.
ERCOT’s analysis indicated that no planned system improvement projects in the 2016 RTP or 2016 LTSA (current trends scenario) could be avoided or deferred by integrating LP&L into ERCOT, nor would any additional ERCOT System improvement projects be needed - beyond the Option 4ow Transmission Facilities - to integrate LP&L into the ERCOT System. Additionally, ERCOT does not recommend converting the LP&L Coke Units 1 and 2 to Synchronous Condenser Units.
4. An evaluation of the impacts on operations, both from a cost and reliability perspective,
on the ERCOT and SPP systems.
Evaluation of impacts related to ERCOT operations revealed that there are no existing 115 kV Transmission Facilities in ERCOT, and therefore, no 115 kV voltage class systems/designations/models are currently available for use by ERCOT Operations staff. Adding the 115 kV voltage class to ERCOT will have a minor impact since it will require adding this new voltage class to ERCOT’s existing tools. It will also require further review of system functionality and the addition of binding document language to ensure proper coverage. In addition, ERCOT found that the addition of Option 4ow Transmission Facilities would increase the transient and voltage stability in the Panhandle. These Transmission Facilities would also have a stability benefit during the outage of 345 kV lines in the Panhandle.
5. An evaluation of the impacts on Ancillary Services, both from a cost and reliability perspective.
ERCOT expects minimal Ancillary Service impacts, both from a cost and reliability perspective.

SPP-ERCOT Coordinated Lubbock Power and Light Integration Impact Analysis ERCOT Public
© 2017 ERCOT
All rights reserved. 25
6. An evaluation of the impacts on congestion rights.
Impacts on CRRs will depend on congestion patterns. Although it is likely that a decision to move forward with LP&L’s integration into ERCOT would be made before any affected CRRs would be auctioned (since the farthest CRR auction is 36 months out), a decision to move forward with the construction of the necessary Transmission Facilities would need to be made at least 36 months in advance of the CRR auction to avoid CRR impacts.
7. An evaluation of the cost and reliability impacts on all customer classes in ERCOT and
SPP.
ERCOT is not able to provide a complete evaluation of the cost and reliability impacts on all customer classes in ERCOT. Nevertheless, in an effort to provide some insight into potential customer impacts, production cost analyses were performed to compare LMP values with and without LP&L integrated into ERCOT. Production cost studies showed that annual load weighted average LMPs can be expected to increase slightly with the integration of the LP&L. While ERCOT production cost can be expected to increase by $74 million to $77 million annually, load paying customers within the LP&L footprint can be expected to contribute between $75 and $99 million annually to offset ERCOT production cost increases.
8. Any other potential reliability impacts on both the ERCOT and SPP systems.
ERCOT performed steady-state, dynamic and SSR system reliability studies to determine potential reliability impacts on the ERCOT System in the event of LP&L’s integration. The studies did not reveal any impacts that would give rise to the need for additional transmission improvement project recommendations other than Option 4ow.
9. A study of subsynchronous resonance impacts and any attendant cost implications,
including potential cost savings.
ERCOT’s analysis of SSR impacts did not reveal any SSR vulnerability concerns. In addition, ERCOT believes that LP&L’s integration could decrease the risk of SSR for some Panhandle generators. Cost savings could not be evaluated at this time.
10. An evaluation of power flow and system contingency for both the ERCOT and SPP
systems.
ERCOT performed steady-state power flow studies and evaluated system contingencies. None of these studies revealed ERCOT System reliability performance impacts that would warrant transmission improvement project recommendations needed in addition to Option 4ow to integrate LP&L into ERCOT.
11. An evaluation of LP&L's proposal to use some of its existing generation as
synchronous condensers.
ERCOT evaluated LP&L’s proposal to use some of its existing generation as Synchronous Condenser Units in ERCOT. Specifically, LP&L has provided a preliminary cost estimate of $6.5 million per unit to reactivate two units (i.e., Coke Units 1 and 2) and convert them to Synchronous Condenser Units, for a total of $13 million. ERCOT has made a preliminary determination that the installation of one 175 MVar

SPP-ERCOT Coordinated Lubbock Power and Light Integration Impact Analysis ERCOT Public
© 2017 ERCOT
All rights reserved. 26
Synchronous Condenser Unit at Windmill would be more cost effective than converting the two retired Coke units (please see detailed analysis in Section 4.2). Therefore, ERCOT does not recommend the conversion of the LP&L Coke units into Synchronous Condenser Units.
12. An evaluation of LP&L's ability to ensure that comingling of the SPP and ERCOT
systems will not occur.
ERCOT believes that LP&L is better situated to address this issue.
SPP-ERCOT Coordinated Lubbock Power and Light Integration Impact Analysis ERCOT Public
© 2017 ERCOT
All rights reserved. 27
APPENDIX A
SPP-ERCOT Coordinated Lubbock ERCOT Integration Study Scope document filed with the PUCT on February 2, 2017.
Filed_with_PUC_456
33_44_927906.pdf
APPENDIX B
LMP impacts for all substations in the ERCOT region.
Average LMP on
each bus in ERCOT for 2020 and 2025.xlsx
APPENDIX C
2016_RTP_Scope_Pr
ocess_v1.3_clean.pdf
SPP-ERCOT Coordinated Lubbock Power and Light Integration Impact Analysis ERCOT Public
© 2017 ERCOT
All rights reserved. 28
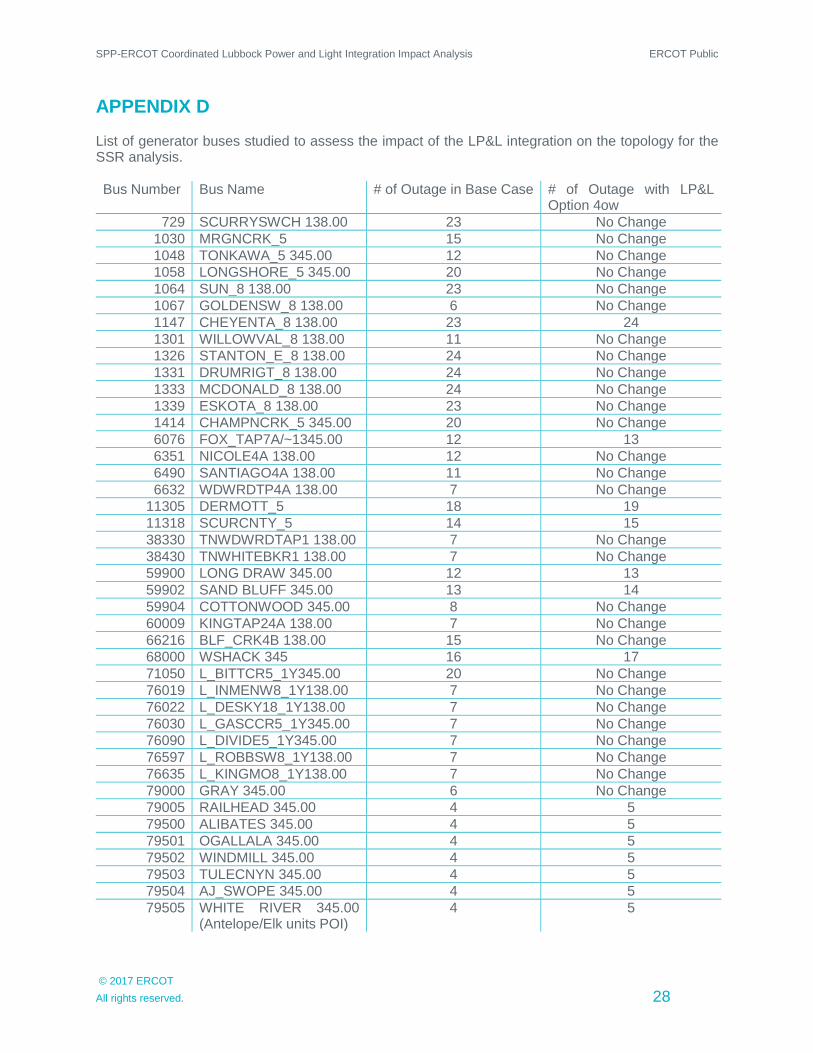
APPENDIX D
List of generator buses studied to assess the impact of the LP&L integration on the topology for the SSR analysis. Bus Number Bus Name # of Outage in Base Case # of Outage with LP&L
Option 4ow
729 SCURRYSWCH 138.00 23 No Change
1030 MRGNCRK_5 15 No Change
1048 TONKAWA_5 345.00 12 No Change
1058 LONGSHORE_5 345.00 20 No Change
1064 SUN_8 138.00 23 No Change
1067 GOLDENSW_8 138.00 6 No Change
1147 CHEYENTA_8 138.00 23 24
1301 WILLOWVAL_8 138.00 11 No Change
1326 STANTON_E_8 138.00 24 No Change
1331 DRUMRIGT_8 138.00 24 No Change
1333 MCDONALD_8 138.00 24 No Change
1339 ESKOTA_8 138.00 23 No Change
1414 CHAMPNCRK_5 345.00 20 No Change
6076 FOX_TAP7A/~1345.00 12 13
6351 NICOLE4A 138.00 12 No Change
6490 SANTIAGO4A 138.00 11 No Change
6632 WDWRDTP4A 138.00 7 No Change
11305 DERMOTT_5 18 19
11318 SCURCNTY_5 14 15
38330 TNWDWRDTAP1 138.00 7 No Change
38430 TNWHITEBKR1 138.00 7 No Change
59900 LONG DRAW 345.00 12 13
59902 SAND BLUFF 345.00 13 14
59904 COTTONWOOD 345.00 8 No Change
60009 KINGTAP24A 138.00 7 No Change
66216 BLF_CRK4B 138.00 15 No Change
68000 WSHACK 345 16 17
71050 L_BITTCR5_1Y345.00 20 No Change
76019 L_INMENW8_1Y138.00 7 No Change
76022 L_DESKY18_1Y138.00 7 No Change
76030 L_GASCCR5_1Y345.00 7 No Change
76090 L_DIVIDE5_1Y345.00 7 No Change
76597 L_ROBBSW8_1Y138.00 7 No Change
76635 L_KINGMO8_1Y138.00 7 No Change
79000 GRAY 345.00 6 No Change
79005 RAILHEAD 345.00 4 5
79500 ALIBATES 345.00 4 5
79501 OGALLALA 345.00 4 5
79502 WINDMILL 345.00 4 5
79503 TULECNYN 345.00 4 5
79504 AJ_SWOPE 345.00 4 5
79505 WHITE RIVER 345.00 (Antelope/Elk units POI)
4 5