spiva u.s. scorecard · beyond the spiva scorecard’s widely cited headline numbers is a rich data...
TRANSCRIPT
RESEARCH
CONTRIBUTOR
Aye M. Soe, CFA Senior Director Global Research & Design [email protected]
SPIVA® U.S. Scorecard SUMMARY
• The U.S. equity market ended 2015 on a rather flat note amid plunging oil prices, a strengthening U.S. dollar, and the devaluation of the Chinese renminbi, all of which contributed to market volatility. As of Dec, 31, 2015, the S&P Composite 1500® returned 1.01% while the S&P 500® posted 1.38% on a total return basis.
• During the same period, 66.11% of large-cap managers, 56.81% of mid-cap managers, and 72.2% of small-cap managers underperformed the S&P 500, the S&P MidCap 400®, and the S&P SmallCap 600®, respectively.
• The figures are equally unfavorable when viewed over longer-term investment horizons. Over the five-year period, 84.15% of large-cap managers, 76.69% of mid-cap managers, and 90.13% of small-cap managers lagged their respective benchmarks.
• Similarly, over the 10-year investment horizon, 82.14% of large-cap managers, 87.61% of mid-cap managers, and 88.42% of small-cap managers failed to outperform on a relative basis.
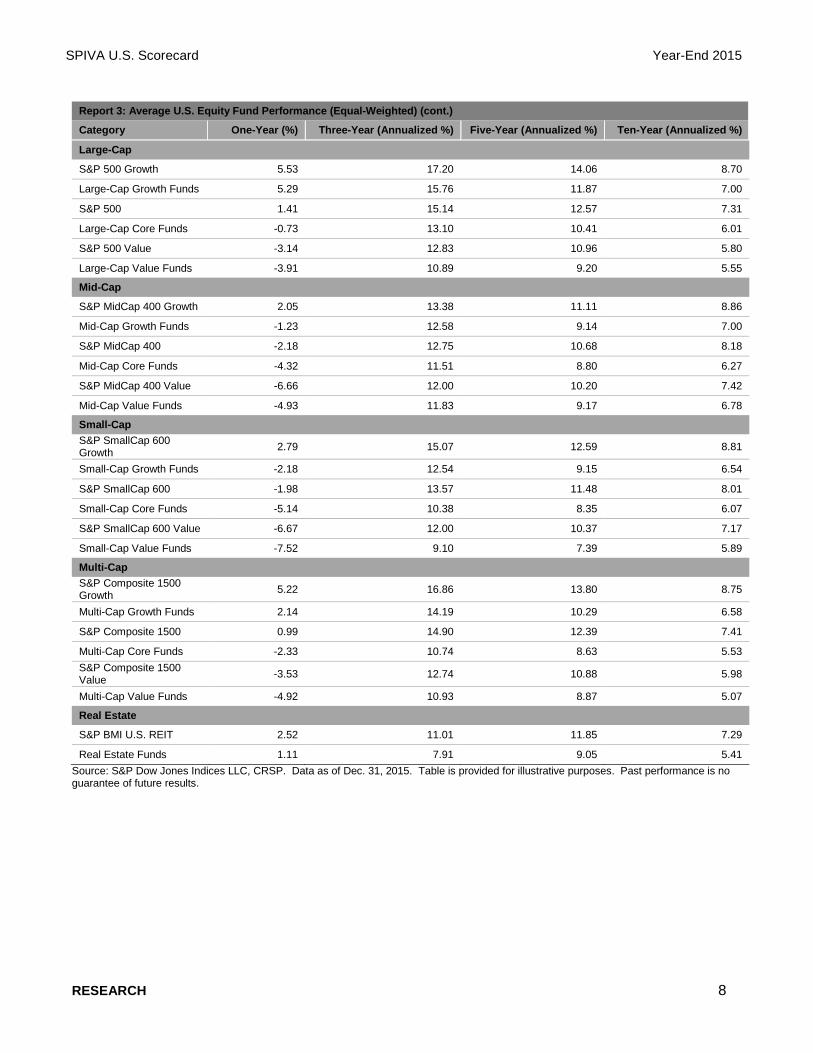
• Over the past 12-month period, market conditions have been highly favorable for growth-style investing, with growth indices across market-cap ranges returning higher than the value indices. During the same period, the majority of actively managed value funds in the mid- and small-cap categories fared better than their benchmarks. The opposite can be seen with the growth funds, which underperformed their benchmarks.
• The headline international equity and emerging market equity indices posted negative returns in the second half of 2015, driven largely by increasing concerns over economic slowdown in China. For the one-year period, international small-cap equity was the only category that posted positive returns.
• During the same period, the majority of actively managed funds invested in international developed and emerging markets outperformed their respective benchmarks.
• Over the 10-year investment horizon, however, managers across all international equity categories underperformed their benchmarks.
• The U.S. Federal Reserve raised the target federal funds rate by 0.25% in December 2015, its first increase in nearly a decade. Results show that over the past 12-month period, funds invested in short-term and intermediate government and investment-grade corporate bonds significantly underperformed on a relative basis.
SPIVA U.S. Scorecard Year-End 2015
RESEARCH 2
• On the other hand, the majority of actively managed funds invested in long-dated government and credit categories outperformed their respective benchmarks over the 12-month period, marking a sharp reversal of fortunes from six months prior.
• The collapse of the energy market had repercussions for the junk bond market, with all headline high-yield indices posting negative returns. During the period of volatility, approximately two-thirds of actively managed high-yield funds delivered higher returns than the benchmark.
• The high-yield bond market is often considered to be best accessed via active investing, as passive vehicles have structural constraints that limit their flexibility and ability to deal with credit risk. Nevertheless, the 10-year results for the actively managed high-yield funds category show that over 90% of funds underperformed the broad-based benchmark.
• Weakness in the high-yield bond market extended into the leveraged loan space. The S&P/LSTA U.S. Leveraged Loan 100 Index posted -2.75% for the year. Actively managed senior loan funds fared favorably over the past 12 months, with just over 13% of funds underperforming the benchmark. Similarly, over the five-year investment horizon, only 42% of the funds lagged the benchmark.
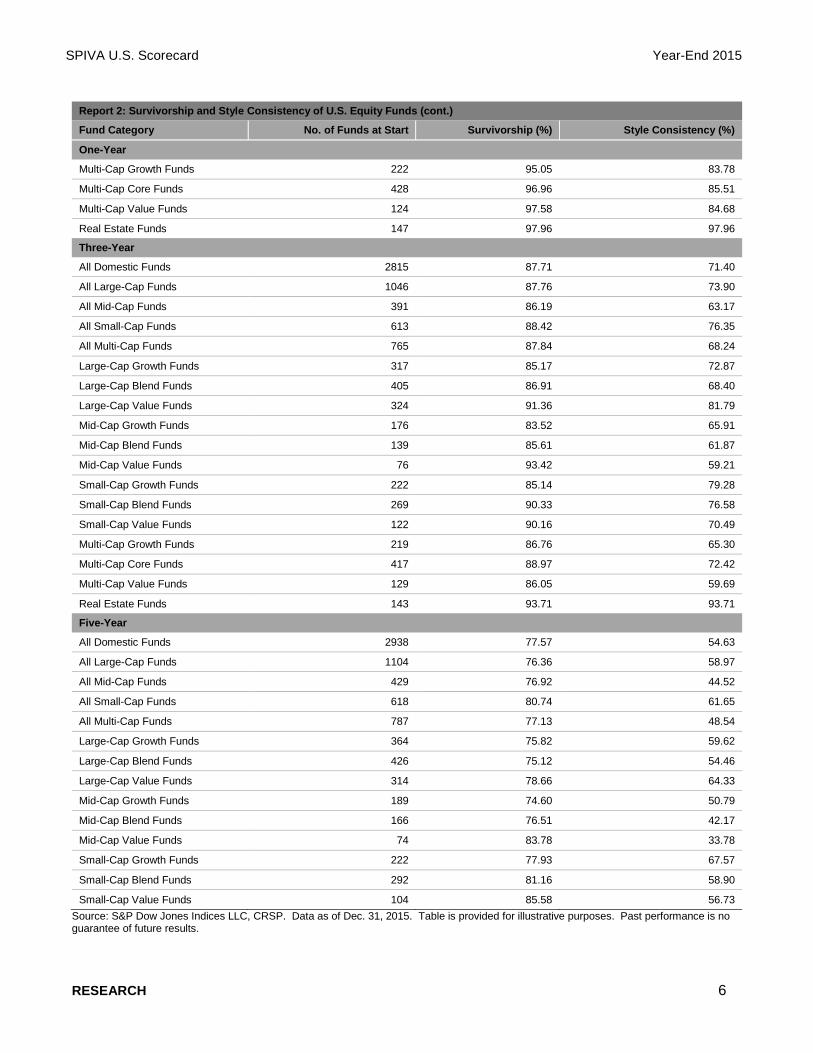
• Funds disappear at a meaningful rate. Over the past five-year period, nearly 23% of domestic equity funds, 22% of global/international equity funds, and 17% of fixed income funds have been merged or liquidated. This finding highlights the importance of addressing survivorship bias in mutual fund analysis.
SPIVA U.S. Scorecard Year-End 2015
RESEARCH 3
A UNIQUE SCORECARD FOR THE ACTIVE VERSUS PASSIVE DEBATE
There is nothing novel about the index versus active debate. It has been a contentious subject for decades, and there are few strong believers on both sides, with the vast majority of investors falling somewhere in between. Since its first publication 14 years ago, the SPIVA Scorecard has served as the de facto scorekeeper of the active versus passive debate. For more than a decade, we have heard passionate arguments from believers in both camps when headline numbers have deviated from their beliefs.
Beyond the SPIVA Scorecard’s widely cited headline numbers is a rich data set that addresses issues related to measurement techniques, universe composition, and fund survivorship that are far less frequently discussed, but are often far more fascinating. These data sets are rooted in the following fundamental principles of the SPIVA Scorecard, with which regular readers will be familiar.
• Survivorship Bias Correction: Many funds might be liquidated or merged during a period of study. However, for someone making an investment decision at the beginning of the period, these funds are part of the opportunity set. Unlike other commonly available comparison reports, SPIVA Scorecards account for the entire opportunity set—not just the survivors—thereby eliminating survivorship bias.
• Apples-to-Apples Comparison: Fund returns are often compared to popular benchmarks such as the S&P 500, regardless of size or style classification. SPIVA Scorecards avoid this pitfall by measuring a fund's returns against the returns of a benchmark appropriate for that particular investment category.
• Asset-Weighted Returns: Average returns for a fund group are often calculated using only equal weighting, which results in the returns of a USD 10 billion fund affecting the average in the same manner as the returns of a USD 10 million fund. An accurate representation of how investors fared in a particular period can be ascertained by calculating weighted average returns where each fund’s return is weighted by net assets. SPIVA Scorecards show both equal- and asset-weighted averages.
• Style Consistency: SPIVA Scorecards measure style consistency for each style category across different time horizons. Style consistency is an important metric because style drift (the tendency of funds to diverge from their initial investment categorization) can have an impact on asset allocation decisions.
• Data Cleaning: SPIVA Scorecards avoid double counting multiple share classes in all count-based calculations, using only the share class with greater assets. Since this is meant to be a scorecard for active managers, index funds, leveraged and inverse funds, and other index-linked products are excluded.
SPIVA U.S. Scorecard Year-End 2015
RESEARCH 4
ANNUAL LEAGUE TABLE
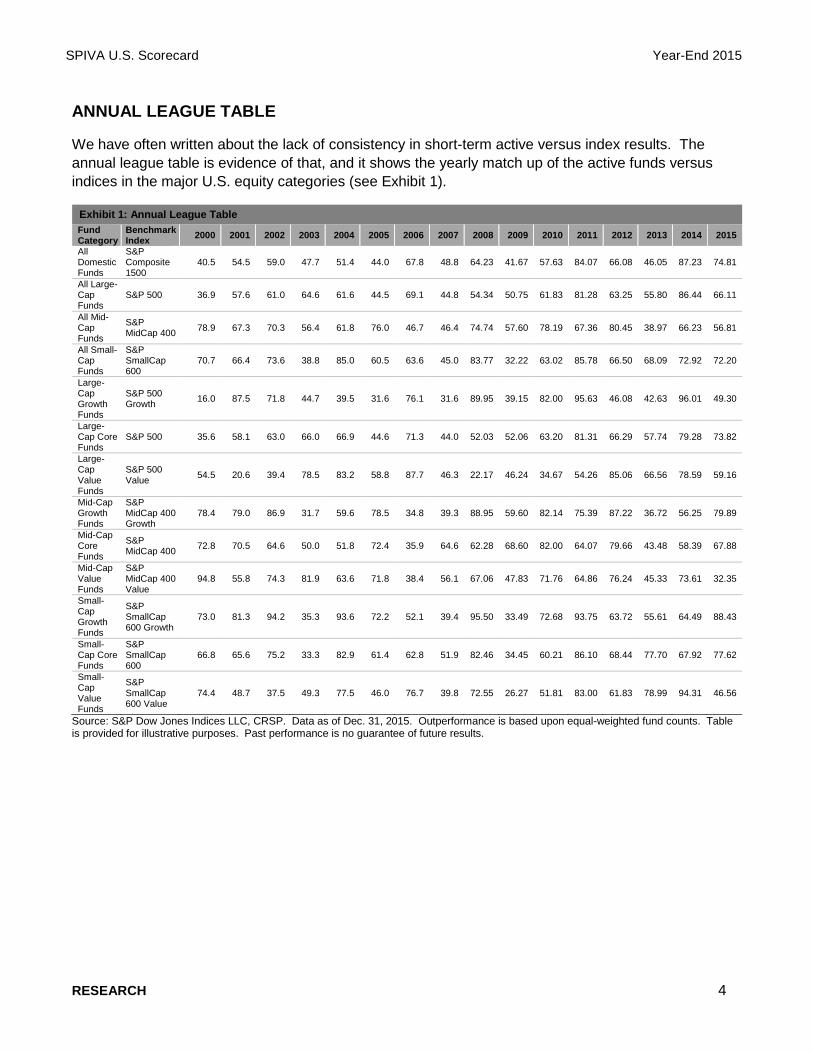
We have often written about the lack of consistency in short-term active versus index results. The annual league table is evidence of that, and it shows the yearly match up of the active funds versus indices in the major U.S. equity categories (see Exhibit 1).
Exhibit 1: Annual League Table Fund Category
Benchmark Index 2000 2001 2002 2003 2004 2005 2006 2007 2008 2009 2010 2011 2012 2013 2014 2015
All Domestic Funds
S&P Composite 1500
40.5 54.5 59.0 47.7 51.4 44.0 67.8 48.8 64.23 41.67 57.63 84.07 66.08 46.05 87.23 74.81
All Large-Cap Funds
S&P 500 36.9 57.6 61.0 64.6 61.6 44.5 69.1 44.8 54.34 50.75 61.83 81.28 63.25 55.80 86.44 66.11
All Mid-Cap Funds
S&P MidCap 400 78.9 67.3 70.3 56.4 61.8 76.0 46.7 46.4 74.74 57.60 78.19 67.36 80.45 38.97 66.23 56.81
All Small-Cap Funds
S&P SmallCap 600
70.7 66.4 73.6 38.8 85.0 60.5 63.6 45.0 83.77 32.22 63.02 85.78 66.50 68.09 72.92 72.20
Large-Cap Growth Funds
S&P 500 Growth 16.0 87.5 71.8 44.7 39.5 31.6 76.1 31.6 89.95 39.15 82.00 95.63 46.08 42.63 96.01 49.30
Large-Cap Core Funds
S&P 500 35.6 58.1 63.0 66.0 66.9 44.6 71.3 44.0 52.03 52.06 63.20 81.31 66.29 57.74 79.28 73.82
Large-Cap Value Funds
S&P 500 Value 54.5 20.6 39.4 78.5 83.2 58.8 87.7 46.3 22.17 46.24 34.67 54.26 85.06 66.56 78.59 59.16
Mid-Cap Growth Funds
S&P MidCap 400 Growth
78.4 79.0 86.9 31.7 59.6 78.5 34.8 39.3 88.95 59.60 82.14 75.39 87.22 36.72 56.25 79.89
Mid-Cap Core Funds
S&P MidCap 400 72.8 70.5 64.6 50.0 51.8 72.4 35.9 64.6 62.28 68.60 82.00 64.07 79.66 43.48 58.39 67.88
Mid-Cap Value Funds
S&P MidCap 400 Value
94.8 55.8 74.3 81.9 63.6 71.8 38.4 56.1 67.06 47.83 71.76 64.86 76.24 45.33 73.61 32.35
Small-Cap Growth Funds
S&P SmallCap 600 Growth
73.0 81.3 94.2 35.3 93.6 72.2 52.1 39.4 95.50 33.49 72.68 93.75 63.72 55.61 64.49 88.43
Small-Cap Core Funds
S&P SmallCap 600
66.8 65.6 75.2 33.3 82.9 61.4 62.8 51.9 82.46 34.45 60.21 86.10 68.44 77.70 67.92 77.62
Small-Cap Value Funds
S&P SmallCap 600 Value
74.4 48.7 37.5 49.3 77.5 46.0 76.7 39.8 72.55 26.27 51.81 83.00 61.83 78.99 94.31 46.56
Source: S&P Dow Jones Indices LLC, CRSP. Data as of Dec. 31, 2015. Outperformance is based upon equal-weighted fund counts. Table is provided for illustrative purposes. Past performance is no guarantee of future results.
SPIVA U.S. Scorecard Year-End 2015
RESEARCH 5
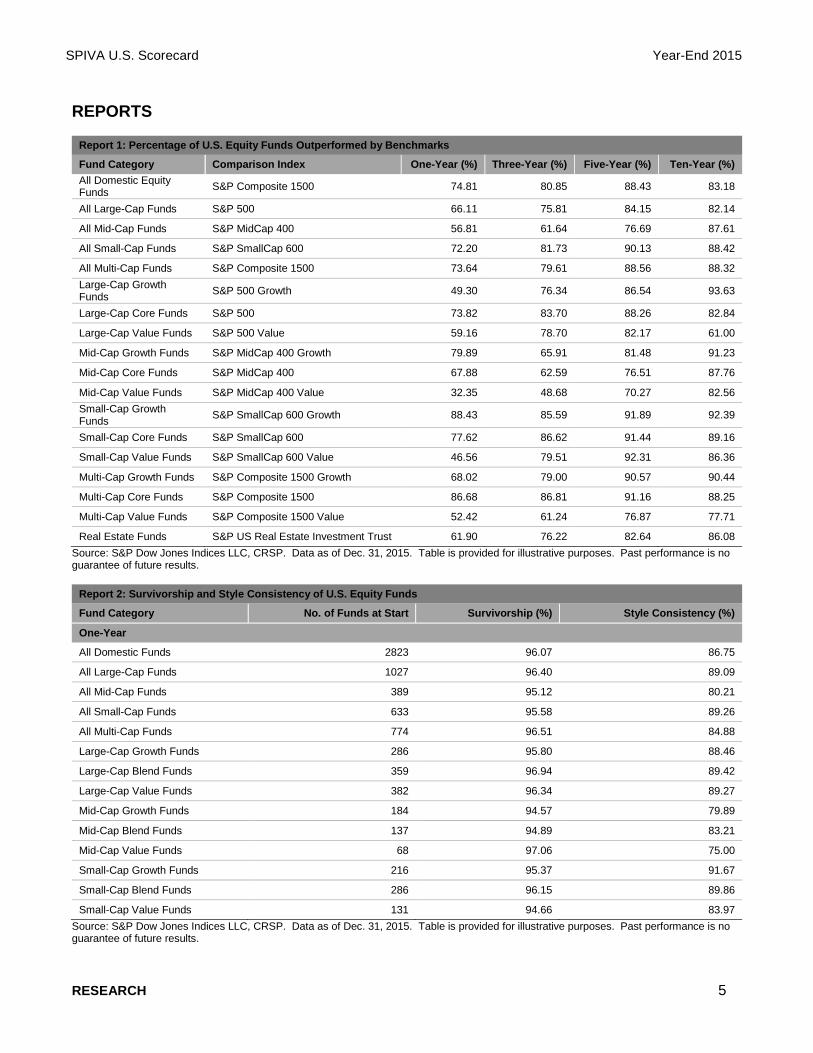
REPORTS
Report 1: Percentage of U.S. Equity Funds Outperformed by Benchmarks
Fund Category Comparison Index One-Year (%) Three-Year (%) Five-Year (%) Ten-Year (%) All Domestic Equity Funds S&P Composite 1500 74.81 80.85 88.43 83.18
All Large-Cap Funds S&P 500 66.11 75.81 84.15 82.14
All Mid-Cap Funds S&P MidCap 400 56.81 61.64 76.69 87.61
All Small-Cap Funds S&P SmallCap 600 72.20 81.73 90.13 88.42
All Multi-Cap Funds S&P Composite 1500 73.64 79.61 88.56 88.32 Large-Cap Growth Funds S&P 500 Growth 49.30 76.34 86.54 93.63
Large-Cap Core Funds S&P 500 73.82 83.70 88.26 82.84
Large-Cap Value Funds S&P 500 Value 59.16 78.70 82.17 61.00
Mid-Cap Growth Funds S&P MidCap 400 Growth 79.89 65.91 81.48 91.23
Mid-Cap Core Funds S&P MidCap 400 67.88 62.59 76.51 87.76
Mid-Cap Value Funds S&P MidCap 400 Value 32.35 48.68 70.27 82.56 Small-Cap Growth Funds S&P SmallCap 600 Growth 88.43 85.59 91.89 92.39
Small-Cap Core Funds S&P SmallCap 600 77.62 86.62 91.44 89.16
Small-Cap Value Funds S&P SmallCap 600 Value 46.56 79.51 92.31 86.36
Multi-Cap Growth Funds S&P Composite 1500 Growth 68.02 79.00 90.57 90.44
Multi-Cap Core Funds S&P Composite 1500 86.68 86.81 91.16 88.25
Multi-Cap Value Funds S&P Composite 1500 Value 52.42 61.24 76.87 77.71
Real Estate Funds S&P US Real Estate Investment Trust 61.90 76.22 82.64 86.08 Source: S&P Dow Jones Indices LLC, CRSP. Data as of Dec. 31, 2015. Table is provided for illustrative purposes. Past performance is no guarantee of future results.
Report 2: Survivorship and Style Consistency of U.S. Equity Funds
Fund Category No. of Funds at Start Survivorship (%) Style Consistency (%)
One-Year
All Domestic Funds 2823 96.07 86.75
All Large-Cap Funds 1027 96.40 89.09
All Mid-Cap Funds 389 95.12 80.21
All Small-Cap Funds 633 95.58 89.26
All Multi-Cap Funds 774 96.51 84.88
Large-Cap Growth Funds 286 95.80 88.46
Large-Cap Blend Funds 359 96.94 89.42
Large-Cap Value Funds 382 96.34 89.27
Mid-Cap Growth Funds 184 94.57 79.89
Mid-Cap Blend Funds 137 94.89 83.21
Mid-Cap Value Funds 68 97.06 75.00
Small-Cap Growth Funds 216 95.37 91.67
Small-Cap Blend Funds 286 96.15 89.86
Small-Cap Value Funds 131 94.66 83.97 Source: S&P Dow Jones Indices LLC, CRSP. Data as of Dec. 31, 2015. Table is provided for illustrative purposes. Past performance is no guarantee of future results.
SPIVA U.S. Scorecard Year-End 2015
RESEARCH 6
Report 2: Survivorship and Style Consistency of U.S. Equity Funds (cont.)
Fund Category No. of Funds at Start Survivorship (%) Style Consistency (%)
One-Year
Multi-Cap Growth Funds 222 95.05 83.78
Multi-Cap Core Funds 428 96.96 85.51
Multi-Cap Value Funds 124 97.58 84.68
Real Estate Funds 147 97.96 97.96
Three-Year
All Domestic Funds 2815 87.71 71.40
All Large-Cap Funds 1046 87.76 73.90
All Mid-Cap Funds 391 86.19 63.17
All Small-Cap Funds 613 88.42 76.35
All Multi-Cap Funds 765 87.84 68.24
Large-Cap Growth Funds 317 85.17 72.87
Large-Cap Blend Funds 405 86.91 68.40
Large-Cap Value Funds 324 91.36 81.79
Mid-Cap Growth Funds 176 83.52 65.91
Mid-Cap Blend Funds 139 85.61 61.87
Mid-Cap Value Funds 76 93.42 59.21
Small-Cap Growth Funds 222 85.14 79.28
Small-Cap Blend Funds 269 90.33 76.58
Small-Cap Value Funds 122 90.16 70.49
Multi-Cap Growth Funds 219 86.76 65.30
Multi-Cap Core Funds 417 88.97 72.42
Multi-Cap Value Funds 129 86.05 59.69
Real Estate Funds 143 93.71 93.71
Five-Year
All Domestic Funds 2938 77.57 54.63
All Large-Cap Funds 1104 76.36 58.97
All Mid-Cap Funds 429 76.92 44.52
All Small-Cap Funds 618 80.74 61.65
All Multi-Cap Funds 787 77.13 48.54
Large-Cap Growth Funds 364 75.82 59.62
Large-Cap Blend Funds 426 75.12 54.46
Large-Cap Value Funds 314 78.66 64.33
Mid-Cap Growth Funds 189 74.60 50.79
Mid-Cap Blend Funds 166 76.51 42.17
Mid-Cap Value Funds 74 83.78 33.78
Small-Cap Growth Funds 222 77.93 67.57
Small-Cap Blend Funds 292 81.16 58.90
Small-Cap Value Funds 104 85.58 56.73 Source: S&P Dow Jones Indices LLC, CRSP. Data as of Dec. 31, 2015. Table is provided for illustrative purposes. Past performance is no guarantee of future results.
SPIVA U.S. Scorecard Year-End 2015
RESEARCH 7
Report 2: Survivorship and Style Consistency of U.S. Equity Funds (cont.)
Fund Category No. of Funds at Start Survivorship (%) Style Consistency (%)
Five-Year
Multi-Cap Growth Funds 212 75.94 47.17
Multi-Cap Core Funds 441 78.91 53.29
Multi-Cap Value Funds 134 73.13 35.07
Real Estate Funds 144 87.50 87.50
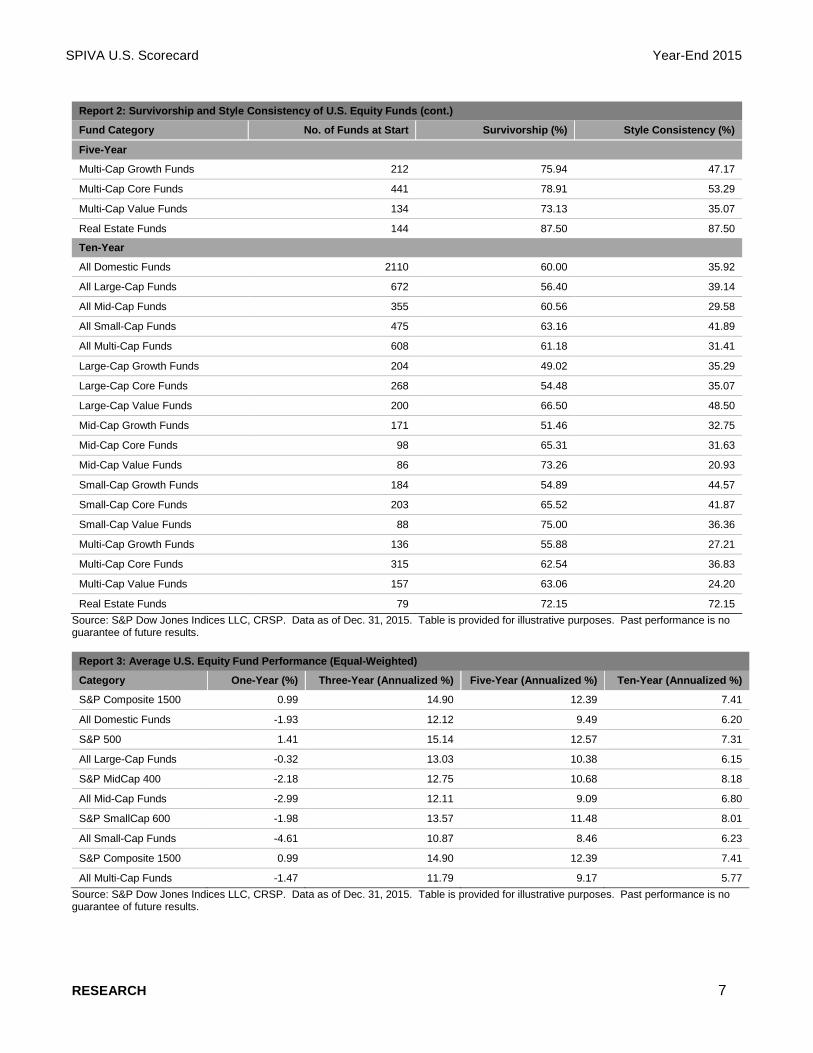
Ten-Year All Domestic Funds 2110 60.00 35.92
All Large-Cap Funds 672 56.40 39.14
All Mid-Cap Funds 355 60.56 29.58
All Small-Cap Funds 475 63.16 41.89
All Multi-Cap Funds 608 61.18 31.41
Large-Cap Growth Funds 204 49.02 35.29
Large-Cap Core Funds 268 54.48 35.07
Large-Cap Value Funds 200 66.50 48.50
Mid-Cap Growth Funds 171 51.46 32.75
Mid-Cap Core Funds 98 65.31 31.63
Mid-Cap Value Funds 86 73.26 20.93
Small-Cap Growth Funds 184 54.89 44.57
Small-Cap Core Funds 203 65.52 41.87
Small-Cap Value Funds 88 75.00 36.36
Multi-Cap Growth Funds 136 55.88 27.21
Multi-Cap Core Funds 315 62.54 36.83
Multi-Cap Value Funds 157 63.06 24.20
Real Estate Funds 79 72.15 72.15 Source: S&P Dow Jones Indices LLC, CRSP. Data as of Dec. 31, 2015. Table is provided for illustrative purposes. Past performance is no guarantee of future results.
Report 3: Average U.S. Equity Fund Performance (Equal-Weighted)
Category One-Year (%) Three-Year (Annualized %) Five-Year (Annualized %) Ten-Year (Annualized %)
S&P Composite 1500 0.99 14.90 12.39 7.41
All Domestic Funds -1.93 12.12 9.49 6.20
S&P 500 1.41 15.14 12.57 7.31
All Large-Cap Funds -0.32 13.03 10.38 6.15
S&P MidCap 400 -2.18 12.75 10.68 8.18
All Mid-Cap Funds -2.99 12.11 9.09 6.80
S&P SmallCap 600 -1.98 13.57 11.48 8.01
All Small-Cap Funds -4.61 10.87 8.46 6.23
S&P Composite 1500 0.99 14.90 12.39 7.41
All Multi-Cap Funds -1.47 11.79 9.17 5.77 Source: S&P Dow Jones Indices LLC, CRSP. Data as of Dec. 31, 2015. Table is provided for illustrative purposes. Past performance is no guarantee of future results.
SPIVA U.S. Scorecard Year-End 2015
RESEARCH 8
Report 3: Average U.S. Equity Fund Performance (Equal-Weighted) (cont.)
Category One-Year (%) Three-Year (Annualized %) Five-Year (Annualized %) Ten-Year (Annualized %)
Large-Cap
S&P 500 Growth 5.53 17.20 14.06 8.70
Large-Cap Growth Funds 5.29 15.76 11.87 7.00
S&P 500 1.41 15.14 12.57 7.31
Large-Cap Core Funds -0.73 13.10 10.41 6.01
S&P 500 Value -3.14 12.83 10.96 5.80
Large-Cap Value Funds -3.91 10.89 9.20 5.55
Mid-Cap
S&P MidCap 400 Growth 2.05 13.38 11.11 8.86
Mid-Cap Growth Funds -1.23 12.58 9.14 7.00
S&P MidCap 400 -2.18 12.75 10.68 8.18
Mid-Cap Core Funds -4.32 11.51 8.80 6.27
S&P MidCap 400 Value -6.66 12.00 10.20 7.42
Mid-Cap Value Funds -4.93 11.83 9.17 6.78
Small-Cap S&P SmallCap 600 Growth 2.79 15.07 12.59 8.81
Small-Cap Growth Funds -2.18 12.54 9.15 6.54
S&P SmallCap 600 -1.98 13.57 11.48 8.01
Small-Cap Core Funds -5.14 10.38 8.35 6.07
S&P SmallCap 600 Value -6.67 12.00 10.37 7.17
Small-Cap Value Funds -7.52 9.10 7.39 5.89
Multi-Cap S&P Composite 1500 Growth 5.22 16.86 13.80 8.75
Multi-Cap Growth Funds 2.14 14.19 10.29 6.58
S&P Composite 1500 0.99 14.90 12.39 7.41
Multi-Cap Core Funds -2.33 10.74 8.63 5.53 S&P Composite 1500 Value -3.53 12.74 10.88 5.98
Multi-Cap Value Funds -4.92 10.93 8.87 5.07
Real Estate
S&P BMI U.S. REIT 2.52 11.01 11.85 7.29
Real Estate Funds 1.11 7.91 9.05 5.41 Source: S&P Dow Jones Indices LLC, CRSP. Data as of Dec. 31, 2015. Table is provided for illustrative purposes. Past performance is no guarantee of future results.
SPIVA U.S. Scorecard Year-End 2015
RESEARCH 9
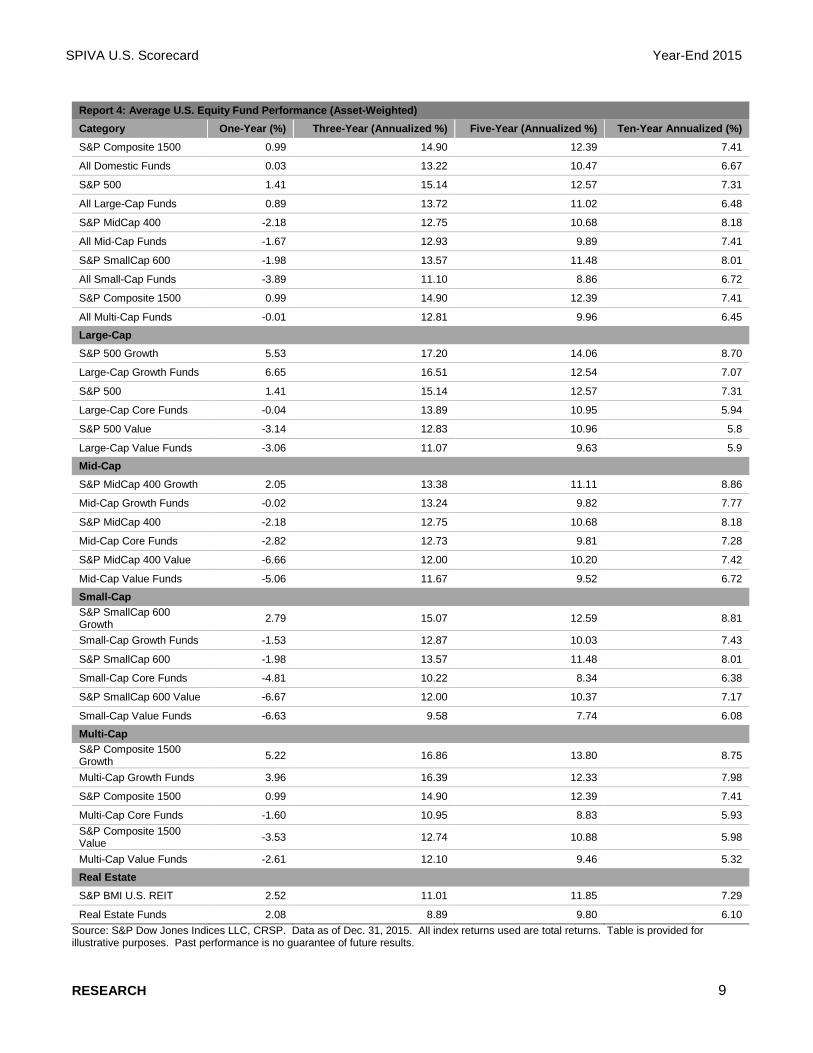
Report 4: Average U.S. Equity Fund Performance (Asset-Weighted) Category One-Year (%) Three-Year (Annualized %) Five-Year (Annualized %) Ten-Year Annualized (%) S&P Composite 1500 0.99 14.90 12.39 7.41
All Domestic Funds 0.03 13.22 10.47 6.67
S&P 500 1.41 15.14 12.57 7.31
All Large-Cap Funds 0.89 13.72 11.02 6.48
S&P MidCap 400 -2.18 12.75 10.68 8.18
All Mid-Cap Funds -1.67 12.93 9.89 7.41
S&P SmallCap 600 -1.98 13.57 11.48 8.01
All Small-Cap Funds -3.89 11.10 8.86 6.72
S&P Composite 1500 0.99 14.90 12.39 7.41
All Multi-Cap Funds -0.01 12.81 9.96 6.45
Large-Cap S&P 500 Growth 5.53 17.20 14.06 8.70
Large-Cap Growth Funds 6.65 16.51 12.54 7.07
S&P 500 1.41 15.14 12.57 7.31
Large-Cap Core Funds -0.04 13.89 10.95 5.94
S&P 500 Value -3.14 12.83 10.96 5.8
Large-Cap Value Funds -3.06 11.07 9.63 5.9
Mid-Cap S&P MidCap 400 Growth 2.05 13.38 11.11 8.86
Mid-Cap Growth Funds -0.02 13.24 9.82 7.77
S&P MidCap 400 -2.18 12.75 10.68 8.18
Mid-Cap Core Funds -2.82 12.73 9.81 7.28
S&P MidCap 400 Value -6.66 12.00 10.20 7.42
Mid-Cap Value Funds -5.06 11.67 9.52 6.72
Small-Cap S&P SmallCap 600 Growth 2.79 15.07 12.59 8.81
Small-Cap Growth Funds -1.53 12.87 10.03 7.43
S&P SmallCap 600 -1.98 13.57 11.48 8.01
Small-Cap Core Funds -4.81 10.22 8.34 6.38
S&P SmallCap 600 Value -6.67 12.00 10.37 7.17
Small-Cap Value Funds -6.63 9.58 7.74 6.08
Multi-Cap S&P Composite 1500 Growth 5.22 16.86 13.80 8.75
Multi-Cap Growth Funds 3.96 16.39 12.33 7.98
S&P Composite 1500 0.99 14.90 12.39 7.41
Multi-Cap Core Funds -1.60 10.95 8.83 5.93 S&P Composite 1500 Value -3.53 12.74 10.88 5.98
Multi-Cap Value Funds -2.61 12.10 9.46 5.32
Real Estate S&P BMI U.S. REIT 2.52 11.01 11.85 7.29
Real Estate Funds 2.08 8.89 9.80 6.10 Source: S&P Dow Jones Indices LLC, CRSP. Data as of Dec. 31, 2015. All index returns used are total returns. Table is provided for illustrative purposes. Past performance is no guarantee of future results.
SPIVA U.S. Scorecard Year-End 2015
RESEARCH 10
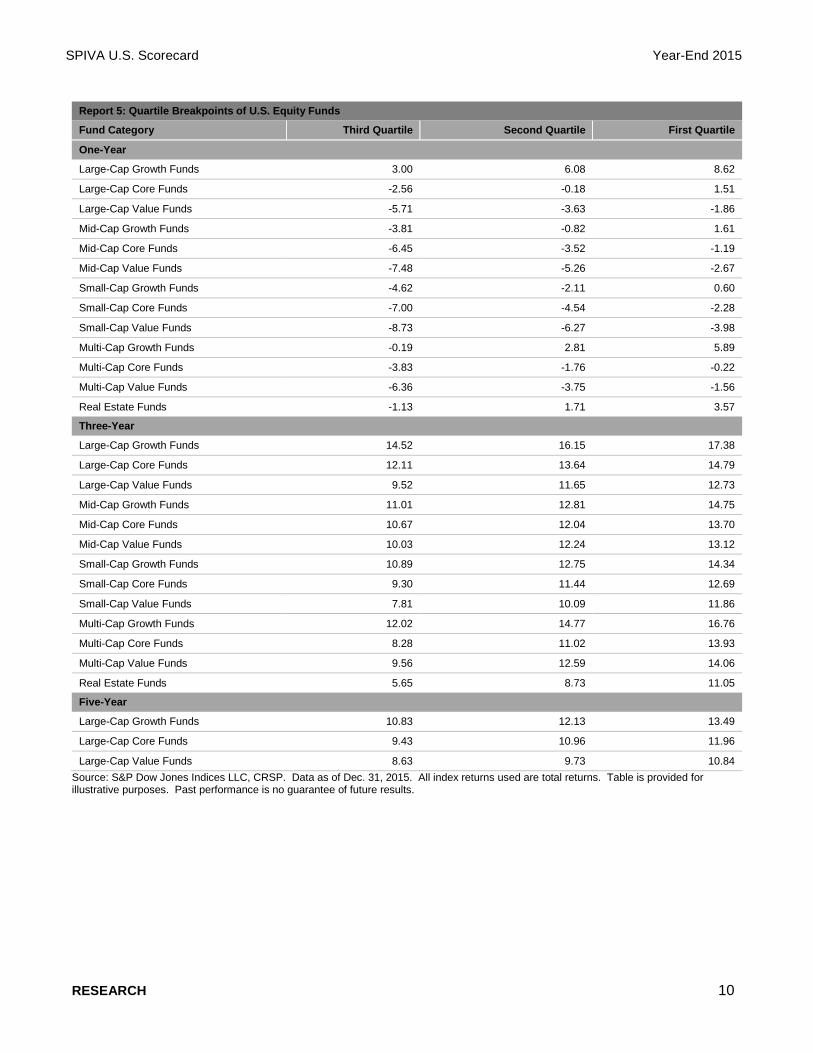
Report 5: Quartile Breakpoints of U.S. Equity Funds
Fund Category Third Quartile Second Quartile First Quartile
One-Year
Large-Cap Growth Funds 3.00 6.08 8.62
Large-Cap Core Funds -2.56 -0.18 1.51
Large-Cap Value Funds -5.71 -3.63 -1.86
Mid-Cap Growth Funds -3.81 -0.82 1.61
Mid-Cap Core Funds -6.45 -3.52 -1.19
Mid-Cap Value Funds -7.48 -5.26 -2.67
Small-Cap Growth Funds -4.62 -2.11 0.60
Small-Cap Core Funds -7.00 -4.54 -2.28
Small-Cap Value Funds -8.73 -6.27 -3.98
Multi-Cap Growth Funds -0.19 2.81 5.89
Multi-Cap Core Funds -3.83 -1.76 -0.22
Multi-Cap Value Funds -6.36 -3.75 -1.56
Real Estate Funds -1.13 1.71 3.57
Three-Year
Large-Cap Growth Funds 14.52 16.15 17.38
Large-Cap Core Funds 12.11 13.64 14.79
Large-Cap Value Funds 9.52 11.65 12.73
Mid-Cap Growth Funds 11.01 12.81 14.75
Mid-Cap Core Funds 10.67 12.04 13.70
Mid-Cap Value Funds 10.03 12.24 13.12
Small-Cap Growth Funds 10.89 12.75 14.34
Small-Cap Core Funds 9.30 11.44 12.69
Small-Cap Value Funds 7.81 10.09 11.86
Multi-Cap Growth Funds 12.02 14.77 16.76
Multi-Cap Core Funds 8.28 11.02 13.93
Multi-Cap Value Funds 9.56 12.59 14.06
Real Estate Funds 5.65 8.73 11.05
Five-Year
Large-Cap Growth Funds 10.83 12.13 13.49
Large-Cap Core Funds 9.43 10.96 11.96
Large-Cap Value Funds 8.63 9.73 10.84 Source: S&P Dow Jones Indices LLC, CRSP. Data as of Dec. 31, 2015. All index returns used are total returns. Table is provided for illustrative purposes. Past performance is no guarantee of future results.
SPIVA U.S. Scorecard Year-End 2015
RESEARCH 11
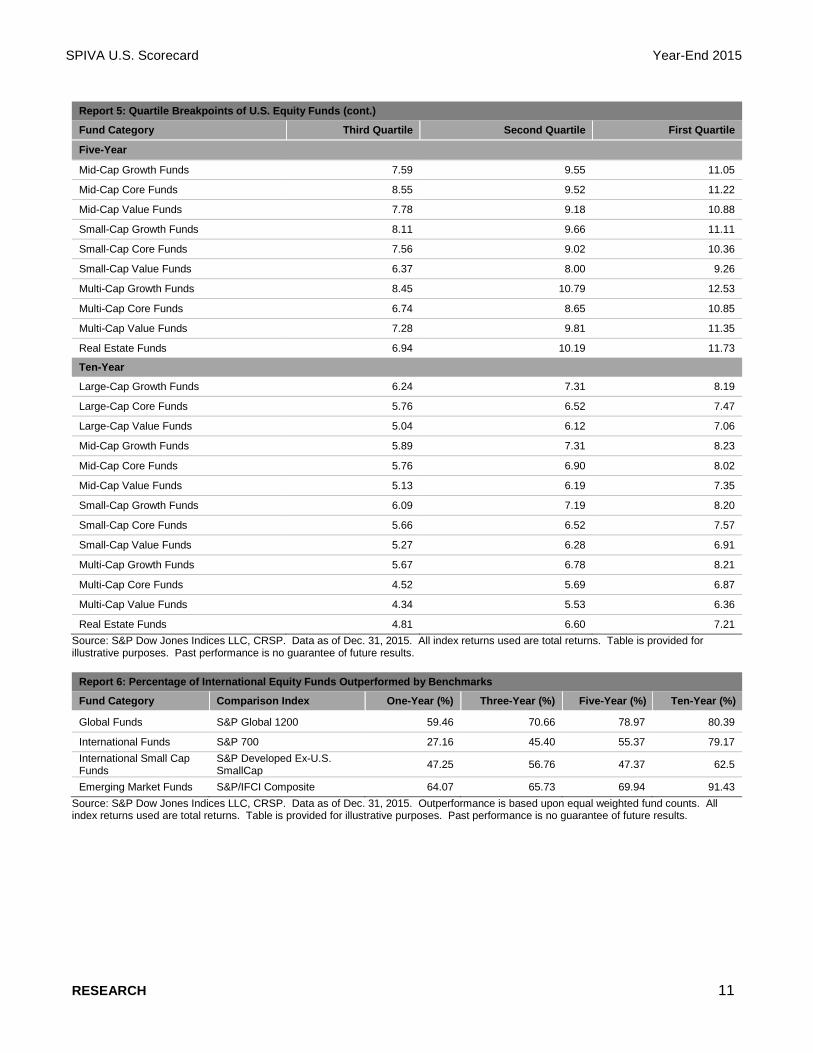
Report 5: Quartile Breakpoints of U.S. Equity Funds (cont.)
Fund Category Third Quartile Second Quartile First Quartile
Five-Year
Mid-Cap Growth Funds 7.59 9.55 11.05
Mid-Cap Core Funds 8.55 9.52 11.22
Mid-Cap Value Funds 7.78 9.18 10.88
Small-Cap Growth Funds 8.11 9.66 11.11
Small-Cap Core Funds 7.56 9.02 10.36
Small-Cap Value Funds 6.37 8.00 9.26
Multi-Cap Growth Funds 8.45 10.79 12.53
Multi-Cap Core Funds 6.74 8.65 10.85
Multi-Cap Value Funds 7.28 9.81 11.35
Real Estate Funds 6.94 10.19 11.73
Ten-Year
Large-Cap Growth Funds 6.24 7.31 8.19
Large-Cap Core Funds 5.76 6.52 7.47
Large-Cap Value Funds 5.04 6.12 7.06
Mid-Cap Growth Funds 5.89 7.31 8.23
Mid-Cap Core Funds 5.76 6.90 8.02
Mid-Cap Value Funds 5.13 6.19 7.35
Small-Cap Growth Funds 6.09 7.19 8.20
Small-Cap Core Funds 5.66 6.52 7.57
Small-Cap Value Funds 5.27 6.28 6.91
Multi-Cap Growth Funds 5.67 6.78 8.21
Multi-Cap Core Funds 4.52 5.69 6.87
Multi-Cap Value Funds 4.34 5.53 6.36
Real Estate Funds 4.81 6.60 7.21 Source: S&P Dow Jones Indices LLC, CRSP. Data as of Dec. 31, 2015. All index returns used are total returns. Table is provided for illustrative purposes. Past performance is no guarantee of future results.
Report 6: Percentage of International Equity Funds Outperformed by Benchmarks
Fund Category Comparison Index One-Year (%) Three-Year (%) Five-Year (%) Ten-Year (%)
Global Funds S&P Global 1200 59.46 70.66 78.97 80.39
International Funds S&P 700 27.16 45.40 55.37 79.17 International Small Cap Funds
S&P Developed Ex-U.S. SmallCap 47.25 56.76 47.37 62.5
Emerging Market Funds S&P/IFCI Composite 64.07 65.73 69.94 91.43 Source: S&P Dow Jones Indices LLC, CRSP. Data as of Dec. 31, 2015. Outperformance is based upon equal weighted fund counts. All index returns used are total returns. Table is provided for illustrative purposes. Past performance is no guarantee of future results.
SPIVA U.S. Scorecard Year-End 2015
RESEARCH 12
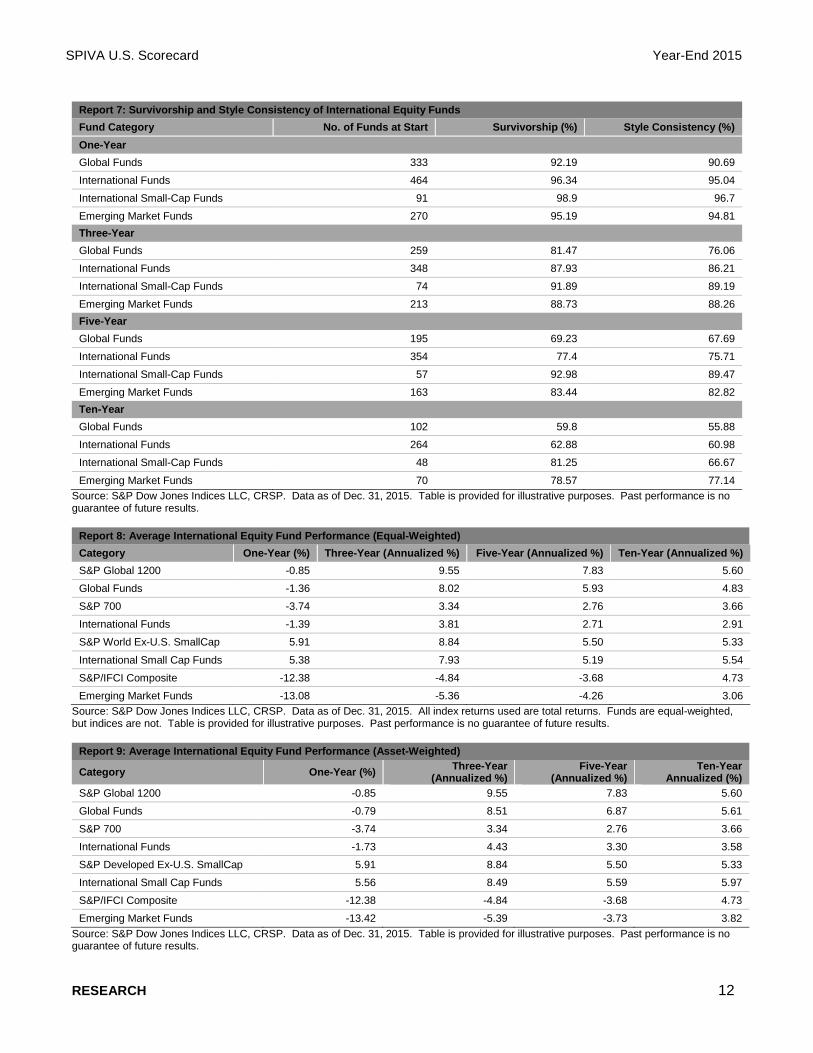
Report 7: Survivorship and Style Consistency of International Equity Funds Fund Category No. of Funds at Start Survivorship (%) Style Consistency (%) One-Year Global Funds 333 92.19 90.69
International Funds 464 96.34 95.04
International Small-Cap Funds 91 98.9 96.7
Emerging Market Funds 270 95.19 94.81 Three-Year Global Funds 259 81.47 76.06
International Funds 348 87.93 86.21
International Small-Cap Funds 74 91.89 89.19
Emerging Market Funds 213 88.73 88.26 Five-Year Global Funds 195 69.23 67.69
International Funds 354 77.4 75.71
International Small-Cap Funds 57 92.98 89.47
Emerging Market Funds 163 83.44 82.82 Ten-Year Global Funds 102 59.8 55.88
International Funds 264 62.88 60.98
International Small-Cap Funds 48 81.25 66.67
Emerging Market Funds 70 78.57 77.14 Source: S&P Dow Jones Indices LLC, CRSP. Data as of Dec. 31, 2015. Table is provided for illustrative purposes. Past performance is no guarantee of future results.
Report 8: Average International Equity Fund Performance (Equal-Weighted) Category One-Year (%) Three-Year (Annualized %) Five-Year (Annualized %) Ten-Year (Annualized %) S&P Global 1200 -0.85 9.55 7.83 5.60
Global Funds -1.36 8.02 5.93 4.83
S&P 700 -3.74 3.34 2.76 3.66
International Funds -1.39 3.81 2.71 2.91
S&P World Ex-U.S. SmallCap 5.91 8.84 5.50 5.33
International Small Cap Funds 5.38 7.93 5.19 5.54
S&P/IFCI Composite -12.38 -4.84 -3.68 4.73
Emerging Market Funds -13.08 -5.36 -4.26 3.06 Source: S&P Dow Jones Indices LLC, CRSP. Data as of Dec. 31, 2015. All index returns used are total returns. Funds are equal-weighted, but indices are not. Table is provided for illustrative purposes. Past performance is no guarantee of future results.
Report 9: Average International Equity Fund Performance (Asset-Weighted)
Category One-Year (%) Three-Year (Annualized %)
Five-Year (Annualized %)
Ten-Year Annualized (%)
S&P Global 1200 -0.85 9.55 7.83 5.60
Global Funds -0.79 8.51 6.87 5.61
S&P 700 -3.74 3.34 2.76 3.66
International Funds -1.73 4.43 3.30 3.58
S&P Developed Ex-U.S. SmallCap 5.91 8.84 5.50 5.33
International Small Cap Funds 5.56 8.49 5.59 5.97
S&P/IFCI Composite -12.38 -4.84 -3.68 4.73
Emerging Market Funds -13.42 -5.39 -3.73 3.82 Source: S&P Dow Jones Indices LLC, CRSP. Data as of Dec. 31, 2015. Table is provided for illustrative purposes. Past performance is no guarantee of future results.
SPIVA U.S. Scorecard Year-End 2015
RESEARCH 13
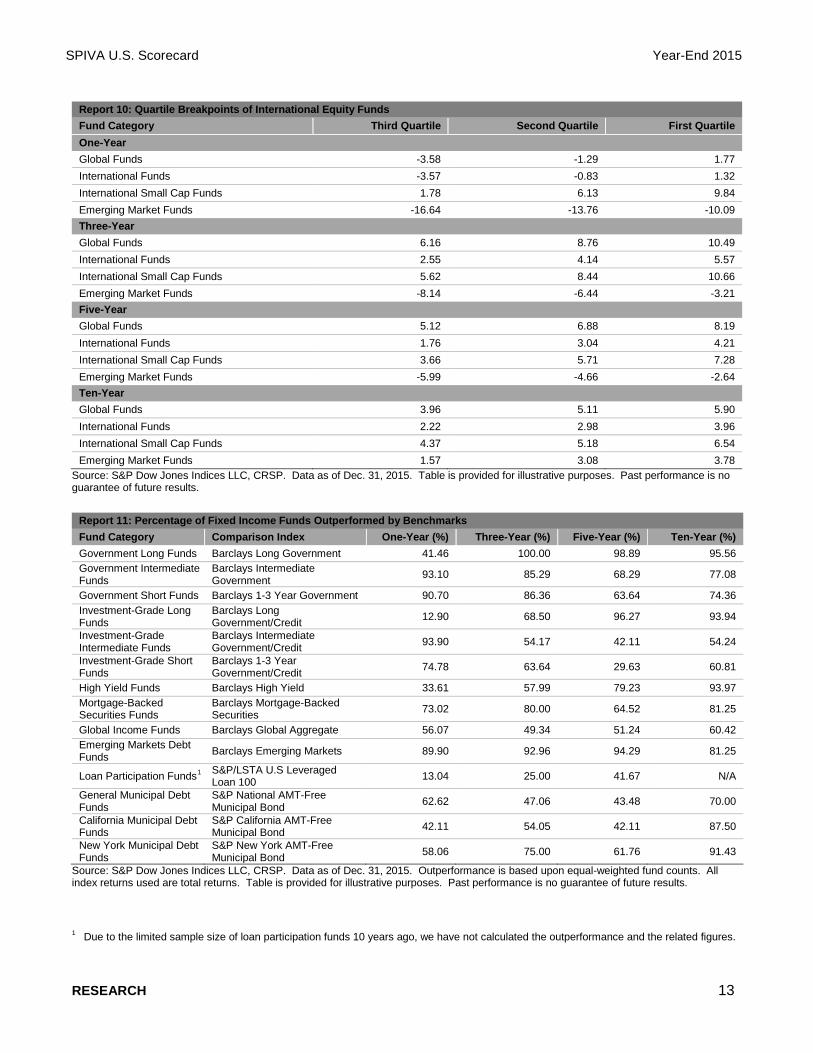
Report 10: Quartile Breakpoints of International Equity Funds Fund Category Third Quartile Second Quartile First Quartile One-Year Global Funds -3.58 -1.29 1.77 International Funds -3.57 -0.83 1.32 International Small Cap Funds 1.78 6.13 9.84 Emerging Market Funds -16.64 -13.76 -10.09 Three-Year Global Funds 6.16 8.76 10.49 International Funds 2.55 4.14 5.57 International Small Cap Funds 5.62 8.44 10.66 Emerging Market Funds -8.14 -6.44 -3.21 Five-Year Global Funds 5.12 6.88 8.19 International Funds 1.76 3.04 4.21 International Small Cap Funds 3.66 5.71 7.28 Emerging Market Funds -5.99 -4.66 -2.64 Ten-Year Global Funds 3.96 5.11 5.90 International Funds 2.22 2.98 3.96 International Small Cap Funds 4.37 5.18 6.54 Emerging Market Funds 1.57 3.08 3.78
Source: S&P Dow Jones Indices LLC, CRSP. Data as of Dec. 31, 2015. Table is provided for illustrative purposes. Past performance is no guarantee of future results.
Source: S&P Dow Jones Indices LLC, CRSP. Data as of Dec. 31, 2015. Outperformance is based upon equal-weighted fund counts. All index returns used are total returns. Table is provided for illustrative purposes. Past performance is no guarantee of future results.
1 Due to the limited sample size of loan participation funds 10 years ago, we have not calculated the outperformance and the related figures.
Report 11: Percentage of Fixed Income Funds Outperformed by Benchmarks Fund Category Comparison Index One-Year (%) Three-Year (%) Five-Year (%) Ten-Year (%) Government Long Funds Barclays Long Government 41.46 100.00 98.89 95.56 Government Intermediate Funds
Barclays Intermediate Government 93.10 85.29 68.29 77.08
Government Short Funds Barclays 1-3 Year Government 90.70 86.36 63.64 74.36 Investment-Grade Long Funds
Barclays Long Government/Credit 12.90 68.50 96.27 93.94
Investment-Grade Intermediate Funds
Barclays Intermediate Government/Credit 93.90 54.17 42.11 54.24
Investment-Grade Short Funds
Barclays 1-3 Year Government/Credit 74.78 63.64 29.63 60.81
High Yield Funds Barclays High Yield 33.61 57.99 79.23 93.97 Mortgage-Backed Securities Funds
Barclays Mortgage-Backed Securities 73.02 80.00 64.52 81.25
Global Income Funds Barclays Global Aggregate 56.07 49.34 51.24 60.42 Emerging Markets Debt Funds Barclays Emerging Markets 89.90 92.96 94.29 81.25
Loan Participation Funds1 S&P/LSTA U.S Leveraged Loan 100 13.04 25.00 41.67 N/A
General Municipal Debt Funds
S&P National AMT-Free Municipal Bond 62.62 47.06 43.48 70.00
California Municipal Debt Funds
S&P California AMT-Free Municipal Bond 42.11 54.05 42.11 87.50
New York Municipal Debt Funds
S&P New York AMT-Free Municipal Bond 58.06 75.00 61.76 91.43
SPIVA U.S. Scorecard Year-End 2015
RESEARCH 14
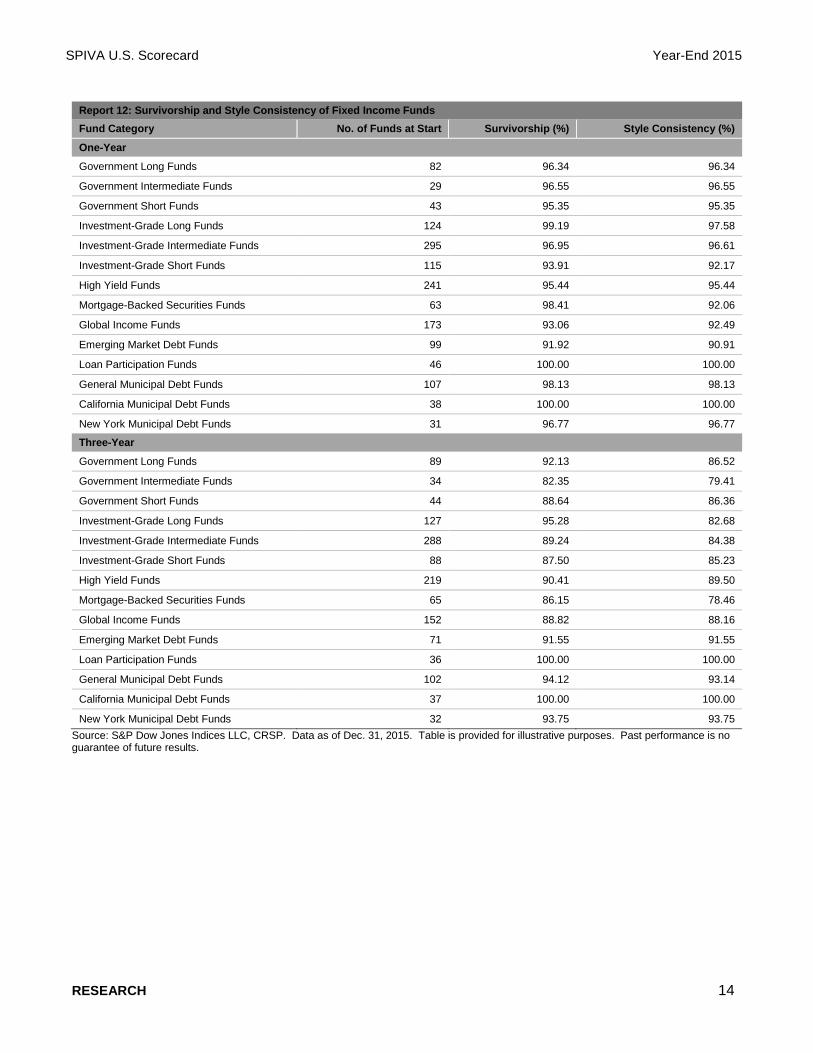
Report 12: Survivorship and Style Consistency of Fixed Income Funds Fund Category No. of Funds at Start Survivorship (%) Style Consistency (%)
One-Year
Government Long Funds 82 96.34 96.34
Government Intermediate Funds 29 96.55 96.55
Government Short Funds 43 95.35 95.35
Investment-Grade Long Funds 124 99.19 97.58
Investment-Grade Intermediate Funds 295 96.95 96.61
Investment-Grade Short Funds 115 93.91 92.17
High Yield Funds 241 95.44 95.44
Mortgage-Backed Securities Funds 63 98.41 92.06
Global Income Funds 173 93.06 92.49
Emerging Market Debt Funds 99 91.92 90.91
Loan Participation Funds 46 100.00 100.00
General Municipal Debt Funds 107 98.13 98.13
California Municipal Debt Funds 38 100.00 100.00
New York Municipal Debt Funds 31 96.77 96.77
Three-Year
Government Long Funds 89 92.13 86.52
Government Intermediate Funds 34 82.35 79.41
Government Short Funds 44 88.64 86.36
Investment-Grade Long Funds 127 95.28 82.68
Investment-Grade Intermediate Funds 288 89.24 84.38
Investment-Grade Short Funds 88 87.50 85.23
High Yield Funds 219 90.41 89.50
Mortgage-Backed Securities Funds 65 86.15 78.46
Global Income Funds 152 88.82 88.16
Emerging Market Debt Funds 71 91.55 91.55
Loan Participation Funds 36 100.00 100.00
General Municipal Debt Funds 102 94.12 93.14
California Municipal Debt Funds 37 100.00 100.00
New York Municipal Debt Funds 32 93.75 93.75 Source: S&P Dow Jones Indices LLC, CRSP. Data as of Dec. 31, 2015. Table is provided for illustrative purposes. Past performance is no guarantee of future results.
SPIVA U.S. Scorecard Year-End 2015
RESEARCH 15
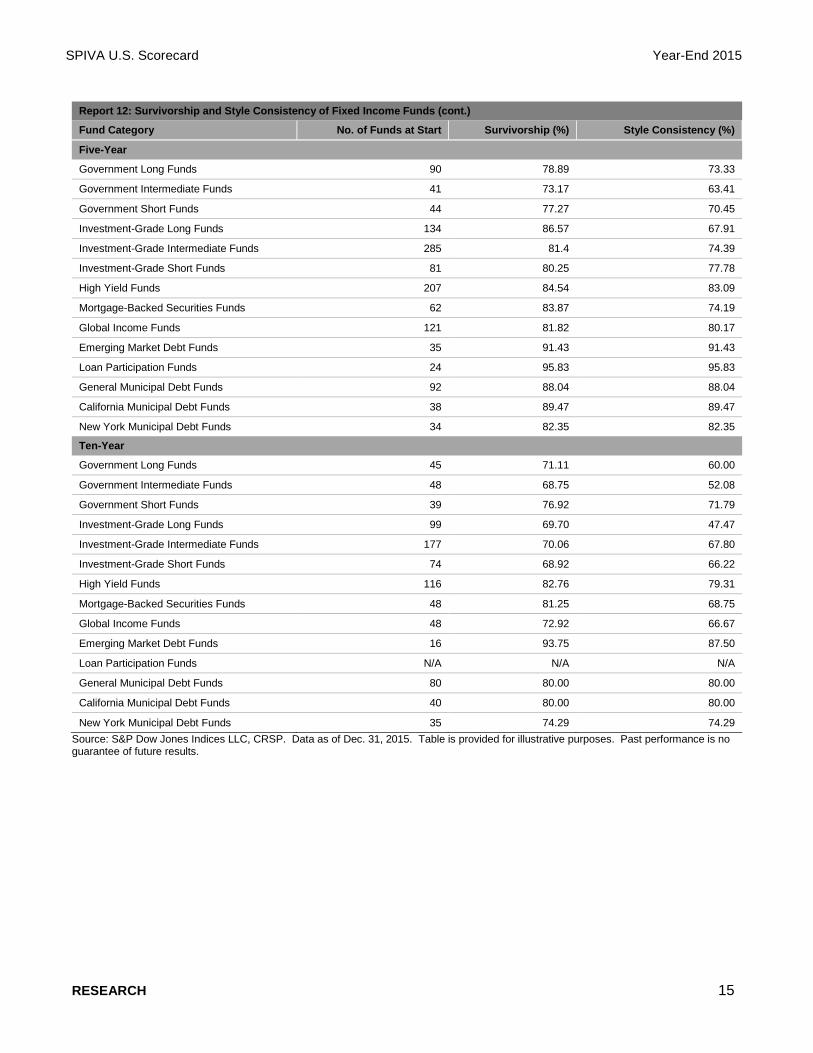
Report 12: Survivorship and Style Consistency of Fixed Income Funds (cont.)
Fund Category No. of Funds at Start Survivorship (%) Style Consistency (%)
Five-Year
Government Long Funds 90 78.89 73.33
Government Intermediate Funds 41 73.17 63.41
Government Short Funds 44 77.27 70.45
Investment-Grade Long Funds 134 86.57 67.91
Investment-Grade Intermediate Funds 285 81.4 74.39
Investment-Grade Short Funds 81 80.25 77.78
High Yield Funds 207 84.54 83.09
Mortgage-Backed Securities Funds 62 83.87 74.19
Global Income Funds 121 81.82 80.17
Emerging Market Debt Funds 35 91.43 91.43
Loan Participation Funds 24 95.83 95.83
General Municipal Debt Funds 92 88.04 88.04
California Municipal Debt Funds 38 89.47 89.47
New York Municipal Debt Funds 34 82.35 82.35
Ten-Year
Government Long Funds 45 71.11 60.00
Government Intermediate Funds 48 68.75 52.08
Government Short Funds 39 76.92 71.79
Investment-Grade Long Funds 99 69.70 47.47
Investment-Grade Intermediate Funds 177 70.06 67.80
Investment-Grade Short Funds 74 68.92 66.22
High Yield Funds 116 82.76 79.31
Mortgage-Backed Securities Funds 48 81.25 68.75
Global Income Funds 48 72.92 66.67
Emerging Market Debt Funds 16 93.75 87.50
Loan Participation Funds N/A N/A N/A
General Municipal Debt Funds 80 80.00 80.00
California Municipal Debt Funds 40 80.00 80.00
New York Municipal Debt Funds 35 74.29 74.29 Source: S&P Dow Jones Indices LLC, CRSP. Data as of Dec. 31, 2015. Table is provided for illustrative purposes. Past performance is no guarantee of future results.
SPIVA U.S. Scorecard Year-End 2015
RESEARCH 16
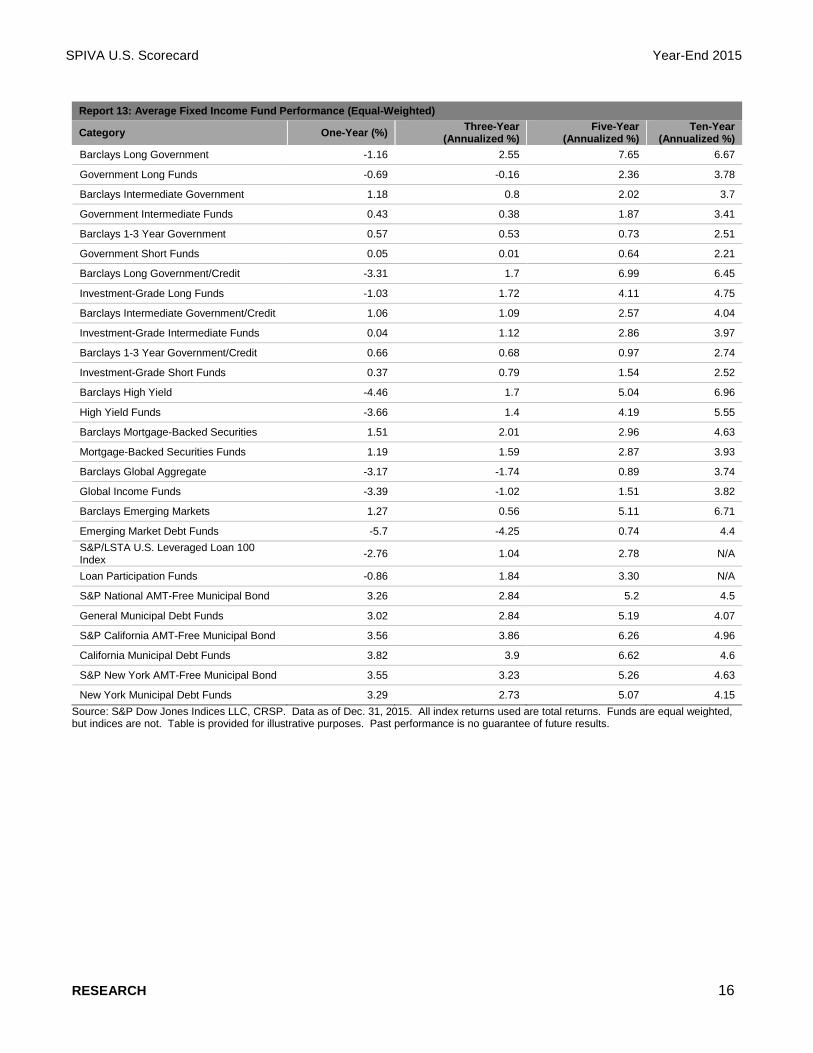
Report 13: Average Fixed Income Fund Performance (Equal-Weighted)
Category One-Year (%) Three-Year (Annualized %)
Five-Year (Annualized %)
Ten-Year (Annualized %)
Barclays Long Government -1.16 2.55 7.65 6.67
Government Long Funds -0.69 -0.16 2.36 3.78
Barclays Intermediate Government 1.18 0.8 2.02 3.7
Government Intermediate Funds 0.43 0.38 1.87 3.41
Barclays 1-3 Year Government 0.57 0.53 0.73 2.51
Government Short Funds 0.05 0.01 0.64 2.21
Barclays Long Government/Credit -3.31 1.7 6.99 6.45
Investment-Grade Long Funds -1.03 1.72 4.11 4.75
Barclays Intermediate Government/Credit 1.06 1.09 2.57 4.04
Investment-Grade Intermediate Funds 0.04 1.12 2.86 3.97
Barclays 1-3 Year Government/Credit 0.66 0.68 0.97 2.74
Investment-Grade Short Funds 0.37 0.79 1.54 2.52
Barclays High Yield -4.46 1.7 5.04 6.96
High Yield Funds -3.66 1.4 4.19 5.55
Barclays Mortgage-Backed Securities 1.51 2.01 2.96 4.63
Mortgage-Backed Securities Funds 1.19 1.59 2.87 3.93
Barclays Global Aggregate -3.17 -1.74 0.89 3.74
Global Income Funds -3.39 -1.02 1.51 3.82
Barclays Emerging Markets 1.27 0.56 5.11 6.71
Emerging Market Debt Funds -5.7 -4.25 0.74 4.4 S&P/LSTA U.S. Leveraged Loan 100 Index -2.76 1.04 2.78 N/A
Loan Participation Funds -0.86 1.84 3.30 N/A
S&P National AMT-Free Municipal Bond 3.26 2.84 5.2 4.5
General Municipal Debt Funds 3.02 2.84 5.19 4.07
S&P California AMT-Free Municipal Bond 3.56 3.86 6.26 4.96
California Municipal Debt Funds 3.82 3.9 6.62 4.6
S&P New York AMT-Free Municipal Bond 3.55 3.23 5.26 4.63
New York Municipal Debt Funds 3.29 2.73 5.07 4.15 Source: S&P Dow Jones Indices LLC, CRSP. Data as of Dec. 31, 2015. All index returns used are total returns. Funds are equal weighted, but indices are not. Table is provided for illustrative purposes. Past performance is no guarantee of future results.
SPIVA U.S. Scorecard Year-End 2015
RESEARCH 17
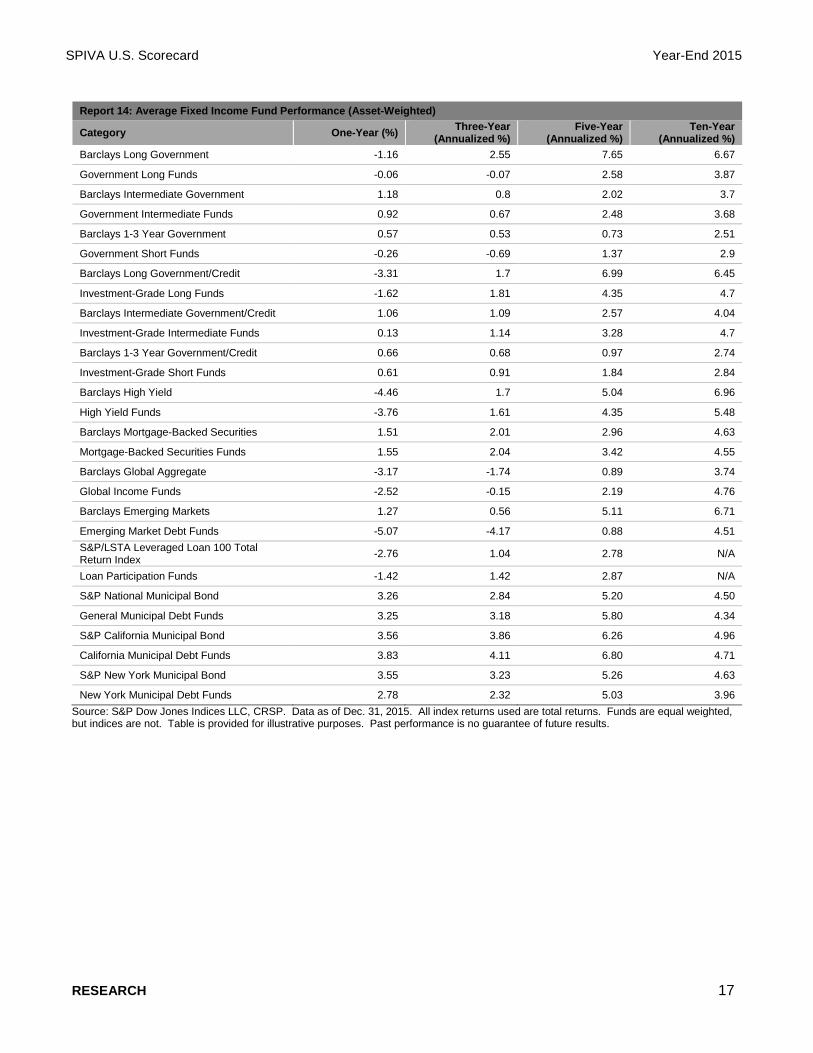
Report 14: Average Fixed Income Fund Performance (Asset-Weighted)
Category One-Year (%) Three-Year (Annualized %)
Five-Year (Annualized %)
Ten-Year (Annualized %)
Barclays Long Government -1.16 2.55 7.65 6.67
Government Long Funds -0.06 -0.07 2.58 3.87
Barclays Intermediate Government 1.18 0.8 2.02 3.7
Government Intermediate Funds 0.92 0.67 2.48 3.68
Barclays 1-3 Year Government 0.57 0.53 0.73 2.51
Government Short Funds -0.26 -0.69 1.37 2.9
Barclays Long Government/Credit -3.31 1.7 6.99 6.45
Investment-Grade Long Funds -1.62 1.81 4.35 4.7
Barclays Intermediate Government/Credit 1.06 1.09 2.57 4.04
Investment-Grade Intermediate Funds 0.13 1.14 3.28 4.7
Barclays 1-3 Year Government/Credit 0.66 0.68 0.97 2.74
Investment-Grade Short Funds 0.61 0.91 1.84 2.84
Barclays High Yield -4.46 1.7 5.04 6.96
High Yield Funds -3.76 1.61 4.35 5.48
Barclays Mortgage-Backed Securities 1.51 2.01 2.96 4.63
Mortgage-Backed Securities Funds 1.55 2.04 3.42 4.55
Barclays Global Aggregate -3.17 -1.74 0.89 3.74
Global Income Funds -2.52 -0.15 2.19 4.76
Barclays Emerging Markets 1.27 0.56 5.11 6.71
Emerging Market Debt Funds -5.07 -4.17 0.88 4.51 S&P/LSTA Leveraged Loan 100 Total Return Index -2.76 1.04 2.78 N/A
Loan Participation Funds -1.42 1.42 2.87 N/A
S&P National Municipal Bond 3.26 2.84 5.20 4.50
General Municipal Debt Funds 3.25 3.18 5.80 4.34
S&P California Municipal Bond 3.56 3.86 6.26 4.96
California Municipal Debt Funds 3.83 4.11 6.80 4.71
S&P New York Municipal Bond 3.55 3.23 5.26 4.63
New York Municipal Debt Funds 2.78 2.32 5.03 3.96 Source: S&P Dow Jones Indices LLC, CRSP. Data as of Dec. 31, 2015. All index returns used are total returns. Funds are equal weighted, but indices are not. Table is provided for illustrative purposes. Past performance is no guarantee of future results.
SPIVA U.S. Scorecard Year-End 2015
RESEARCH 18
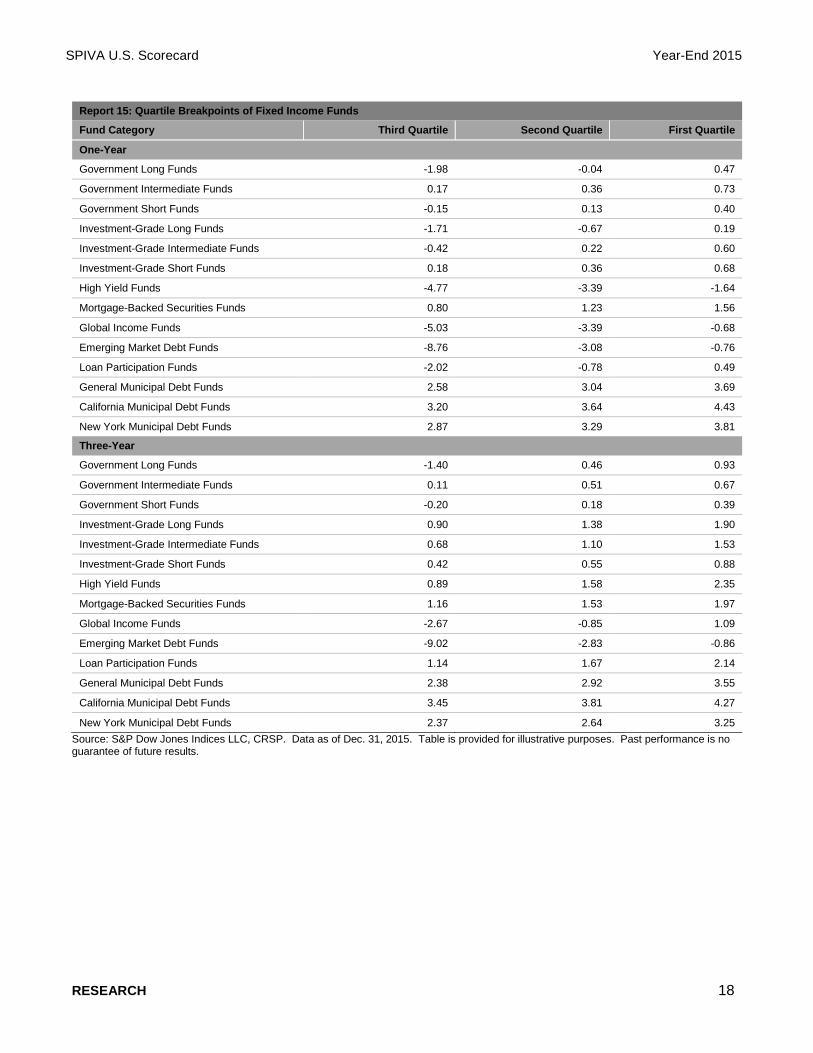
Report 15: Quartile Breakpoints of Fixed Income Funds
Fund Category Third Quartile Second Quartile First Quartile
One-Year
Government Long Funds -1.98 -0.04 0.47
Government Intermediate Funds 0.17 0.36 0.73
Government Short Funds -0.15 0.13 0.40
Investment-Grade Long Funds -1.71 -0.67 0.19
Investment-Grade Intermediate Funds -0.42 0.22 0.60
Investment-Grade Short Funds 0.18 0.36 0.68
High Yield Funds -4.77 -3.39 -1.64
Mortgage-Backed Securities Funds 0.80 1.23 1.56
Global Income Funds -5.03 -3.39 -0.68
Emerging Market Debt Funds -8.76 -3.08 -0.76
Loan Participation Funds -2.02 -0.78 0.49
General Municipal Debt Funds 2.58 3.04 3.69
California Municipal Debt Funds 3.20 3.64 4.43
New York Municipal Debt Funds 2.87 3.29 3.81
Three-Year
Government Long Funds -1.40 0.46 0.93
Government Intermediate Funds 0.11 0.51 0.67
Government Short Funds -0.20 0.18 0.39
Investment-Grade Long Funds 0.90 1.38 1.90
Investment-Grade Intermediate Funds 0.68 1.10 1.53
Investment-Grade Short Funds 0.42 0.55 0.88
High Yield Funds 0.89 1.58 2.35
Mortgage-Backed Securities Funds 1.16 1.53 1.97
Global Income Funds -2.67 -0.85 1.09
Emerging Market Debt Funds -9.02 -2.83 -0.86
Loan Participation Funds 1.14 1.67 2.14
General Municipal Debt Funds 2.38 2.92 3.55
California Municipal Debt Funds 3.45 3.81 4.27
New York Municipal Debt Funds 2.37 2.64 3.25 Source: S&P Dow Jones Indices LLC, CRSP. Data as of Dec. 31, 2015. Table is provided for illustrative purposes. Past performance is no guarantee of future results.
SPIVA U.S. Scorecard Year-End 2015
RESEARCH 19
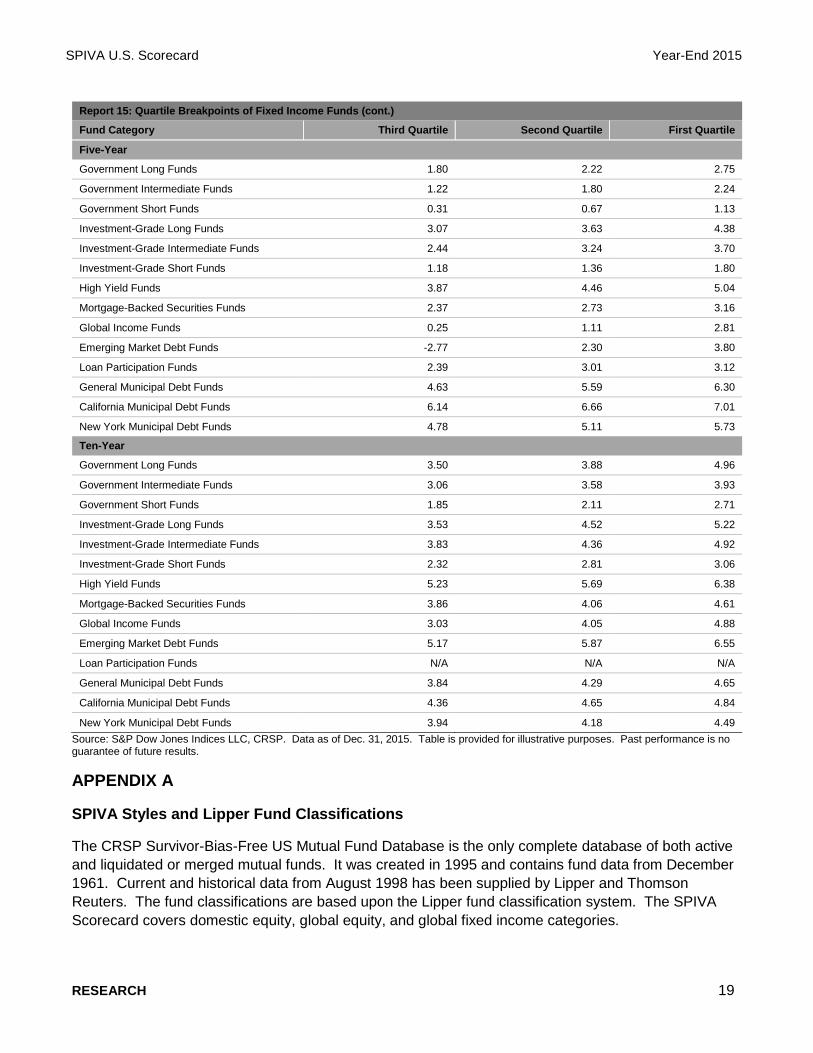
Report 15: Quartile Breakpoints of Fixed Income Funds (cont.)
Fund Category Third Quartile Second Quartile First Quartile
Five-Year
Government Long Funds 1.80 2.22 2.75
Government Intermediate Funds 1.22 1.80 2.24
Government Short Funds 0.31 0.67 1.13
Investment-Grade Long Funds 3.07 3.63 4.38
Investment-Grade Intermediate Funds 2.44 3.24 3.70
Investment-Grade Short Funds 1.18 1.36 1.80
High Yield Funds 3.87 4.46 5.04
Mortgage-Backed Securities Funds 2.37 2.73 3.16
Global Income Funds 0.25 1.11 2.81
Emerging Market Debt Funds -2.77 2.30 3.80
Loan Participation Funds 2.39 3.01 3.12
General Municipal Debt Funds 4.63 5.59 6.30
California Municipal Debt Funds 6.14 6.66 7.01
New York Municipal Debt Funds 4.78 5.11 5.73
Ten-Year
Government Long Funds 3.50 3.88 4.96
Government Intermediate Funds 3.06 3.58 3.93
Government Short Funds 1.85 2.11 2.71
Investment-Grade Long Funds 3.53 4.52 5.22
Investment-Grade Intermediate Funds 3.83 4.36 4.92
Investment-Grade Short Funds 2.32 2.81 3.06
High Yield Funds 5.23 5.69 6.38
Mortgage-Backed Securities Funds 3.86 4.06 4.61
Global Income Funds 3.03 4.05 4.88
Emerging Market Debt Funds 5.17 5.87 6.55
Loan Participation Funds N/A N/A N/A
General Municipal Debt Funds 3.84 4.29 4.65
California Municipal Debt Funds 4.36 4.65 4.84
New York Municipal Debt Funds 3.94 4.18 4.49 Source: S&P Dow Jones Indices LLC, CRSP. Data as of Dec. 31, 2015. Table is provided for illustrative purposes. Past performance is no guarantee of future results.
APPENDIX A
SPIVA Styles and Lipper Fund Classifications
The CRSP Survivor-Bias-Free US Mutual Fund Database is the only complete database of both active and liquidated or merged mutual funds. It was created in 1995 and contains fund data from December 1961. Current and historical data from August 1998 has been supplied by Lipper and Thomson Reuters. The fund classifications are based upon the Lipper fund classification system. The SPIVA Scorecard covers domestic equity, global equity, and global fixed income categories.
SPIVA U.S. Scorecard Year-End 2015
RESEARCH 20
U.S. Equity
SPIVA covers major capitalization levels (large-, mid-, small-, and multi-cap funds) and investment styles (growth, core, and value). S&P Dow Jones Indices uses the Lipper fund classifications, which determine a fund portfolio’s capitalization and investment style assignments.
Lipper assigns a market capitalization to each fund based on the percentages of a fund’s three-year weighted equity assets that fall into each of Lipper’s three defined market capitalization slices. The market capitalization breakpoints are calculated using all common stocks, excluding all non-U.S. domiciled stocks and ADRs, trading on the NYSE, AMEX, and NASDAQ. Funds are assigned to the capitalization level in which they have a 75% or higher weighting. Any fund that has less than 75% of its three-year weighted allocation in any of the three market capitalization ranges is classified as a multi-cap fund.
For investment style selection, the Lipper classification system uses three-year fundamental portfolio characteristics (price/earnings, price/book, and three-year sales-per-share growth) and, if necessary, confirming secondary characteristics (price-to-sales and price-to-operating cash flow). Fund statistics are compared to their relevant S&P Dow Jones Indices capitalization-level index to determine the growth, core, or value style.
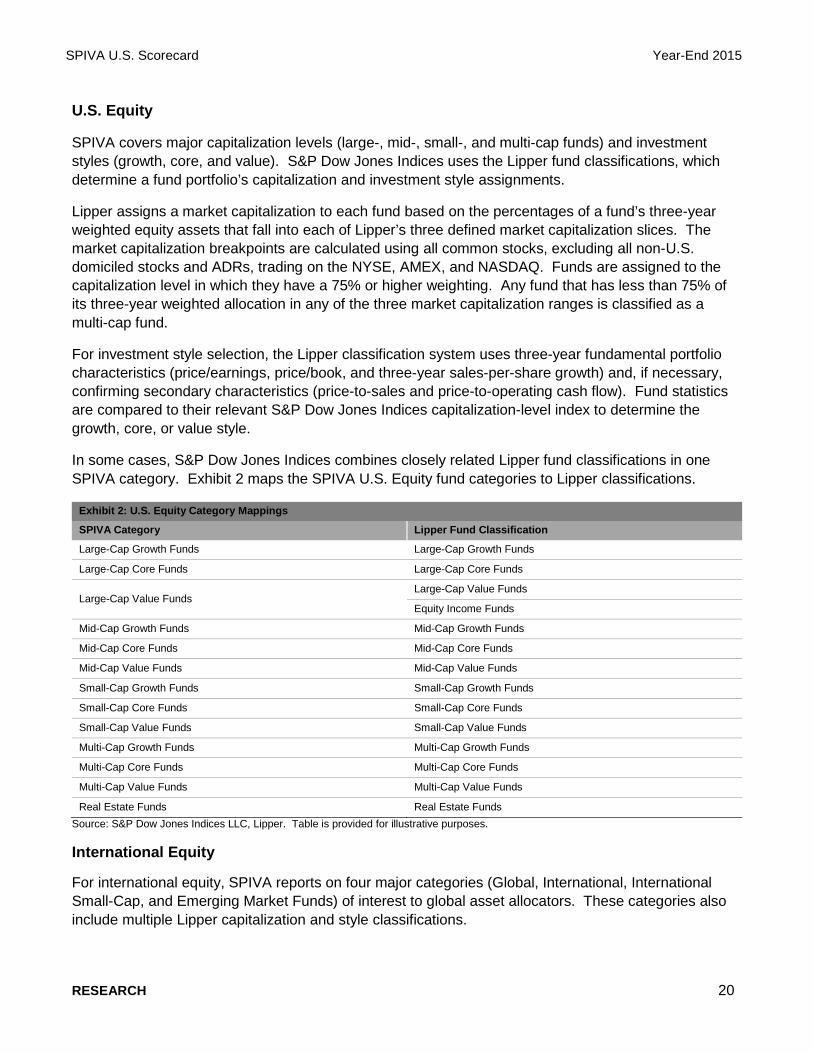
In some cases, S&P Dow Jones Indices combines closely related Lipper fund classifications in one SPIVA category. Exhibit 2 maps the SPIVA U.S. Equity fund categories to Lipper classifications.
Exhibit 2: U.S. Equity Category Mappings
SPIVA Category Lipper Fund Classification
Large-Cap Growth Funds Large-Cap Growth Funds
Large-Cap Core Funds Large-Cap Core Funds
Large-Cap Value Funds Large-Cap Value Funds
Equity Income Funds
Mid-Cap Growth Funds Mid-Cap Growth Funds
Mid-Cap Core Funds Mid-Cap Core Funds
Mid-Cap Value Funds Mid-Cap Value Funds
Small-Cap Growth Funds Small-Cap Growth Funds
Small-Cap Core Funds Small-Cap Core Funds
Small-Cap Value Funds Small-Cap Value Funds
Multi-Cap Growth Funds Multi-Cap Growth Funds
Multi-Cap Core Funds Multi-Cap Core Funds
Multi-Cap Value Funds Multi-Cap Value Funds
Real Estate Funds Real Estate Funds Source: S&P Dow Jones Indices LLC, Lipper. Table is provided for illustrative purposes.
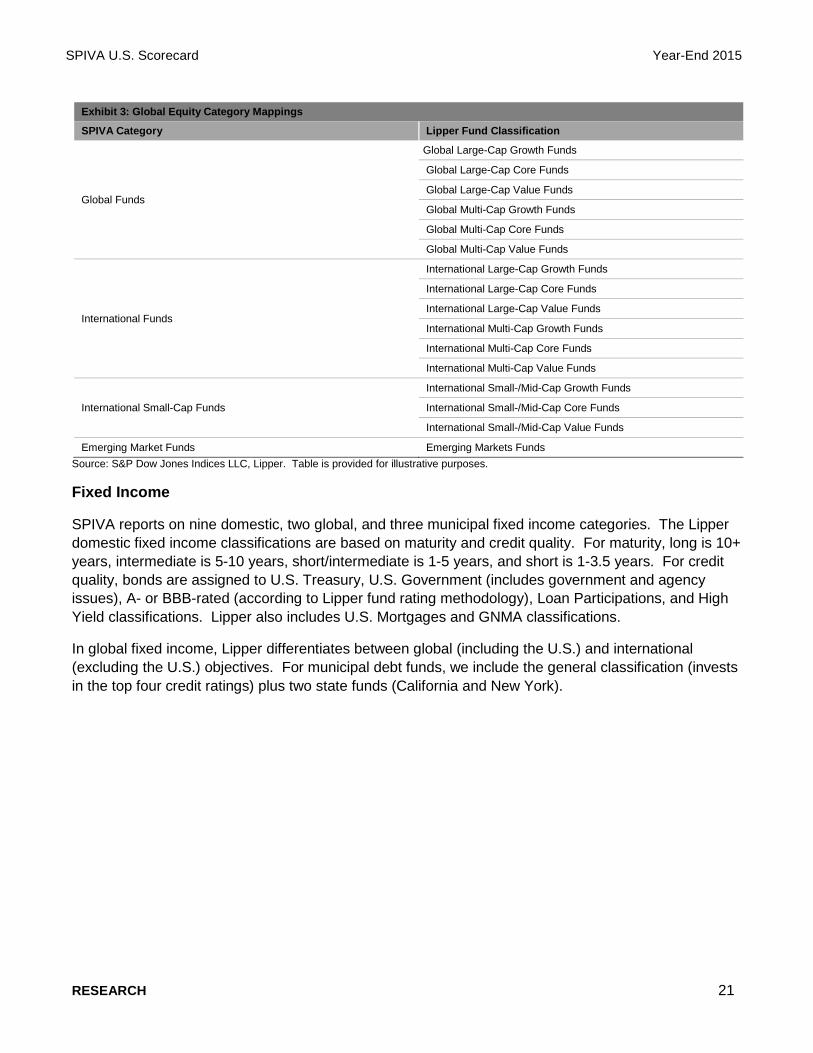
International Equity
For international equity, SPIVA reports on four major categories (Global, International, International Small-Cap, and Emerging Market Funds) of interest to global asset allocators. These categories also include multiple Lipper capitalization and style classifications.
SPIVA U.S. Scorecard Year-End 2015
RESEARCH 21
Source: S&P Dow Jones Indices LLC, Lipper. Table is provided for illustrative purposes.
Fixed Income
SPIVA reports on nine domestic, two global, and three municipal fixed income categories. The Lipper domestic fixed income classifications are based on maturity and credit quality. For maturity, long is 10+ years, intermediate is 5-10 years, short/intermediate is 1-5 years, and short is 1-3.5 years. For credit quality, bonds are assigned to U.S. Treasury, U.S. Government (includes government and agency issues), A- or BBB-rated (according to Lipper fund rating methodology), Loan Participations, and High Yield classifications. Lipper also includes U.S. Mortgages and GNMA classifications.
In global fixed income, Lipper differentiates between global (including the U.S.) and international (excluding the U.S.) objectives. For municipal debt funds, we include the general classification (invests in the top four credit ratings) plus two state funds (California and New York).
Exhibit 3: Global Equity Category Mappings
SPIVA Category Lipper Fund Classification
Global Funds
Global Large-Cap Growth Funds
Global Large-Cap Core Funds
Global Large-Cap Value Funds
Global Multi-Cap Growth Funds
Global Multi-Cap Core Funds
Global Multi-Cap Value Funds
International Funds
International Large-Cap Growth Funds
International Large-Cap Core Funds
International Large-Cap Value Funds
International Multi-Cap Growth Funds
International Multi-Cap Core Funds
International Multi-Cap Value Funds
International Small-Cap Funds
International Small-/Mid-Cap Growth Funds
International Small-/Mid-Cap Core Funds
International Small-/Mid-Cap Value Funds
Emerging Market Funds Emerging Markets Funds
SPIVA U.S. Scorecard Year-End 2015
RESEARCH 22
Source: S&P Dow Jones Indices LLC, Lipper. Table is provided for illustrative purposes.
APPENDIX B: GLOSSARY
Percentage of Funds Outperformed by the Index
To correct for survivorship bias, we use the opportunity set available at the beginning of the period as the denominator. We determine the count of funds that have survived and beat the index. We then report the index outperformance percentage.
Survivorship (%)
This measure represents the percentage of funds in existence at the beginning of the time period that is still active at the end of the time period.
Style Consistency (%)
This calculation shows the percentage of funds that had the same style classification at the end of the time period as at the beginning of the time period.
Equal-Weighted Fund Performance
Equal-weighted returns for a particular style category are determined by calculating a simple average return of all active funds in that category in a particular month.
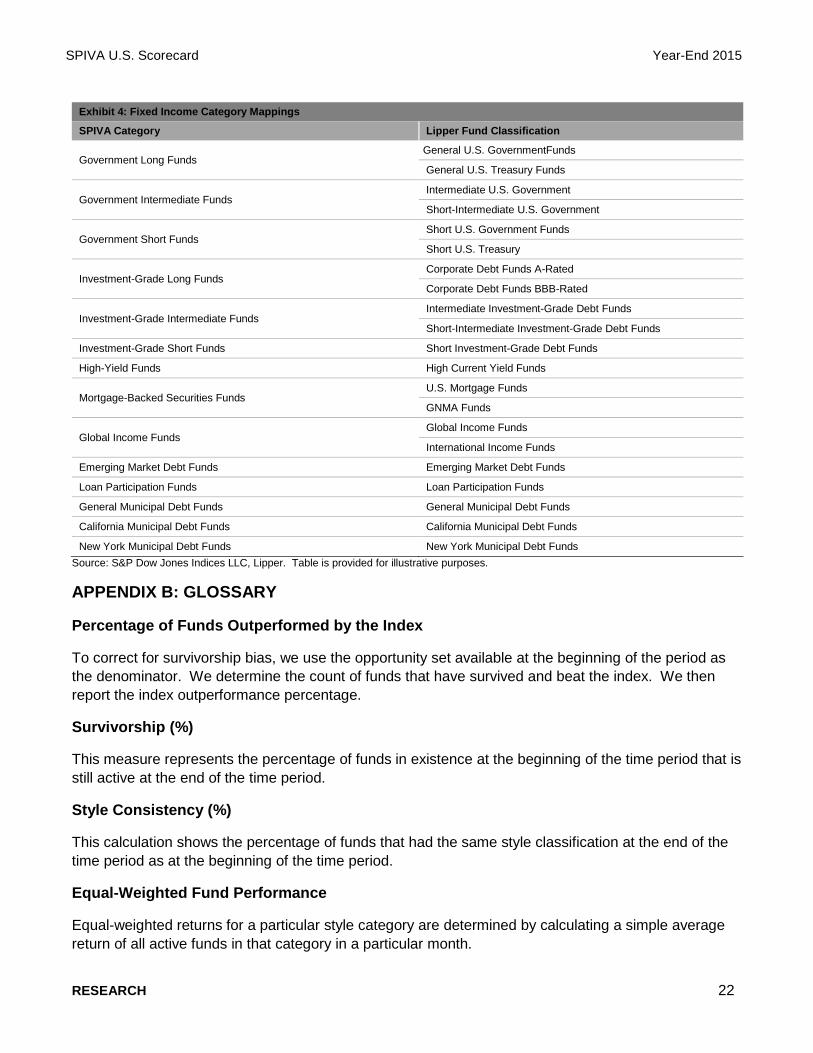
Exhibit 4: Fixed Income Category Mappings
SPIVA Category Lipper Fund Classification
Government Long Funds General U.S. GovernmentFunds
General U.S. Treasury Funds
Government Intermediate Funds Intermediate U.S. Government
Short-Intermediate U.S. Government
Government Short Funds Short U.S. Government Funds
Short U.S. Treasury
Investment-Grade Long Funds Corporate Debt Funds A-Rated
Corporate Debt Funds BBB-Rated
Investment-Grade Intermediate Funds Intermediate Investment-Grade Debt Funds
Short-Intermediate Investment-Grade Debt Funds
Investment-Grade Short Funds Short Investment-Grade Debt Funds
High-Yield Funds High Current Yield Funds
Mortgage-Backed Securities Funds U.S. Mortgage Funds
GNMA Funds
Global Income Funds Global Income Funds
International Income Funds
Emerging Market Debt Funds Emerging Market Debt Funds
Loan Participation Funds Loan Participation Funds
General Municipal Debt Funds General Municipal Debt Funds
California Municipal Debt Funds California Municipal Debt Funds
New York Municipal Debt Funds New York Municipal Debt Funds
SPIVA U.S. Scorecard Year-End 2015
RESEARCH 23
Asset-Weighted Fund Performance
Asset-weighted returns for a particular style category are determined by calculating a weighted average return of all funds in that category in a particular month, with each fund's return weighted by its total net assets. Asset-weighted returns are a better indicator of fund category performance because they more accurately reflect the returns of the total money invested in that particular style category.
Quartiles Breakpoints
The pth percentile for a set of data is the value that is greater than or equal top% of the data, but is less than or equal to (100 - p)% of the data. In other words, it is a value that divides the data into two parts: the lower p% of the values and the upper (100-p)% of the values. The first quartile is the 75th percentile, the value separating the elements of a population into the lower 75% and the upper 25%. The second quartile is the 50th percentile and the third quartile is the 25th percentile. For fund category quartiles in a particular time horizon, the data used is the return of the largest share class of the fund net of fees, excluding loads.
Survivorship Bias
Many funds might liquidate or merge during a period of study. This usually occurs due to continued poor performance by the fund. Therefore, if index returns were compared to fund returns using only surviving funds, the comparison would be biased in favor of the fund category. These reports remove this bias by (a) using the entire investment opportunity set, made up of all funds in that particular category at the outset of the period, as the denominator for outperformance calculations, (b) explicitly showing the survivorship rate in each category, and (c) constructing peer average return series for each category based on all available funds at the outset of the period.
Fees
The fund returns used are net of fees, excluding loads.
Indices2
A benchmark index provides an investment vehicle against which fund performance can be measured.
U.S. Equity
S&P 500
Widely regarded as the best single gauge of the U.S. equities market, this market-capitalization-weighted index includes a representative sample of 500 leading companies in the foremost industries of the U.S. economy and provides over 80% coverage of U.S. equities.
S&P MidCap 400
This index consists of 400 mid-sized companies and covers approximately 7% of the U.S. equities market.
2 For more information on S&P Dow Jones Indices, please visit www.spindices.com.
SPIVA U.S. Scorecard Year-End 2015
RESEARCH 24
S&P SmallCap 600
This index consists of 600 small-cap stocks and covers approximately 3% of the U.S. equities market.
S&P Composite 1500
This is a broad, market-capitalization-weighted index of 1500 stocks. This index is comprised of three size-based indices: the S&P 500, S&P MidCap 400, and S&P SmallCap 600, which measure the performance of large-, mid-, and small-cap stocks, respectively. This index represents 90% of U.S. equities.
S&P 500 Growth and Value Indices
These indices form an exhaustive, multi-factor style series covering the entire market capitalization of the S&P 500. Constituents, weighted according to market capitalization, are classified as growth, value, or a mix of growth and value.
S&P MidCap 400 Growth and Value Indices
These indices form an exhaustive, multi-factor style series covering the entire market capitalization of the S&P MidCap 400.
S&P SmallCap 600 Growth and Value Indices
These indices form an exhaustive, multi-factor style series covering the entire market capitalization of the S&P SmallCap 600.
S&P Composite 1500 Growth and Value Indices
These indices form an exhaustive, multi-factor style series covering the entire market capitalization of the S&P Composite 1500.
S&P United States REIT Index
This index measures the investable universe of publicly traded real estate investment trusts.
International Equity
S&P Global 1200
Capturing approximately 70% of the world’s capital markets, the S&P Global 1200 is a composite of seven headline indices, many of which are accepted leaders in their regions. It includes the S&P 500 (U.S.), S&P Europe 350 (Europe), S&P/Topix 150 (Japan), S&P/TSX 60 (Canada), S&P/ASX All Australian 50 (Australia), S&P Asia 50 (Asia Ex-Japan), and S&P Latin America 40 (Latin America).
S&P 700
This index measures the non-U.S. component of the global equity markets, covering all the regions included in the S&P Global 1200, excluding the U.S. (S&P 500).
SPIVA U.S. Scorecard Year-End 2015
RESEARCH 25
S&P World Ex-U.S. Small Cap
This index represents the small-cap segment—the bottom 15%—of the world’s universe of institutionally investable securities, excluding the U.S.
S&P/IFCI Composite Index
This index is widely recognized as a comprehensive and reliable measure of the world’s emerging markets. It measures the returns of stocks that are legally and practically available to foreign investors.
Fixed Income3
Barclays Capital Long Government Bond Index
This index consists of U.S. Treasury and U.S. Government agency bonds with maturities greater than 10 years.
Barclays Capital Intermediate Government Bond Index
This index consists of U.S. Treasury and U.S. Government agency bonds with maturities from 1 to 10 years.
Barclays Capital 1-3 Year Government Bond Index
This index consists of U.S. Treasury and U.S. Government agency bonds with maturities from one to three years.
Barclays Capital Long Government/Credit Bond Index
This index covers corporate and non-corporate fixed income securities that are rated investment grade and have maturities greater than 10 years.
Barclays Capital Intermediate Government/Credit Bond Index
This index covers corporate and non-corporate fixed income securities that are rated investment grade with maturities from 1 to 10 years.
Barclays Capital 1-3 Year Government/Credit Bond Index
This index covers corporate and non-corporate fixed income securities that are rated investment grade and have one to three years until their final maturity.
Barclays Capital High Yield Bond Index
This index includes all fixed income securities with a maximum quality rating of Ba1/BB+ (including defaulted issues), a minimum amount outstanding of USD 100 million, and at least one year to maturity.
3 Barclays Capital Fixed Income Indices were formerly the Lehman Brothers Indices.
SPIVA U.S. Scorecard Year-End 2015
RESEARCH 26
Barclays Capital Brothers Mortgage-Backed Securities Index
This index includes 15- and 30-year fixed-rate securities backed by mortgage pools of the Government National Mortgage Association (GNMA), Federal Home Loan Mortgage Corporation (FHLMC), and Federal National Mortgage Association (FNMA)
Barclays Capital Global Aggregate Bond Index
This index covers the most-liquid portion of the global investment-grade, fixed-rate bond market, including government, credit, and collateralized securities.
Barclays Capital Emerging Markets Index
This index includes fixed- and floating-rate USD-denominated debt from emerging markets.
S&P/LSTA U.S. Leveraged Loan 100 Index
This index is designed to reflect the performance of the largest facilities in the floating-rate bank loan, or senior loan, market.
S&P National AMT-Free Municipal Bond Index
This index is a broad, comprehensive, market-value-weighted index designed to measure the performance of the investment-grade U.S. municipal bonds that are exempt from the Alternative Minimum Tax.
S&P California AMT-Free Municipal Bond Index
This index is designed to measure the performance of the investment-grade California municipal bonds that are exempt from the Alternative Minimum Tax.
S&P New York AMT-Free Municipal Bond Index
This index is designed to measure the performance of the investment-grade New York bonds that are exempt from the alternative minimum tax.
SPIVA U.S. Scorecard Year-End 2015
RESEARCH 27
INDEX RESEARCH & DESIGN CONTACT INFORMATION
Global Head Charles Mounts [email protected] New York Phillip Brzenk [email protected] Qing Li [email protected] Berlinda Liu [email protected] Aye Soe [email protected] Peter Tsui [email protected] Hong Xie [email protected] Kelly Tang [email protected] Beijing Liyu Zeng [email protected] Hong Kong Priscilla Luk [email protected] London Sunjiv Mainie [email protected] Daniel Ung [email protected] Mexico City Maria Sanchez [email protected] Mumbai Utkarsh Agrawal [email protected]
SPIVA U.S. Scorecard Year-End 2015
RESEARCH 28
ABOUT S&P DOW JONES INDICES S&P Dow Jones Indices LLC, a division of S&P Global, is the world’s largest, global resource for index-based concepts, data and research. Home to iconic financial market indicators, such as the S&P 500® and the Dow Jones Industrial AverageTM, S&P Dow Jones Indices LLC has over 115 years of experience constructing innovative and transparent solutions that fulfill the needs of institutional and retail investors. More assets are invested in products based upon our indices than any other provider in the world. With over 1,000,000 indices covering a wide range of assets classes across the globe, S&P Dow Jones Indices LLC defines the way investors measure and trade the markets. To learn more about our company, please visit www.spdji.com.
SPIVA U.S. Scorecard Year-End 2015
RESEARCH 29
GENERAL DISCLAIMER Copyright © 2016 S&P Dow Jones Indices LLC, a division of S&P Global. All rights reserved. STANDARD & POOR’S, S&P, SPDR, S&P 500, S&P EUROPE 350, S&P 100, S&P 1000, S&P COMPOSITE 1500, S&P MIDCAP 400, S&P SMALLCAP 600, GIVI, GLOBAL TITANS, S&P RISK CONTROL INDICES, S&P GLOBAL THEMATIC INDICES, S&P TARGET DATE INDICES, S&P TARGET RISK INDICES, DIVIDEND ARISTOCRATS, STARS, GICS, HOUSINGVIEWS, INDEX ALERT, INDEXOLOGY, MARKET ATTRIBUTES, PRACTICE ESSENTIALS, S&P HEALTHCARE MONITOR, SPICE, and SPIVA are registered trademarks of Standard & Poor’s Financial Services LLC, a division of S&P Global (“S&P”). DOW JONES, DJ, DJIA and DOW JONES INDUSTRIAL AVERAGE are registered trademarks of Dow Jones Trademark Holdings LLC (“Dow Jones”). These trademarks together with others have been licensed to S&P Dow Jones Indices LLC. Redistribution, reproduction and/or photocopying in whole or in part are prohibited without written permission. This document does not constitute an offer of services in jurisdictions where S&P Dow Jones Indices LLC, Dow Jones, S&P or their respective affiliates (collectively “S&P Dow Jones Indices”) do not have the necessary licenses. All information provided by S&P Dow Jones Indices is impersonal and not tailored to the needs of any person, entity or group of persons. S&P Dow Jones Indices receives compensation in connection with licensing its indices to third parties. Past performance of an index is not a guarantee of future results.
It is not possible to invest directly in an index. Exposure to an asset class represented by an index is available through investable instruments based on that index. S&P Dow Jones Indices does not sponsor, endorse, sell, promote or manage any investment fund or other investment vehicle that is offered by third parties and that seeks to provide an investment return based on the performance of any index. S&P Dow Jones Indices makes no assurance that investment products based on the index will accurately track index performance or provide positive investment returns. S&P Dow Jones Indices LLC is not an investment advisor, and S&P Dow Jones Indices makes no representation regarding the advisability of investing in any such investment fund or other investment vehicle. A decision to invest in any such investment fund or other investment vehicle should not be made in reliance on any of the statements set forth in this document. Prospective investors are advised to make an investment in any such fund or other vehicle only after carefully considering the risks associated with investing in such funds, as detailed in an offering memorandum or similar document that is prepared by or on behalf of the issuer of the investment fund or other investment product or vehicle. S&P Dow Jones Indices LLC is not a tax advisor. A tax advisor should be consulted to evaluate the impact of any tax-exempt securities on portfolios and the tax consequences of making any particular investment decision. Inclusion of a security within an index is not a recommendation by S&P Dow Jones Indices to buy, sell, or hold such security, nor is it considered to be investment advice. Closing prices for S&P Dow Jones Indices’ US benchmark indices are calculated by S&P Dow Jones Indices based on the closing price of the individual constituents of the index as set by their primary exchange. Closing prices are received by S&P Dow Jones Indices from one of its third party vendors and verified by comparing them with prices from an alternative vendor. The vendors receive the closing price from the primary exchanges. Real-time intraday prices are calculated similarly without a second verification.
These materials have been prepared solely for informational purposes based upon information generally available to the public and from sources believed to be reliable. No content contained in these materials (including index data, ratings, credit-related analyses and data, research, valuations, model, software or other application or output therefrom) or any part thereof (“Content”) may be modified, reverse-engineered, reproduced or distributed in any form or by any means, or stored in a database or retrieval system, without the prior written permission of S&P Dow Jones Indices. The Content shall not be used for any unlawful or unauthorized purposes. S&P Dow Jones Indices and its third-party data providers and licensors (collectively “S&P Dow Jones Indices Parties”) do not guarantee the accuracy, completeness, timeliness or availability of the Content. S&P Dow Jones Indices Parties are not responsible for any errors or omissions, regardless of the cause, for the results obtained from the use of the Content. THE CONTENT IS PROVIDED ON AN “AS IS” BASIS. S&P DOW JONES INDICES PARTIES DISCLAIM ANY AND ALL EXPRESS OR IMPLIED WARRANTIES, INCLUDING, BUT NOT LIMITED TO, ANY WARRANTIES OF MERCHANTABILITY OR FITNESS FOR A PARTICULAR PURPOSE OR USE, FREEDOM FROM BUGS, SOFTWARE ERRORS OR DEFECTS, THAT THE CONTENT’S FUNCTIONING WILL BE UNINTERRUPTED OR THAT THE CONTENT WILL OPERATE WITH ANY SOFTWARE OR HARDWARE CONFIGURATION. In no event shall S&P Dow Jones Indices Parties be liable to any party for any direct, indirect, incidental, exemplary, compensatory, punitive, special or consequential damages, costs, expenses, legal fees, or losses (including, without limitation, lost income or lost profits and opportunity costs) in connection with any use of the Content even if advised of the possibility of such damages.
Credit-related information and other analyses, including ratings, research and valuations are generally provided by licensors and/or affiliates of S&P Dow Jones Indices, including but not limited to S&P Global’s other divisions such as Standard & Poor’s Financial Services LLC and S&P Capital IQ LLC. Any credit-related information and other related analyses and statements in the Content are statements of opinion as of the date they are expressed and not statements of fact. Any opinion, analyses and rating acknowledgement decisions are not recommendations to purchase, hold, or sell any securities or to make any investment decisions, and do not address the suitability of any security. S&P Dow Jones Indices does not assume any obligation to update the Content following publication in any form or format. The Content should not be relied on and is not a substitute for the skill, judgment and experience of the user, its management, employees, advisors and/or clients when making investment and other business decisions. S&P Dow Jones Indices LLC does not act as a fiduciary or an investment advisor. While S&P Dow Jones Indices has obtained information from sources they believe to be reliable, S&P Dow Jones Indices does not perform an audit or undertake any duty of due diligence or independent verification of any information it receives.
To the extent that regulatory authorities allow a rating agency to acknowledge in one jurisdiction a rating issued in another jurisdiction for certain regulatory purposes, S&P Global Ratings Services reserves the right to assign, withdraw or suspend such acknowledgement at any time and in its sole discretion. S&P Dow Jones Indices, including S&P Global Ratings Services, disclaim any duty whatsoever
SPIVA U.S. Scorecard Year-End 2015
RESEARCH 30
arising out of the assignment, withdrawal or suspension of an acknowledgement as well as any liability for any damage alleged to have been suffered on account thereof.
Affiliates of S&P Dow Jones Indices LLC, including S&P Global Ratings Services, may receive compensation for its ratings and certain credit-related analyses, normally from issuers or underwriters of securities or from obligors. Such affiliates of S&P Dow Jones Indices LLC, including S&P Global Ratings Services, reserve the right to disseminate its opinions and analyses. Public ratings and analyses from S&P Global Ratings Services are made available on its Web sites, www.standardandpoors.com (free of charge), and www.ratingsdirect.com and www.globalcreditportal.com (subscription), and may be distributed through other means, including via S&P Global Rating Services publications and third-party redistributors. Additional information about our ratings fees is available at www.standardandpoors.com/usratingsfees.
S&P Global keeps certain activities of its various divisions and business units separate from each other in order to preserve the independence and objectivity of their respective activities. As a result, certain divisions and business units of S&P Global may have information that is not available to other business units. S&P Global has established policies and procedures to maintain the confidentiality of certain non-public information received in connection with each analytical process.
In addition, S&P Dow Jones Indices provides a wide range of services to, or relating to, many organizations, including issuers of securities, investment advisers, broker-dealers, investment banks, other financial institutions and financial intermediaries, and accordingly may receive fees or other economic benefits from those organizations, including organizations whose securities or services they may recommend, rate, include in model portfolios, evaluate or otherwise address.
The Global Industry Classification Standard (GICS®) was developed by and is the exclusive property and a trademark of Standard & Poor’s and MSCI. Neither MSCI, Standard & Poor’s nor any other party involved in making or compiling any GICS classifications makes any express or implied warranties or representations with respect to such standard or classification (or the results to be obtained by the use thereof), and all such parties hereby expressly disclaim all warranties of originality, accuracy, completeness, merchantability or fitness for a particular purpose with respect to any of such standard or classification. Without limiting any of the foregoing, in no event shall MSCI, Standard & Poor’s, any of their affiliates or any third party involved in making or compiling any GICS classifications have any liability for any direct, indirect, special, punitive, consequential or any other damages (including lost profits) even if notified of the possibility of such damages.
TSX is a trademark of TSX, Inc. and has been licensed for use by S&P Dow Jones Indices. RAFI is a trademark of Research Affiliates, LLC and has been licensed for use by S&P Dow Jones Indices. CASE-SHILLER is a registered trademark of CoreLogic Case-Shiller, LLC and has been licensed for use by S&P Dow Jones Indices. LSTA is a trademark of Loan Syndications and Trading Association, Inc. and has been licensed for use by S&P Dow Jones Indices. VIX is a trademark of Chicago Board Options Exchange, Incorporated and has been licensed for use by S&P Dow Jones Indices. BVL is a trademark of Bolsa de Valores de Lima S.A. and has been licensed for use by S&P Dow Jones Indices. VALMER is a trademark of Bolsa Mexicana de Valores, S.A.B. de C.V. and has been licensed for use by S&P Dow Jones Indices. NZX is a trademark of NZX Limited and has been licensed for use by S&P Dow Jones Indices. ISDA is a trademark of the International Swaps & Derivatives Association, Inc. and has been licensed for use by S&P Dow Jones Indices. GSCI is a registered trademark of The Goldman Sachs Group, Inc. (“Goldman”) and has been licensed for use by S&P Dow Jones Indices. The S&P GSCI index is not created, owned, endorsed, sponsored, sold or promoted by Goldman or its affiliates and Goldman bears no liability with respect to such index or data related thereto. Goldman provides no guarantee as to the accuracy and/or the completeness of the S&P GSCI index or any data related thereto.
All trade names, trademarks and service marks, and attendant goodwill, now owned by Citigroup Index LLC or any of its affiliates and used in connection with the S&P/Citigroup International Treasury Bond (Ex-US) Indices shall remain its or its affiliates’ respective sole property, and all rights accruing from their use shall inure solely to the benefit of Citigroup Index LLC or any of its affiliates.
IN NO EVENT WHATSOEVER SHALL CITIGROUP INDEX LLC OR ANY OF ITS AFFILIATES BE LIABLE WITH RESPECT TO SUCH INDICES FOR ANY DIRECT, INDIRECT, SPECIAL, INCIDENTAL, PUNITIVE OR CONSEQUENTIAL DAMAGES, INCLUDING BUT NOT LIMITED TO, LOSS OF PROFITS, LOST TIME OR GOODWILL, EVEN IF IT THEY HAVE BEEN ADVISED OF THE POSSIBILITY OF SUCH DAMAGES, REGARDLESS OF THE FORM OF ACTION, WHETHER IN CONTRACT, TORT (INCLUDING NEGLIGENCE), STRICT LIABILITY OR OTHERWISE.
Brookfield Redding, Inc. and/or its affiliates (including but not limited to Brookfield Asset Management Inc., collectively “Co-Publisher”) own certain intellectual property rights with respect to the Dow Jones Brookfield Infrastructure Indexes, which rights have been licensed to S&P for use.
SAM Indexes Gmbh and/or its successors or affiliates (collectively, “SAM”) own certain intellectual property rights with respect to the Dow Jones Sustainability Indexes, which rights have been licensed to S&P for use.