s&p indices versus active funds (spiva ) scorecard · s&p indices versus active funds...
TRANSCRIPT
McGraw-Hill
S&P INDICES VERSUS ACTIVE FUNDS (SPIVA) SCORECARD
Summary
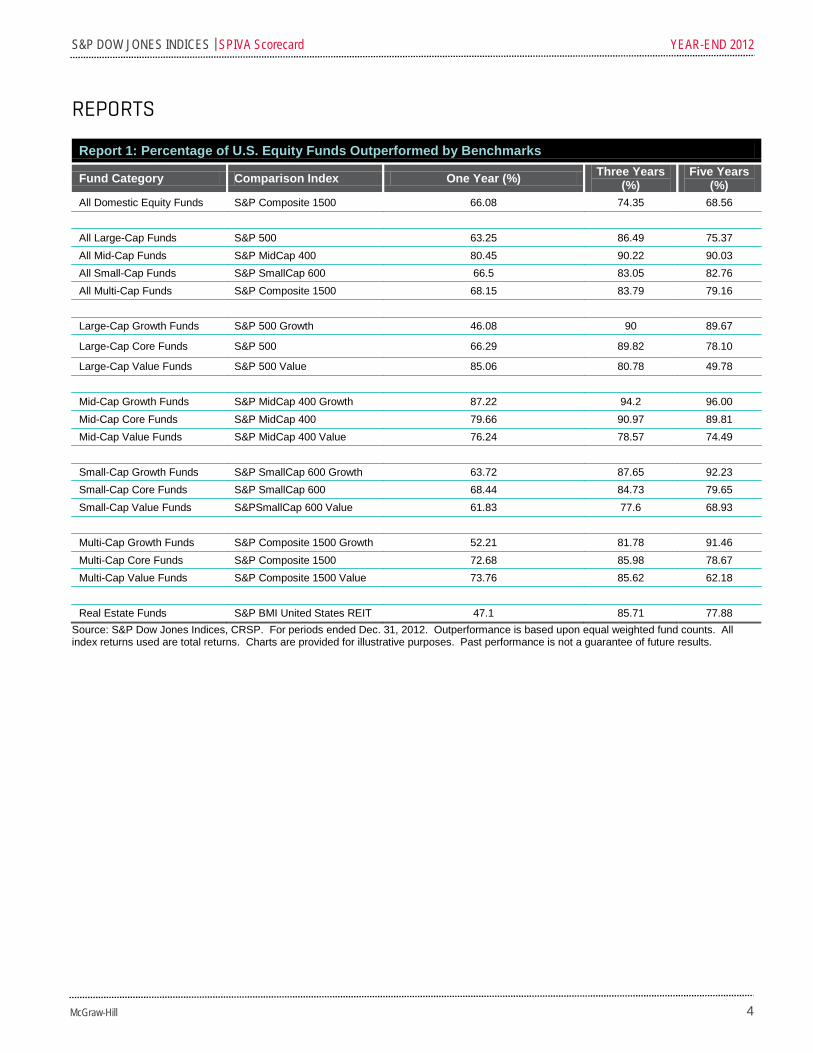
The year 2012 marked the return of the double digit gains across all the domestic and global equity benchmark indices. The gains passive indices made did not, however, translate into active management, as most active managers in all categories except large-cap growth and real estate funds underperformed their respective benchmarks in 2012. Performance lagged behind the benchmark indices for 63.25% of large-cap funds, 80.45% of mid-cap funds and 66.5% of small cap funds.
The performance figures are equally unfavorable for active funds when viewed over three- and five- year horizons. Managers across all domestic equity categories lagged behind the benchmarks over the three-year horizon. The five-year horizon yielded similar results, with large-cap value emerging as the only category that maintained performance parity relative to its benchmark.
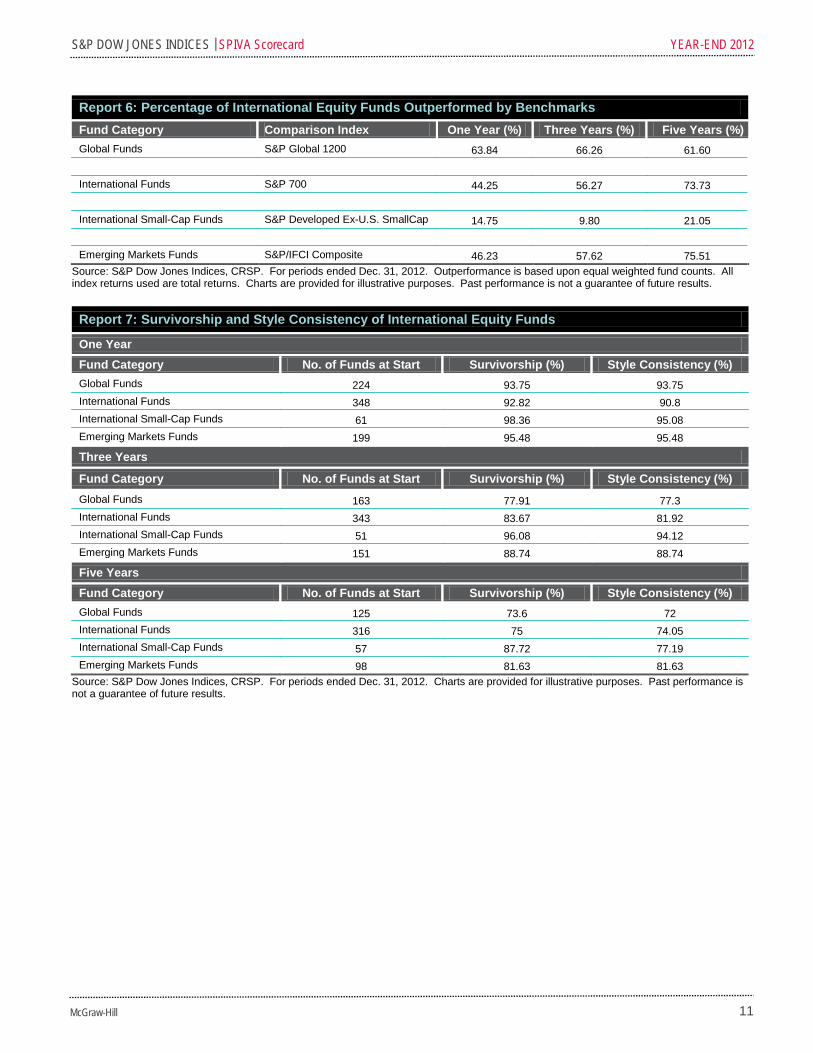
Among international equity categories, 66.26% of global funds, 56.27% of international funds and 57.62% of emerging markets funds were outperformed by benchmarks over the past three years. A large percentage of international small-cap funds, on the other hand, continue to outperform the benchmark regardless of the period being measured, indicating that active management opportunities are still present in this space.
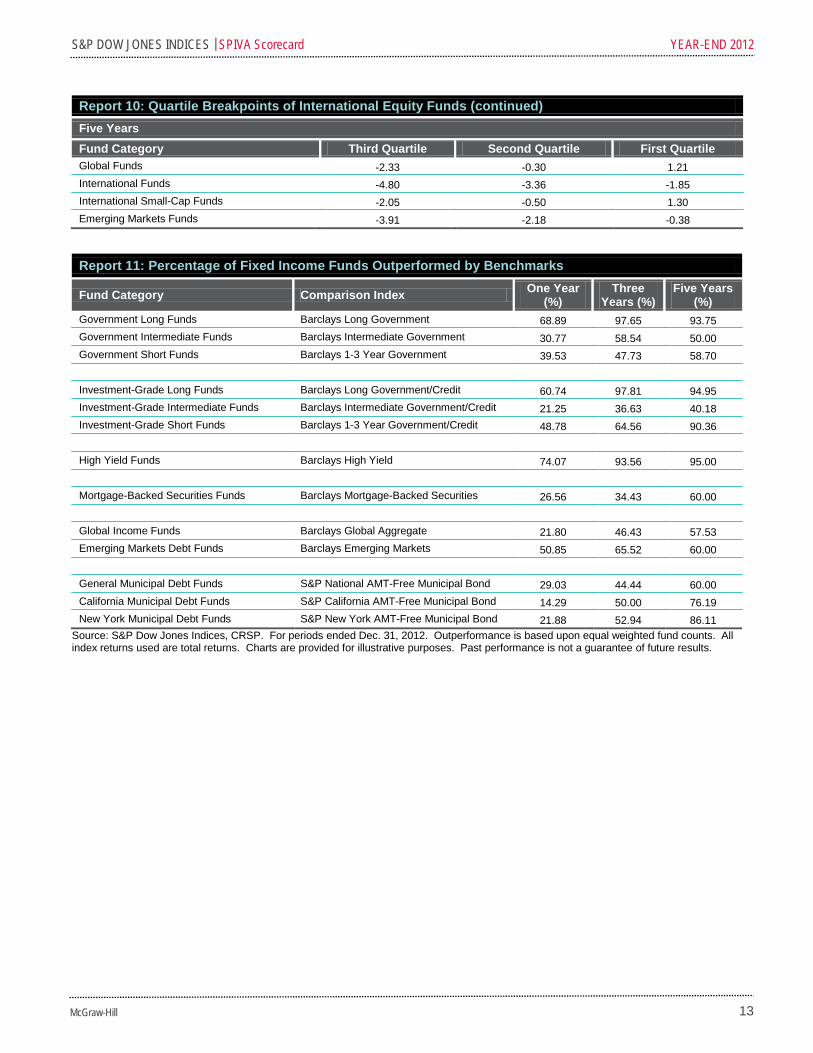
Actively managed fixed income funds fared better than their equity counterparts in 2012. Most fixed income funds outperformed their benchmark indices except for funds in the longer term government, longer term investment-grade and high-yield categories. The picture is less rosy, however, when viewed over the five-year period. Actively managed fixed income funds in nearly all the categories saw their performances lag behind the benchmark indices. To be fair, we note that bond benchmarks are not fully replicable. There are fewer index funds in these categories, and the index-based ETFs that are available are rather heavily optimized with occasionally high tracking errors.
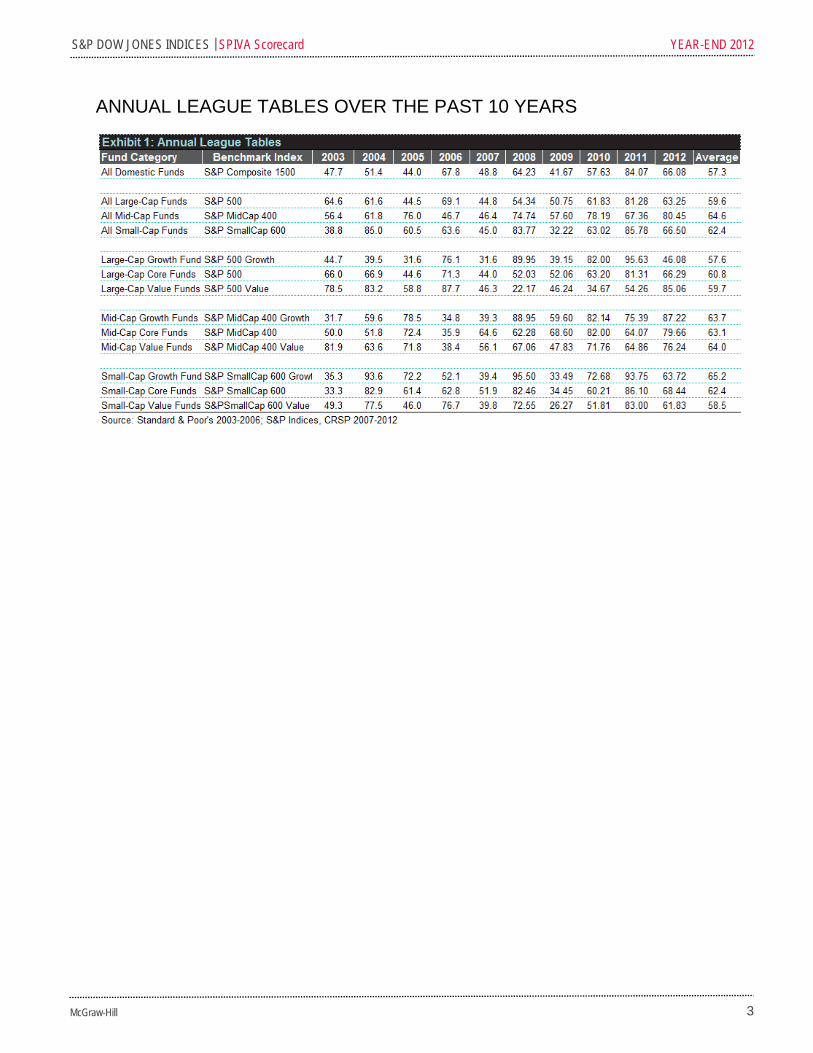
The annual league tables over the past 10 years demonstrate that short-term outcomes (such as one-year performance figures) of the index versus active debate are less consistent than longer-term outcomes.
The turmoil of the past five years saw nearly 27% of domestic equity funds, 23% of international equity funds and 18% of fixed income funds merge or liquidate.
Year-End 2012 Contributor: Aye Soe Director, Global Research & Design [email protected] Want more? Sign up to receive complimentary updates on a broad range of index-related topics and events brought to you by S&P Dow Jones Indices. www.spdji.com/spindices
S&P DOW JONES INDICES | SPIVA Scorecard YEAR-END 2012
2 McGraw-Hill
A UNIQUE SCORECARD FOR THE ACTIVE VERSUS PASSIVE DEBATE
There is nothing novel about the index versus active debate. It has been a contentious subject for decades, and there are a few strong believers on both sides, with the vast majority of investors falling somewhere in between. Since its inception over 10 years ago, the SPIVA Scorecard has served as the de facto scorekeeper of the active versus passive debate. Over the last decade, we have heard passionate arguments from believers in both camps when headline numbers have deviated from their beliefs. Beyond the SPIVA Scorecard’s widely cited headline numbers is a rich data set that addresses issues related to measurement techniques, universe composition and fund survivorship—which are less frequently discussed but often far more fascinating. These data sets are rooted in the fundamental principles of the SPIVA Scorecard that regular readers will be familiar with, including:
Survivorship bias correction: Many funds might be liquidated or merged during a period of
study. However, for someone making an investment decision at the beginning of the period, these funds are part of the opportunity set. Unlike other commonly available comparison reports, SPIVA Scorecards account for the entire opportunity set—not just the survivors—thereby eliminating survivorship bias.
Apples-to-apples comparison: Fund returns are often compared to popular benchmarks such as the S&P 500®, regardless of size or style classification. SPIVA Scorecards avoid this pitfall by measuring a fund's returns against the returns of a benchmark appropriate for that particular investment category.
Asset-weighted returns: Average returns for a fund group are often calculated using only equal weighting, which results in the returns of a USD 10 billion fund affecting the average in the same manner as the returns of a USD 10 million fund. An accurate representation of how investors fared in a particular period can be ascertained by calculating weighted average returns where each fund’s return is weighted by net assets. SPIVA Scorecards show both equal- and asset-weighted averages.
Style consistency: SPIVA Scorecards measure style consistency for each style category across different time horizons. Style consistency is an important metric because style drift (the tendency of funds to diverge from their initial investment categorization) can have an impact on asset allocation decisions.
Data cleaning: SPIVA Scorecards avoid double counting multiple share classes in all count-based calculations, using only the share class with greater assets. Since this is meant to be a scorecard for active managers, index funds, leveraged and inverse funds and other index-linked products are excluded.
S&P DOW JONES INDICES | SPIVA Scorecard YEAR-END 2012
3 McGraw-Hill
ANNUAL LEAGUE TABLES OVER THE PAST 10 YEARS
S&P DOW JONES INDICES | SPIVA Scorecard YEAR-END 2012
4 McGraw-Hill
REPORTS
Report 1: Percentage of U.S. Equity Funds Outperformed by Benchmarks
Fund Category Comparison Index One Year (%) Three Years (%)
Five Years (%)
All Domestic Equity Funds S&P Composite 1500 66.08
74.35 68.56 All Large-Cap Funds S&P 500 63.25 86.49 75.37 All Mid-Cap Funds S&P MidCap 400 80.45 90.22 90.03 All Small-Cap Funds S&P SmallCap 600 66.5 83.05 82.76 All Multi-Cap Funds S&P Composite 1500 68.15 83.79 79.16 Large-Cap Growth Funds S&P 500 Growth 46.08 90 89.67
Large-Cap Core Funds S&P 500 66.29 89.82 78.10
Large-Cap Value Funds S&P 500 Value 85.06 80.78 49.78 Mid-Cap Growth Funds S&P MidCap 400 Growth 87.22 94.2 96.00 Mid-Cap Core Funds S&P MidCap 400 79.66 90.97 89.81 Mid-Cap Value Funds S&P MidCap 400 Value 76.24 78.57 74.49 Small-Cap Growth Funds S&P SmallCap 600 Growth 63.72 87.65 92.23 Small-Cap Core Funds S&P SmallCap 600 68.44 84.73 79.65 Small-Cap Value Funds S&PSmallCap 600 Value 61.83 77.6 68.93 Multi-Cap Growth Funds S&P Composite 1500 Growth 52.21 81.78 91.46 Multi-Cap Core Funds S&P Composite 1500 72.68 85.98 78.67 Multi-Cap Value Funds S&P Composite 1500 Value 73.76 85.62 62.18 Real Estate Funds S&P BMI United States REIT 47.1 85.71 77.88
Source: S&P Dow Jones Indices, CRSP. For periods ended Dec. 31, 2012. Outperformance is based upon equal weighted fund counts. All index returns used are total returns. Charts are provided for illustrative purposes. Past performance is not a guarantee of future results.
S&P DOW JONES INDICES | SPIVA Scorecard YEAR-END 2012
5 McGraw-Hill
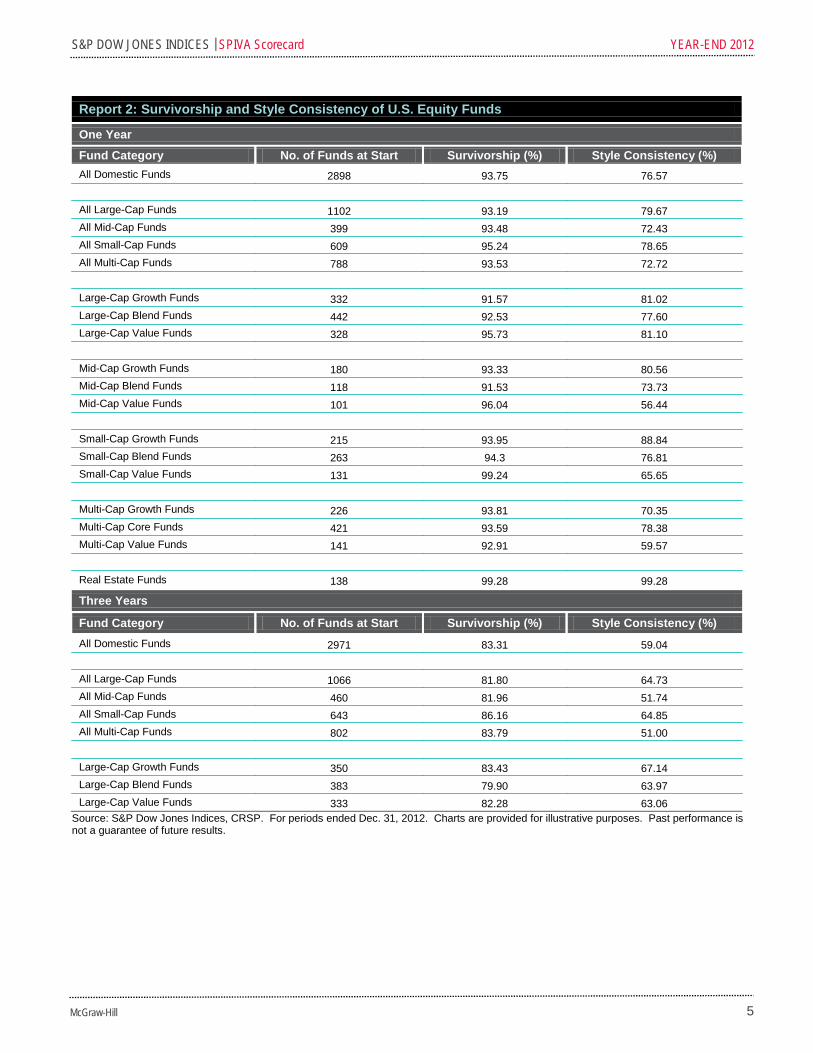
Report 2: Survivorship and Style Consistency of U.S. Equity Funds
One Year
Fund Category No. of Funds at Start Survivorship (%) Style Consistency (%) All Domestic Funds 2898 93.75 76.57 All Large-Cap Funds 1102 93.19 79.67 All Mid-Cap Funds 399 93.48 72.43 All Small-Cap Funds 609 95.24 78.65 All Multi-Cap Funds 788 93.53 72.72 Large-Cap Growth Funds 332 91.57 81.02 Large-Cap Blend Funds 442 92.53 77.60 Large-Cap Value Funds 328 95.73 81.10 Mid-Cap Growth Funds 180 93.33 80.56 Mid-Cap Blend Funds 118 91.53 73.73 Mid-Cap Value Funds 101 96.04 56.44 Small-Cap Growth Funds 215 93.95 88.84 Small-Cap Blend Funds 263 94.3 76.81 Small-Cap Value Funds 131 99.24 65.65 Multi-Cap Growth Funds 226 93.81 70.35 Multi-Cap Core Funds 421 93.59 78.38 Multi-Cap Value Funds 141 92.91 59.57 Real Estate Funds 138 99.28 99.28
Three Years
Fund Category No. of Funds at Start Survivorship (%) Style Consistency (%) All Domestic Funds 2971 83.31 59.04 All Large-Cap Funds 1066 81.80 64.73 All Mid-Cap Funds 460 81.96 51.74 All Small-Cap Funds 643 86.16 64.85 All Multi-Cap Funds 802 83.79 51.00 Large-Cap Growth Funds 350 83.43 67.14 Large-Cap Blend Funds 383 79.90 63.97 Large-Cap Value Funds 333 82.28 63.06
Source: S&P Dow Jones Indices, CRSP. For periods ended Dec. 31, 2012. Charts are provided for illustrative purposes. Past performance is not a guarantee of future results.
S&P DOW JONES INDICES | SPIVA Scorecard YEAR-END 2012
6 McGraw-Hill
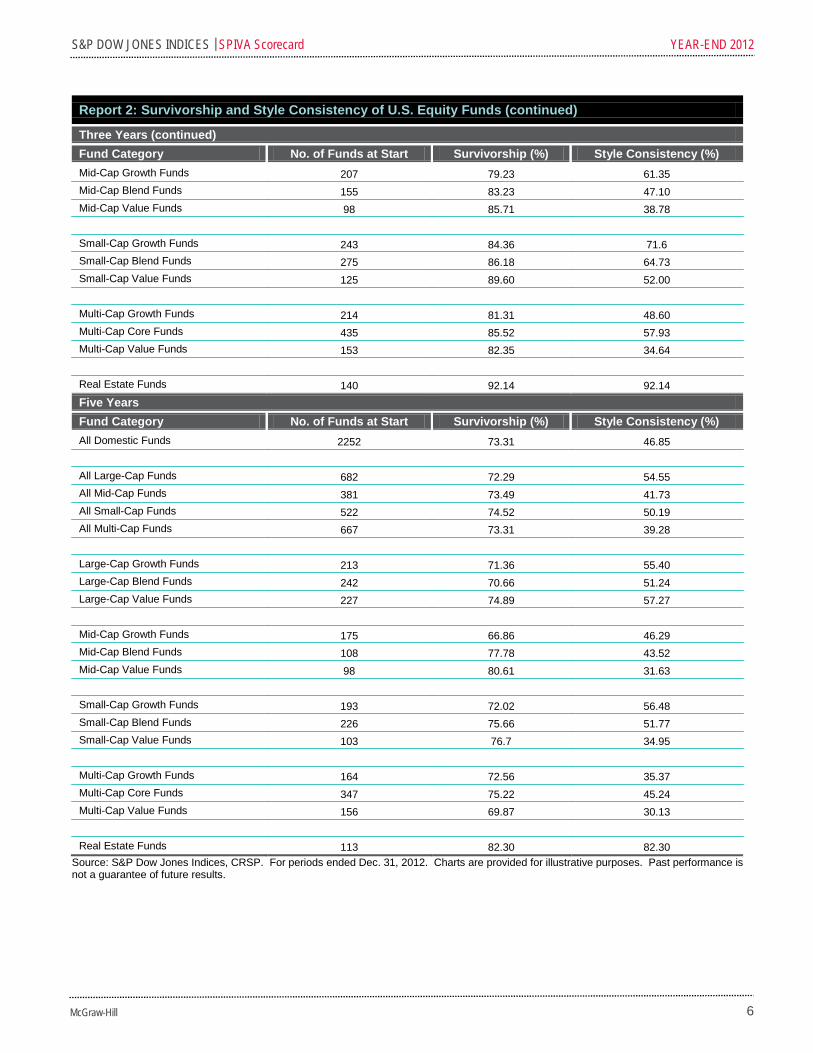
Report 2: Survivorship and Style Consistency of U.S. Equity Funds (continued)
Three Years (continued) Fund Category No. of Funds at Start Survivorship (%) Style Consistency (%) Mid-Cap Growth Funds 207 79.23 61.35 Mid-Cap Blend Funds 155 83.23 47.10 Mid-Cap Value Funds 98 85.71 38.78 Small-Cap Growth Funds 243 84.36 71.6 Small-Cap Blend Funds 275 86.18 64.73 Small-Cap Value Funds 125 89.60 52.00 Multi-Cap Growth Funds 214 81.31 48.60 Multi-Cap Core Funds 435 85.52 57.93 Multi-Cap Value Funds 153 82.35 34.64 Real Estate Funds 140 92.14 92.14 Five Years Fund Category No. of Funds at Start Survivorship (%) Style Consistency (%) All Domestic Funds 2252 73.31 46.85 All Large-Cap Funds 682 72.29 54.55 All Mid-Cap Funds 381 73.49 41.73 All Small-Cap Funds 522 74.52 50.19 All Multi-Cap Funds 667 73.31 39.28 Large-Cap Growth Funds 213 71.36 55.40 Large-Cap Blend Funds 242 70.66 51.24 Large-Cap Value Funds 227 74.89 57.27 Mid-Cap Growth Funds 175 66.86 46.29 Mid-Cap Blend Funds 108 77.78 43.52 Mid-Cap Value Funds 98 80.61 31.63 Small-Cap Growth Funds 193 72.02 56.48 Small-Cap Blend Funds 226 75.66 51.77 Small-Cap Value Funds 103 76.7 34.95 Multi-Cap Growth Funds 164 72.56 35.37 Multi-Cap Core Funds 347 75.22 45.24 Multi-Cap Value Funds 156 69.87 30.13 Real Estate Funds 113 82.30 82.30
Source: S&P Dow Jones Indices, CRSP. For periods ended Dec. 31, 2012. Charts are provided for illustrative purposes. Past performance is not a guarantee of future results.
S&P DOW JONES INDICES | SPIVA Scorecard YEAR-END 2012
7 McGraw-Hill
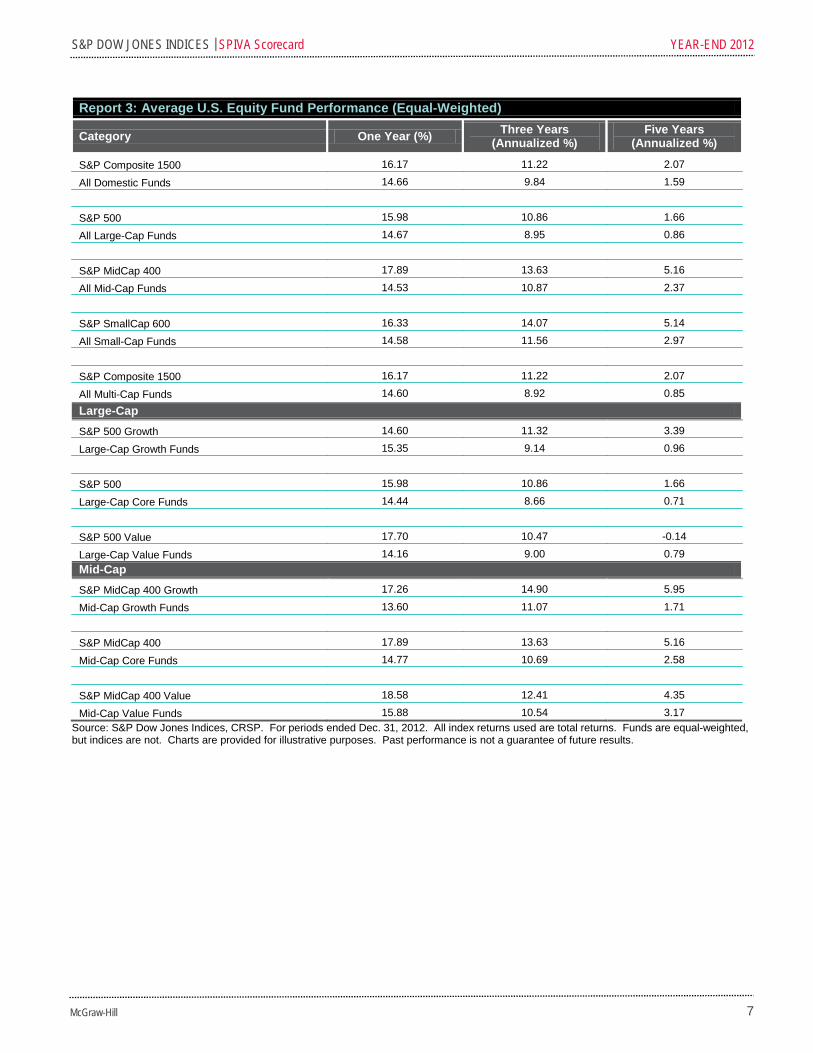
Report 3: Average U.S. Equity Fund Performance (Equal-Weighted)
Category One Year (%) Three Years (Annualized %)
Five Years (Annualized %)
S&P Composite 1500 16.17 11.22 2.07
All Domestic Funds 14.66 9.84 1.59
S&P 500 15.98 10.86 1.66
All Large-Cap Funds 14.67 8.95 0.86
S&P MidCap 400 17.89 13.63 5.16
All Mid-Cap Funds 14.53 10.87 2.37
S&P SmallCap 600 16.33 14.07 5.14
All Small-Cap Funds 14.58 11.56 2.97
S&P Composite 1500 16.17 11.22 2.07
All Multi-Cap Funds 14.60 8.92 0.85
Large-Cap S&P 500 Growth 14.60 11.32 3.39
Large-Cap Growth Funds 15.35 9.14 0.96
S&P 500 15.98 10.86 1.66
Large-Cap Core Funds 14.44 8.66 0.71
S&P 500 Value 17.70 10.47 -0.14
Large-Cap Value Funds 14.16 9.00 0.79 Mid-Cap S&P MidCap 400 Growth 17.26 14.90 5.95
Mid-Cap Growth Funds 13.60 11.07 1.71
S&P MidCap 400 17.89 13.63 5.16
Mid-Cap Core Funds 14.77 10.69 2.58
S&P MidCap 400 Value 18.58 12.41 4.35
Mid-Cap Value Funds 15.88 10.54 3.17 Source: S&P Dow Jones Indices, CRSP. For periods ended Dec. 31, 2012. All index returns used are total returns. Funds are equal-weighted, but indices are not. Charts are provided for illustrative purposes. Past performance is not a guarantee of future results.
S&P DOW JONES INDICES | SPIVA Scorecard YEAR-END 2012
8 McGraw-Hill
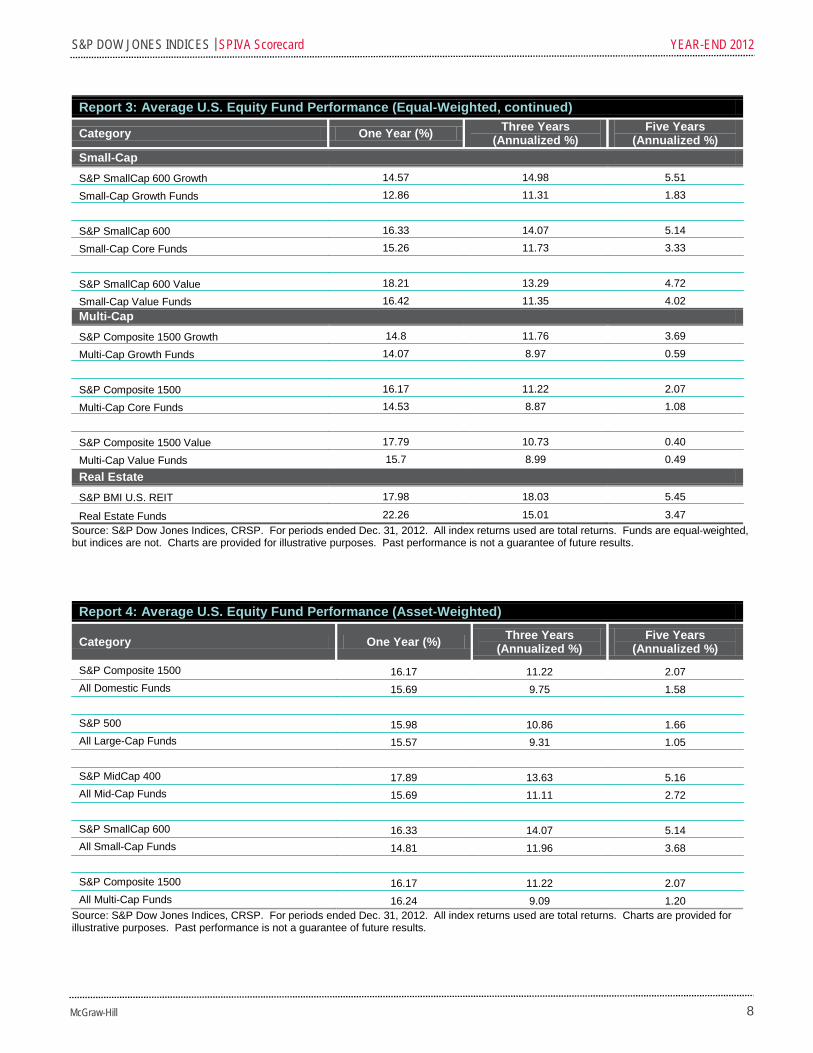
Report 3: Average U.S. Equity Fund Performance (Equal-Weighted, continued)
Category One Year (%) Three Years (Annualized %)
Five Years (Annualized %)
Small-Cap S&P SmallCap 600 Growth 14.57 14.98 5.51
Small-Cap Growth Funds 12.86 11.31 1.83
S&P SmallCap 600 16.33 14.07 5.14
Small-Cap Core Funds 15.26 11.73 3.33
S&P SmallCap 600 Value 18.21 13.29 4.72
Small-Cap Value Funds 16.42 11.35 4.02 Multi-Cap S&P Composite 1500 Growth 14.8 11.76 3.69
Multi-Cap Growth Funds 14.07 8.97 0.59
S&P Composite 1500 16.17 11.22 2.07
Multi-Cap Core Funds 14.53 8.87 1.08
S&P Composite 1500 Value 17.79 10.73 0.40
Multi-Cap Value Funds 15.7 8.99 0.49
Real Estate S&P BMI U.S. REIT 17.98 18.03 5.45
Real Estate Funds 22.26 15.01 3.47 Source: S&P Dow Jones Indices, CRSP. For periods ended Dec. 31, 2012. All index returns used are total returns. Funds are equal-weighted, but indices are not. Charts are provided for illustrative purposes. Past performance is not a guarantee of future results.
Report 4: Average U.S. Equity Fund Performance (Asset-Weighted)
Category One Year (%) Three Years (Annualized %)
Five Years (Annualized %)
S&P Composite 1500 16.17 11.22 2.07 All Domestic Funds 15.69 9.75 1.58 S&P 500 15.98 10.86 1.66 All Large-Cap Funds 15.57 9.31 1.05 S&P MidCap 400 17.89 13.63 5.16 All Mid-Cap Funds 15.69 11.11 2.72 S&P SmallCap 600 16.33 14.07 5.14 All Small-Cap Funds 14.81 11.96 3.68 S&P Composite 1500 16.17 11.22 2.07 All Multi-Cap Funds 16.24 9.09 1.20
Source: S&P Dow Jones Indices, CRSP. For periods ended Dec. 31, 2012. All index returns used are total returns. Charts are provided for illustrative purposes. Past performance is not a guarantee of future results.
S&P DOW JONES INDICES | SPIVA Scorecard YEAR-END 2012
9 McGraw-Hill
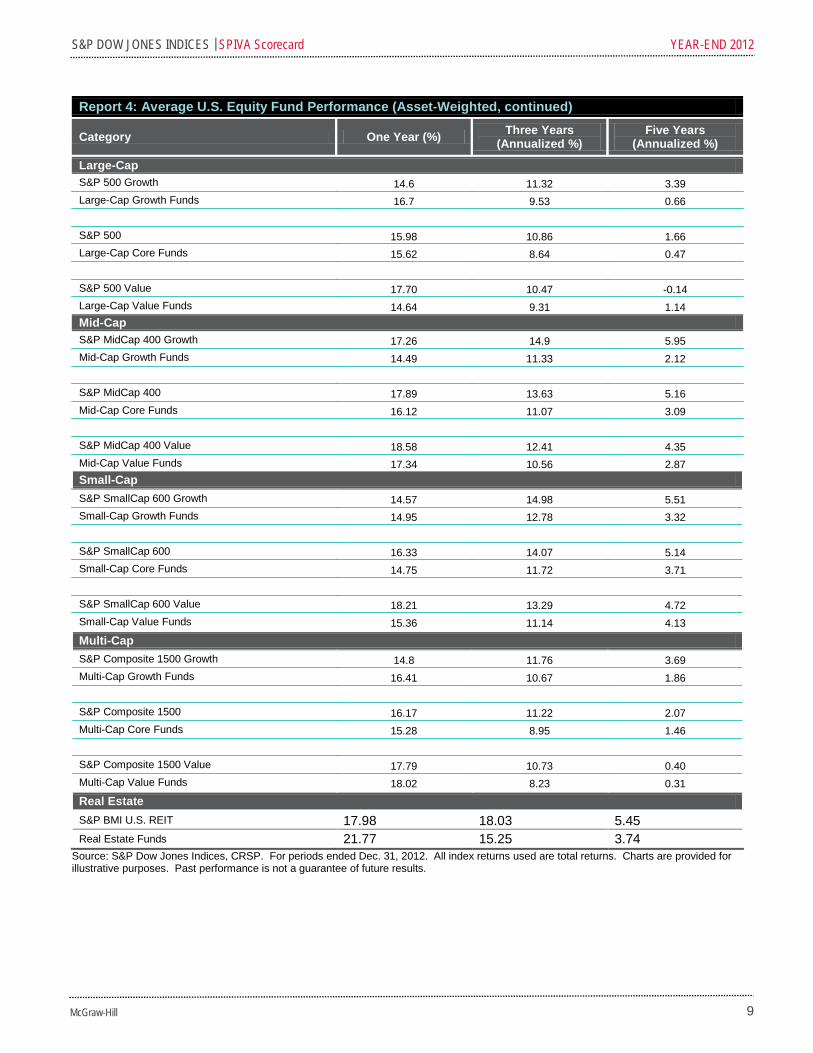
Report 4: Average U.S. Equity Fund Performance (Asset-Weighted, continued)
Category One Year (%) Three Years (Annualized %)
Five Years (Annualized %)
Large-Cap S&P 500 Growth 14.6 11.32 3.39 Large-Cap Growth Funds 16.7 9.53 0.66 S&P 500 15.98 10.86 1.66 Large-Cap Core Funds 15.62 8.64 0.47 S&P 500 Value 17.70 10.47 -0.14 Large-Cap Value Funds 14.64 9.31 1.14 Mid-Cap S&P MidCap 400 Growth 17.26 14.9 5.95 Mid-Cap Growth Funds 14.49 11.33 2.12 S&P MidCap 400 17.89 13.63 5.16 Mid-Cap Core Funds 16.12 11.07 3.09 S&P MidCap 400 Value 18.58 12.41 4.35 Mid-Cap Value Funds 17.34 10.56 2.87 Small-Cap S&P SmallCap 600 Growth 14.57 14.98 5.51 Small-Cap Growth Funds 14.95 12.78 3.32 S&P SmallCap 600 16.33 14.07 5.14 Small-Cap Core Funds 14.75 11.72 3.71 S&P SmallCap 600 Value 18.21 13.29 4.72 Small-Cap Value Funds 15.36 11.14 4.13
Multi-Cap S&P Composite 1500 Growth 14.8 11.76 3.69 Multi-Cap Growth Funds 16.41 10.67 1.86 S&P Composite 1500 16.17 11.22 2.07 Multi-Cap Core Funds 15.28 8.95 1.46 S&P Composite 1500 Value 17.79 10.73 0.40 Multi-Cap Value Funds 18.02 8.23 0.31
Real Estate S&P BMI U.S. REIT 17.98 18.03 5.45 Real Estate Funds 21.77 15.25 3.74
Source: S&P Dow Jones Indices, CRSP. For periods ended Dec. 31, 2012. All index returns used are total returns. Charts are provided for illustrative purposes. Past performance is not a guarantee of future results.
S&P DOW JONES INDICES | SPIVA Scorecard YEAR-END 2012
10 McGraw-Hill
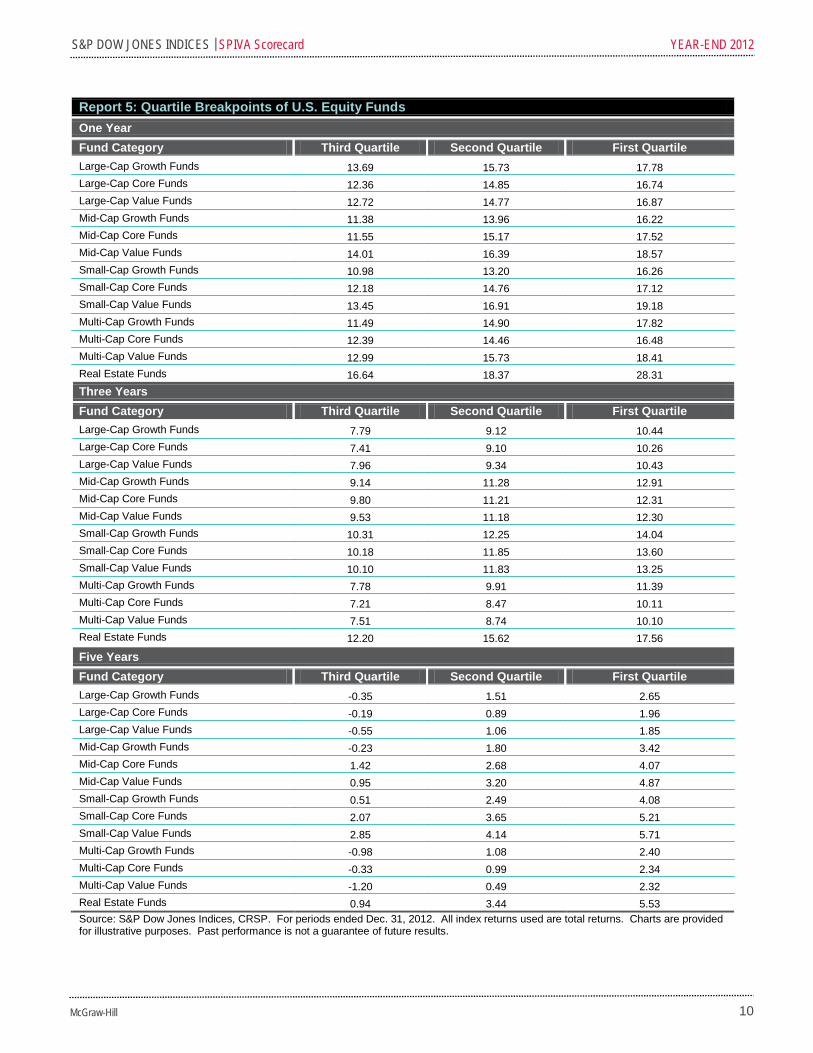
Report 5: Quartile Breakpoints of U.S. Equity Funds One Year Fund Category Third Quartile Second Quartile First Quartile Large-Cap Growth Funds 13.69 15.73 17.78 Large-Cap Core Funds 12.36 14.85 16.74 Large-Cap Value Funds 12.72 14.77 16.87 Mid-Cap Growth Funds 11.38 13.96 16.22 Mid-Cap Core Funds 11.55 15.17 17.52 Mid-Cap Value Funds 14.01 16.39 18.57 Small-Cap Growth Funds 10.98 13.20 16.26 Small-Cap Core Funds 12.18 14.76 17.12 Small-Cap Value Funds 13.45 16.91 19.18 Multi-Cap Growth Funds 11.49 14.90 17.82 Multi-Cap Core Funds 12.39 14.46 16.48 Multi-Cap Value Funds 12.99 15.73 18.41 Real Estate Funds 16.64 18.37 28.31 Three Years Fund Category Third Quartile Second Quartile First Quartile Large-Cap Growth Funds 7.79 9.12 10.44 Large-Cap Core Funds 7.41 9.10 10.26 Large-Cap Value Funds 7.96 9.34 10.43 Mid-Cap Growth Funds 9.14 11.28 12.91 Mid-Cap Core Funds 9.80 11.21 12.31 Mid-Cap Value Funds 9.53 11.18 12.30 Small-Cap Growth Funds 10.31 12.25 14.04 Small-Cap Core Funds 10.18 11.85 13.60 Small-Cap Value Funds 10.10 11.83 13.25 Multi-Cap Growth Funds 7.78 9.91 11.39 Multi-Cap Core Funds 7.21 8.47 10.11 Multi-Cap Value Funds 7.51 8.74 10.10 Real Estate Funds 12.20 15.62 17.56
Five Years Fund Category Third Quartile Second Quartile First Quartile Large-Cap Growth Funds -0.35 1.51 2.65 Large-Cap Core Funds -0.19 0.89 1.96 Large-Cap Value Funds -0.55 1.06 1.85 Mid-Cap Growth Funds -0.23 1.80 3.42 Mid-Cap Core Funds 1.42 2.68 4.07 Mid-Cap Value Funds 0.95 3.20 4.87 Small-Cap Growth Funds 0.51 2.49 4.08 Small-Cap Core Funds 2.07 3.65 5.21 Small-Cap Value Funds 2.85 4.14 5.71 Multi-Cap Growth Funds -0.98 1.08 2.40 Multi-Cap Core Funds -0.33 0.99 2.34 Multi-Cap Value Funds -1.20 0.49 2.32 Real Estate Funds 0.94 3.44 5.53 Source: S&P Dow Jones Indices, CRSP. For periods ended Dec. 31, 2012. All index returns used are total returns. Charts are provided for illustrative purposes. Past performance is not a guarantee of future results.
S&P DOW JONES INDICES | SPIVA Scorecard YEAR-END 2012
11 McGraw-Hill
Report 6: Percentage of International Equity Funds Outperformed by Benchmarks Fund Category Comparison Index One Year (%) Three Years (%) Five Years (%) Global Funds S&P Global 1200 63.84 66.26 61.60 International Funds S&P 700 44.25 56.27 73.73 International Small-Cap Funds S&P Developed Ex-U.S. SmallCap 14.75 9.80 21.05 Emerging Markets Funds S&P/IFCI Composite 46.23 57.62 75.51
Source: S&P Dow Jones Indices, CRSP. For periods ended Dec. 31, 2012. Outperformance is based upon equal weighted fund counts. All index returns used are total returns. Charts are provided for illustrative purposes. Past performance is not a guarantee of future results.
Report 7: Survivorship and Style Consistency of International Equity Funds
One Year Fund Category No. of Funds at Start Survivorship (%) Style Consistency (%) Global Funds 224 93.75 93.75 International Funds 348 92.82 90.8 International Small-Cap Funds 61 98.36 95.08 Emerging Markets Funds 199 95.48 95.48
Three Years
Fund Category No. of Funds at Start Survivorship (%) Style Consistency (%) Global Funds 163 77.91 77.3 International Funds 343 83.67 81.92 International Small-Cap Funds 51 96.08 94.12 Emerging Markets Funds 151 88.74 88.74
Five Years Fund Category No. of Funds at Start Survivorship (%) Style Consistency (%) Global Funds 125 73.6 72 International Funds 316 75 74.05 International Small-Cap Funds 57 87.72 77.19 Emerging Markets Funds 98 81.63 81.63
Source: S&P Dow Jones Indices, CRSP. For periods ended Dec. 31, 2012. Charts are provided for illustrative purposes. Past performance is not a guarantee of future results.
S&P DOW JONES INDICES | SPIVA Scorecard YEAR-END 2012
12 McGraw-Hill
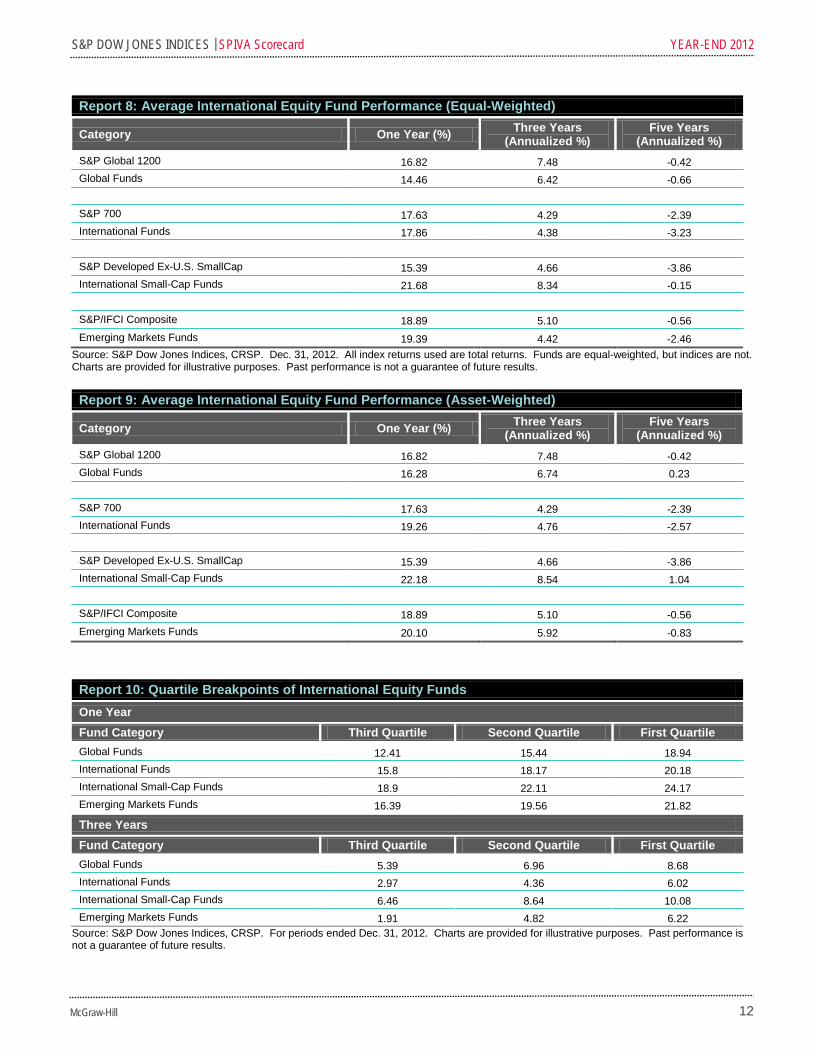
Report 8: Average International Equity Fund Performance (Equal-Weighted)
Category One Year (%) Three Years (Annualized %)
Five Years (Annualized %)
S&P Global 1200 16.82 7.48 -0.42 Global Funds 14.46 6.42 -0.66 S&P 700 17.63 4.29 -2.39 International Funds 17.86 4.38 -3.23 S&P Developed Ex-U.S. SmallCap 15.39 4.66 -3.86 International Small-Cap Funds 21.68 8.34 -0.15 S&P/IFCI Composite 18.89 5.10 -0.56 Emerging Markets Funds 19.39 4.42 -2.46
Source: S&P Dow Jones Indices, CRSP. Dec. 31, 2012. All index returns used are total returns. Funds are equal-weighted, but indices are not. Charts are provided for illustrative purposes. Past performance is not a guarantee of future results.
Report 9: Average International Equity Fund Performance (Asset-Weighted)
Category One Year (%) Three Years (Annualized %)
Five Years (Annualized %)
S&P Global 1200 16.82 7.48 -0.42 Global Funds 16.28 6.74 0.23 S&P 700 17.63 4.29 -2.39 International Funds 19.26 4.76 -2.57 S&P Developed Ex-U.S. SmallCap 15.39 4.66 -3.86 International Small-Cap Funds 22.18 8.54 1.04 S&P/IFCI Composite 18.89 5.10 -0.56 Emerging Markets Funds 20.10 5.92 -0.83
Report 10: Quartile Breakpoints of International Equity Funds One Year Fund Category Third Quartile Second Quartile First Quartile Global Funds 12.41 15.44 18.94 International Funds 15.8 18.17 20.18 International Small-Cap Funds 18.9 22.11 24.17 Emerging Markets Funds 16.39 19.56 21.82
Three Years Fund Category Third Quartile Second Quartile First Quartile Global Funds 5.39 6.96 8.68 International Funds 2.97 4.36 6.02 International Small-Cap Funds 6.46 8.64 10.08 Emerging Markets Funds 1.91 4.82 6.22
Source: S&P Dow Jones Indices, CRSP. For periods ended Dec. 31, 2012. Charts are provided for illustrative purposes. Past performance is not a guarantee of future results.
S&P DOW JONES INDICES | SPIVA Scorecard YEAR-END 2012
13 McGraw-Hill
Report 10: Quartile Breakpoints of International Equity Funds (continued) Five Years Fund Category Third Quartile Second Quartile First Quartile Global Funds -2.33 -0.30 1.21 International Funds -4.80 -3.36 -1.85 International Small-Cap Funds -2.05 -0.50 1.30 Emerging Markets Funds -3.91 -2.18 -0.38
Report 11: Percentage of Fixed Income Funds Outperformed by Benchmarks
Fund Category Comparison Index One Year (%)
Three Years (%)
Five Years (%)
Government Long Funds Barclays Long Government 68.89 97.65 93.75 Government Intermediate Funds Barclays Intermediate Government 30.77 58.54 50.00 Government Short Funds Barclays 1-3 Year Government 39.53 47.73 58.70 Investment-Grade Long Funds Barclays Long Government/Credit 60.74 97.81 94.95 Investment-Grade Intermediate Funds Barclays Intermediate Government/Credit 21.25 36.63 40.18 Investment-Grade Short Funds Barclays 1-3 Year Government/Credit 48.78 64.56 90.36 High Yield Funds Barclays High Yield 74.07 93.56 95.00 Mortgage-Backed Securities Funds Barclays Mortgage-Backed Securities 26.56 34.43 60.00 Global Income Funds Barclays Global Aggregate 21.80 46.43 57.53 Emerging Markets Debt Funds Barclays Emerging Markets 50.85 65.52 60.00 General Municipal Debt Funds S&P National AMT-Free Municipal Bond 29.03 44.44 60.00 California Municipal Debt Funds S&P California AMT-Free Municipal Bond 14.29 50.00 76.19 New York Municipal Debt Funds S&P New York AMT-Free Municipal Bond 21.88 52.94 86.11
Source: S&P Dow Jones Indices, CRSP. For periods ended Dec. 31, 2012. Outperformance is based upon equal weighted fund counts. All index returns used are total returns. Charts are provided for illustrative purposes. Past performance is not a guarantee of future results.
S&P DOW JONES INDICES | SPIVA Scorecard YEAR-END 2012
14 McGraw-Hill
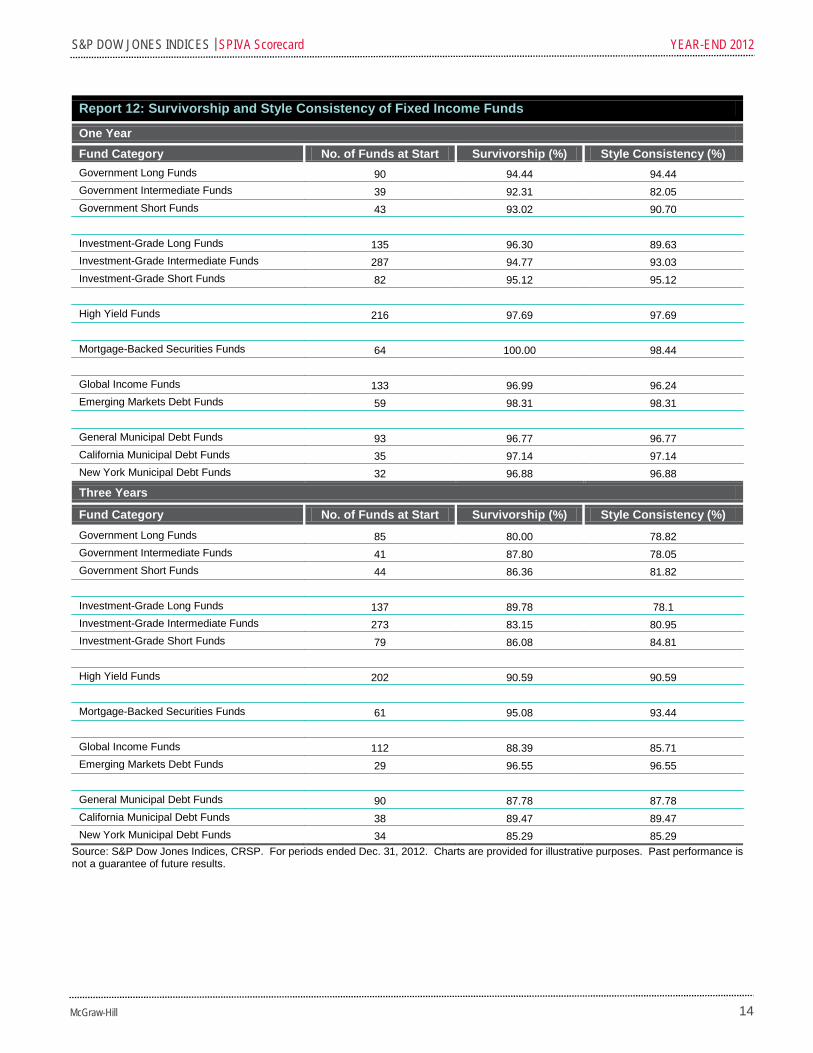
Report 12: Survivorship and Style Consistency of Fixed Income Funds
One Year Fund Category No. of Funds at Start Survivorship (%) Style Consistency (%) Government Long Funds 90 94.44 94.44 Government Intermediate Funds 39 92.31 82.05 Government Short Funds 43 93.02 90.70 Investment-Grade Long Funds 135 96.30 89.63 Investment-Grade Intermediate Funds 287 94.77 93.03 Investment-Grade Short Funds 82 95.12 95.12 High Yield Funds 216 97.69 97.69 Mortgage-Backed Securities Funds 64 100.00 98.44 Global Income Funds 133 96.99 96.24 Emerging Markets Debt Funds 59 98.31 98.31 General Municipal Debt Funds 93 96.77 96.77 California Municipal Debt Funds 35 97.14 97.14 New York Municipal Debt Funds 32 96.88 96.88
Three Years
Fund Category No. of Funds at Start Survivorship (%) Style Consistency (%) Government Long Funds 85 80.00 78.82 Government Intermediate Funds 41 87.80 78.05 Government Short Funds 44 86.36 81.82 Investment-Grade Long Funds 137 89.78 78.1 Investment-Grade Intermediate Funds 273 83.15 80.95 Investment-Grade Short Funds 79 86.08 84.81 High Yield Funds 202 90.59 90.59 Mortgage-Backed Securities Funds 61 95.08 93.44 Global Income Funds 112 88.39 85.71 Emerging Markets Debt Funds 29 96.55 96.55 General Municipal Debt Funds 90 87.78 87.78 California Municipal Debt Funds 38 89.47 89.47 New York Municipal Debt Funds 34 85.29 85.29
Source: S&P Dow Jones Indices, CRSP. For periods ended Dec. 31, 2012. Charts are provided for illustrative purposes. Past performance is not a guarantee of future results.
S&P DOW JONES INDICES | SPIVA Scorecard YEAR-END 2012
15 McGraw-Hill
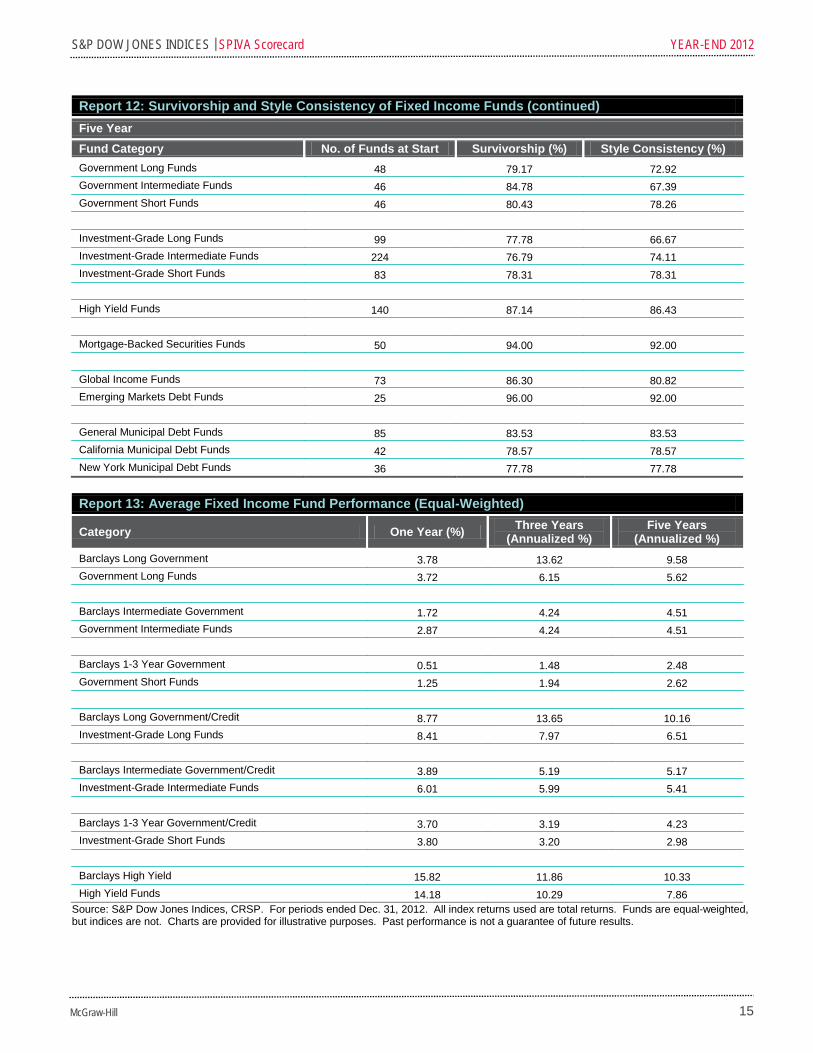
Report 12: Survivorship and Style Consistency of Fixed Income Funds (continued) Five Year Fund Category No. of Funds at Start Survivorship (%) Style Consistency (%) Government Long Funds 48 79.17 72.92 Government Intermediate Funds 46 84.78 67.39 Government Short Funds 46 80.43 78.26 Investment-Grade Long Funds 99 77.78 66.67 Investment-Grade Intermediate Funds 224 76.79 74.11 Investment-Grade Short Funds 83 78.31 78.31 High Yield Funds 140 87.14 86.43 Mortgage-Backed Securities Funds 50 94.00 92.00 Global Income Funds 73 86.30 80.82 Emerging Markets Debt Funds 25 96.00 92.00 General Municipal Debt Funds 85 83.53 83.53 California Municipal Debt Funds 42 78.57 78.57 New York Municipal Debt Funds 36 77.78 77.78
Report 13: Average Fixed Income Fund Performance (Equal-Weighted)
Category One Year (%) Three Years (Annualized %)
Five Years (Annualized %)
Barclays Long Government 3.78 13.62 9.58 Government Long Funds 3.72 6.15 5.62 Barclays Intermediate Government 1.72 4.24 4.51 Government Intermediate Funds 2.87 4.24 4.51 Barclays 1-3 Year Government 0.51 1.48 2.48 Government Short Funds 1.25 1.94 2.62 Barclays Long Government/Credit 8.77 13.65 10.16 Investment-Grade Long Funds 8.41 7.97 6.51 Barclays Intermediate Government/Credit 3.89 5.19 5.17 Investment-Grade Intermediate Funds 6.01 5.99 5.41 Barclays 1-3 Year Government/Credit 3.70 3.19 4.23 Investment-Grade Short Funds 3.80 3.20 2.98 Barclays High Yield 15.82 11.86 10.33 High Yield Funds 14.18 10.29 7.86
Source: S&P Dow Jones Indices, CRSP. For periods ended Dec. 31, 2012. All index returns used are total returns. Funds are equal-weighted, but indices are not. Charts are provided for illustrative purposes. Past performance is not a guarantee of future results.
S&P DOW JONES INDICES | SPIVA Scorecard YEAR-END 2012
16 McGraw-Hill
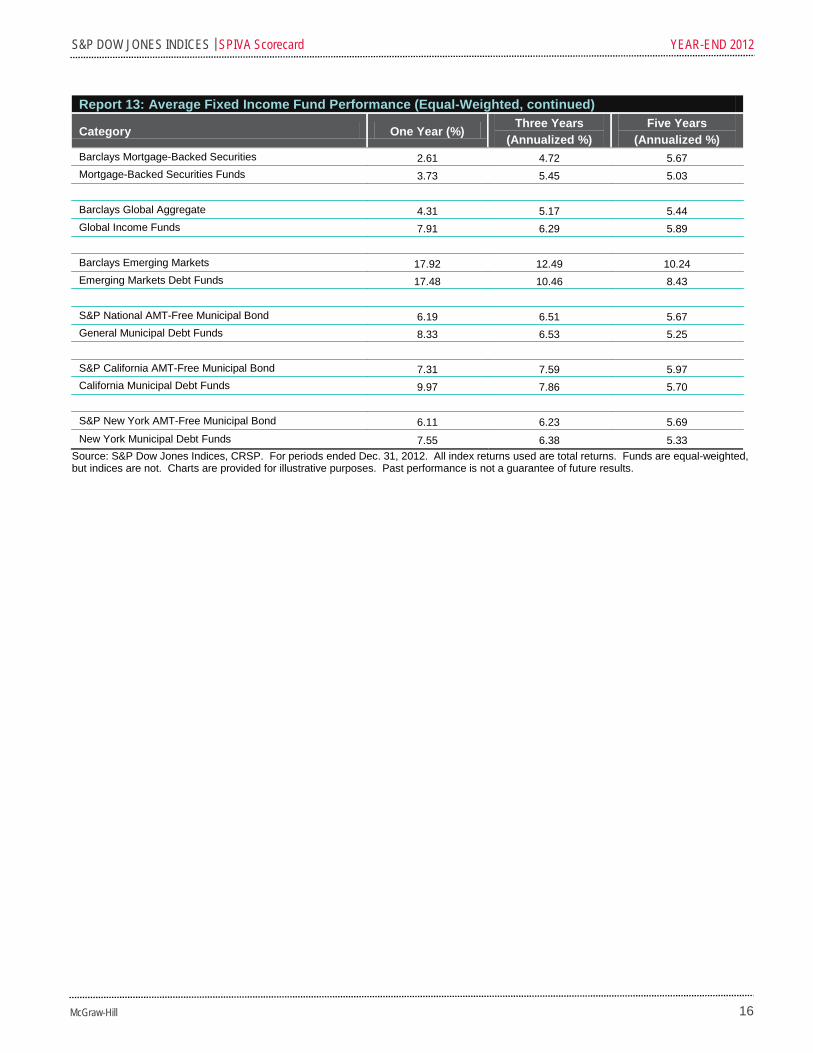
Report 13: Average Fixed Income Fund Performance (Equal-Weighted, continued)
Category One Year (%) Three Years (Annualized %)
Five Years (Annualized %)
Barclays Mortgage-Backed Securities 2.61 4.72 5.67 Mortgage-Backed Securities Funds 3.73 5.45 5.03 Barclays Global Aggregate 4.31 5.17 5.44 Global Income Funds 7.91 6.29 5.89 Barclays Emerging Markets 17.92 12.49 10.24 Emerging Markets Debt Funds 17.48 10.46 8.43 S&P National AMT-Free Municipal Bond 6.19 6.51 5.67 General Municipal Debt Funds 8.33 6.53 5.25 S&P California AMT-Free Municipal Bond 7.31 7.59 5.97 California Municipal Debt Funds 9.97 7.86 5.70 S&P New York AMT-Free Municipal Bond 6.11 6.23 5.69 New York Municipal Debt Funds 7.55 6.38 5.33
Source: S&P Dow Jones Indices, CRSP. For periods ended Dec. 31, 2012. All index returns used are total returns. Funds are equal-weighted, but indices are not. Charts are provided for illustrative purposes. Past performance is not a guarantee of future results.
S&P DOW JONES INDICES | SPIVA Scorecard YEAR-END 2012
17 McGraw-Hill
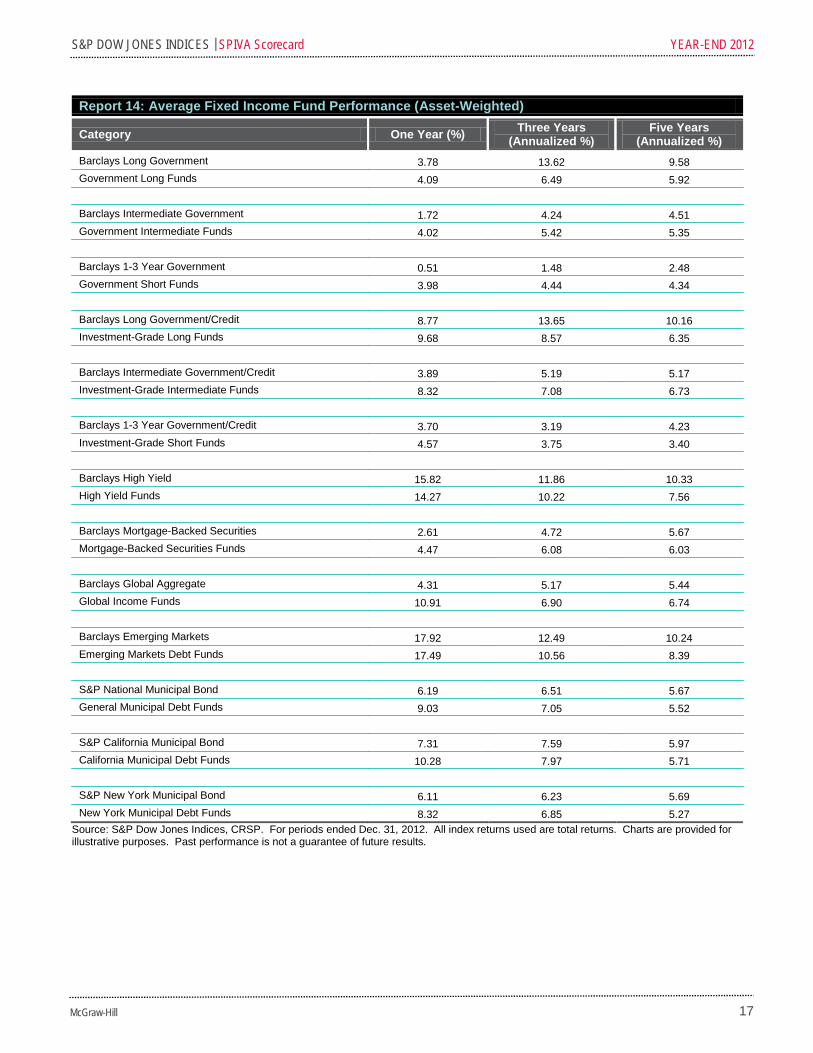
Report 14: Average Fixed Income Fund Performance (Asset-Weighted)
Category One Year (%) Three Years (Annualized %)
Five Years (Annualized %)
Barclays Long Government 3.78 13.62 9.58 Government Long Funds 4.09 6.49 5.92 Barclays Intermediate Government 1.72 4.24 4.51 Government Intermediate Funds 4.02 5.42 5.35 Barclays 1-3 Year Government 0.51 1.48 2.48 Government Short Funds 3.98 4.44 4.34 Barclays Long Government/Credit 8.77 13.65 10.16 Investment-Grade Long Funds 9.68 8.57 6.35 Barclays Intermediate Government/Credit 3.89 5.19 5.17 Investment-Grade Intermediate Funds 8.32 7.08 6.73 Barclays 1-3 Year Government/Credit 3.70 3.19 4.23 Investment-Grade Short Funds 4.57 3.75 3.40 Barclays High Yield 15.82 11.86 10.33 High Yield Funds 14.27 10.22 7.56 Barclays Mortgage-Backed Securities 2.61 4.72 5.67 Mortgage-Backed Securities Funds 4.47 6.08 6.03 Barclays Global Aggregate 4.31 5.17 5.44 Global Income Funds 10.91 6.90 6.74 Barclays Emerging Markets 17.92 12.49 10.24 Emerging Markets Debt Funds 17.49 10.56 8.39 S&P National Municipal Bond 6.19 6.51 5.67 General Municipal Debt Funds 9.03 7.05 5.52 S&P California Municipal Bond 7.31 7.59 5.97 California Municipal Debt Funds 10.28 7.97 5.71 S&P New York Municipal Bond 6.11 6.23 5.69 New York Municipal Debt Funds 8.32 6.85 5.27
Source: S&P Dow Jones Indices, CRSP. For periods ended Dec. 31, 2012. All index returns used are total returns. Charts are provided for illustrative purposes. Past performance is not a guarantee of future results.
S&P DOW JONES INDICES | SPIVA Scorecard YEAR-END 2012
18 McGraw-Hill
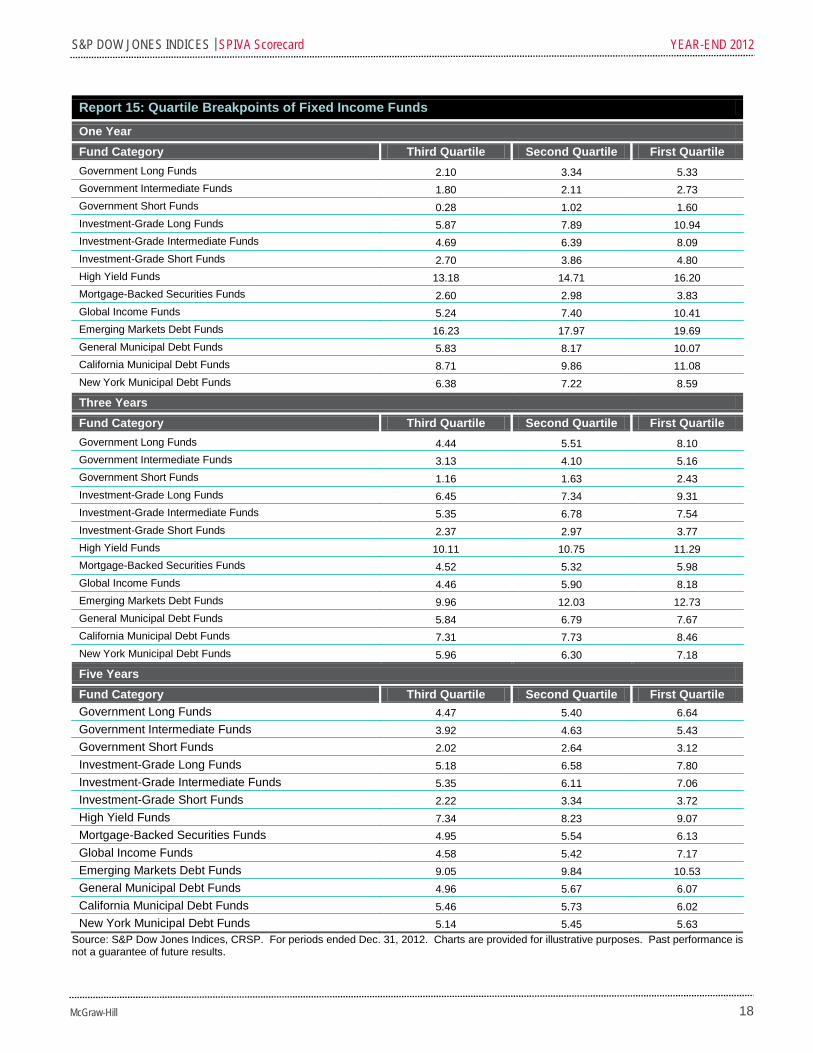
Report 15: Quartile Breakpoints of Fixed Income Funds
One Year Fund Category Third Quartile Second Quartile First Quartile Government Long Funds 2.10 3.34 5.33 Government Intermediate Funds 1.80 2.11 2.73 Government Short Funds 0.28 1.02 1.60 Investment-Grade Long Funds 5.87 7.89 10.94 Investment-Grade Intermediate Funds 4.69 6.39 8.09 Investment-Grade Short Funds 2.70 3.86 4.80 High Yield Funds 13.18 14.71 16.20 Mortgage-Backed Securities Funds 2.60 2.98 3.83 Global Income Funds 5.24 7.40 10.41 Emerging Markets Debt Funds 16.23 17.97 19.69 General Municipal Debt Funds 5.83 8.17 10.07 California Municipal Debt Funds 8.71 9.86 11.08 New York Municipal Debt Funds 6.38 7.22 8.59
Three Years Fund Category Third Quartile Second Quartile First Quartile Government Long Funds 4.44 5.51 8.10 Government Intermediate Funds 3.13 4.10 5.16 Government Short Funds 1.16 1.63 2.43 Investment-Grade Long Funds 6.45 7.34 9.31 Investment-Grade Intermediate Funds 5.35 6.78 7.54 Investment-Grade Short Funds 2.37 2.97 3.77 High Yield Funds 10.11 10.75 11.29 Mortgage-Backed Securities Funds 4.52 5.32 5.98 Global Income Funds 4.46 5.90 8.18 Emerging Markets Debt Funds 9.96 12.03 12.73 General Municipal Debt Funds 5.84 6.79 7.67 California Municipal Debt Funds 7.31 7.73 8.46 New York Municipal Debt Funds 5.96 6.30 7.18
Five Years Fund Category Third Quartile Second Quartile First Quartile Government Long Funds 4.47 5.40 6.64 Government Intermediate Funds 3.92 4.63 5.43 Government Short Funds 2.02 2.64 3.12 Investment-Grade Long Funds 5.18 6.58 7.80 Investment-Grade Intermediate Funds 5.35 6.11 7.06 Investment-Grade Short Funds 2.22 3.34 3.72 High Yield Funds 7.34 8.23 9.07 Mortgage-Backed Securities Funds 4.95 5.54 6.13 Global Income Funds 4.58 5.42 7.17 Emerging Markets Debt Funds 9.05 9.84 10.53 General Municipal Debt Funds 4.96 5.67 6.07 California Municipal Debt Funds 5.46 5.73 6.02 New York Municipal Debt Funds 5.14 5.45 5.63
Source: S&P Dow Jones Indices, CRSP. For periods ended Dec. 31, 2012. Charts are provided for illustrative purposes. Past performance is not a guarantee of future results.
S&P DOW JONES INDICES | SPIVA Scorecard YEAR-END 2012
19 McGraw-Hill
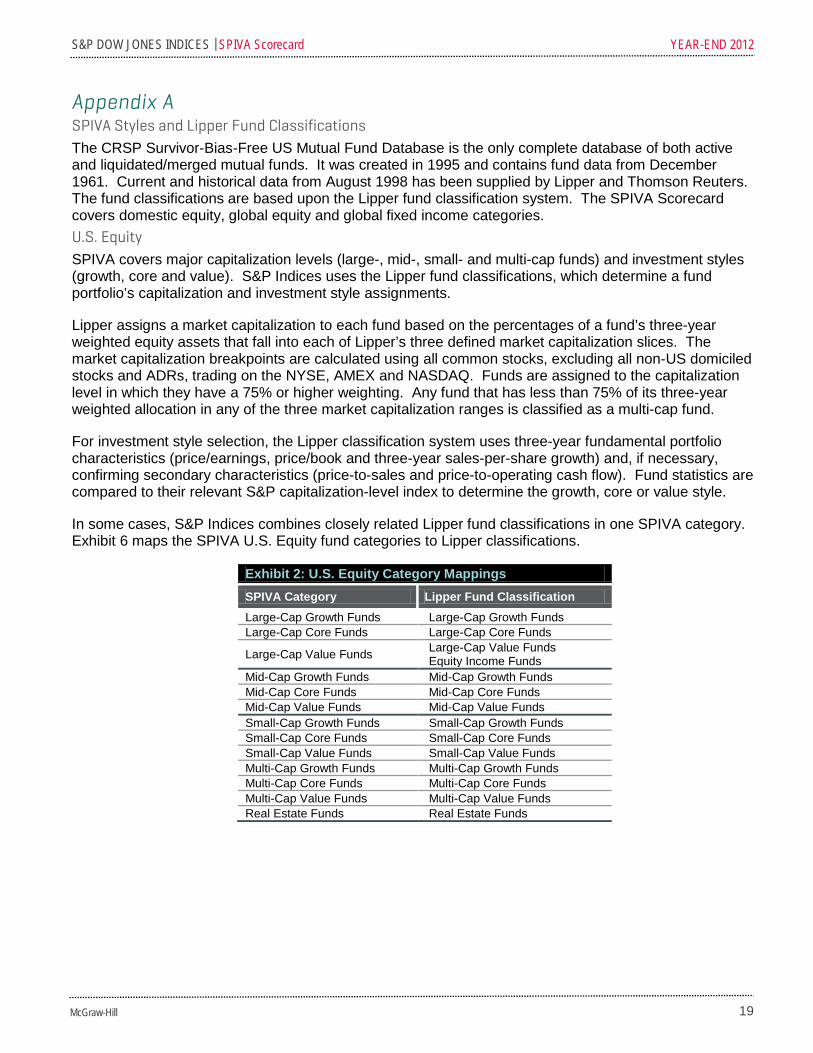
Appendix A SPIVA Styles and Lipper Fund Classifications The CRSP Survivor-Bias-Free US Mutual Fund Database is the only complete database of both active and liquidated/merged mutual funds. It was created in 1995 and contains fund data from December 1961. Current and historical data from August 1998 has been supplied by Lipper and Thomson Reuters. The fund classifications are based upon the Lipper fund classification system. The SPIVA Scorecard covers domestic equity, global equity and global fixed income categories. U.S. Equity SPIVA covers major capitalization levels (large-, mid-, small- and multi-cap funds) and investment styles (growth, core and value). S&P Indices uses the Lipper fund classifications, which determine a fund portfolio’s capitalization and investment style assignments. Lipper assigns a market capitalization to each fund based on the percentages of a fund’s three-year weighted equity assets that fall into each of Lipper’s three defined market capitalization slices. The market capitalization breakpoints are calculated using all common stocks, excluding all non-US domiciled stocks and ADRs, trading on the NYSE, AMEX and NASDAQ. Funds are assigned to the capitalization level in which they have a 75% or higher weighting. Any fund that has less than 75% of its three-year weighted allocation in any of the three market capitalization ranges is classified as a multi-cap fund. For investment style selection, the Lipper classification system uses three-year fundamental portfolio characteristics (price/earnings, price/book and three-year sales-per-share growth) and, if necessary, confirming secondary characteristics (price-to-sales and price-to-operating cash flow). Fund statistics are compared to their relevant S&P capitalization-level index to determine the growth, core or value style. In some cases, S&P Indices combines closely related Lipper fund classifications in one SPIVA category. Exhibit 6 maps the SPIVA U.S. Equity fund categories to Lipper classifications.
Exhibit 2: U.S. Equity Category Mappings SPIVA Category Lipper Fund Classification Large-Cap Growth Funds Large-Cap Growth Funds Large-Cap Core Funds Large-Cap Core Funds
Large-Cap Value Funds Large-Cap Value Funds Equity Income Funds
Mid-Cap Growth Funds Mid-Cap Growth Funds Mid-Cap Core Funds Mid-Cap Core Funds Mid-Cap Value Funds Mid-Cap Value Funds Small-Cap Growth Funds Small-Cap Growth Funds Small-Cap Core Funds Small-Cap Core Funds Small-Cap Value Funds Small-Cap Value Funds Multi-Cap Growth Funds Multi-Cap Growth Funds Multi-Cap Core Funds Multi-Cap Core Funds Multi-Cap Value Funds Multi-Cap Value Funds Real Estate Funds Real Estate Funds
S&P DOW JONES INDICES | SPIVA Scorecard YEAR-END 2012
20 McGraw-Hill
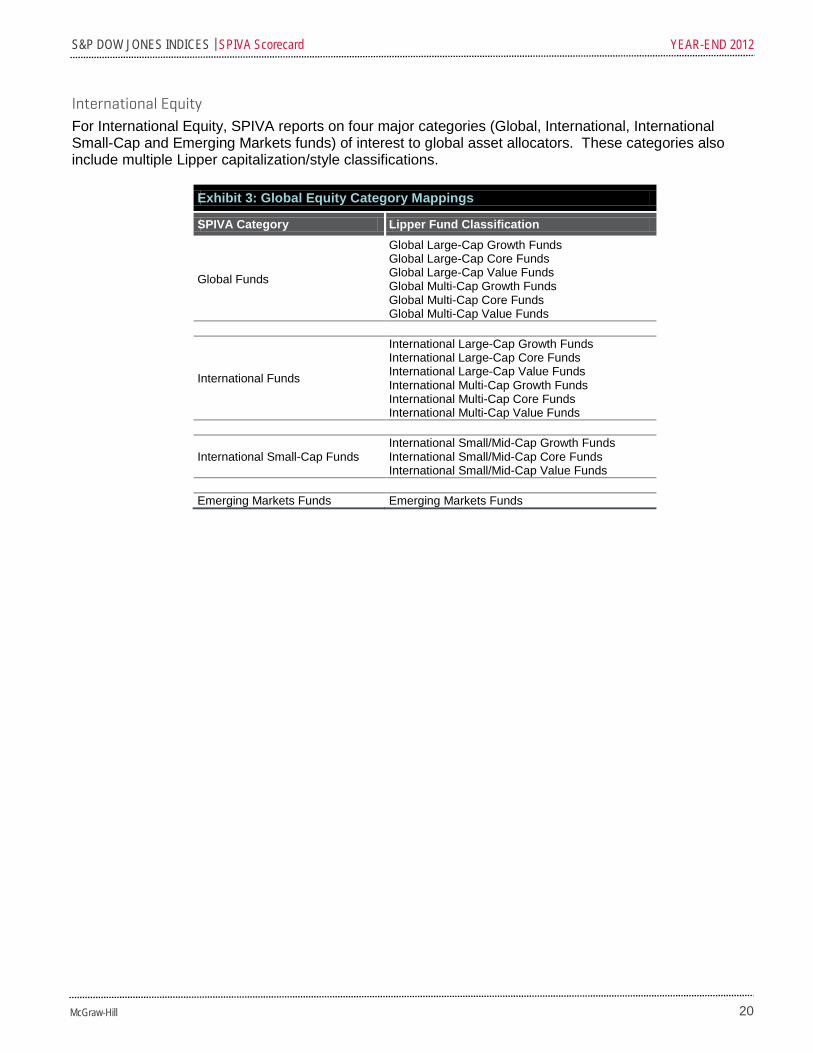
International Equity For International Equity, SPIVA reports on four major categories (Global, International, International Small-Cap and Emerging Markets funds) of interest to global asset allocators. These categories also include multiple Lipper capitalization/style classifications.
Exhibit 3: Global Equity Category Mappings
SPIVA Category Lipper Fund Classification
Global Funds
Global Large-Cap Growth Funds Global Large-Cap Core Funds Global Large-Cap Value Funds Global Multi-Cap Growth Funds Global Multi-Cap Core Funds Global Multi-Cap Value Funds
International Funds
International Large-Cap Growth Funds International Large-Cap Core Funds International Large-Cap Value Funds International Multi-Cap Growth Funds International Multi-Cap Core Funds International Multi-Cap Value Funds
International Small-Cap Funds International Small/Mid-Cap Growth Funds International Small/Mid-Cap Core Funds International Small/Mid-Cap Value Funds
Emerging Markets Funds Emerging Markets Funds

S&P DOW JONES INDICES | SPIVA Scorecard YEAR-END 2012
21 McGraw-Hill
Fixed Income SPIVA reports on eight domestic, two global and three municipal fixed income categories. The Lipper domestic fixed income classifications are based on maturity and credit quality. For maturity, long is 10+ years, intermediate is 5-10 years, short/intermediate is 1-5 years and short is 1-3.5 years. For credit quality, bonds are assigned to U.S. Treasury, U.S. Government (includes government and agency issues), A- or BBB-rated (according to Lipper fund rating methodology) and High Yield classifications. Lipper also includes U.S. Mortgages and GNMA classifications. In global fixed income, Lipper differentiates between global (including the U.S.) and international (excluding the U.S.) objectives. For municipal debt funds, we include the general (invests in the top four credit ratings) classification plus two state funds (California and New York).
Exhibit 4: Fixed Income Category Mappings
SPIVA Category Lipper Fund Classification
Government Long Funds General U.S. Government Funds General U.S. Treasury Funds
Government Intermediate Funds Intermediate U.S. Government Short-Intermediate U.S. Government
Government Short Funds Short U.S. Government Funds Short U.S. Treasury
Investment-Grade Long Funds Corporate Debt Funds A Rated Corporate Debt Funds BBB-Rated
Investment-Grade Intermediate Funds Intermediate Investment-Grade Debt Funds Short-Intermediate Investment-Grade Debt Funds
Investment-Grade Short Funds Short Investment-Grade Debt Funds High Yield Funds High Current Yield Funds
Mortgage-Backed Securities Funds U.S. Mortgage Funds GNMA Funds
Global Income Funds Global Income Funds International Income Funds
Emerging Market Debt Funds Emerging Markets Debt Funds General Municipal Debt Funds General Municipal Debt Funds California Municipal Debt Funds California Municipal Debt Funds New York Municipal Debt Funds New York Municipal Debt Funds
S&P DOW JONES INDICES | SPIVA Scorecard YEAR-END 2012
22 McGraw-Hill
Appendix B Glossary Percentage of Funds Outperformed by the Index To correct for survivorship bias, we use the opportunity set available at the beginning of the period as the denominator. We determine the count of funds that have survived and beat the index. We then report the index outperformance percentage. Survivorship (%) This measure represents the percentage of funds in existence at the beginning of the time period that is still active at the end of the time period. Style Consistency (%) This calculation shows the percentage of funds that had the same style classification at the end of the time period as at the beginning of the time period. Equal-Weighted Fund Performance Equal-weighted returns for a particular style category are determined by calculating a simple average return of all active funds in that category in a particular month. Asset-Weighted Fund Performance Asset-weighted returns for a particular style category are determined by calculating a weighted average return of all funds in that category in a particular month, with each fund's return weighted by its total net assets. Asset-weighted returns are a better indicator of fund category performance because they more accurately reflect the returns of the total money invested in that particular style category. Quartiles Breakpoints The pth percentile for a set of data is the value that is greater than or equal to p% of the data, but is less than or equal to (100 - p)% of the data. In other words, it is a value that divides the data into two parts: the lower p% of the values and the upper (100-p)% of the values. The first quartile is the 75th percentile, the value separating the elements of a population into the lower 75% and the upper 25%. The second quartile is the 50th percentile and the third quartile is the 25th percentile. For fund category quartiles in a particular time horizon, the data used is the return of the largest share class of the fund net of fees, excluding loads. Survivorship Bias Many funds might liquidate or merge during a period of study. This usually occurs due to continued poor performance by the fund. Therefore, if index returns were compared to fund returns using only surviving funds, the comparison would be biased in favor of the fund category. These reports remove this bias by (a) using the entire investment opportunity set, made up of all funds in that particular category at the outset of the period, as the denominator for outperformance calculations, (b) explicitly showing the survivorship rate in each category and (c) constructing peer average return series for each category based on all available funds at the outset of the period. Fees The fund returns used are net of fees, excluding loads.
S&P DOW JONES INDICES | SPIVA Scorecard YEAR-END 2012
23 McGraw-Hill
Indices1 A benchmark index provides an investment vehicle against which fund performance can be measured. U.S. Equity: S&P 500 Widely regarded as the best single gauge of the U.S. equities market, this market capitalization-weighted index includes a representative sample of 500 leading companies in the foremost industries of the U.S. economy and provides over 80% coverage of U.S. equities. S&P MidCap 400 This index consists of 400 mid-sized companies and covers approximately 7% of the U.S. equities market. S&P SmallCap 600 This index consists of 600 small-cap stocks and covers approximately 3% of the U.S. equities market. S&P Composite 1500 Index This is a broad market, capitalization-weighted index of 1500 stocks. This index is comprised of three size-based indices: the S&P 500, S&P MidCap 400 and S&P SmallCap 600, which measure the performance of large-, mid- and small-cap stocks, respectively. This index represents 90% of U.S. equities. S&P 500 Growth and Value Indices These indices form an exhaustive, multi-factor style series covering the entire market capitalization of the S&P 500. Constituents, weighted according to market capitalization, are classified as growth, value or a mix of growth and value. S&P MidCap 400 Growth and Value Indices These indices form an exhaustive, multi-factor style series covering the entire market capitalization of the S&P MidCap 400. S&P SmallCap 600 Growth and Value Indices These indices form an exhaustive, multi-factor style series covering the entire market capitalization of the S&P SmallCap 600. S&P Composite 1500 Growth and Value Indices These indices form an exhaustive, multi-factor style series covering the entire market capitalization of the S&P Composite 1500. S&P United States REIT Index This index measures the investable universe of publicly traded real estate investment trusts. International Equity: S&P Global 1200 Capturing approximately 70% of the world’s capital markets, the S&P Global 1200 is a composite of seven headline indices, many of which are accepted leaders in their regions. It includes the S&P 500
1 For more information on S&P Indices, please visit www.indices.standardandpoors.com.
S&P DOW JONES INDICES | SPIVA Scorecard YEAR-END 2012
24 McGraw-Hill
(United States), S&P Europe 350 (Europe), S&P/Topix 150 (Japan), S&P/TSX 60 (Canada), S&P/ASX All Australian 50 (Australia), S&P Asia 50 (Asia Ex-Japan) and S&P Latin America 40 (Latin America). S&P 700 This index measures the non-United States component of the global equity markets, covering all the regions included in the S&P Global 1200 excluding the U.S. (S&P 500). S&P World Ex-U.S. Small Cap This index represents the small-cap segment - the bottom 15% of the world’s universe of institutionally investable securities excluding the U.S. S&P/IFCI Composite Index This index is widely recognized as a comprehensive and reliable measure of the world’s emerging markets. It measures the returns of stocks that are legally and practically available to foreign investors. Fixed Income2: Barclays Capital Long Government Bond Index This index consists of U.S. Treasury and U.S. Government agency bonds with maturities greater than ten years. Barclays Capital Intermediate Government Bond Index This index consists of U.S. Treasury and U.S. Government agency bonds with maturities from one to ten years. Barclays Capital 1-3 Year Government Bond Index This index consists of U.S. Treasury and U.S. Government agency bonds with maturities from one to three years. Barclays Capital Long Government/Credit Bond Index This index covers corporate and non-corporate fixed income securities that are rated investment-grade and have maturities greater than ten years. Barclays Capital Intermediate Government/Credit Bond Index This index covers corporate and non-corporate fixed income securities that are rated investment-grade with maturities from one to ten years. Barclays Capital 1-3 Year Government/Credit Bond Index This index covers corporate and non-corporate fixed income securities that are rated investment-grade and have one to three years to final maturity.
Barclays Capital High Yield Bond Index This index includes all fixed income securities with a maximum quality rating of Ba1/BB+ (including defaulted issues), a minimum amount outstanding of US$ 100 million and at least one year to maturity. Barclays Capital Brothers Mortgage-Backed Securities Index This index includes 15- and 30-year fixed-rate securities backed by mortgage pools of the Government National Mortgage Association (GNMA), Federal Home Loan Mortgage Corporation (FHLMC) and Federal National Mortgage Association (FNMA).
2 Barclays Capital Fixed Income Indices were formerly the Lehman Brothers Indices.
S&P DOW JONES INDICES | SPIVA Scorecard YEAR-END 2012
25 McGraw-Hill
Barclays Capital Global Aggregate Bond Index This index covers the most liquid portion of the global investment-grade fixed-rate bond market, including government, credit and collateralized securities. Barclays Capital Emerging Markets Index This index includes fixed- and floating-rate USD-denominated debt from emerging markets. S&P National AMT-Free Municipal Bond Index This index is a broad, comprehensive, market value-weighted index designed to measure the performance of the investment–grade U.S. municipal bonds that are exempt from the Alternative Minimum Tax. S&P California AMT-Free Municipal Bond Index This index is designed to measure the performance of the investment–grade California municipal bonds that are exempt from the Alternative Minimum Tax. S&P New York AMT-Free Municipal Bond Index
THIS INDEX IS DESIGNED TO MEASURE THE PERFORMANCE OF THE INVESTMENT–GRADE NEW YORK BONDS THAT ARE EXEMPT FROM THE ALTERNATIVE MINIMUM TAX.
Index Research & Design Contact Information Global Head Frank Luo [email protected] New York Joseph Guirguis [email protected] Qing Li [email protected] Berlinda Liu [email protected] Aye Soe [email protected] Peter Tsui [email protected] Beijing Liyu Zeng [email protected] Hong Kong Priscilla Luk [email protected] London
Xiaowei Kang [email protected] Daniel Ung [email protected]
S&P DOW JONES INDICES | SPIVA Scorecard YEAR-END 2012
26 McGraw-Hill
Disclaimer Copyright © 2013 by S&P Dow Jones Indices LLC, a subsidiary of The McGraw-Hill Companies, Inc., and/or its affiliates. All rights reserved. Standard & Poor’s, S&P and SPIVA are registered trademarks of Standard & Poor’s Financial Services LLC (“S&P”), a subsidiary of The McGraw-Hill Companies, Inc. Dow Jones is a registered trademark of Dow Jones Trademark Holdings LLC (“Dow Jones”). Trademarks have been licensed to S&P Dow Jones Indices LLC. Redistribution, reproduction and/or photocopying in whole or in part are prohibited without written permission. This document does not constitute an offer of services in jurisdictions where S&P Dow Jones Indices LLC, Dow Jones, S&P or their respective affiliates (collectively “S&P Dow Jones Indices”) do not have the necessary licenses. All information provided by S&P Dow Jones Indices is impersonal and not tailored to the needs of any person, entity or group of persons. S&P Dow Jones Indices receives compensation in connection with licensing its indices to third parties. Past performance of an index is not a guarantee of future results. It is not possible to invest directly in an index. Exposure to an asset class represented by an index is available through investable instruments based on that index. S&P Dow Jones Indices does not sponsor, endorse, sell, promote or manage any investment fund or other investment vehicle that is offered by third parties and that seeks to provide an investment return based on the performance of any index. S&P Dow Jones Indices makes no assurance that investment products based on the index will accurately track index performance or provide positive investment returns. S&P Dow Jones Indices LLC is not an investment advisor, and S&P Dow Jones Indices makes no representation regarding the advisability of investing in any such investment fund or other investment vehicle. A decision to invest in any such investment fund or other investment vehicle should not be made in reliance on any of the statements set forth in this document. Prospective investors are advised to make an investment in any such fund or other vehicle only after carefully considering the risks associated with investing in such funds, as detailed in an offering memorandum or similar document that is prepared by or on behalf of the issuer of the investment fund or other vehicle. Inclusion of a security within an index is not a recommendation by S&P Dow Jones Indices to buy, sell, or hold such security, nor is it considered to be investment advice. These materials have been prepared solely for informational purposes based upon information generally available to the public from sources believed to be reliable. No content contained in these materials (including index data, ratings, credit-related analyses and data, model, software or other application or output therefrom) or any part thereof (Content) may be modified, reverse-engineered, reproduced or distributed in any form by any means, or stored in a database or retrieval system, without the prior written permission of S&P Dow Jones Indices. The Content shall not be used for any unlawful or unauthorized purposes. S&P Dow Jones Indices and its third-party data providers and licensors (collectively “S&P Dow Jones Indices Parties”) do not guarantee the accuracy, completeness, timeliness or availability of the Content. S&P Dow Jones Indices Parties are not responsible for any errors or omissions, regardless of the cause, for the results obtained from the use of the Content. THE CONTENT IS PROVIDED ON AN “AS IS” BASIS. S&P DOW JONES INDICES PARTIES DISCLAIM ANY AND ALL EXPRESS OR IMPLIED WARRANTIES, INCLUDING, BUT NOT LIMITED TO, ANY WARRANTIES OF MERCHANTABILITY OR FITNESS FOR A PARTICULAR PURPOSE OR USE, FREEDOM FROM BUGS, SOFTWARE ERRORS OR DEFECTS, THAT THE CONTENT’S FUNCTIONING WILL BE UNINTERRUPTED OR THAT THE CONTENT WILL OPERATE WITH ANY SOFTWARE OR HARDWARE CONFIGURATION. In no event shall S&P Dow Jones Indices Parties be liable to any party for any direct, indirect, incidental, exemplary, compensatory, punitive, special or consequential damages, costs, expenses, legal fees, or losses (including, without limitation, lost income or lost profits and opportunity costs) in connection with any use of the Content even if advised of the possibility of such damages. S&P Dow Jones Indices keeps certain activities of its business units separate from each other in order to preserve the independence and objectivity of their respective activities. As a result, certain business units of S&P Dow Jones Indices may have information that is not available to other business units. S&P Dow Jones Indices has established policies and procedures to maintain the confidentiality of certain non-public information received in connection with each analytical process. In addition, S&P Dow Jones Indices provides a wide range of services to, or relating to, many organizations, including issuers of securities, investment advisers, broker-dealers, investment banks, other financial institutions and financial intermediaries, and accordingly may receive fees or other economic benefits from those organizations, including organizations whose securities or services they may recommend, rate, include in model portfolios, evaluate or otherwise address.