ethnicity and the balanced scorecard’s customer ... and the balanced scorecard’s customer...
TRANSCRIPT

Ethnicity and the Balanced Scorecard’s Customer Perspective: The Case of Higher Education
Laura Kozloski Hart
Barry University
Alison Rampersad Lynn University
Jose Lopez
Lynn University
Michael Petroski Lynn University
The balanced scorecard (“BSC”) is ubiquitous in the strategic planning and performance evaluation processes of organizations across the United States. Many university leadership teams can and do use aspects of the balanced scorecard process to measure customer (student) satisfaction, guiding their strategic initiatives and resource allocations for recruitment, retention, and development efforts. As diversity on US university campuses increases, administrators are challenged to satisfy a wider range of customer expectations than for homogeneous student groups. Through our analysis, we show how students representing multiple ethnicities differ in their perceptions of the importance of key dimensions of service quality as well as how relevant these perceptions are for student retention and intention to recommend their university to others. INTRODUCTION Strategic performance and measurement are critical for all organizations, and institutions of higher education are no exception. In fact, with the sky-rocketing costs of a university education in the U.S., there are increasing levels of scrutiny by students, parents, prospective employers, and governments of the value delivered by colleges and universities. The balanced scorecard approach (“BSC”) has successfully been implemented by for-profit and non-profit organizations across a variety of industries as a strategic management tool for measuring organizational performance from four critical perspectives: financial, customer, learning and growth, and internal process. This balanced approach to performance evaluation can be used in higher
Journal of Applied Business and Economics

education, and its developers, Norton and Kaplan (2001a) recommend an emphasis on the customer perspective within the scorecards of non-profits like colleges and universities for the greatest success in setting and achieving organizational objectives. To evaluate performance from the customer perspective, colleges and universities must consider several groups of external customers including prospective business employers, students, and their parents who often pay tuition, housing, fees, and other university-levied expenses. Career service center staff typically gathers feedback from prospective employers as a measure of the practical value of graduates’ preparedness for the workforce, and students regularly complete course evaluations to measure course content and delivery. Both of these activities provide valuable performance feedback about the quality of instruction and the value of specific educational programs. However, opinions about specific academic courses and programs provide only a partial picture of the customer perspective. An important aspect of customer satisfaction for colleges and universities that is often under-measured is student satisfaction with the suite of ancillary services provided on campus. Students are the main customers for university services, and institutions’ ability to meet or exceed student demands contributes to student retention and increases their propensity to recommend/refer their school to others (O’Neill, 2003). Customer (student) retention and referrals have been shown to be important for organizational success and business development (Dubrovski, 2001). By measuring student satisfaction with support services, administrators gain a robust set of data for the customer perspective of the BSC that they can incorporate into strategic decision-making. Added to the complexity of satisfying students is the increasing diversity of universities’ student bodies. Researchers have found that there is a correlation between ethnicity and perceived service quality/customer satisfaction in a variety of industries, including banking, healthcare, and aviation. By analyzing student satisfaction with services on college and university campuses and segmenting data by ethnicity using the same dimensions of service quality used for analysis of other service sectors provides valuable information for university administrators seeking to improve performance measured in the BSC’s customer perspective. With this information, they can make better-informed decisions regarding resource allocation for initiatives that should enhance students’ satisfaction, retention, and referral intentions. For our study we surveyed nearly 700 graduate and undergraduate students at private and public colleges and universities in South Florida to identify the service quality dimensions with the strongest relationships with overall student satisfaction and to determine if there were differences by ethnic group. While higher education may be considered a non-traditional service business given the high degree of student effort in their own learning processes and the extended nature of the service experience (Cuthbert, 1996), the entire package of university support services lend themselves to the assessment of their importance to students’ overall satisfaction. Research has shown that students can reasonably be considered as college/university customers (Cuthbert, 1996; Parisau & McDaniel; 1996). One proven tool to assess service quality perceptions and the relationships between service quality and customer satisfaction is the SERVQUAL instrument (Parasuraman, Zeithaml, & Berry, 1988). This instrument has been successfully tested across a wide range of industries, and we use it in this study to assess how five dimensions of service quality contribute to student satisfaction in higher education. We added a sixth performance measure “Satisfaction with Professors” to round out data collection for the service aspect of the balanced scorecard’s customer perspective.
Journal of Applied Business and Economics
There is a significant body of literature confirming a strong, positive relationship between perceived service quality and customer satisfaction in the service sector. The industries where this positive relationship has been found include, among others, the airline, financial services, hospitality, higher education, and healthcare sectors. Researchers have only recently begun to assess the correlation between customers’ ethnicities and their perceptions of service quality and reported satisfaction with service providers. Empirical work has shown that different ethnic groups report differing perceptions and levels of satisfaction with their service providers in the banking, healthcare, and airline industries (Snow et al., 1996; Lassar, Manolis & Winsor, 2000; Lopez, Hart & Rampersad; 2007; Hart, Lopez, Jalbert, Jalbert & Rampersad, 2007.) To date, there has been no published research that studies the correlation between students’ ethnicities and their perceptions of service quality and reported satisfaction with institutions of higher education. This paper examines differences and similarities by ethnicity of student perceptions of service quality at U.S. colleges and universities and assesses the relationship between these perceptions and overall satisfaction. We also examine the relationship between satisfaction and recommendation intention, providing valuable performance measurement indicators for the customer perspective of the Balanced Scorecard. This article is divided as follows. We first briefly explain the evolution of the balanced scorecard approach and its relevance for non-profit organizations, including colleges and universities. Second we explore theories and accepted research instruments for evaluating customer satisfaction in service industries, highlighting work analyzing student perceptions of services in higher education. Next, we explain our research methodologies and results as well as discuss our study’s findings. Lastly, we present our conclusions, explain this study’s limitations, and suggest related future research topics. REVIEW OF THE LITERATURE The Balanced Scorecard and Non-Profit Organizations In 1987, Johnson and Kaplan’s Relevance Lost shed light on the fact that many businesses had become ineffective in their planning and control efforts because they focused so heavily on the lag indicators of performance generated by their accounting and financial reporting systems. Kanter and Summers (1987) reinforced the relevance of the selection of a range of performance measures from various constituents. Kaplan and Norton’s (1996a, 1996b) balanced scorecard approach to strategic management provided a roadmap for many organizations by supplying providing a framework for multidimensional performance evaluation. The balanced scorecard methodology is intended to be a performance measurement system (Kaplan & Norton, 2001b and Niven, 2005) as well as a strategic management tool (Kaplan & Norton, 1996a, b) that is founded in the setting of objectives and collection of performance data from four perspectives: financial, customers, learning and growth, and internal processes. In for-profit organizations, the financial perspective of the BSC is at the top of the hierarchy. However, for non-profits, Kaplan (2001a) recommends placing the customer/constituent perspective at the top of the hierarchy. The concept of including non-financial measures in non-profits’ performance evaluation is not new. As early as 1980, researchers (Cameron, 1981 and Connolly, Conlon & Deutsch, 1980) recommended that non-profit organizations adopt multi-dimensional approaches to measure their effectiveness. Forbes (1998) reported on the challenges faced by non-profits in performance evaluation given the fact that they lacked the simple financial metrics used by many for profit business, such as stock price, profit margin, or shareholder return. Using a balanced scorecard
Journal of Applied Business and Economics
that emphasizes the customer perspective enables non-profit leaders to focus on their missions. It has been found to be a more adaptable tool than other financially-focused strategic management methods borrowed from business (Kaplan, 2001a, 2001b). Customer Satisfaction and Service Quality It is commonly accepted by management and marketing experts that service quality and customer satisfaction are essential to organizations’ profits and overall business success (Kristensen et al. 1992; Aaker & Jacobson, 1994; Ziethaml, Berry & Parasuraman, 1996; Bolton, 1998; & McColl-Kennedy & Schneider, 2000). Service quality results from the smooth interaction of an organization’s subsystems (Rucci, Kimm & Quinn, 1998; Heskett, Sasser & Schlesinger, 1997; and Loveman, 1998). Customer satisfaction has become an important measurement of the health of a company and complements more traditional financial measures such as stock value, ROI, and EVA. In fact, with the growing popularity of the Balanced Scorecard Method of performance evaluation, it is weighted as heavily as financial and innovation factors (Kaplan & Norton, 1996). For institutions of higher education, most of which are not-for-profit, are not publicly traded, and, therefore, lack common market-driven performance measures, evaluation of customer (student) satisfaction can be an effective method of incorporating important stakeholders’ opinions into the performance measurement process. For most of the twentieth century, the manufacturing sector was the setting for the majority of academic research about customer satisfaction and those factors that improve customers’ perceptions of the product delivered by a business. In this setting, measurement is relatively simple in that product characteristics and comparisons among competitors play important roles in how positively or negatively customers evaluate an organization (Crosby, 1979; Oliver, 1980; Churchill & Suprenant, 1982; Garvin, 1983; and Bearden & Teel, 1983). In the early 1980s, researchers began to more deeply explore customer satisfaction in the service sector with the aim of identifying and understanding key contributors. They found that because there tend to be noticeable variations in product/service delivery for service organizations, it is more difficult to measure their service quality than it is for businesses with tangible products (Zeithaml, 1981). There is consensus in the literature that customer satisfaction measurement is a post-consumption evaluation by a consumer regarding the service or product purchased or used (Churchill & Surprenant, 1982; Lehtinen & Lehtinen, 1982; and Yuksel & Rimmington, 1998). There is strong empirical evidence to show that customers with the highest levels of perceived service quality will report the greatest satisfaction (Parasuraman, Zeithaml, & Berry, 1985 and Parasuraman, et al., 1988). Additional research advances the related concept that superior service quality perceptions generate favorable customer perceptions, strong customer retention, and frequent referrals which manifest in business success (reduced operating expenses, improved profits, and increased revenues) (Parasuraman et al. 1988; Anderson & Sullivan, 1993; Parasuraman, Berry & Zeithaml, 1991; Cronin & Taylor, 1992; Rust & Zahorik, 1993; and Zeithaml, et al., 1996). Customer Satisfaction and Service Quality in Higher Education Evaluation of teaching is commonplace in higher education, and most college and university students routinely complete course evaluations at the end of each term. Institutions of higher education today face increasing competition at home and from global education markets as well as from a reduction in government funding to students. The concept of service quality and its
Journal of Applied Business and Economics
relationship to customers’ (students’) satisfaction with their colleges or universities has been a central theme in the literature since the early 1990s (Soutar & McNeil, 1996; Oldfield & Baron, 2000; and O’Neill, 2000). Research demonstrates that administrators have to be concerned with how employers, current students and alumni value the skills and competencies taught as well as the overall educational experience (Bemowski, 1991; Ginsberg, 1991; and O’Neill, 2003). When looking at higher education, researchers have confirmed a positive relationship between student satisfaction with academics and overall student (customer) satisfaction. Studies have found that, over time, a student’s perception of his university evolves as his/her experiences build from freshman year through graduation (Szymanski & Henard, 2001). Research by Kotler and Fox (1995) shows that most students are satisfied with the academic aspects of the service provided by their universities (the product); however they are less satisfied with support services, including academic advising, registration, and career counseling. Trust, consistency, and the timely handling of student issues by administrators have also been found to be key contributors to student satisfaction or dissatisfaction (Grossman, 1999). The predominant approach to evaluating service quality in higher education revolves around collecting data from students, administrators and (sometimes) potential employers about their views on the product delivered, (e.g. courses, workshops, or academic degree programs. Several published studies have confirmed the importance of perceptions of service quality and the relationship to students’ overall satisfaction with their college/university (Rigotti & Pitt, 1992; Cuthbert, 1996; Soutar & McNeill, 1996; O’Neill & Palmer, 2004; and Abu Hasan et al. 2008). However, focusing only on the academic product delivered to students, fails to measure the importance of the perceived quality of the services used to deliver the product (Parasuraman et al., 1988; Bitner, 1990; and Bolton & Drew, 1991). The helpfulness of staff, state of physical facilities, and supporting bureaucracies and technologies all play a role in the academic products colleges and universities deliver, and it is essential important to evaluate their importance to customer (student) satisfaction. Measurement Tools A review of the management and marketing literature about customer satisfaction reveals a large number of scales measuring service quality that have been tested in multiple service industries. The most commonly implemented scales are SERVQUAL, SERVPERF and modified versions of these two tools. Both are quantitative in nature and are used to measure customers’ perceptions of service quality attributes or dimensions. The SERVQUAL scale was developed to gather and measure the gap between customers’ expectations for, and perceptions of, important service quality dimensions, which since 1988, have included the five dimensions of reliability, responsiveness, tangibles, assurance, and empathy (Parasuraman, et. al., 1988). There has been significant critique of the SERVQUAL scale for its emphasis on the gap between customers’ expectations and perceptions as well as its applicability across industry sectors (Carman, 1990; Cronin & Taylor, 1992 and Sureshchandar, Rajendran & Anantharaman, 2002). Carman (1990) concluded that customers in different sectors demonstrated a variety of perceptions of each of Parasuraman et al.’s original ten dimensions, and he recommended that researchers modify the SERVQUAL instrument to better represent their industries, organizations and research designs. Other studies found that it is not necessary to administer SERVQUAL’s expectation items, arguing that measurements of performance best reflect customers’ perceptions (Carman, 1990; Parasuraman et al., 1991; Babkus & Boller, 1992; Boulding et al., 1993; Cronin & Taylor, 1992 & 1994). The SERVPERF instrument developed by Cronin and Taylor (1992)
Journal of Applied Business and Economics
enables researchers to focus on service quality performance rather than Parasuraman et al.’s (1985) expectation-performance gap, which, they argue, better reflects customers’ perceptions. The literature supports the benefits of using simple performance-based methods of measuring service quality (Churchill & Suprenant, 1982; Carman, 1990; Boulding et al., 1993; Teas, 1993; Sureschandar et al., 2002; and Firdaus, 2006). Although Parasuraman et al. (1988) and Cronin & Taylor (1992) both assert that their scales are applicable to a variety of service sectors, most researchers using the instruments have used modified versions of them to more specifically represent their industry or sector. Research by Cuthbert (1996), Pariseau and McDaniel (1997), and Joseph and Joseph (1997) demonstrated a need to tailor the SERVQUAL instrument for use in higher education. Based on these findings, for this study, we employed a modified SERVQUAL instrument whose questions pertained strictly to a higher education environment. METHODOLOGY AND SUMMARY STATISTICS Data Collection The survey instrument used in this study was comprised of three parts: a demographics section, a section about customer satisfaction and recommendation intentions, and a section about perceptions of service quality. In the first section participants provided information about age, gender, ethnic/racial background, education level, marital status, and type of institution attended. In the second section participants scored their satisfaction with their professors, their satisfaction with the university or college, and their likelihood of recommending the institution to others. The third section contained modified SERVQUAL questions where participants rated their perceptions of five service quality dimensions as they related to their colleges or universities. The five dimensions of service quality measured in the third section of our survey instrument are:
Tangibles, which includes the appearance of physical facilities, equipment, personnel and communications materials,
Reliability, which includes the ability of employees to perform promised services dependably and accurately,
Responsiveness, which includes employees’ willingness to help students and provide them with prompt service,
Assurance, which includes the knowledge and courtesy of employees and their ability to inspire trust and confidence in students, and
Empathy, which includes the provision of caring, individualized attention to students. The survey was piloted tested with a group of 24 ethnically diverse students aged 18
through 24. The final version of the survey instrument reflects the group’s feedback. Data for this study was collected during Summer and Fall 2007 using paper and electronic surveys. Surveys were distributed to more than 700 undergraduate and graduate students at six universities in South Florida. Three of the universities are public and three are private, and participants represent various academic disciplines. Respondents were not asked to identify their universities or colleges. The objectives for this study were (1) to determine if the five dimensions of service quality were positively correlated with student satisfaction with their colleges or universities (“University Satisfaction”), (2) to determine if students’ satisfaction with their professors (“Professor Satisfaction”) was positively correlated with University Satisfaction, (3) to determine if students from different ethnicities reported different levels of University Satisfaction, (4) to
Journal of Applied Business and Economics
determine if different ethnic groups reported different correlations of perceived service quality and Professor Satisfaction with University Satisfaction, and (5) to determine if the relationship between student satisfaction (University and Professor) and their propensity to recommend their institution to others differs by ethnic group.
This study’s hypotheses were: H1: Students’ University Satisfaction is significantly correlated with their perceptions of
service quality and Professor Satisfaction. H2: Individuals from different ethnicities will report significantly different levels of
University Satisfaction. H3: Individuals from different ethnic groups will have different rankings of the relative
importance of Professor Satisfaction and service quality dimensions to their University Satisfaction.
H4: There is no significant difference by ethnicity in the correlation between University Satisfaction and students’ recommendation intentions.
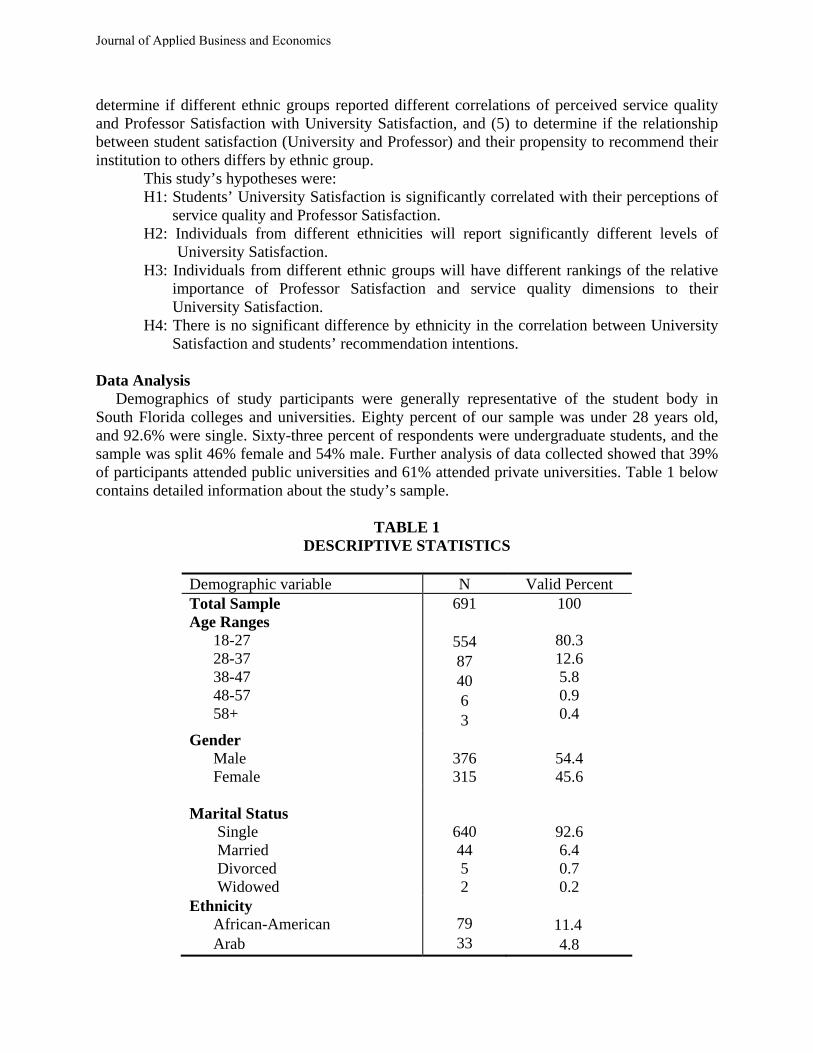
Data Analysis Demographics of study participants were generally representative of the student body in South Florida colleges and universities. Eighty percent of our sample was under 28 years old, and 92.6% were single. Sixty-three percent of respondents were undergraduate students, and the sample was split 46% female and 54% male. Further analysis of data collected showed that 39% of participants attended public universities and 61% attended private universities. Table 1 below contains detailed information about the study’s sample.
TABLE 1
DESCRIPTIVE STATISTICS
Demographic variable N Valid Percent Total Sample Age Ranges
18-27 28-37 38-47 48-57 58+
691
554 87 40 6 3
100
80.3 12.6 5.8 0.9 0.4
Gender Male Female
376 315
54.4 45.6
Marital Status Single Married Divorced Widowed
640 44 5 2
92.6 6.4 0.7 0.2
Ethnicity African-American Arab
79 33
11.4
4.8
Journal of Applied Business and Economics
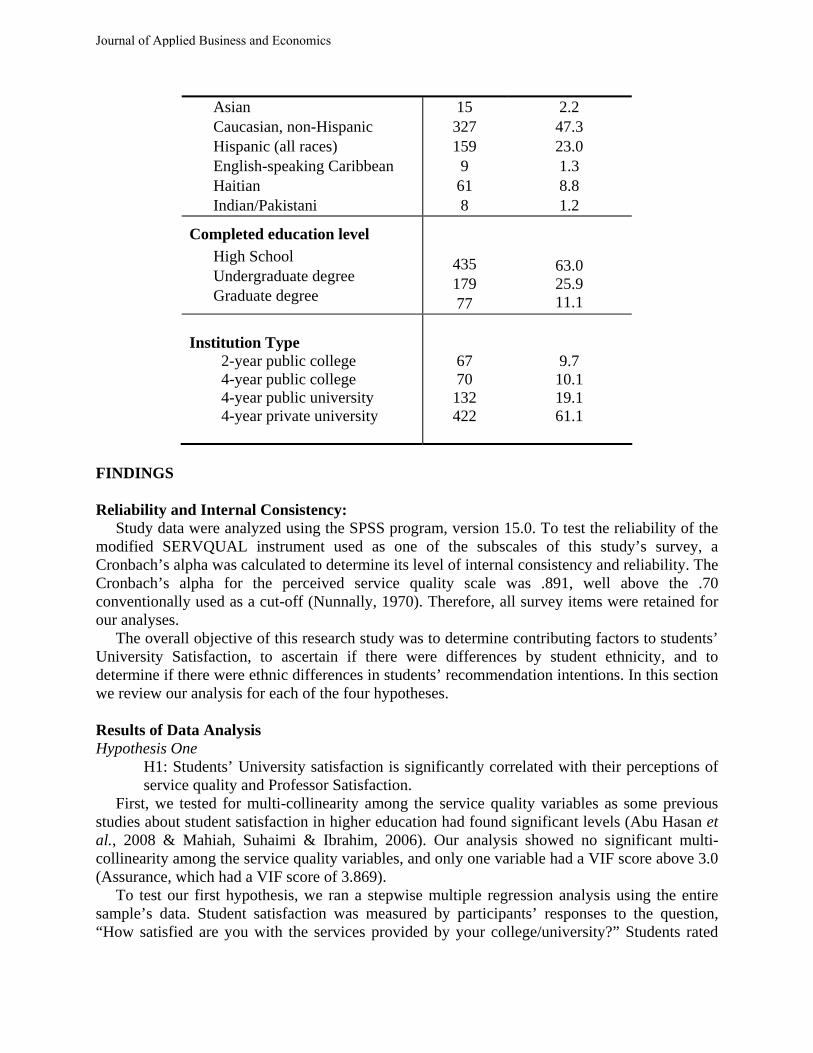
Asian Caucasian, non-Hispanic Hispanic (all races) English-speaking Caribbean Haitian Indian/Pakistani
15 327 159 9 61 8
2.2 47.3 23.0 1.3 8.8 1.2
Completed education level
High School Undergraduate degree Graduate degree
435 179 77
63.0 25.9 11.1
Institution Type 2-year public college 4-year public college 4-year public university 4-year private university
67 70 132 422
9.7 10.1 19.1 61.1
FINDINGS Reliability and Internal Consistency: Study data were analyzed using the SPSS program, version 15.0. To test the reliability of the modified SERVQUAL instrument used as one of the subscales of this study’s survey, a Cronbach’s alpha was calculated to determine its level of internal consistency and reliability. The Cronbach’s alpha for the perceived service quality scale was .891, well above the .70 conventionally used as a cut-off (Nunnally, 1970). Therefore, all survey items were retained for our analyses. The overall objective of this research study was to determine contributing factors to students’ University Satisfaction, to ascertain if there were differences by student ethnicity, and to determine if there were ethnic differences in students’ recommendation intentions. In this section we review our analysis for each of the four hypotheses. Results of Data Analysis Hypothesis One
H1: Students’ University satisfaction is significantly correlated with their perceptions of service quality and Professor Satisfaction.
First, we tested for multi-collinearity among the service quality variables as some previous studies about student satisfaction in higher education had found significant levels (Abu Hasan et al., 2008 & Mahiah, Suhaimi & Ibrahim, 2006). Our analysis showed no significant multi-collinearity among the service quality variables, and only one variable had a VIF score above 3.0 (Assurance, which had a VIF score of 3.869). To test our first hypothesis, we ran a stepwise multiple regression analysis using the entire sample’s data. Student satisfaction was measured by participants’ responses to the question, “How satisfied are you with the services provided by your college/university?” Students rated
Journal of Applied Business and Economics
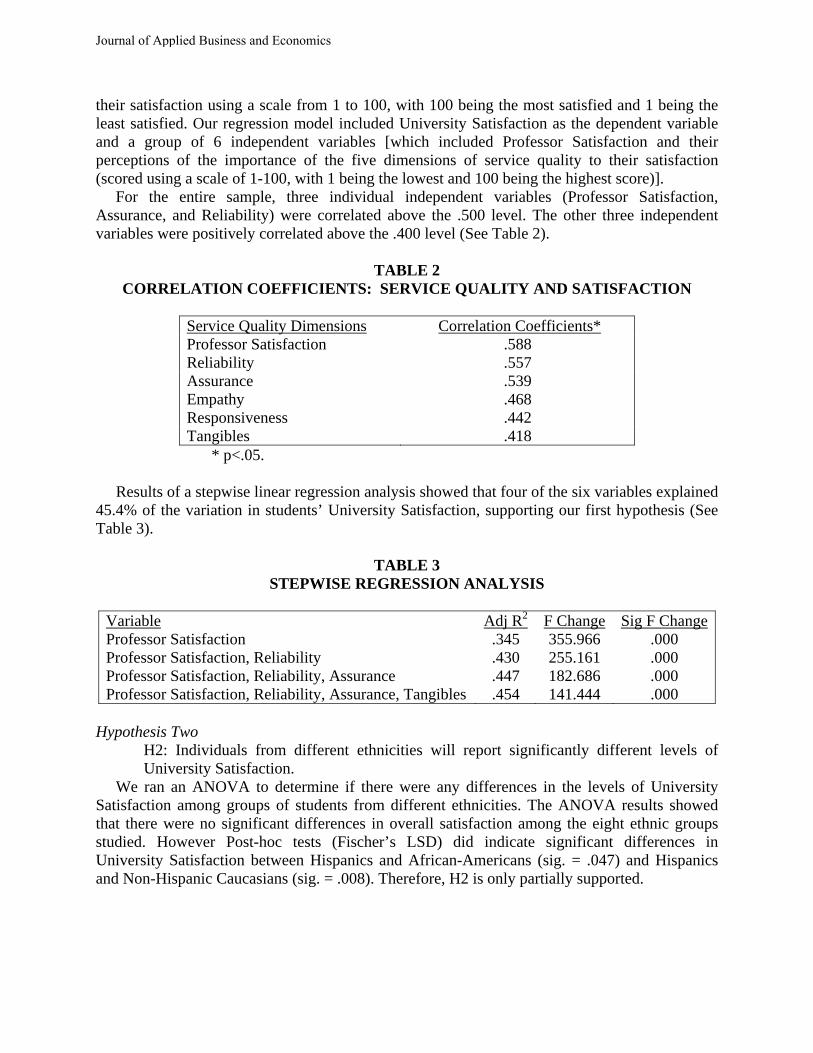
their satisfaction using a scale from 1 to 100, with 100 being the most satisfied and 1 being the least satisfied. Our regression model included University Satisfaction as the dependent variable and a group of 6 independent variables [which included Professor Satisfaction and their perceptions of the importance of the five dimensions of service quality to their satisfaction (scored using a scale of 1-100, with 1 being the lowest and 100 being the highest score)]. For the entire sample, three individual independent variables (Professor Satisfaction, Assurance, and Reliability) were correlated above the .500 level. The other three independent variables were positively correlated above the .400 level (See Table 2).
TABLE 2 CORRELATION COEFFICIENTS: SERVICE QUALITY AND SATISFACTION
Service Quality Dimensions Correlation Coefficients* Professor Satisfaction Reliability
.588
.557 Assurance Empathy Responsiveness
.539
.468
.442 Tangibles .418 * p<.05.
Results of a stepwise linear regression analysis showed that four of the six variables explained 45.4% of the variation in students’ University Satisfaction, supporting our first hypothesis (See Table 3).
TABLE 3
STEPWISE REGRESSION ANALYSIS
Variable Adj R2 F Change Sig F ChangeProfessor Satisfaction .345 355.966 .000 Professor Satisfaction, Reliability .430 255.161 .000 Professor Satisfaction, Reliability, Assurance .447 182.686 .000 Professor Satisfaction, Reliability, Assurance, Tangibles .454 141.444 .000
Hypothesis Two
H2: Individuals from different ethnicities will report significantly different levels of University Satisfaction.
We ran an ANOVA to determine if there were any differences in the levels of University Satisfaction among groups of students from different ethnicities. The ANOVA results showed that there were no significant differences in overall satisfaction among the eight ethnic groups studied. However Post-hoc tests (Fischer’s LSD) did indicate significant differences in University Satisfaction between Hispanics and African-Americans (sig. = .047) and Hispanics and Non-Hispanic Caucasians (sig. = .008). Therefore, H2 is only partially supported.
Journal of Applied Business and Economics
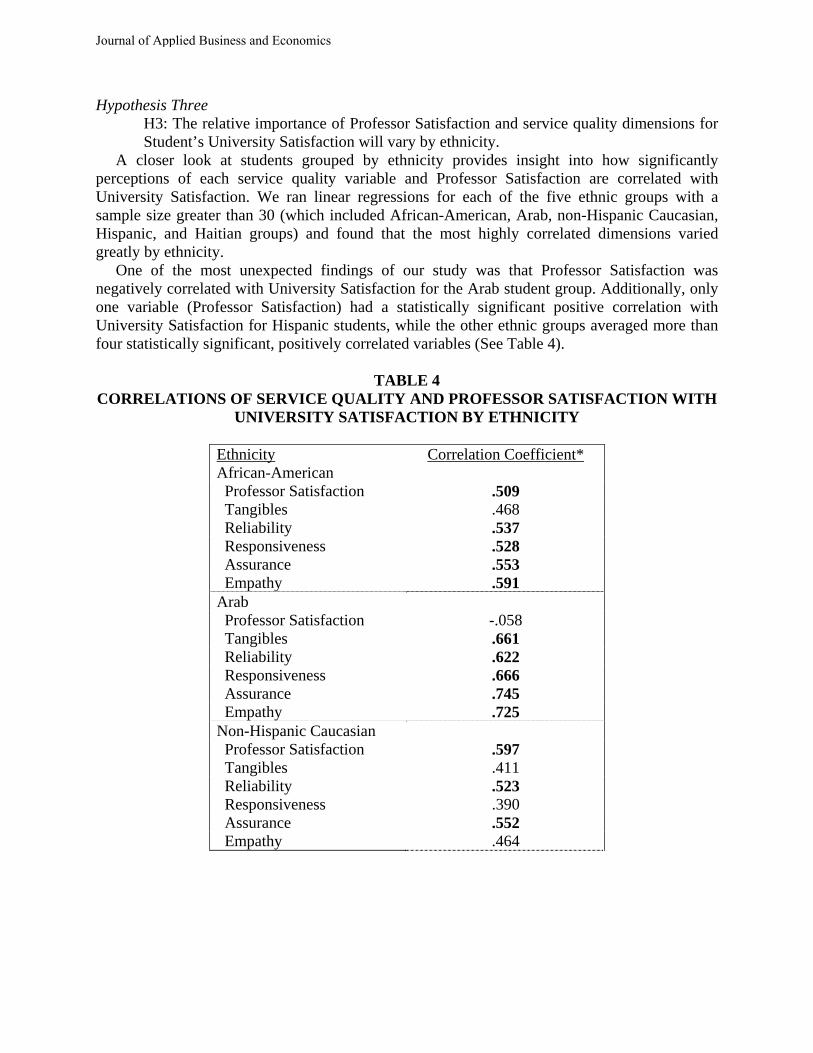
Hypothesis Three H3: The relative importance of Professor Satisfaction and service quality dimensions for Student’s University Satisfaction will vary by ethnicity.
A closer look at students grouped by ethnicity provides insight into how significantly perceptions of each service quality variable and Professor Satisfaction are correlated with University Satisfaction. We ran linear regressions for each of the five ethnic groups with a sample size greater than 30 (which included African-American, Arab, non-Hispanic Caucasian, Hispanic, and Haitian groups) and found that the most highly correlated dimensions varied greatly by ethnicity. One of the most unexpected findings of our study was that Professor Satisfaction was negatively correlated with University Satisfaction for the Arab student group. Additionally, only one variable (Professor Satisfaction) had a statistically significant positive correlation with University Satisfaction for Hispanic students, while the other ethnic groups averaged more than four statistically significant, positively correlated variables (See Table 4).
TABLE 4 CORRELATIONS OF SERVICE QUALITY AND PROFESSOR SATISFACTION WITH
UNIVERSITY SATISFACTION BY ETHNICITY
Ethnicity Correlation Coefficient* African-American Professor Satisfaction .509 Tangibles .468 Reliability .537 Responsiveness .528 Assurance .553 Empathy .591 Arab Professor Satisfaction -.058 Tangibles .661 Reliability .622 Responsiveness .666 Assurance .745 Empathy .725 Non-Hispanic Caucasian Professor Satisfaction .597 Tangibles .411 Reliability .523 Responsiveness .390 Assurance .552 Empathy .464
Journal of Applied Business and Economics
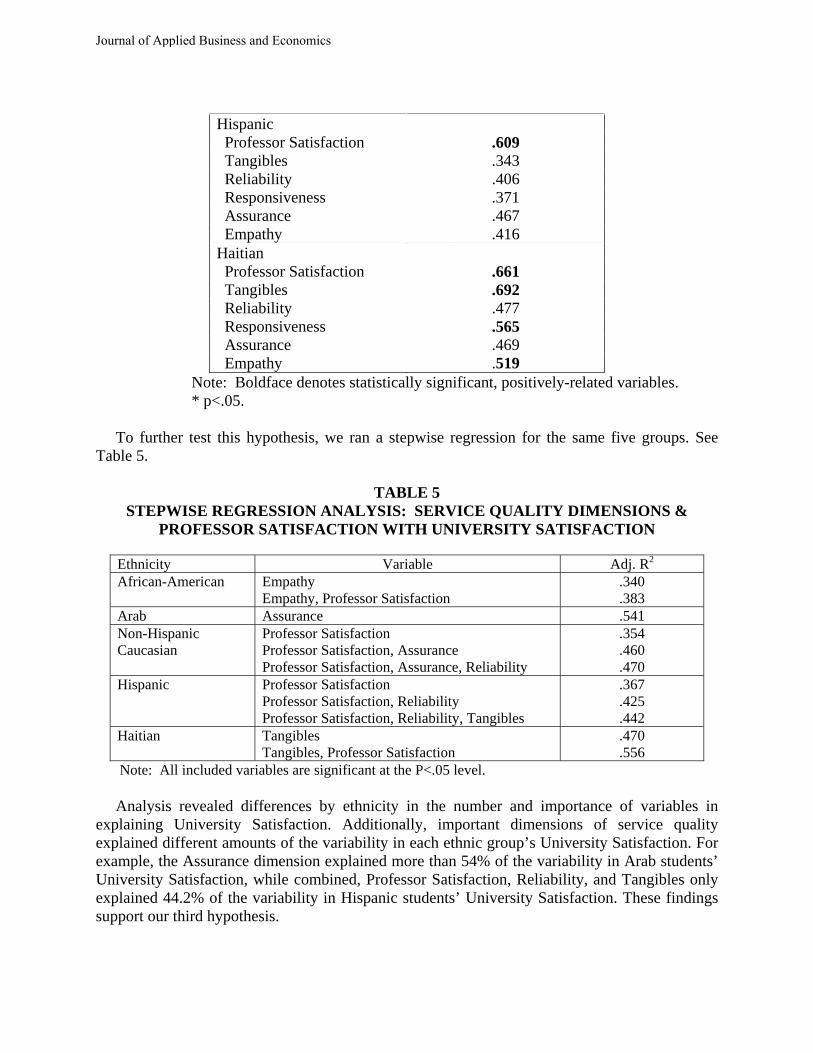
Hispanic Professor Satisfaction .609 Tangibles .343 Reliability .406 Responsiveness .371 Assurance .467 Empathy .416 Haitian Professor Satisfaction .661 Tangibles .692 Reliability .477 Responsiveness .565 Assurance .469 Empathy .519
Note: Boldface denotes statistically significant, positively-related variables. * p<.05.
To further test this hypothesis, we ran a stepwise regression for the same five groups. See Table 5.
TABLE 5 STEPWISE REGRESSION ANALYSIS: SERVICE QUALITY DIMENSIONS &
PROFESSOR SATISFACTION WITH UNIVERSITY SATISFACTION
Ethnicity Variable Adj. R2 African-American Empathy
Empathy, Professor Satisfaction .340 .383
Arab Assurance .541 Non-Hispanic Caucasian
Professor Satisfaction Professor Satisfaction, Assurance Professor Satisfaction, Assurance, Reliability
.354
.460
.470 Hispanic Professor Satisfaction
Professor Satisfaction, Reliability Professor Satisfaction, Reliability, Tangibles
.367
.425
.442 Haitian Tangibles
Tangibles, Professor Satisfaction .470 .556
Note: All included variables are significant at the P<.05 level.
Analysis revealed differences by ethnicity in the number and importance of variables in explaining University Satisfaction. Additionally, important dimensions of service quality explained different amounts of the variability in each ethnic group’s University Satisfaction. For example, the Assurance dimension explained more than 54% of the variability in Arab students’ University Satisfaction, while combined, Professor Satisfaction, Reliability, and Tangibles only explained 44.2% of the variability in Hispanic students’ University Satisfaction. These findings support our third hypothesis.
Journal of Applied Business and Economics
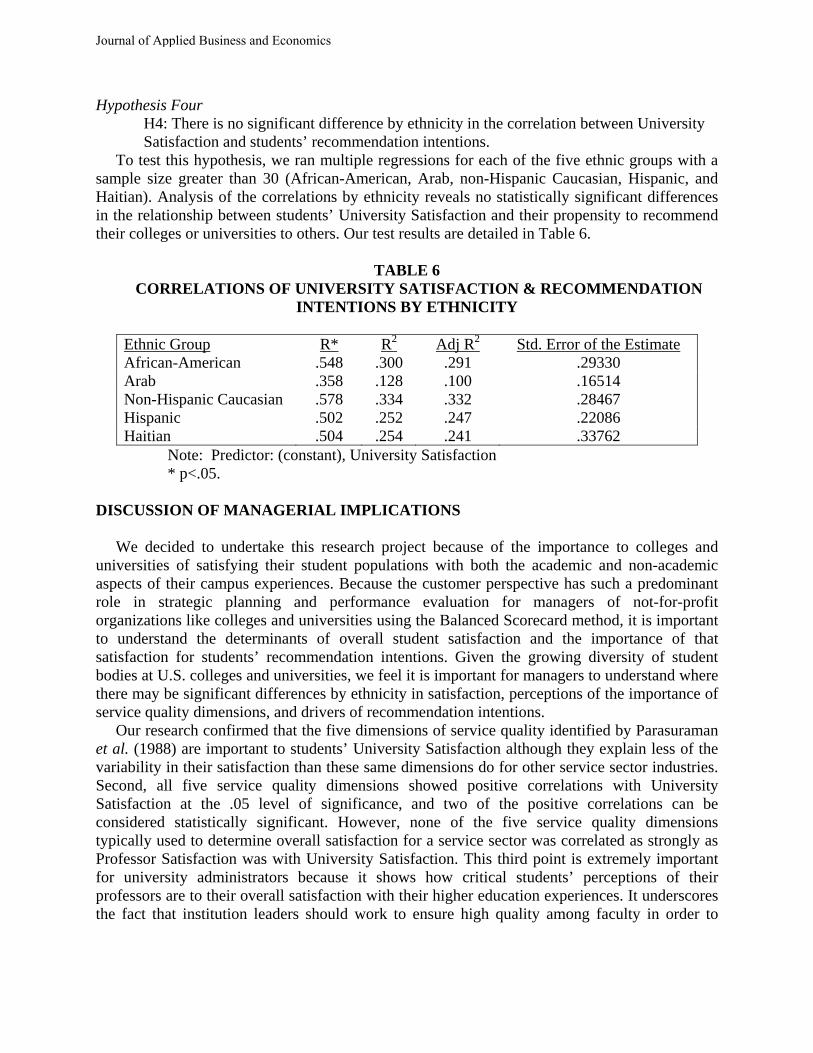
Hypothesis Four H4: There is no significant difference by ethnicity in the correlation between University Satisfaction and students’ recommendation intentions.
To test this hypothesis, we ran multiple regressions for each of the five ethnic groups with a sample size greater than 30 (African-American, Arab, non-Hispanic Caucasian, Hispanic, and Haitian). Analysis of the correlations by ethnicity reveals no statistically significant differences in the relationship between students’ University Satisfaction and their propensity to recommend their colleges or universities to others. Our test results are detailed in Table 6.
TABLE 6 CORRELATIONS OF UNIVERSITY SATISFACTION & RECOMMENDATION
INTENTIONS BY ETHNICITY
Ethnic Group R* R2 Adj R2 Std. Error of the Estimate African-American .548 .300 .291 .29330 Arab .358 .128 .100 .16514 Non-Hispanic Caucasian .578 .334 .332 .28467 Hispanic .502 .252 .247 .22086 Haitian .504 .254 .241 .33762
Note: Predictor: (constant), University Satisfaction * p<.05.
DISCUSSION OF MANAGERIAL IMPLICATIONS We decided to undertake this research project because of the importance to colleges and universities of satisfying their student populations with both the academic and non-academic aspects of their campus experiences. Because the customer perspective has such a predominant role in strategic planning and performance evaluation for managers of not-for-profit organizations like colleges and universities using the Balanced Scorecard method, it is important to understand the determinants of overall student satisfaction and the importance of that satisfaction for students’ recommendation intentions. Given the growing diversity of student bodies at U.S. colleges and universities, we feel it is important for managers to understand where there may be significant differences by ethnicity in satisfaction, perceptions of the importance of service quality dimensions, and drivers of recommendation intentions. Our research confirmed that the five dimensions of service quality identified by Parasuraman et al. (1988) are important to students’ University Satisfaction although they explain less of the variability in their satisfaction than these same dimensions do for other service sector industries. Second, all five service quality dimensions showed positive correlations with University Satisfaction at the .05 level of significance, and two of the positive correlations can be considered statistically significant. However, none of the five service quality dimensions typically used to determine overall satisfaction for a service sector was correlated as strongly as Professor Satisfaction was with University Satisfaction. This third point is extremely important for university administrators because it shows how critical students’ perceptions of their professors are to their overall satisfaction with their higher education experiences. It underscores the fact that institution leaders should work to ensure high quality among faculty in order to
Journal of Applied Business and Economics

satisfy existing students, attract future students, and incentivize current students to recommend their institutions to others. This understanding is also important for managers and others researching satisfaction in higher education because it highlights the need to tailor general survey instruments to accommodate specific elements of the higher education environment. A fourth important finding was the lack of significant difference among the eight ethnicities’ reported levels of University Satisfaction. However, there were significant differences in University Satisfaction between Hispanics and African-Americans as well as between Hispanics and non-Hispanic Caucasians. Our fifth, and perhaps most important finding, is that there are clear differences in ethnicities’ perceptions of the importance of each service quality dimension to their University Satisfaction. This knowledge is extremely relevant for university administrators developing strategic initiatives and allocating resources with the aim of improving service delivery to meet student expectations. It provides valuable guidance for universities serving diverse student bodies where one or more ethnicities may be dominant. With this knowledge, service managers can create and/or tailor employee training efforts to focus on the service dimensions the dominant ethnicities in their student bodies’ felt was most highly correlated with their University Satisfaction. With existing research clearly demonstrating a strong positive correlation between customer satisfaction and retention, service improvements that increase University Satisfaction should likely enhance student retention levels. This learning is also extremely relevant for program managers and university recruiters who can tailor their recruiting efforts by ethnicity to include information about the specific service quality dimensions that are most closely related to satisfaction for that ethnicity. Limitations Some limitations of this study should be addressed in future research. First, while a large sample contributed to healthy findings for African-American, Arab, Hispanic, Haitian, and non-Hispanic Caucasian students, we did not have enough respondents from the Asian, Indian/Pakistani or English-speaking Caribbean ethnic groups for us to be able analyze or draw conclusions for them. If this study were repeated, we suggest the inclusion of more respondents from these ethnicities. A potential limitation of our study is that, while we collected data from six institutions across three heavily-populated counties in South Florida, it may be difficult to generalize our findings to students from other geographies. Recommendations for Future Research Given the relevance of our interesting findings, we have several recommendations for future research, which include: (1) replicating this study in other geographies around the United States to confirm our findings, which would aid in the generalization of our research results; (2) conducting a follow-up study in South Florida to gain a better understanding of why ethnic groups perceive the dimensions of service quality so differently since understanding these differences could significantly aid higher education experts enhance student satisfaction and retention; and (3) conducting a study that combines evaluation of the BSC’s customer perspective by ethnicity (to include measures of service quality perceptions and student satisfaction) with evaluation of the BSC’s internal perspective (to include measures showing the results of college and universities’ operational efficiency initiatives) to determine if strategic initiatives are successful in improving student satisfaction.
Journal of Applied Business and Economics

Conclusions This study’s results contribute considerably to the shared body of knowledge about ethnicity, customer (student) satisfaction, and service quality determinants in higher education, and support efforts to understand the importance of student satisfaction for performance evaluation using the Balanced Scorecard method. Our findings confirm that ethnic groups hold a wide range of views about those service quality dimensions that are important contributors to their total satisfaction. Our study also confirms prior findings that there is little difference by ethnicity in the relationship between customer satisfaction and recommendation intentions. If used appropriately, this information may help university and college administrators and managers achieve higher levels of University Satisfaction, retention, and referrals. REFERENCES
Aaker, D.A. & Jacobson, R. (1994), The financial information content of perceived quality, Journal of Marketing Research, 31(2), 191-201.
Abu Hasan, H.F.; Ilias, A.; Abd Rahman, R.; & Abd Razak, M.Z. (2008) Service quality and student satisfaction: A case study at private higher education institutions, 2008 ABR Conference Proceedings.
Anderson, E. & Sullivan, M. (1993). The antecedents and consequences of customer satisfaction for firms, Marketing Science, 12(2), 125-44.
Babakus, E. & Boller, G.W. (1992), An empirical assessment of the SERVQUAL scale, Journal of Business Research. 24(3), 253-68
Bearden, W. O. & Teel, J.E. (1983). Selected determinants of consumer satisfaction and complaint reports, Journal of Marketing Research, 20(1), 21-29.
Bemowski, K. (1991), Restoring the pillars of higher education, Quality Progress, Oct., 37-42.
Bitner, M.J. (1990), Evaluating service encounters: the effects of physical surroundings and employee responses, Journal of Marketing, 54, 69-82.
Bolton, R.N. (1998), A dynamic model of the duration of the customer’s relationship with a continuous service provider: the role of customer satisfaction, Marketing Science, 17(1), 45-65.
Bolten, R.N. & Drew, J.D. (1991), A longitudinal analysis of the impact of service changes on customer attitudes, Journal of Marketing, 55, 1-9.
Boulding, W.; Kalra, A.; Staelin, R.; & Zeithaml, V.A. (1993), A dynamic process model of service quality from expectations to behavioural intentions, Journal of Marketing Research, 30, 7-27.
Carman, J.M. (1990). Consumer perceptions of service quality : an assessment of the SERVQUAL dimensions. Journal of Retailing, 66(1), Spring, 33-55.
Journal of Applied Business and Economics
Cameron, K.S. (1981), Domains of organizational effectiveness in institutions of higher education. Academy of Management Journal, 24, 25-47.
Churchill, G. A. & Suprenant, C. (1982). An investigation into the determinants of customer satisfaction for firms. Marketing Science, Spring 1993: 125-43.
Conolly, T.; Conlon, E.; & Deutsch, S. (1980). Organizational effectiveness: a multiple constituency approach. Academy of Management Review, 5, 211-217.
Cronin, J. & Taylor, S. (1992). Measuring service quality: A reexamination and extension. Journal of Marketing, 56(3).
Cronin, J. & Taylor, S. (1994), SERVPERF versus SERVQUAL: Reconciling performance-based and perceptions-based-minus-expectations measure of service quality, Journal of Marketing, 58 (1), 125-131.
Crosby, P. B. (1979). Quality is free: the art of making quality certain. New York, NY: New American Library.
Cuthbert, P.F. (1996). Managing service quality in higher education, is SERVQUAL the answer? Part 2. Managing Service Quality. 6(3), 31-35.
Dubrovski, D. (2001), “The role of customer satisfaction in achieving business excellence,” Total Quality Management, 12:7/8, 920-5.
Firdaus, A. (2006). Measuring service quality in higher education: HEdPERF versus SERVPERF, Marketing Intelligence & Planning. 24(1), 31-48.
Forbes, D.P. (1998). Measuring the unmeasureable: Empirical studies of nonprofit organization effectiveness form 1977 to 1997. Nonprofit and Voluntary Sector Quarterly, 27(2), 183-202.
Garvin, D. A. (1983). Quality on the line. Harvard Business Review, 61 (September-October), 65-73.
Ginsberg, M.B. (1991), Understanding Educational Reforms in Global Context: Economy, Ideology and the State, Garland, New York, NY.
Grossman, R.P. (1999), Relational versus discrete exchanges: The role of trust and commitment in determining customer satisfaction, The Journal of Marketing Management, 9(2), 47-58.
Hart, L.K.; Lopez, J.; Jalbert, M.; Jalbert, T; & Rampersad, A. (2007). Are retail banks satisfying their customers in Costa Rica? Global Journal of Business Research, 1(2), 73-86.
Heskett, J.L.; Sasser, W.E. & Schlesinger, L.A. (1997), The Service Profit Chain: How Leading Companies Link Profit and Growth to Loyalty, Satisfaction, and Value, The Free Press, New York, NY.
Journal of Applied Business and Economics

Joseph, M. & Joseph, B. (1997). Service quality in education: a student perspective, Quality Assurance in Education, 5(1), 26-37.
Kanter, R.S. & Summers, D.V. (1987). Doing well while doing good: dilemmas of performance measurement in nonprofit organizations and the need for a multiple constituency approach. In W.W. Powell (ed.), The Nonprofit Sector: a Research Handbook. Yale University Press, New Haven, CT.
Kaplan, R. (2001a). Strategic performance measurement and management in nonprofit organizations. Nonprofit Management & Leadership, 11(3), 353-370.
Kaplan, R. & Norton, D. (2001b). The strategy-focused organization, Strategy & Leadership, May/June; 29(3), 41-42.
Kaplan, R. & Norton, D. (1996a). Using the Balanced Scorecard as a strategic management system. Harvard Business Review. January-February, 75-85.
Kaplan, R. & Norton, D. (1996b). Linking the balanced scorecard to strategy. California Management Review, Fall. 39(1), 53-79.
Kotler, P. & Fox, K.F.M. (1995), Strategic marketing for educational institutions, Englewood Cliffs, NJ: Prentice Hall.
Kristensen, K.; Dahlgaard, J.J. & Kanji, G.K. (1992), On measurement of customer satisfaction, Total Quality Management, 3(2), 123-8.
Lassar, W.; Manolis, C.; & Winsor, R. (2000). Service quality perspectives and satisfaction in private banking. The International Journal of Bank Marketing, 18(4).
Lehtinen, U. & Lehtinen, J. (1982). Service quality: a study of quality dimensions. Unpublished working paper from the Helsinki Service Management Institute.
Lopez, J.; Kozloski Hart, L.; & Rampersad, A. (2007). Ethnicity and customer satisfaction in the financial services sector, Managing Service Quality, 17/3, 259-274.
Loveman, G.W. (1998). Employee satisfaction, customer loyalty, and financial performance: an empirical examination of the service product chain in retail banking, Journal of Service Research, 1(1), 18-31.
McColl-Kennedy, J. & Schneider, U. (2000), Measuring customer satisfaction: why, what, and how, Total Quality Management, 11(7), 883-896.
Niven, P.R. (2005). Driving focus and alignment with the balanced scorecard, The Journal for
Quality and Participation; Winter, 28(4), 21-25.
Nunnally, J. (1970). Introduction to psychological measurement. New York: McGraw-Hill, Inc.
Journal of Applied Business and Economics

Oldfield, B.M. & Baron, S. (2000), Student perceptions of service quality in a UK university business and management faculty, Quality Assurance in Education, 8(2), 85-96.
Oliver, R.L. (1980). A cognitive model of the antecedents and consequences of satisfaction decisions. Journal of Marketing Research, 17, November, 460-469.
O’Neill, M. (2000), The role of perception in disconfirmation models of service quality, Measuring Business Excellence, 4(2), 46-59.
O’Neill, M. (2003), The influence of time on student perceptions of service quality: the need for longitudinal measures, Journal of Educational Administration, 41(3), 310-324.
O’Neill, M. & Palmer, A. (2004). Importance-performance analysis: a useful tool for directing continuous quality improvement in higher education, Quality Assurance in Education, 12(1), 39-52.
Parasuraman, A.: Zeithaml, V.A. & Berry, L. (1985). A conceptual model of service quality and its implications for future research. Journal of Marketing, Fall, 41-50.
Parasuraman, A.; Berry, L.; & Zeithaml, V.A. (1988). SERVQUAL: A multiple-item scale for measuring consumer perceptions of service quality. Journal of Retailing, 64(1), 12-37.
Parasuraman, A.; Berry, L.; & Zeithaml, V. A. (1991). Understanding Customer Expectations of Service, Sloan Management Review. Spring, 32(3), 39-49.
Pariseau, S.E. & McDaniel, J.R. (1997). Assessing service quality in schools of business. International Journal of Quality and Reliability Management, 14(3), 204-218.
Rigotti, S. & Pitt, L. (1992). SERVQUAL as a Measuring Instrument for Service Provider Gaps in Business Schools, Management Research News, 15(3), 9-17.
Rucci, A.J.; Kim, S.P. & Quinn, R. T. (1998), The employee-customer-profit chain at Sears, Harvard Business Review, 76(1), 82-97.
Rust, R. & Zahorik, A. (1993). Customer satisfaction, customer retention, and market share. Journal of Retailing, 69(2), 193-215.
Snow, K.; Bartel, H. & Cullen, T. (1996) How ethnicity influences service expectations – A Canadian perspective. Managing Service Quality, 6(6), 33.
Soutar, G. & McNeil, M. (1996), Measuring service quality in a tertiary institution, Journal of Educational Administration, 34(1), 77-82.
Sureshchandar, G.S.; Rajendran C.; & Anantharaman, R.N. (2002). The relationship between service quality and customer satisfaction-a factor specific approach. The Journal of Services Marketing, 16(1), 9-34.
Journal of Applied Business and Economics
Szymanski, D.M. & Henard, D.H. (2001), Customer satisfaction: a meta-analysis of the empirical evidence, Journal of the Academy of Marketing Science, 29(1), 16-35.
Teas, R.K. (1993), Consumer expectations and the measurement of perceived service quality, Journal of Professional Services Marketing, 8(2), 33-54.
Yuksel, M. & Rimmington, M. (1998), Customer-satisfaction measurement, Cornell Hotel & Restaurant Administration Quarterly, 39(2), 31-46.
Zeithaml, V. A. (1981). How consumer evaluation processes differ between goods and services, in Marketing of Services, Donnelly, J. & George W. (eds.) Chicago, IL: American Marketing, 186-190.
Zeithaml, V.A; Berry, L.L.; and Parasuraman, A. (1996.) The behavioral consequences of service quality, Journal of Marketing. 60(2), 31-47.
Journal of Applied Business and Economics