spiceworks: the 2015 it budget report
TRANSCRIPT
1Where IT goes to work.
FREE IT REPORTS ON TODAY’S HOTTEST TECH TOPICS AND TRENDS.
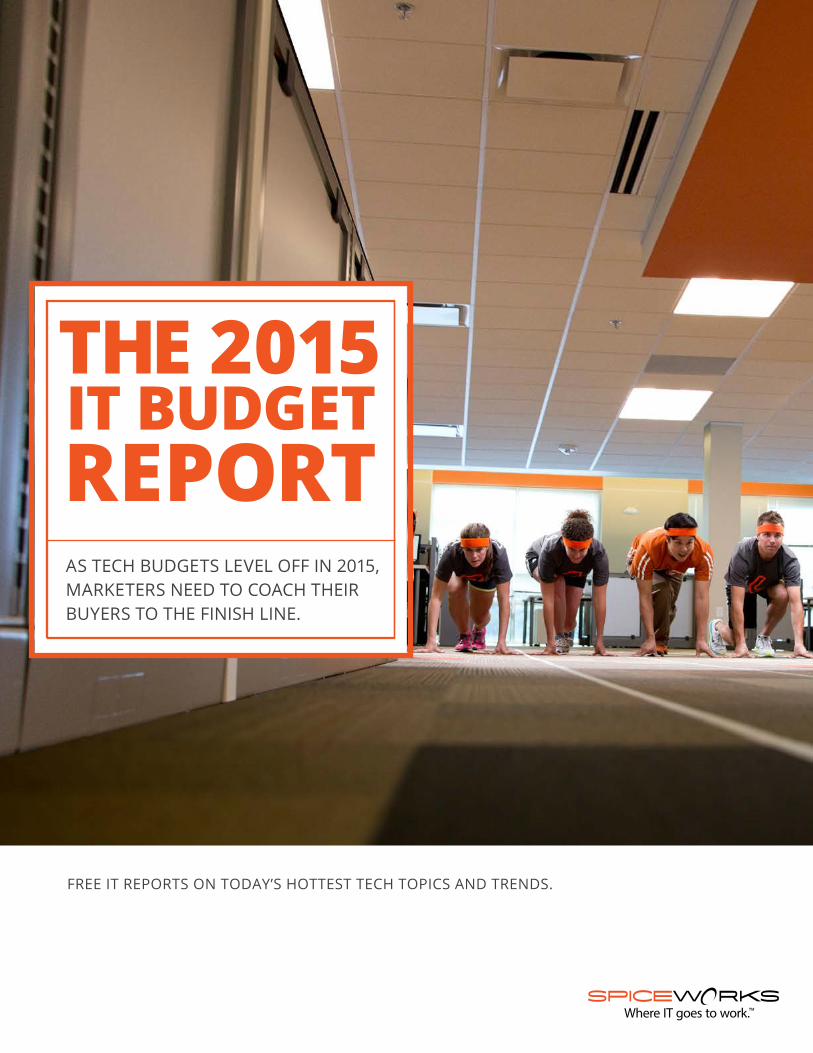
AS TECH BUDGETS LEVEL OFF IN 2015, MARKETERS NEED TO COACH THEIR BUYERS TO THE FINISH LINE.

2
TABLE OF CONTENTS
3
00
THE STARTING LINE
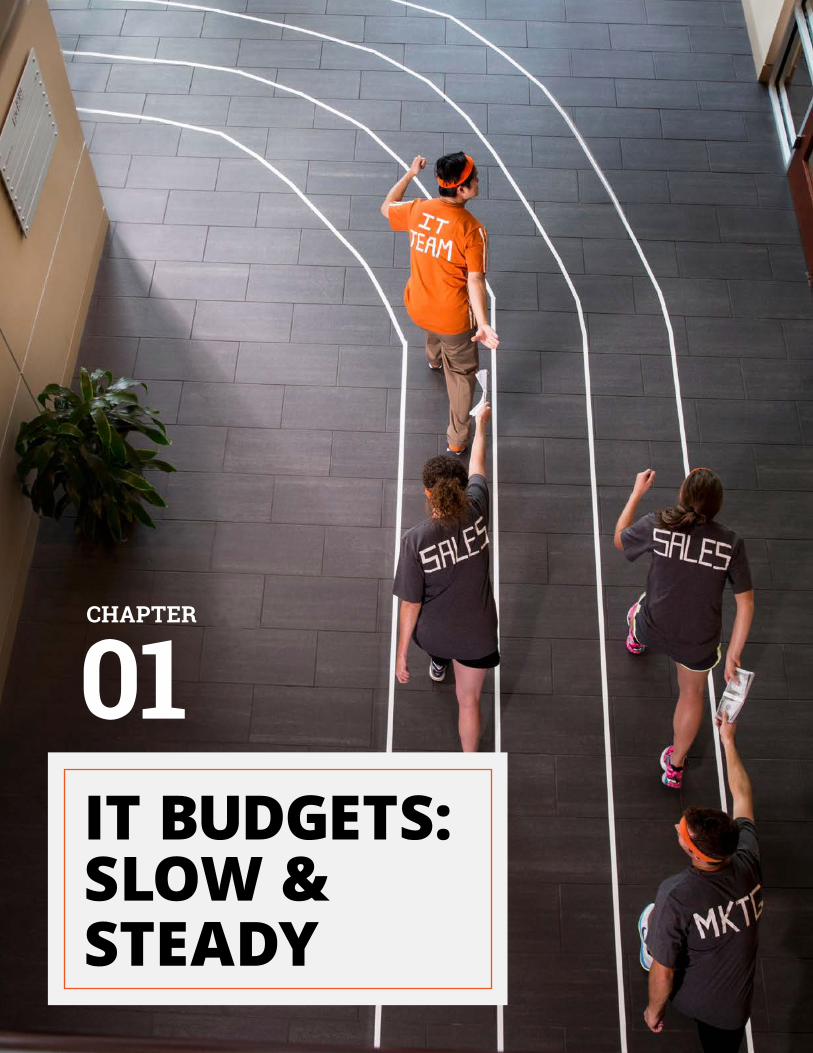
01
IT BUDGETS: SLOW &
STEADY
02
TECH HURDLES ON
THE HORIZON
03
HOW TO BECOME A
MARKETING CHAMP
04
CLOSING CEREMONIES
4
00CHAPTER
5
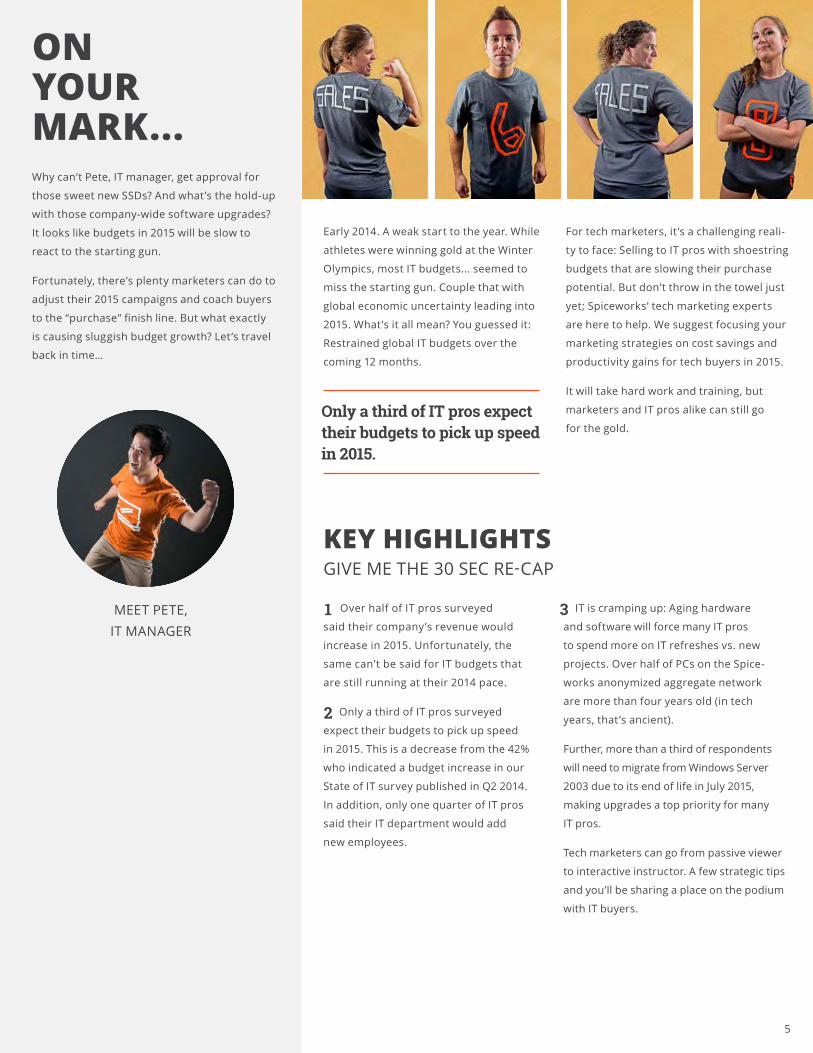
ON YOUR MARK... Why can’t Pete, IT manager, get approval for
those sweet new SSDs? And what’s the hold-up
with those company-wide software upgrades?
It looks like budgets in 2015 will be slow to
react to the starting gun.
Fortunately, there’s plenty marketers can do to
adjust their 2015 campaigns and coach buyers
to the “purchase” finish line. But what exactly
is causing sluggish budget growth? Let’s travel
back in time…
MEET PETE, IT MANAGER
Early 2014. A weak start to the year. While
athletes were winning gold at the Winter
Olympics, most IT budgets... seemed to
miss the starting gun. Couple that with
global economic uncertainty leading into
2015. What’s it all mean? You guessed it:
Restrained global IT budgets over the
coming 12 months.
For tech marketers, it ’s a challenging reali-
ty to face: Selling to IT pros with shoestring
budgets that are slowing their purchase
potential. But don’t throw in the towel just
yet; Spiceworks’ tech marketing experts
are here to help. We suggest focusing your
marketing strategies on cost savings and
productivity gains for tech buyers in 2015.
It will take hard work and training, but
marketers and IT pros alike can still go
for the gold.Only a third of IT pros expect their budgets to pick up speed in 2015.
KEY HIGHLIGHTSGIVE ME THE 30 SEC RE-CAP
Over half of IT pros surveyed
said their company’s revenue would
increase in 2015. Unfortunately, the
same can’t be said for IT budgets that
are still running at their 2014 pace.
Only a third of IT pros surveyed
expect their budgets to pick up speed
in 2015. This is a decrease from the 42%
who indicated a budget increase in our
State of IT survey published in Q2 2014.
In addition, only one quarter of IT pros
said their IT department would add
new employees.
IT is cramping up: Aging hardware
and software will force many IT pros
to spend more on IT refreshes vs. new
projects. Over half of PCs on the Spice-
works anonymized aggregate network
are more than four years old (in tech
years, that’s ancient).
Further, more than a third of respondents
will need to migrate from Windows Server
2003 due to its end of life in July 2015,
making upgrades a top priority for many
IT pros.
Tech marketers can go from passive viewer
to interactive instructor. A few strategic tips
and you’ll be sharing a place on the podium
with IT buyers.
1
2
3
6
01CHAPTER
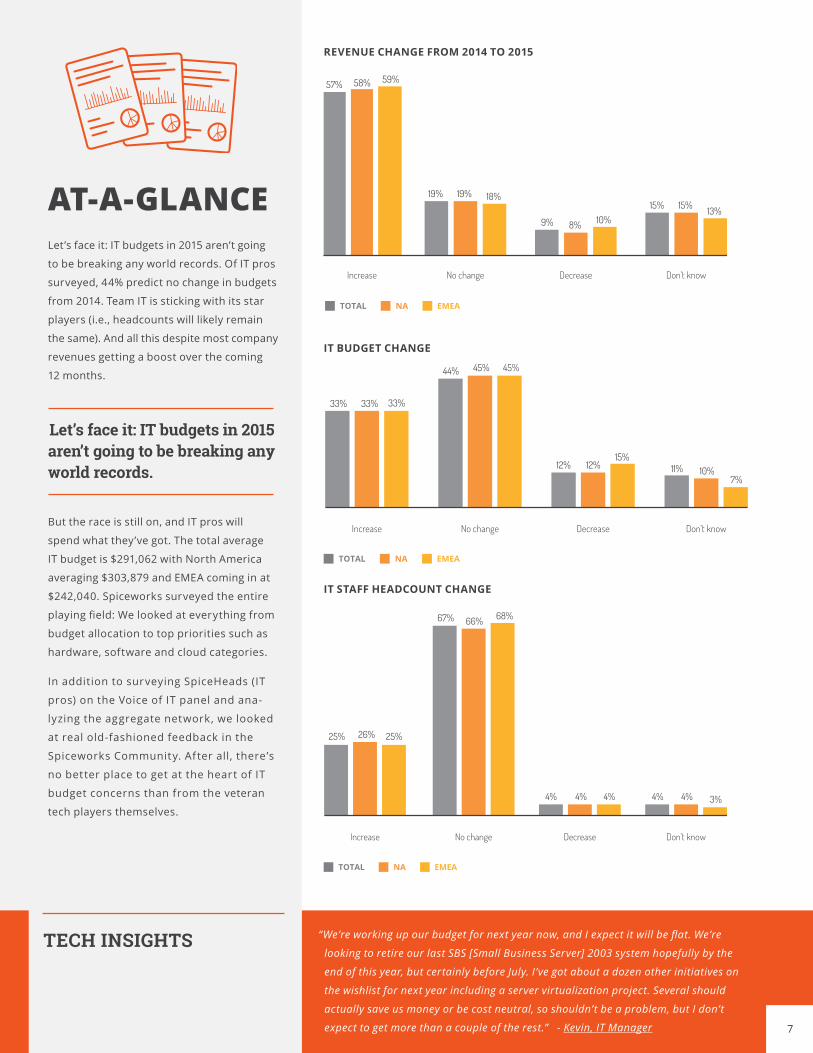
AT-A-GLANCE Let’s face it: IT budgets in 2015 aren’t going
to be breaking any world records. Of IT pros
surveyed, 44% predict no change in budgets
from 2014. Team IT is sticking with its star
players (i.e., headcounts will likely remain
the same). And all this despite most company
revenues getting a boost over the coming
12 months.
But the race is still on, and IT pros will
spend what they’ve got. The total average
IT budget is $291,062 with North America
averaging $303,879 and EMEA coming in at
$242,040. Spiceworks surveyed the entire
playing field: We looked at everything from
budget allocation to top priorities such as
hardware, software and cloud categories.
In addition to surveying SpiceHeads (IT
pros) on the Voice of IT panel and ana-
lyzing the aggregate network, we looked
at real old-fashioned feedback in the
Spiceworks Community. After all, there’s
no better place to get at the heart of IT
budget concerns than from the veteran
tech players themselves.
REVENUE CHANGE FROM 2014 TO 2015
IT BUDGET CHANGE
Let’s face it: IT budgets in 2015 aren’t going to be breaking any world records.
IT STAFF HEADCOUNT CHANGE
“We’re working up our budget for next year now, and I expect it will be flat. We’re
looking to retire our last SBS [Small Business Server] 2003 system hopefully by the
end of this year, but certainly before July. I’ve got about a dozen other initiatives on
the wishlist for next year including a server virtualization project. Several should
actually save us money or be cost neutral, so shouldn’t be a problem, but I don’t
expect to get more than a couple of the rest.” - Kevin, IT Manager
TECH INSIGHTS
TOTAL NA EMEA
57% 58% 59%
19% 19% 18%
9% 8% 10%15%15% 13%
Increase No change Decrease Don’t know
Increase No change Decrease Don’t know
33% 33% 33%
44% 45% 45%
12% 12%15%
11% 10%7%
TOTAL NA EMEA
Increase No change Decrease Don’t know
25% 26% 25%
67% 66% 68%
4% 4% 4% 4% 4% 3%
TOTAL NA EMEA
7
8
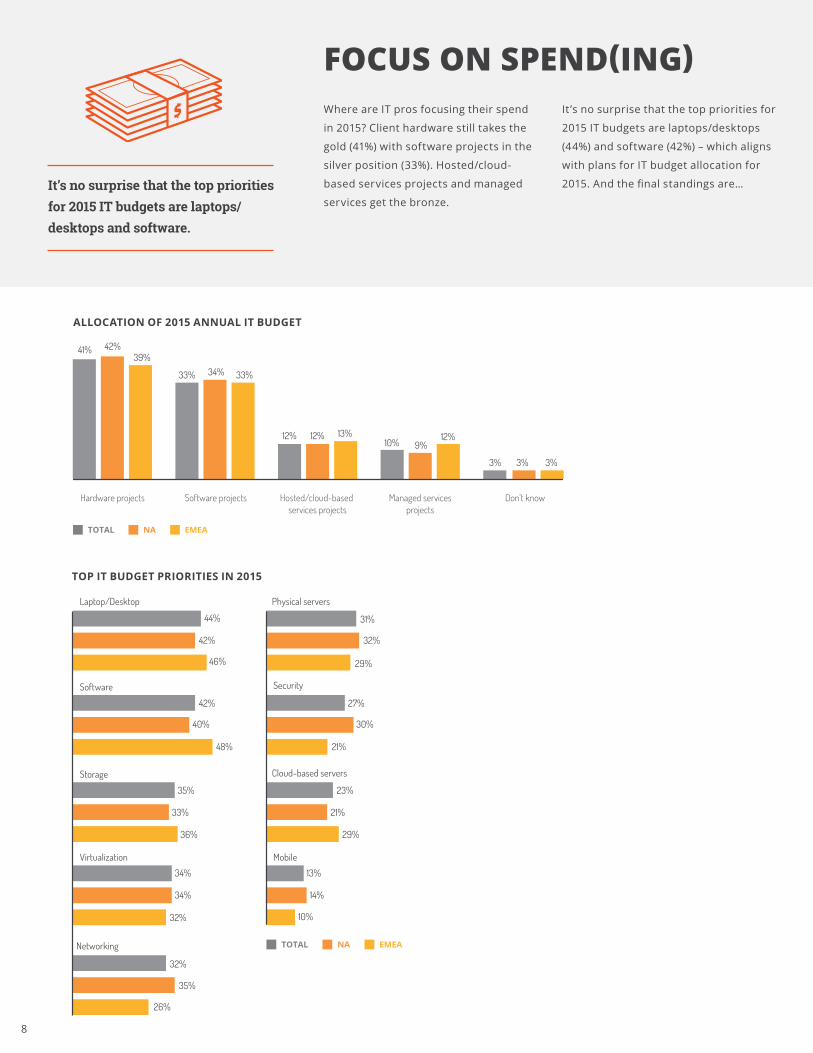
FOCUS ON SPEND(ING) Where are IT pros focusing their spend
in 2015? Client hardware still takes the
gold (41%) with software projects in the
silver position (33%). Hosted/cloud-
based services projects and managed
services get the bronze.
It ’s no surprise that the top priorities for
2015 IT budgets are laptops/desktops
(44%) and software (42%) – which aligns
with plans for IT budget allocation for
2015. And the final standings are…
ALLOCATION OF 2015 ANNUAL IT BUDGET
It’s no surprise that the top priorities for 2015 IT budgets are laptops/ desktops and software.
TOP IT BUDGET PRIORITIES IN 2015
Hardware projects Software projects Hosted/cloud-based services projects
Don’t know
41%
Managed servicesprojects
42%39%
33% 34% 33%
12% 12% 13%10% 9%
12%
3% 3% 3%
TOTAL NA EMEA
Software
Laptop/Desktop
Storage
Virtualization
Networking
Mobile
Cloud-based servers
Security
Physical servers
44%
42%
46%
42%
40%
48%
35%
33%
36%
34%
34%
32%
32%
35%
26%
13%
14%
10%
29%
21%
23%
21%
30%
27%
29%
32%
31%
TOTAL NA EMEA
9
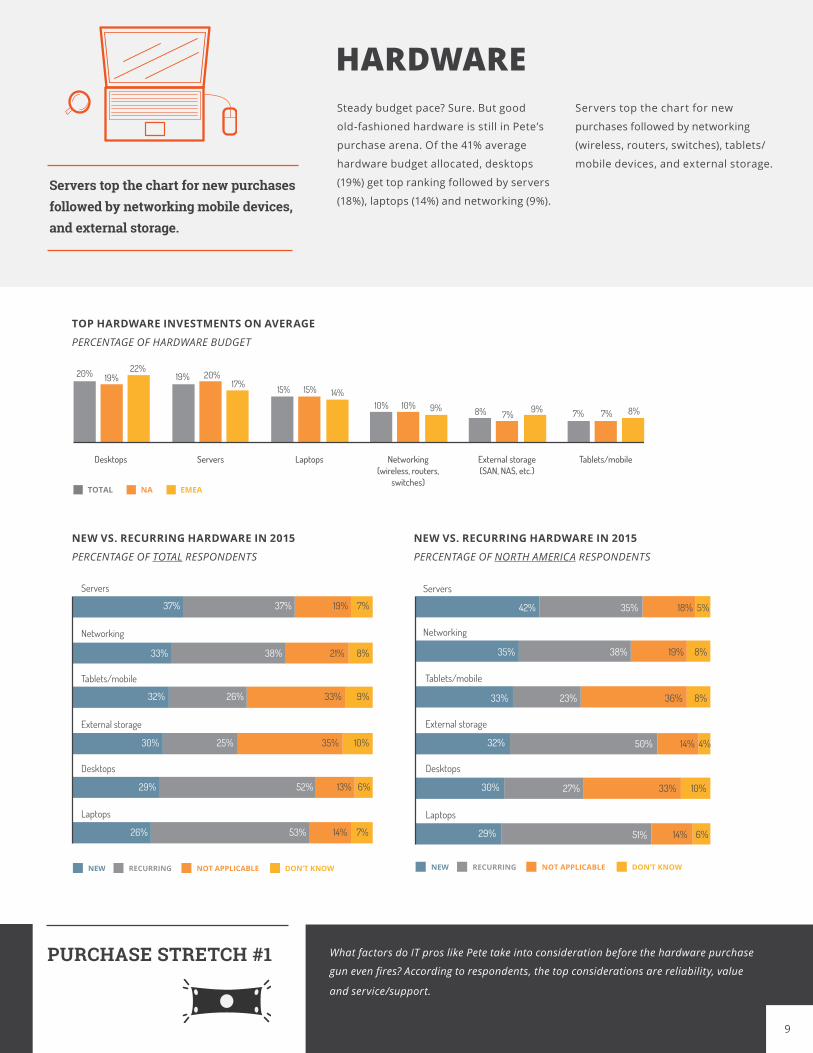
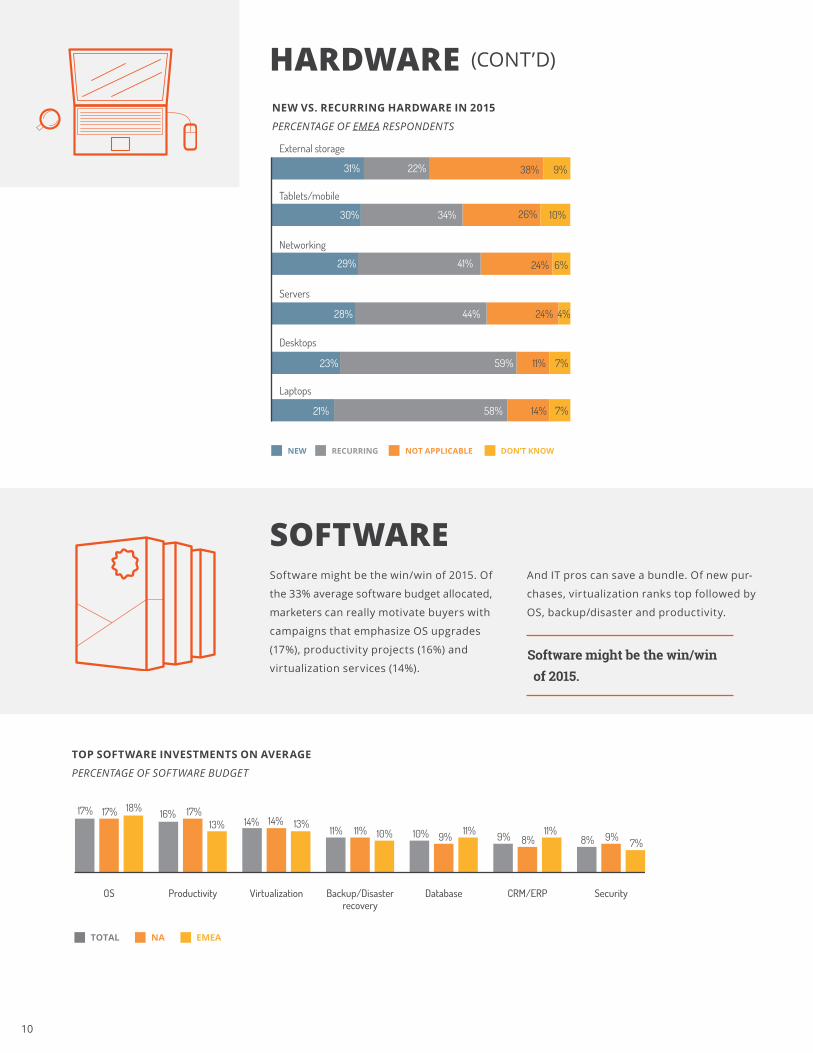
HARDWARE Steady budget pace? Sure. But good
old-fashioned hardware is still in Pete’s
purchase arena. Of the 41% average
hardware budget allocated, desktops
(19%) get top ranking followed by servers
(18%), laptops (14%) and networking (9%).
Servers top the chart for new
purchases followed by networking
(wireless, routers, switches), tablets/
mobile devices, and external storage.
Servers top the chart for new purchases followed by networking mobile devices, and external storage.
TOP HARDWARE INVESTMENTS ON AVERAGE
PERCENTAGE OF HARDWARE BUDGET
NEW VS. RECURRING HARDWARE IN 2015
PERCENTAGE OF TOTAL RESPONDENTS
External storage(SAN, NAS, etc.)
Networking(wireless, routers,
switches)
LaptopsServersDesktops
20% 19%22%
19% 20%17% 15% 15% 14%
10% 10% 9% 8% 7% 9%
Tablets/mobile
7% 7% 8%
TOTAL NA EMEA
Servers
37% 37% 19%
Networking
Tablets/mobile
External storage
Desktops
Laptops
7%
33% 38% 21% 8%
9%26% 33%32%
10%35%25%30%
29% 52% 13% 6%
26% 53% 14% 7%
RECURRING NOT APPLICABLE DON’T KNOWNEW
NEW VS. RECURRING HARDWARE IN 2015
PERCENTAGE OF NORTH AMERICA RESPONDENTS
5%
Servers
Networking
Tablets/mobile
External storage
Desktops
Laptops
18%35%42%
35% 38% 19% 8%
33% 23% 36% 8%
32% 50% 14% 4%
30% 27% 33% 10%
29% 51% 14% 6%
RECURRING NOT APPLICABLE DON’T KNOWNEW
What factors do IT pros like Pete take into consideration before the hardware purchase
gun even fires? According to respondents, the top considerations are reliability, value
and service/support.
PURCHASE STRETCH #1
10
TOP SOFTWARE INVESTMENTS ON AVERAGE
PERCENTAGE OF SOFTWARE BUDGET
HARDWARE (CONT’D) NEW VS. RECURRING HARDWARE IN 2015
PERCENTAGE OF EMEA RESPONDENTS
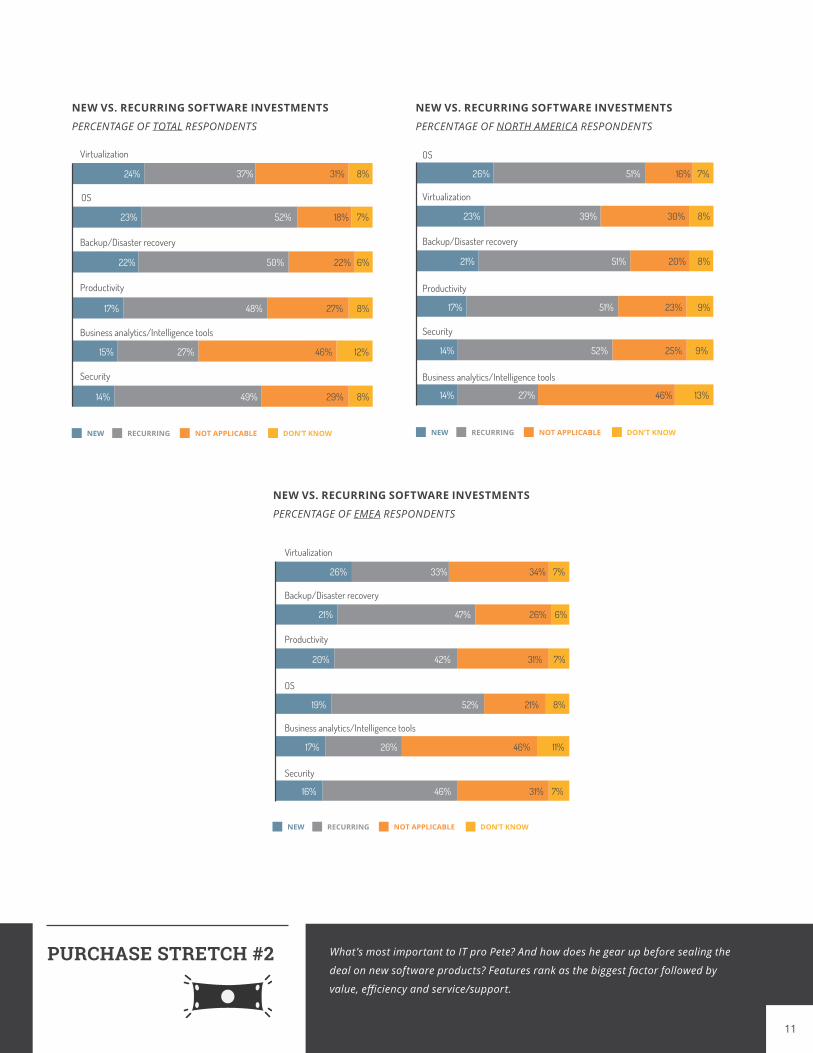
SOFTWARESoftware might be the win/win of 2015. Of
the 33% average software budget allocated,
marketers can really motivate buyers with
campaigns that emphasize OS upgrades
(17%), productivity projects (16%) and
virtualization services (14%).
And IT pros can save a bundle. Of new pur-
chases, virtualization ranks top followed by
OS, backup/disaster and productivity.
Software might be the win/win of 2015.
OS
17%
Productivity Virtualization Backup/Disasterrecovery
Database CRM/ERP Security
17% 18% 16% 17%13% 14% 14% 13%
11% 11% 10% 10% 9% 11% 9% 8%11%
8% 9% 7%
TOTAL NA EMEA
External storage
Tablets/mobile
Networking
Servers
Desktops
Laptops
31%
30%
29%
28%
23%
21%
22%
34%
41%
44%
59%
58%
38%
26%
24%
24%
11%
14%
9%
10%
6%
4%
7%
7%
RECURRING NOT APPLICABLE DON’T KNOWNEW
11
Virtualization
OS
Backup/Disaster recovery
Productivity
Business analytics/Intelligence tools
Security
24%
23%
22%
17%
15%
14%
37%
52%
50%
48%
27%
49%
31%
18%
22%
27%
46%
29% 8%
12%
8%
6%
7%
8%
RECURRING NOT APPLICABLE DON’T KNOWNEW
NEW VS. RECURRING SOFTWARE INVESTMENTS
PERCENTAGE OF TOTAL RESPONDENTS
NEW VS. RECURRING SOFTWARE INVESTMENTS
PERCENTAGE OF NORTH AMERICA RESPONDENTS
NEW VS. RECURRING SOFTWARE INVESTMENTS
PERCENTAGE OF EMEA RESPONDENTS
OS
Virtualization
Backup/Disaster recovery
Productivity
Security
Business analytics/Intelligence tools
26%
23%
21%
9%
9%
8%
8%
7%
25%
23%
20%
30%
16%
52%
51%
51%
39%
51%
17%
14%
14% 13%46%27%
RECURRING NOT APPLICABLE DON’T KNOWNEW
26%
11%
8%
7%
6%
7%
7%
46%
21%
31%
26%
34%
31%
26%
52%
42%
47%
33%
46%
17%
19%
20%
21%
16%
Virtualization
OS
Backup/Disaster recovery
Productivity
Business analytics/Intelligence tools
Security
RECURRING NOT APPLICABLE DON’T KNOWNEW
What’s most important to IT pro Pete? And how does he gear up before sealing the
deal on new software products? Features rank as the biggest factor followed by
value, efficiency and service/support.
PURCHASE STRETCH #2
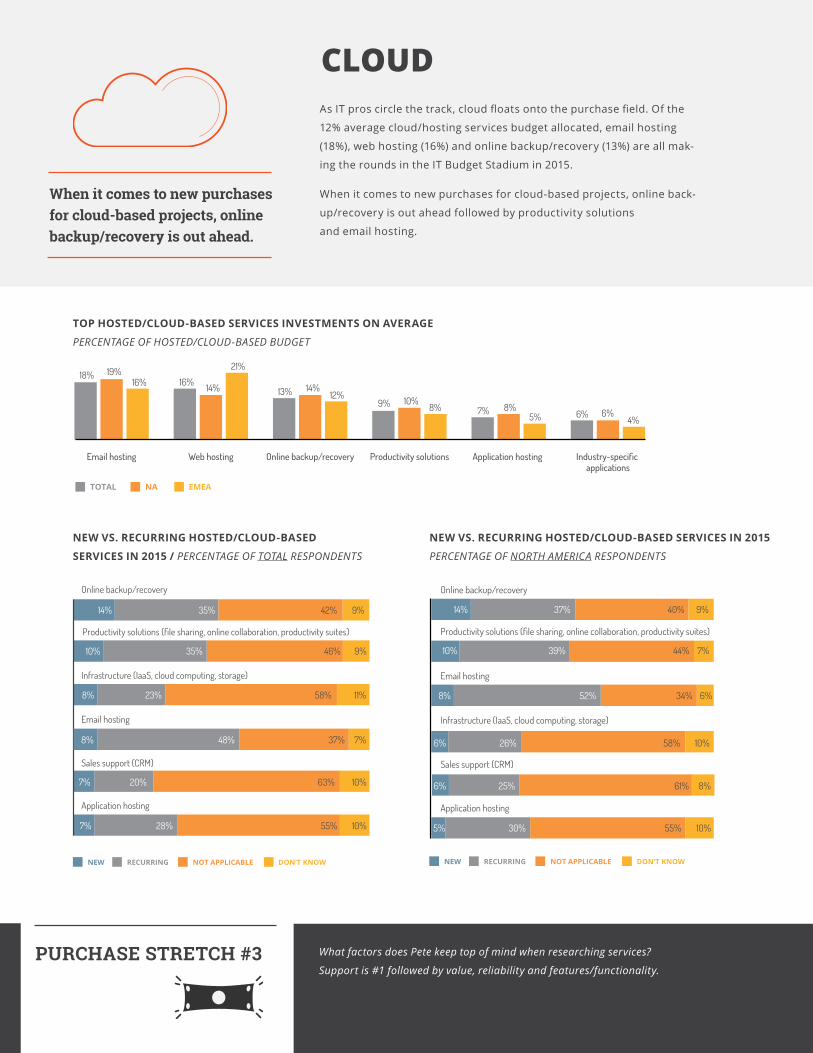
CLOUD As IT pros circle the track, cloud floats onto the purchase field. Of the
12% average cloud/hosting services budget allocated, email hosting
(18%), web hosting (16%) and online backup/recovery (13%) are all mak-
ing the rounds in the IT Budget Stadium in 2015.
When it comes to new purchases for cloud-based projects, online back-
up/recovery is out ahead followed by productivity solutions
and email hosting.
When it comes to new purchases for cloud-based projects, online backup/recovery is out ahead.
TOP HOSTED/CLOUD-BASED SERVICES INVESTMENTS ON AVERAGE
PERCENTAGE OF HOSTED/CLOUD-BASED BUDGET
What factors does Pete keep top of mind when researching services?
Support is #1 followed by value, reliability and features/functionality.PURCHASE STRETCH #3
Email hosting Web hosting Online backup/recovery Productivity solutions Application hosting Industry-specific applications
18%16%
19%16% 14%
21%
13% 14%12%
9% 10%8% 7% 8%
5% 6% 6%4%
TOTAL NA EMEA
NEW VS. RECURRING HOSTED/CLOUD-BASED
SERVICES IN 2015 / PERCENTAGE OF TOTAL RESPONDENTS
NEW VS. RECURRING HOSTED/CLOUD-BASED SERVICES IN 2015
PERCENTAGE OF NORTH AMERICA RESPONDENTS
Online backup/recovery
Productivity solutions (file sharing, online collaboration, productivity suites)
Infrastructure (IaaS, cloud computing, storage)
Email hosting
Sales support (CRM)
Application hosting
10%
10%
7%
11%
9%
9%42%
46%
58%
37%
63%
55%
35%
35%
23%
48%
20%
28%
14%
10%
8%
8%
7%
7%
RECURRING NOT APPLICABLE DON’T KNOWNEW
Online backup/recovery
Productivity solutions (file sharing, online collaboration, productivity suites)
Email hosting
Infrastructure (IaaS, cloud computing, storage)
Sales support (CRM)
Application hosting
10%
8%
10%
6%
7%
9%40%
44%
34%
58%
61%
55%
37%
39%
52%
26%
25%
30%
14%
10%
8%
6%
6%
5%
RECURRING NOT APPLICABLE DON’T KNOWNEW
13
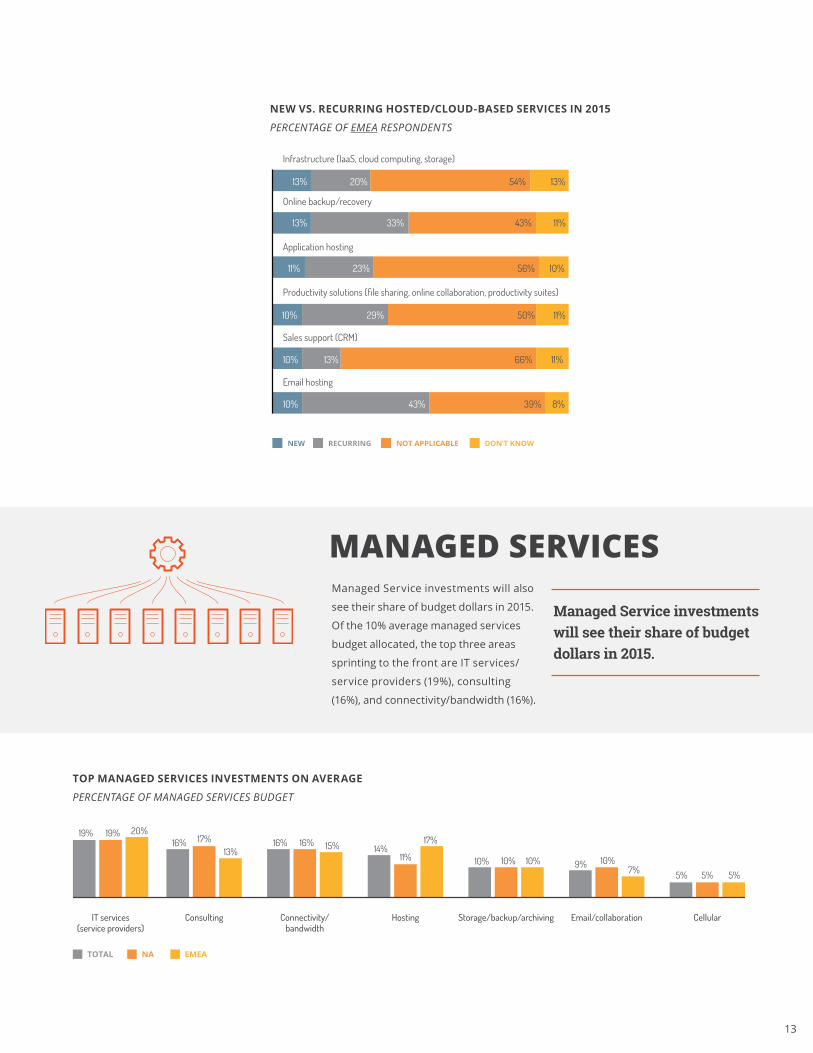
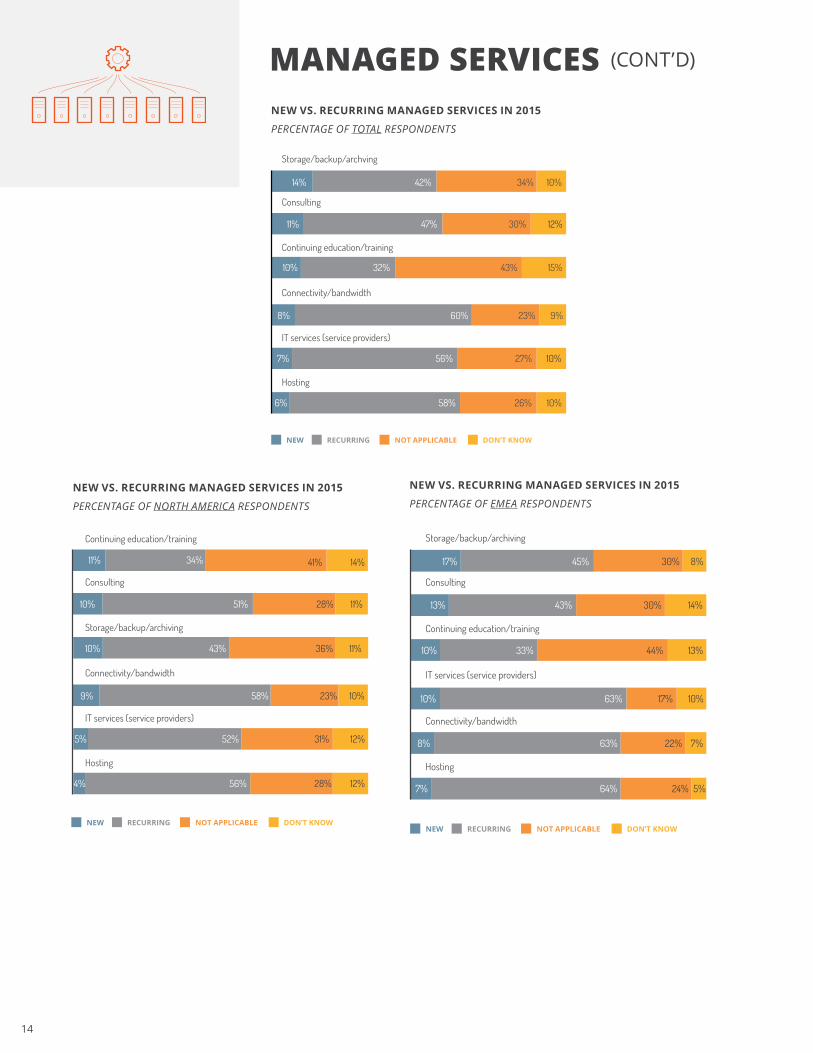
MANAGED SERVICES Managed Service investments will also
see their share of budget dollars in 2015.
Of the 10% average managed services
budget allocated, the top three areas
sprinting to the front are IT services/
service providers (19%), consulting
(16%), and connectivity/bandwidth (16%).
Managed Service investments will see their share of budget dollars in 2015.
TOP MANAGED SERVICES INVESTMENTS ON AVERAGE
PERCENTAGE OF MANAGED SERVICES BUDGET
NEW VS. RECURRING HOSTED/CLOUD-BASED SERVICES IN 2015
PERCENTAGE OF EMEA RESPONDENTS
NEW VS. RECURRING HOSTED/CLOUD-BASED SERVICES IN 2015
PERCENTAGE OF NORTH AMERICA RESPONDENTS
Infrastructure (IaaS, cloud computing, storage)
Online backup/recovery
Application hosting
Productivity solutions (file sharing, online collaboration, productivity suites)
Sales support (CRM)
Email hosting
13%
13%
11%
10%
10%
10%
20%
33%
23%
29%
13%
43%
54%
43%
56%
50%
66%
39% 8%
11%
11%
10%
11%
13%
RECURRING NOT APPLICABLE DON’T KNOWNEW
IT services(service providers)
Consulting Connectivity/bandwidth
Hosting Storage/backup/archiving Email/collaboration Cellular
19% 19% 20%16% 17%
13%16% 16% 15% 14%
11%
17%
10% 10% 10% 9% 10%7% 5% 5% 5%
TOTAL NA EMEA
14
MANAGED SERVICES (CONT’D) NEW VS. RECURRING MANAGED SERVICES IN 2015
PERCENTAGE OF TOTAL RESPONDENTS
NEW VS. RECURRING MANAGED SERVICES IN 2015
PERCENTAGE OF NORTH AMERICA RESPONDENTS
NEW VS. RECURRING MANAGED SERVICES IN 2015
PERCENTAGE OF EMEA RESPONDENTS
0 20 40 60 80 100
Storage/backup/archving
Consulting
Continuing education/training
Connectivity/bandwidth
IT services (service providers)
Hosting
10%34%42%
12%30%47%
15%
11%
14%
43%32%10%
8% 60% 23% 9%
7% 56% 27% 10%
6% 58% 26% 10%
RECURRING NOT APPLICABLE DON’T KNOWNEW
Continuing education/training
Consulting
Storage/backup/archiving
Connectivity/bandwidth
IT services (service providers)
Hosting
14%
11%
11%
23%
36%
31% 12%
10%
28% 12%
58%
52%
56%
43%
51% 28%
34% 41%11%
10%
10%
9%
5%
4%
RECURRING NOT APPLICABLE DON’T KNOWNEW
17%
13%
10%
10%
8%
7%
45%
43%
33%
63%
63%
64%
30%
30%
44%
17%
22%
24% 5%
7%
10%
13%
14%
8%
Storage/backup/archiving
Consulting
Continuing education/training
IT services (service providers)
Connectivity/bandwidth
Hosting
RECURRING NOT APPLICABLE DON’T KNOWNEW
15
02CHAPTER
17
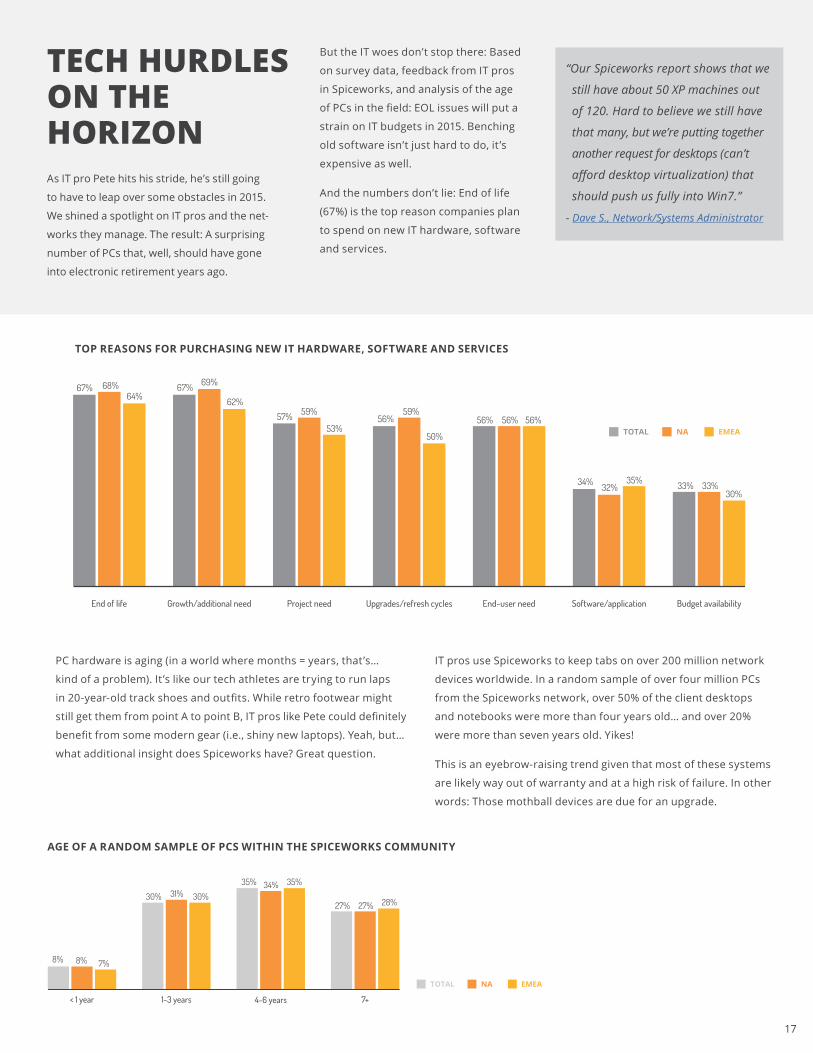
TECH HURDLES ON THE HORIZON As IT pro Pete hits his stride, he’s still going
to have to leap over some obstacles in 2015.
We shined a spotlight on IT pros and the net-
works they manage. The result: A surprising
number of PCs that, well, should have gone
into electronic retirement years ago.
But the IT woes don’t stop there: Based
on survey data, feedback from IT pros
in Spiceworks, and analysis of the age
of PCs in the field: EOL issues will put a
strain on IT budgets in 2015. Benching
old software isn’t just hard to do, it ’s
expensive as well.
And the numbers don’t lie: End of life
(67%) is the top reason companies plan
to spend on new IT hardware, software
and services.
“Our Spiceworks report shows that we
still have about 50 XP machines out
of 120. Hard to believe we still have
that many, but we’re putting together
another request for desktops (can’t
afford desktop virtualization) that
should push us fully into Win7.”
- Dave S., Network/Systems Administrator
PC hardware is aging (in a world where months = years, that’s…
kind of a problem). It ’s like our tech athletes are trying to run laps
in 20-year-old track shoes and outfits. While retro footwear might
still get them from point A to point B, IT pros like Pete could definitely
benefit from some modern gear (i.e., shiny new laptops). Yeah, but…
what additional insight does Spiceworks have? Great question.
IT pros use Spiceworks to keep tabs on over 200 million network
devices worldwide. In a random sample of over four million PCs
from the Spiceworks network, over 50% of the client desktops
and notebooks were more than four years old… and over 20%
were more than seven years old. Yikes!
This is an eyebrow-raising trend given that most of these systems
are likely way out of warranty and at a high risk of failure. In other
words: Those mothball devices are due for an upgrade.
TOP REASONS FOR PURCHASING NEW IT HARDWARE, SOFTWARE AND SERVICES
AGE OF A RANDOM SAMPLE OF PCS WITHIN THE SPICEWORKS COMMUNITY
67%
TOTAL NA EMEA
End of life Growth/additional need Project need Upgrades/refresh cycles End-user need Software/application Budget availability
68%64%
67% 69%
62%
57% 59%
53%56%
59%
50%
56% 56% 56%
34% 32%35% 33% 33%
30%
TOTAL NA EMEA
< 1 year 1-3 years 4-6 years 7+
8% 8% 7%
30% 31% 30%
35% 34% 35%
27% 27% 28%
18
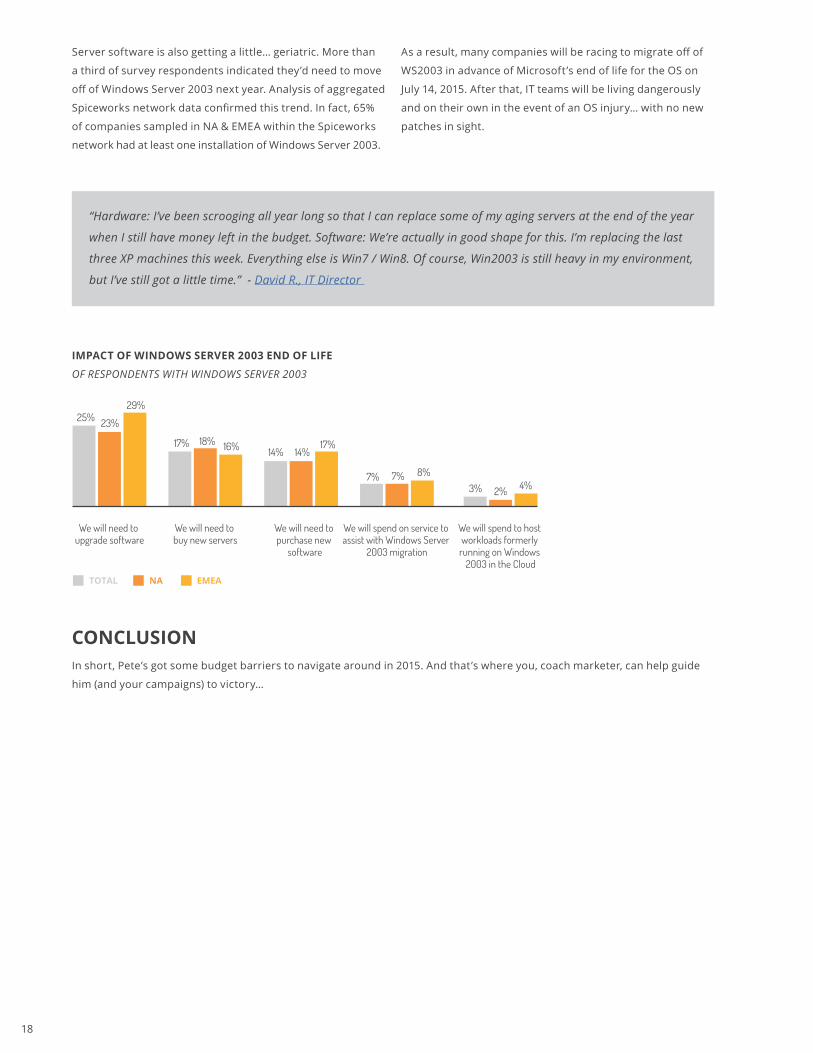
Server software is also getting a little… geriatric. More than
a third of survey respondents indicated they’d need to move
off of Windows Server 2003 next year. Analysis of aggregated
Spiceworks network data confirmed this trend. In fact, 65%
of companies sampled in NA & EMEA within the Spiceworks
network had at least one installation of Windows Server 2003.
As a result, many companies will be racing to migrate off of
WS2003 in advance of Microsoft’s end of life for the OS on
July 14, 2015. After that, IT teams will be living dangerously
and on their own in the event of an OS injury… with no new
patches in sight.
IMPACT OF WINDOWS SERVER 2003 END OF LIFE
OF RESPONDENTS WITH WINDOWS SERVER 2003
“Hardware: I’ve been scrooging all year long so that I can replace some of my aging servers at the end of the year
when I still have money left in the budget. Software: We’re actually in good shape for this. I’m replacing the last
three XP machines this week. Everything else is Win7 / Win8. Of course, Win2003 is still heavy in my environment,
but I’ve still got a little time.” - David R., IT Director
CONCLUSIONIn short, Pete’s got some budget barriers to navigate around in 2015. And that’s where you, coach marketer, can help guide
him (and your campaigns) to victory…
TOTAL NA EMEA
We will need to upgrade software
We will need to buy new servers
We will need to purchase new
software
We will spend on service to assist with Windows Server
2003 migration
We will spend to host workloads formerly
running on Windows 2003 in the Cloud
25% 23%
29%
17% 18% 16% 14% 14%17%
8%7%7%3% 2% 4%

19

20
03CHAPTER
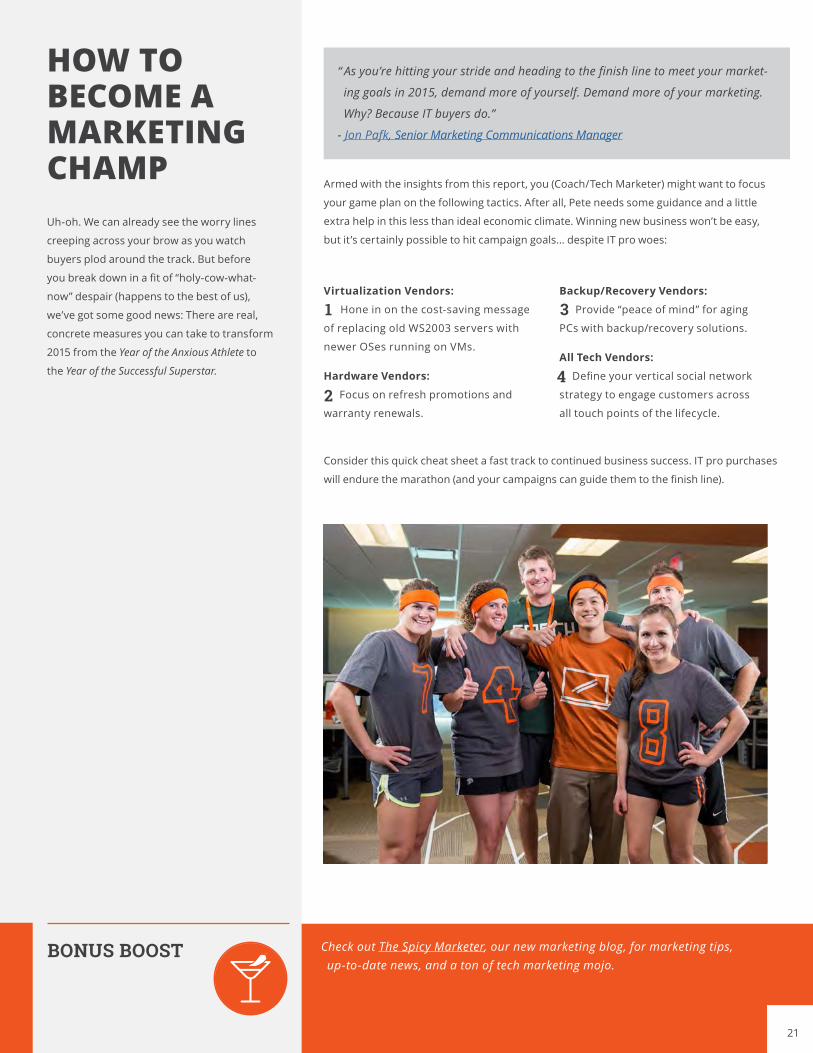
HOW TO BECOME A MARKETING CHAMP Uh-oh. We can already see the worry lines
creeping across your brow as you watch
buyers plod around the track. But before
you break down in a fit of “holy-cow-what-
now” despair (happens to the best of us),
we’ve got some good news: There are real,
concrete measures you can take to transform
2015 from the Year of the Anxious Athlete to
the Year of the Successful Superstar.
“ As you’re hitting your stride and heading to the finish line to meet your market-
ing goals in 2015, demand more of yourself. Demand more of your marketing.
Why? Because IT buyers do.”
- Jon Pafk, Senior Marketing Communications Manager
Armed with the insights from this report, you (Coach/Tech Marketer) might want to focus
your game plan on the following tactics. After all, Pete needs some guidance and a little
extra help in this less than ideal economic climate. Winning new business won’t be easy,
but it’s certainly possible to hit campaign goals… despite IT pro woes:
Virtualization Vendors:
Hone in on the cost-saving message
of replacing old WS2003 servers with
newer OSes running on VMs.
Hardware Vendors:
Focus on refresh promotions and
warranty renewals.
Backup/Recovery Vendors:
Provide “peace of mind” for aging
PCs with backup/recovery solutions.
All Tech Vendors:
Define your vertical social network
strategy to engage customers across
all touch points of the lifecycle.
1
2
3
Consider this quick cheat sheet a fast track to continued business success. IT pro purchases
will endure the marathon (and your campaigns can guide them to the finish line).
4
Check out The Spicy Marketer, our new marketing blog, for marketing tips, up-to-date news, and a ton of tech marketing mojo.
BONUS BOOST
21

22
04CHAPTER
23
CLOSING CEREMONIES The 2015 IT Budget Games are under way: IT
pros will need to adjust their tech buying hab-
its due to budget constraints that will cramp
their purchase pace. With aging hardware
and software and Windows Server 2003 EOL,
you’ll need to meet your buyers halfway by
adjusting your campaign messaging.
In short, there will be no shortage of
hurdles for IT pros and marketers alike
in 2015. But there’s also going to be tons
of opportunity to hit campaign goals (a little
course correction now will help
you go the distance).
With the right amount of prep, endurance
and focus, Olympic Gold is within your reach.
And the best part: IT buyers will thank you...
in the long run.
REPORT METHODOLOGY
We surveyed over 600 IT pros in Spice-
works about their IT budgets for 2015. We
asked them about topics covering:
• IT spending
• IT priorities (hardware, software,
cloud/SaaS-based, managed services)
• Sustaining vs. new projects
• IT staffing plans
• IT decision-making process
We analyzed Spiceworks Community
discussions regarding IT budgets to assess
prevailing sentiment among our community
of IT pros.
We analyzed an aggregated sample within
the Spiceworks network containing over
4,000,000 laptops and desktops at over
80,000 companies to get a sense of the
age of client hardware currently deployed
in the field.
1 2
INDUSTRY
COMPANY SIZE
REGION
68% 32%
North America EMEA
Manufacturing Education Healthcare Non profit Government IT service provider
Retail Finance Software Construction Engineering Consulting
TOTAL NA EMEA
15% 14%18%
6% 5% 5%
12%
4% 4% 5%
10% 10%
4% 4% 3% 4% 4%6%
4%3%4% 3% 4% 3%
12%
6%7%6%7%7%5%
8%7%4%
12%9%
TOTAL NA EMEA
Less than 19 employees
20-99 employees
100-149 employees
150-249 employees
250-499 employees
500-999 employees
1000+ employees
14% 13%17%
33% 35% 34%
13%10% 12% 13% 13% 12% 13% 13% 12%
7% 7% 6% 7% 9% 7%

24
25
Spiceworks photo credits:
Jon Pafk, Senior Marketing Communications Manager (as the IT Team “Coach”)
Peter Tsai, IT Content Marketing Manager (as the “Pete, IT Manager”)
Drew Sollberger, Manager of Demand Generation (as himself)
Emily Perdue, Email Marketing Coordinator (as a “Sales Manager”)
Tracy Peto, Custom Research Specialist (as a “Sales Manager”)
Jennifer Faulk, PR & Social Media Specialist (as a “Marketing Manager”)
Design:
Kevan Lin, Graphic Designer (Interative design, photography and art direction)
Clarice Bajkowski, Graphic Designer (Photography art direction, print design)
Marivi Delgado, Junior Graphic Designer (Photography)
The contents in this report are a result of primary research performed by Spiceworks. Unless otherwise noted, the entire contents distributed as part of this report are copyrighted by Spiceworks. As such any information made available by any means in this report may not be copied, reproduced, duplicated, published, displayed, transmitted, distributed, given, sold, traded, resold, marketed, offered for sale, modified to create derivative works or otherwise exploited for valuable consideration without prior written consent by Spiceworks. For more information visit www.spiceworks.com/voice-of-it/terms.
This report contains information of fact relating to parties other than Spiceworks. Although the information has been obtained from, and is based on sources that Spiceworks believes to be reliable, Spiceworks does not guarantee the accuracy, and any such information might be incomplete or condensed. Any estimates included in this report constitute Spiceworks’ judgment as of the date of compilation, and are subject to change without notice. This report is for information purposes only. All responsibility for any interpretations or actions based on the information or commentary contained within this report lie solely with the recipient. All rights reserved. 2014.
About Spiceworks Voice of IT®
The Spiceworks Voice of IT market insights program publishes statistics, trends and opinions collected from IT professionals worldwide. More than 620,000 IT professionals in over 100 countries have joined the program to share information and feedback on the technology issues important to them.
About Spiceworks
Spiceworks is the professional network 6 million IT professionals use to connect withone another and over 3,000 technology brands. The company simplifies how ITprofessionals discover, buy and manage more than $600 billion in technology productsand services each year. Headquartered in Austin, Texas, Spiceworks is backed byAdams Street Partners, Austin Ventures, Institutional Venture Partners (IVP), GoldmanSachs, Shasta Ventures and Tenaya Capital. For more information www.spiceworks.com
Follow Spiceworks on Twitter and connect with Spiceworks on Facebook.
Voice of IT ®

26
Where IT goes to work.