spectrophotometric determination of ceftiofur hydrochloride...
TRANSCRIPT

ISSN: 0973-4945; CODEN ECJHAO
E-Journal of Chemistry
http://www.e-journals.net 2009, 6(3), 763-769
Spectrophotometric Determination of Ceftiofur
Hydrochloride Using N-Bromosuccinimide
and p-Dimethylaminobenzaldehyde
V. ANNAPURNA, G. JYOTHI, C. RAMBABU§ and B.B.V. SAILAJA
*
Department of Chemistry,
St. Theresa’s College for Women, Eluru-534003, India. §A.N.U.P.G.Centre, Nuzvid,
*Andhra University,
Visakhapatnam-530003, Andhra Pradesh, India.
Received 22 October 2008; Accepted 12 December 2008
Abstract: Simple, accurate and reproducible UV-Visible spectrophotometric
methods were established for the assay of ceftiofur based on the formation of
oxidation and condensation products. Method A involves the oxidation of the
ceftiofur (CEFT) with N-bromosuccinimide (NBS) and determination of the
unconsumed NBS with p-N-methylaminophenol (PMAP)-sulfanilamide (SA)
(PMAP-SA) reagent. Method B includes the determination of unreacted NBS
using a known excess of celestine blue (CB) and measuring the remaining dye.
Condensation of p-dimethylaminobenzaldehyde (PDAB) with the drug was the
basis of method C. Determination of CEFT in bulk form and in pharmaceutical
formulations was also incorporated.
Keywords: Ceftiofur, N-Bromosuccinimide, p-Dimethylaminobenzaldehyde, Spectrophotometry.
Introduction
Ceftiofur (Scheme 1) (CAS Number: [80370-57-6]; IUPAC Name: (6R,7R)-7- [[(2z)-(2-
Amino-4 thiozolyl (methoxyimino) acetyl] amino] –3- [[2-furanyl carbonyl} thio], methyl]-8-
oxo-5-thia-1-azabicyclo [4-2.0] oct-2-ene –2- carboxylic acid) is a part of a family of powerful
antibiotics1. They are known as the third generation cephalosporins. The non-steroidal anti-
inflammatory drugs (NSAIDS), such as flunixin, ketoprofen and carprofen were used in
conjuction with ceftiofur, in the treatment of naturally occurring bovine respiratory diseases.
Ceftiofur(CEFT) has worldwide approvals for respiratory disease in swine, ruminants and
horses and has also been approved for foot rot and metritis infections in cattle. A very few
physicochemical methods have been reported in the literature for the assay of CEFT in

764 B.B.V. SAILAJA et al.
biological fluids and pharmaceutical formulations. Most of them are based on
spectrophotometric methods2,3
, HPLC4-8
, GC9,10
, fluorimetry11-13
, LC-MS14
, GC-MS15-17
, TLC18
and Mass19
. The analytically useful functional groups in CEFT includes 2-amino-4-thiazoyl,
β-lactam, carboxyl and double bond in dihydrothiazine have not been fully exploited for
designing suitable spectrophotometric methods and so still offer a scope to develop more
visible spectrophotometric methods with better sensitivity, selectivity, precision and accuracy.
N
S
H2NO
N
OCH3
NH
N
O
H HS
COOH
S
C
O
O
HCl
Scheme 1.Structure of ceftiofur.
A reported UV-Visible spectrophotometric method has been adopted for the
determination of CEFT in pharmaceutical formulations (Tablets) and used as reference
method to compare the results obtained by the proposed methods.
Experimental
An Elico UV–Visible digital spectrophotometer with 1cm matched quartz cells were used
for the spectral and absorbance measurements. An Elico LI-120 digital pH meter was used
for pH measurements.
All the chemicals and reagents used were of analytical grade and the aqueous solutions
were freshly prepared with triple distilled water. A 1 mg/mL stock solution was prepared by
dissolving 100 mg of pure CEFT in 100 mL of distilled water and working standards of
required concentration were prepared. NBS (N-Bromosuccinimide) (Loba; 0.088%, 4.94x10⁻³ M),
PMAP (p-N-Methylaminophenol sulphate) solution (0.3%, 8.71x10⁻³
M) and SA
(Sulphanilamide) solution (Sd-fine; 0.2%, 1.16x10⁻²
M) for method A, NBS solution (Loba;
0.01%, 5.618x10⁻⁴
M), CB (Celestine blue) solution (Chroma; 0.005%, 5.497x10⁻⁴
M) and
5 M hydrochloric acid (E.Merck) for method B, PDAB (p-Dimethylaminobenzaldehyde)
(BDH, 0.4%, 2.63x10⁻³
M) and conc. H2SO4 (Merck) for method C were prepared.
Recommended procedures Method A
Aliquots of standard CEFT solution (1.0-5.0 mL, 200 µg mL-1
) were transferred into a series
of 25 mL calibrated tubes. Then 0.5 mL (8.75x10⁻¹
M) of acetic acid and 2 mL (4.94x10⁻³
M)
of NBS solutions were added and kept aside for 15 min at room temperature. Then 1.5 mL
(8.71x10⁻³
M) of PMAP solution was added. After 2 min 2.0 mL (1.16x10⁻²
M) of SA
solution was added. The volume was made up to the mark with distilled water as blank. The
absorbance was measured after 10 min at 520 nm against distilled water. A blank
experiment was also carried out without the drug. The decrease in the absorbance and in turn
the drug concentration was obtained by subtracting the absorbance of the test solution from
the blank. The amount of CEFT was computed from its calibration graph Figure 1.
Method B
Aliquots of standard CEFT solution (0.5-3.0 mL, 20 µg mL-1
) were transferred into a series of
25 mL calibrated tubes. Then 1.25 mL (5.0 M) of HCl and 2.5 mL (5.618x10⁻⁴ M) of NBS were
added. The volume was brought to15 mL with distilled water. After 10 min, 10 mL (5.50x10⁻⁴
M)
of CB solution was added and mixed thoroughly. The absorbance was measured after 5 min at

Test vs Reagent blank
Reagent Blank vs. Distilled water
Spectrophotometric Determination of Ceftiofur Hydrochloride 765
540 nm. The blank (omitting drug) and dye (omitting drug and oxidant) solutions were prepared
in a similar manner and their absorbance was measured against distilled water. The decrease in
absorbance corresponding to consumed NBS and in turn the drug concentration was obtained by
subtracting the decrease in absorbance of the test solution (dye-test) from that of the blank
solution (dye-blank). The amount of CEFT was computed from its calibration graph Figure 2.
Figure 1. CEFT - NBS/PMAP – SA system; (a) Absorption spectrum (b) Beer’s law plot.
Figure 2. (a) CEFT - NBS/CB system; Absorption spectrum.
Ab
sorb
ance
Wavelength, nm
Ab
sorb
ance
Concentration, µg mL-1
Wavelength, nm
Ab
sorb
ance
b
a
Reagent blank Vs. Distilled water
Dye vs. Distilled water
Test vs. Distilled water

766 B.B.V. SAILAJA et al.
Figure 2. (b) CEFT - NBS/CB system; Beer’s law plot.
Method C
To each of 10 mL calibrated tubes, aliquots (0.5-2.5 mL, 400 µg/mL) of methanolic standard
drug solution, 2.0 mL of PDAB and 3.0 mL of conc H2SO4 were added successively and the
total volume in each flask was brought to 9 mL by adding methanol and placed in hot water
bath for 25 min. Then the flasks were cooled and made up to the mark with methanol and the
absorbance was measured after 5 min at 540 nm against a reagent blank prepared in a similar
way. The concentration of the drug sample was computed from Beer-Lambert’s plot Figure 3.
Figure 3. CEFT – PDAB system.
Results and Discussion
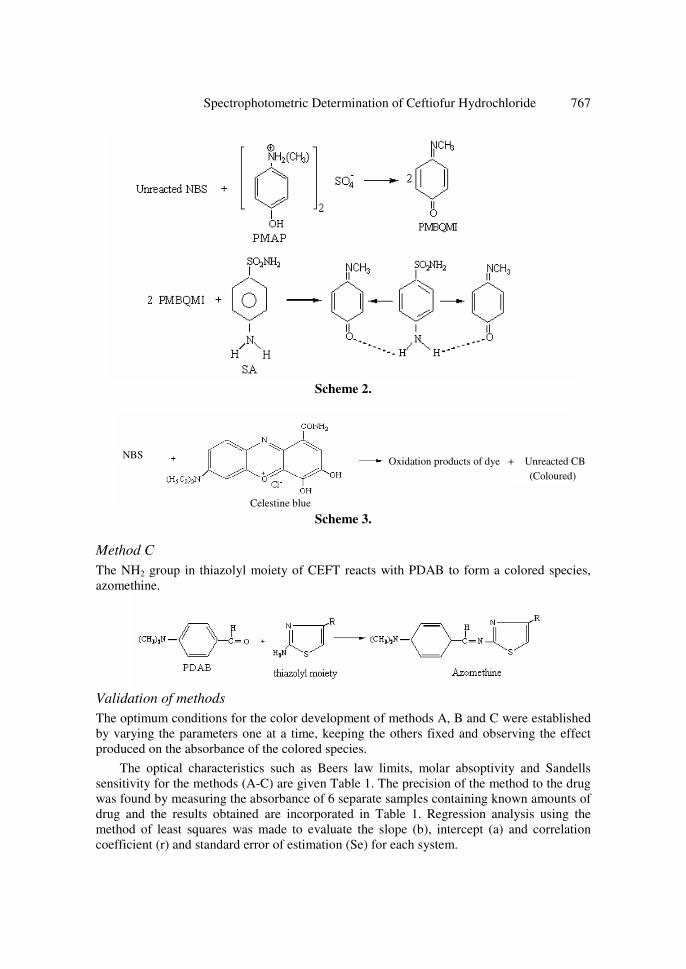
Chemical reactions of methods - Method A
The oxidant (NBS) reacts with CEFT and forms an oxidation product (Scheme 2). The
unreacted NBS then reacts with metol (PMAP as sulphate) giving rise to p-N-methyl-
benzoquinone monoamine (PMBQMI) which in turn forms charge transfer complex with
sulfanilamide (SA).
Method B
As in method A, in this method NBS reacts with CEFT and forms an oxidation product
(Scheme 3). The unreacted NBS then quantitatively decolorizes celestine blue, by disrupting
the chromophores and auxochromes present in celestine blue.
Concentration, µg mL-1
Ab
sorb
ance
Reagent Blank vs. Distilled Water
Test vs. Distilled Water
Ab
sorb
ance
Wavelength, nm
Ab
sorb
ance
Concentration, µg mL-1
(a) Absorption spectrum. (b) Beer’s law plot.
Spectrophotometric Determination of Ceftiofur Hydrochloride 767
Scheme 2.
Scheme 3.
Method C
The NH2 group in thiazolyl moiety of CEFT reacts with PDAB to form a colored species,
azomethine.
Validation of methods
The optimum conditions for the color development of methods A, B and C were established
by varying the parameters one at a time, keeping the others fixed and observing the effect
produced on the absorbance of the colored species.
The optical characteristics such as Beers law limits, molar absoptivity and Sandells
sensitivity for the methods (A-C) are given Table 1. The precision of the method to the drug
was found by measuring the absorbance of 6 separate samples containing known amounts of
drug and the results obtained are incorporated in Table 1. Regression analysis using the
method of least squares was made to evaluate the slope (b), intercept (a) and correlation
coefficient (r) and standard error of estimation (Se) for each system.
Oxidation products of dye + Unreacted CB
(Coloured)
Celestine blue
NBS

Table 1. Optical and regression characteristics, precision and accuracy of the proposed methods for CEFT.
Parameter Method-A Method-B Method C
λmax, nm 520 540 540
Beer’s law limits, µg/mL 4.0-24.0 0.4-2.4 20-120
Detection limit, µg/mL 0.0107 0.08537 5.994
Molar absorptivity, L mol-1
.cm-1
1.212x10⁴ 1.401x10
5 2.213x10
3
Sandell’s sensitivity, µg cm-2
/0.001
absorbance unit 0.1254 2.49x10
-2 0.4296
Optimum photometric range, µg/mL 6-24 1.15-2.14 45-105
Regression equation, Y=a+bc slope (b) 0.02418 0.25 9.209x10⁻³
Standard deviation in slope (Sb) 6.039x10⁻⁵
5.36x10⁻³
1.026x10⁻³
Intercept (a) 1.749x10⁻³
4.68x10⁻¹²
5.749x10⁻³
Standard deviation in intercept (Sa) 8.011x10⁻⁴
7.114x10⁻³
6.806x10⁻²
Standard error in estimation (Se) 7.638x10⁻⁴
6.78x10⁻³
6.490x10⁻²
Correlation coefficient (r) 0.9990 1.0000 0.9993
Relative standard deviation, % * 0.816 0.7077 0.9905
0.05 level 0.938 0.8137 1.1389
0.01 level 1.471 1.276 1.7860
% error in bulk samples ** 0.312 0.282 0.348
Table 2. Assay of CEFT in pharmaceutical formulations.
Sample Amount
taken, mg
Amount found by
proposed methods
Met A F-test t-test
Amount found by
proposed methods
Met B F-test t-test
Amount found by
proposed methods
Met C F-test t-test
Reference
method
% Recovery by
proposed methods
Met A Met B Met C
Tablet 1 50 49.76 1.75 0.675 49.63 1.55 0.86 49.73 1.61 1.15 50.22 99.94 99.73 99.93
Tablet 2 50 49.66 2.52 0.57 49.78 1.66 0.302 49.76 3.69 1.27 49.93 99.85 99.92 99.92
Tablet 3 50 49.76 1.79 0.49 49.68 1.98 0.70 49.86 1.50 0.91 49.96 99.95 99.84 99.91
Tablet 4 50 49.89 1.89 0.49 49.76 1.43 0.69 49.78 1.86 0.64 50.17 99.85 99.93 99.85
76
8
B.B
.V. S
AIL
AJA
et a
l.

Spectrophotometric Determination of Ceftiofur Hydrochloride 769
The accuracy of the methods was ascertained by comparing the results by proposed and reference methods (UV) statistically by the t- and F- tests Table 2. The comparison shows that there is no significant difference between the results of studied methods and those of the reference ones. The similarity of the results is obvious evidence that during the application of these methods the excipients present in pharmaceutical formulations do not interfere in the assay of proposed methods. As an additional check of accuracy of the proposed methods, recovery experiments were carried out. The recovery of the added amounts of standard drug was studied at 3 different levels. Each level was repeated 6 times. From the amount of drug found, the percentage recovery was calculated from the amount of drug found.
The high λmax values of all the proposed methods have a decisive advantage since the interference from the associated ingredients should be generally less at higher wavelengths than at lower wavelengths. Thus the proposed visible spectrophotometric methods are simple and sensitive with reasonable precision, accuracy and constitute better alternatives to the existing ones to the routine determination of CEFT in bulk forms and pharmaceutical formulations.
Conclusions
The proposed methods exploit the various functional groups in CEFT molecule. The decreasing order of sensitivity (∈max) among the proposed methods is Method B > Method A> Method C, respectively. The concomitants which do not contain the functional groups chosen in the present investigation do not interfere in the color development by the proposed methods. Thus the proposed methods are simple, sensitive and selective with reasonable precision and accuracy and constitute better alternatives to the reported ones in the assay of CEFT in bulk drugs and pharmaceutical formulations.
References
1. The Merck Index, Merck & Co Inc, New York, Ed.13, 2001, p.1803. 2. Aly, Mikrochim Acta, 1993, 100, 187. 3. Prasada Rao K V S, Nagaraju P, Prabhakar G, Begum J and Rasheed A, J Inst
Chemists., 2004, 76, 19. 4. Matsuda R, Yamamiya T, Tatsuzawa M, Ejima A and Takai N, J Chromatogr., 1979, A, 173, 75. 5. Hesses, Christof, Lang and Erich, GIT Spez Chromatogr., 1996, 16, 100. 6. Angelo H R, Herrstedt and Erich J, GIT Spez Chromatogr B, 1989, 496, 472. 7. Hattori H, Seno H, Ishil A, Yamada T and Suzuki O, Nippon Lyo Masu Supekutoru
Gakkai Koenshu, 1998, 23, 137. 8. Li Wan Po A and Irwin W. J, High Resolut, Chromatogr., 1979, 2, 623. 9. Kaniewska T and Wejman W, Pol Farm., 1974, 30, 763. 10. Eblant-Goragia A, Balant L.P, Gent C and Eisele, R Ther Drug Monit., 1985, 7, 229. 11. Shehata I A, El-Ashry F, EL-Sherbeny S M, El-Sherbeny M A and Belal F, J Pharm
Biomed Anal., 2000, 22, 729. 12. Hassan S M, Belal F, Ibrahim F and Aly F A, Talanta, 1989, 36, 557. 13. Belal F, Ibrahim, Hassan S M and Aly F.A, Anal Chim Acta., 1991, 55, 103. 14. Kumazawa T, Seno H, Watanabe S, Kanako H, Hideki I, Akira S and Keizo O, J
Mass Spectrom., 2000, 35, 1091. 15. Clean S, Kane E J O and Smyth W F, J Chromatogr, B Biomed Sci Appl., 2000, 740, 141. 16. Maurev H and Pfleger K, J Chromatogr., 1985, 306, 125. 17. Cailleux A, Turcant A, Premel-Cabic A and Allain P, J Chromatogr Sci., 1981, 19, 163. 18. El-Sherif Z.A, EL-Zeany, B, EL-Houssinl, O M, Rashed M S, Aboul-Enein, H Y,
Biomed Chrom., 2004, 18(3), 143-149.
19. Janiszewski J, Schneider R P, Haffmaster K, Swyden M, Wells D and Fouda H, Mass
Spectrometry, 1997, 11(9), 1033-1037.

Submit your manuscripts athttp://www.hindawi.com
Hindawi Publishing Corporationhttp://www.hindawi.com Volume 2014
Inorganic ChemistryInternational Journal of
Hindawi Publishing Corporation http://www.hindawi.com Volume 2014
International Journal ofPhotoenergy
Hindawi Publishing Corporationhttp://www.hindawi.com Volume 2014
Carbohydrate Chemistry
International Journal of
Hindawi Publishing Corporationhttp://www.hindawi.com Volume 2014
Journal of
Chemistry
Hindawi Publishing Corporationhttp://www.hindawi.com Volume 2014
Advances in
Physical Chemistry
Hindawi Publishing Corporationhttp://www.hindawi.com
Analytical Methods in Chemistry
Journal of
Volume 2014
Bioinorganic Chemistry and ApplicationsHindawi Publishing Corporationhttp://www.hindawi.com Volume 2014
SpectroscopyInternational Journal of
Hindawi Publishing Corporationhttp://www.hindawi.com Volume 2014
The Scientific World JournalHindawi Publishing Corporation http://www.hindawi.com Volume 2014
Medicinal ChemistryInternational Journal of
Hindawi Publishing Corporationhttp://www.hindawi.com Volume 2014
Chromatography Research International
Hindawi Publishing Corporationhttp://www.hindawi.com Volume 2014
Applied ChemistryJournal of
Hindawi Publishing Corporationhttp://www.hindawi.com Volume 2014
Hindawi Publishing Corporationhttp://www.hindawi.com Volume 2014
Theoretical ChemistryJournal of
Hindawi Publishing Corporationhttp://www.hindawi.com Volume 2014
Journal of
Spectroscopy
Analytical ChemistryInternational Journal of
Hindawi Publishing Corporationhttp://www.hindawi.com Volume 2014
Journal of
Hindawi Publishing Corporationhttp://www.hindawi.com Volume 2014
Quantum Chemistry
Hindawi Publishing Corporationhttp://www.hindawi.com Volume 2014
Organic Chemistry International
Hindawi Publishing Corporationhttp://www.hindawi.com Volume 2014
CatalystsJournal of
ElectrochemistryInternational Journal of
Hindawi Publishing Corporation http://www.hindawi.com Volume 2014