spectrophotometric determination of the dissociation
TRANSCRIPT
SPECTROPHOTOMETRIC DETERMINATION
OF THE DISSOCIATION CONSTANT
OF p-NITROPHENOL
Author: MSc Agnieszka Wronka Editors: Dr hab. Małgorzata Janicka Dr hab. Agnieszka Ewa Wiącek
Task 13
SPECTROPHOTOMETRIC DETERMINATION
OF THE DISSOCIATION CONSTANT
OF p-NITROPHENOL
I. Aim of the task
The aim of the task is determination of the dissociation constant of the weak acid
whose anion absorbs light in another spectrum range than its undissociated form and to exam-
ine the dependence between the dissociation degree values and the solvent pH .
II. Introduction
1. Dissociation of electrolytes.
2. Constant and degree of dissociations.
3. Absorption of electromagnetic radiation by solutions.
4. Lambert – Beer law.
References:
1. P.W. Atkins, Physical Chemistry, 4th Edition, Oxford University Press, 1992 p. 429-
434
2. P. W. Atkins, J. de Paula, Physical Chemistry for the Life Sciences, 2nd edition, Ox-
ford University Press, 2011 p. 237-241
3. J. M. Hollas, Modern Spectroscopy, 4th edition, John Wiley & Sons, Ltd, 2004, p. 33-
35
4. R.M. Metzger, The Physical Chemist’s Toolbox, Wiley, 2012, p. 571-600
5. http://maggiesscienceconnection.weebly.com/dual-nature-of-light.html
6. http://flamecolour.wordpress.com/
– 3 – Task 13 – Spectrophotmetric determination of dissociation constant …
III. Theory
III.1. Dissociation of electrolytes
Dissociation is the term used to describe the breakdown of a molecule into simpler
parts. This often (almost always in basic chemistry) occurs in water. The equilibrium constant
for such a reaction is called a dissociation constant. The dissociation constant of a compound
is important for a number of reasons:
– The dissociation constant of a compound can help us determine the environmental
impact of a chemical, e.g., the potential of the chemical to adsorb to soil;
– The dissociation constant can also help us to determine the biological impact of a
chemical, such as to what degree it will be absorbed by the body and the degree of
toxicity. For example, ammonia, NH+, is toxic to fish, whereas its ionized form,
ammonium, NH4+ is not toxic;
– Dissociation constants are also useful in helping us to calculate the pH of a weak
acid or base.
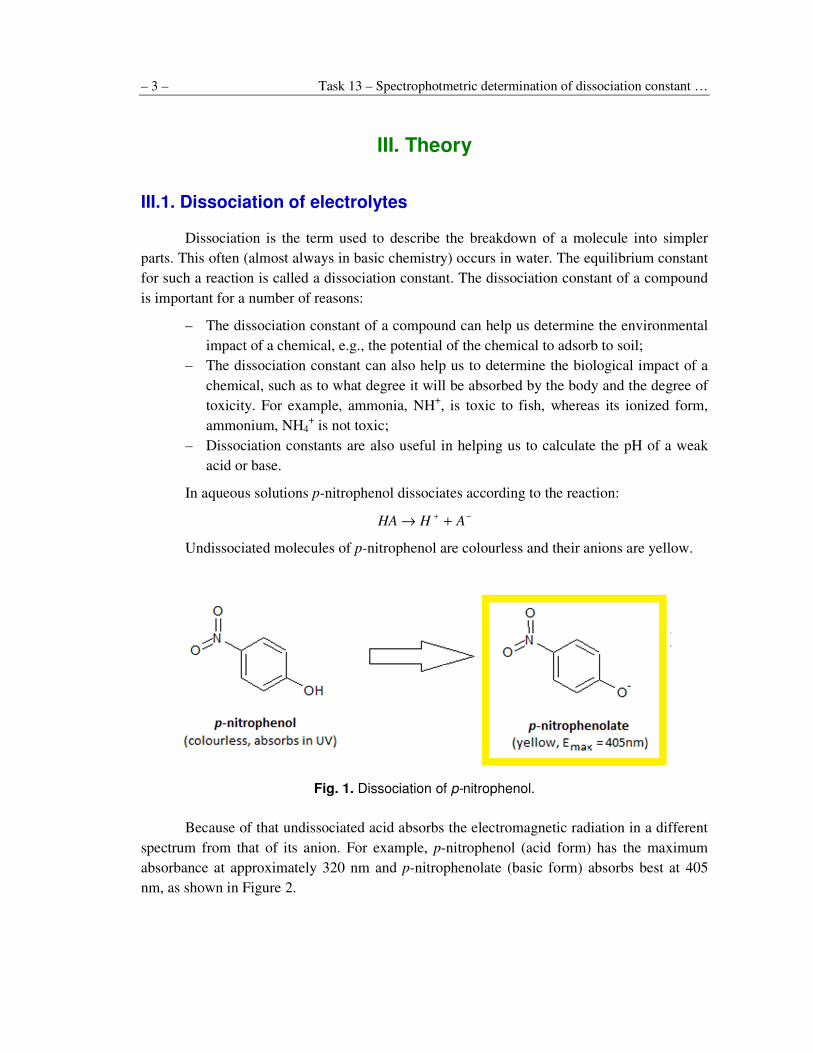
In aqueous solutions p-nitrophenol dissociates according to the reaction:
−+ +→ AHHA
Undissociated molecules of p-nitrophenol are colourless and their anions are yellow.
Fig. 1. Dissociation of p-nitrophenol.
Because of that undissociated acid absorbs the electromagnetic radiation in a different
spectrum from that of its anion. For example, p-nitrophenol (acid form) has the maximum
absorbance at approximately 320 nm and p-nitrophenolate (basic form) absorbs best at 405
nm, as shown in Figure 2.
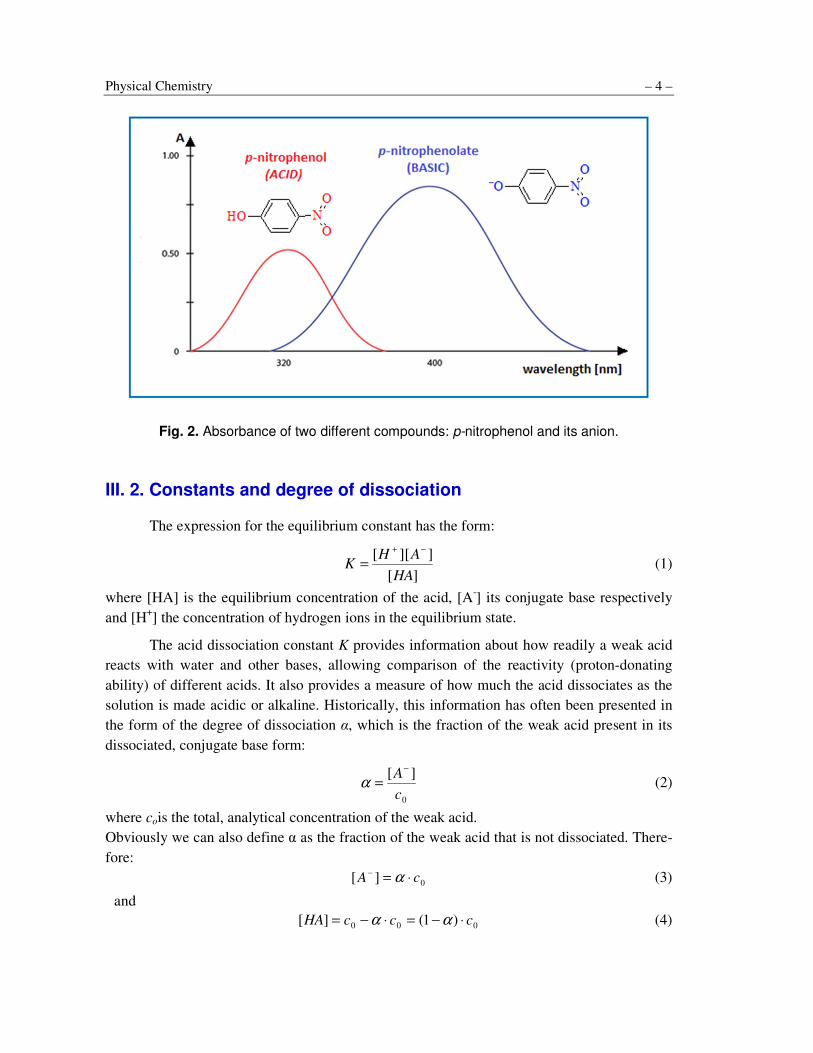
Physical Chemistry – 4 –
Fig. 2. Absorbance of two different compounds: p-nitrophenol and its anion.
III. 2. Constants and degree of dissociation
The expression for the equilibrium constant has the form:
][
]][[
HA
AHK
−+
= (1)
where [HA] is the equilibrium concentration of the acid, [A-] its conjugate base respectively
and [H+] the concentration of hydrogen ions in the equilibrium state.
The acid dissociation constant K provides information about how readily a weak acid
reacts with water and other bases, allowing comparison of the reactivity (proton-donating
ability) of different acids. It also provides a measure of how much the acid dissociates as the
solution is made acidic or alkaline. Historically, this information has often been presented in
the form of the degree of dissociation α, which is the fraction of the weak acid present in its
dissociated, conjugate base form:
0
][
c
A−
=α (2)
where cois the total, analytical concentration of the weak acid.
Obviously we can also define α as the fraction of the weak acid that is not dissociated. There-
fore:
0][ cA ⋅=− α (3)
and
000 )1(][ cccHA ⋅−=⋅−= αα (4)
– 5 – Task 13 – Spectrophotmetric determination of dissociation constant …
Taking into account equations (3) and(4), we can express the dissociation constant by the
equation:
α
α
−=
+
1
][HK (5)
The connection between the constant and the degree of dissociation (equation 5)
can be expressed as follows:
][11 +=
−H
Kα
α (6)
Because K is a constant, the expression(1-α)/α is a linear function of concentration
of hydrogen ions:
axy = (6a)
where α
α−=
1y , ][ += Hx and the coefficient
K
1 is the slope of the line.
To find the equilibrium constant for the ionization of a weak acid we must know the
concentration of hydrogen ions and their corresponding values of the dissociation degree (α).
If we use buffer as a solvent of p-nitrophenol solutions, then we will know the value of pH
and can calculate concentration of hydrogen ions. Undissociated molecules of
p-nitrophenol are colourless and their anions are yellow. Thus, each of them absorbs light in
a different range of spectrum. This creates favourable conditions for the determination of the
degree of dissociation of p-nitrophenol by the use of photometric method. Phenolate ions
more strongly absorb light at the wavelengths λ =455nm. Then we can pass over the absorp-
tion of the undissociated p-nitrophenol form. Therefore if substances comply with the Lam-
bert-Beer law, the absorbance of the solution depending on the concentration of phenol ion-
sis:
dAAA
][ −⋅= −ε (7)
where εA- is the molar absorption coefficient and d is the thickness ofthe light absorbing lay-
er of solution.
If we assume that p-nitrophenol in the NaOH solution is completely dissociated, [A-] is
equal to the total p-nitrophenol concentration, absorbance in such a solution is equal to Ao:
dcAA
⋅⋅= − 00 ε (8)
If we use equations (2), (7), (8) we get:
0A
A=α (9)
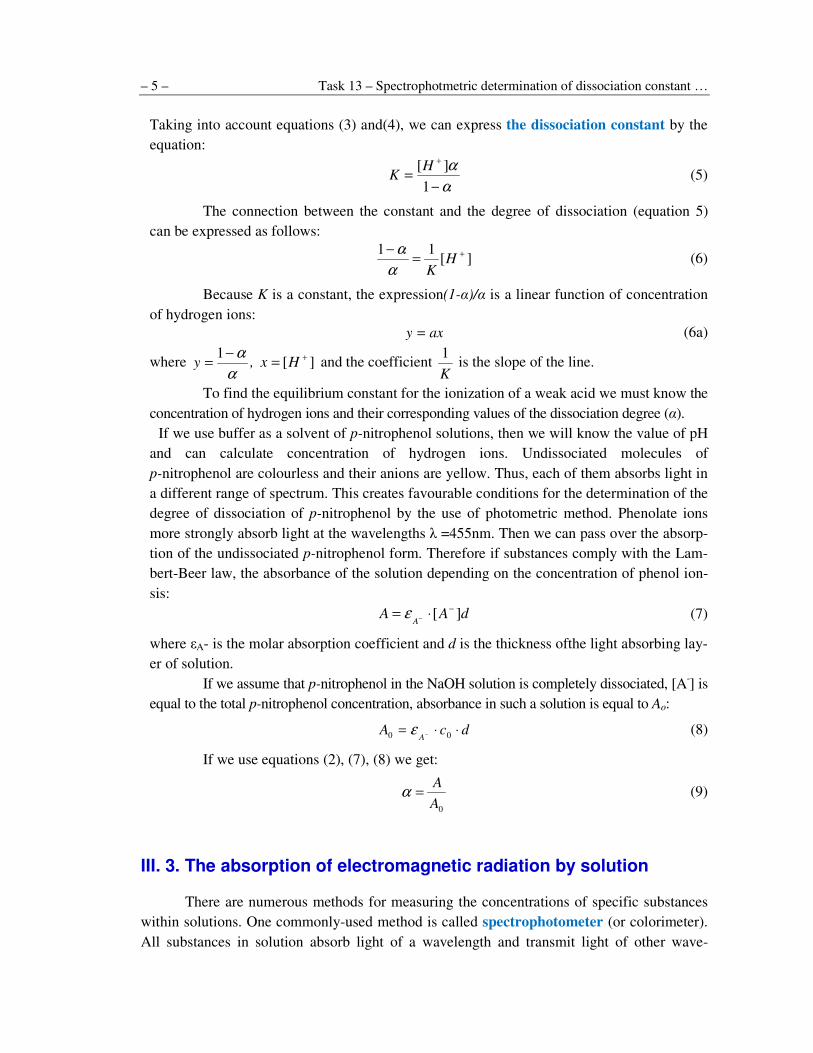
III. 3. The absorption of electromagnetic radiation by solution
There are numerous methods for measuring the concentrations of specific substances
within solutions. One commonly-used method is called spectrophotometer (or colorimeter).
All substances in solution absorb light of a wavelength and transmit light of other wave-
Physical Chemistry – 6 –
lengths. Absorbance is a characteristic of a substance just like melting point, boiling point,
solubility or density. Absorbance can be related to the amount of the substance in solution,
thus it can be used to quantitatively determine the amount of substance that is present.
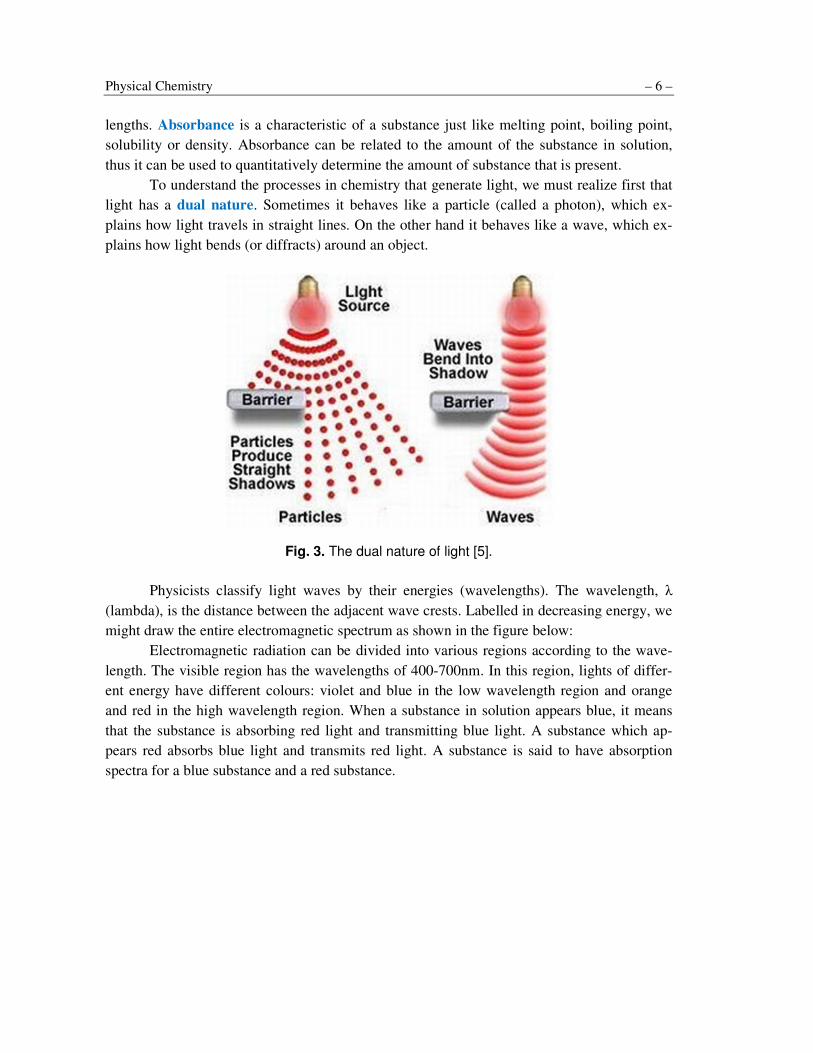
To understand the processes in chemistry that generate light, we must realize first that
light has a dual nature. Sometimes it behaves like a particle (called a photon), which ex-
plains how light travels in straight lines. On the other hand it behaves like a wave, which ex-
plains how light bends (or diffracts) around an object.
Fig. 3. The dual nature of light [5].
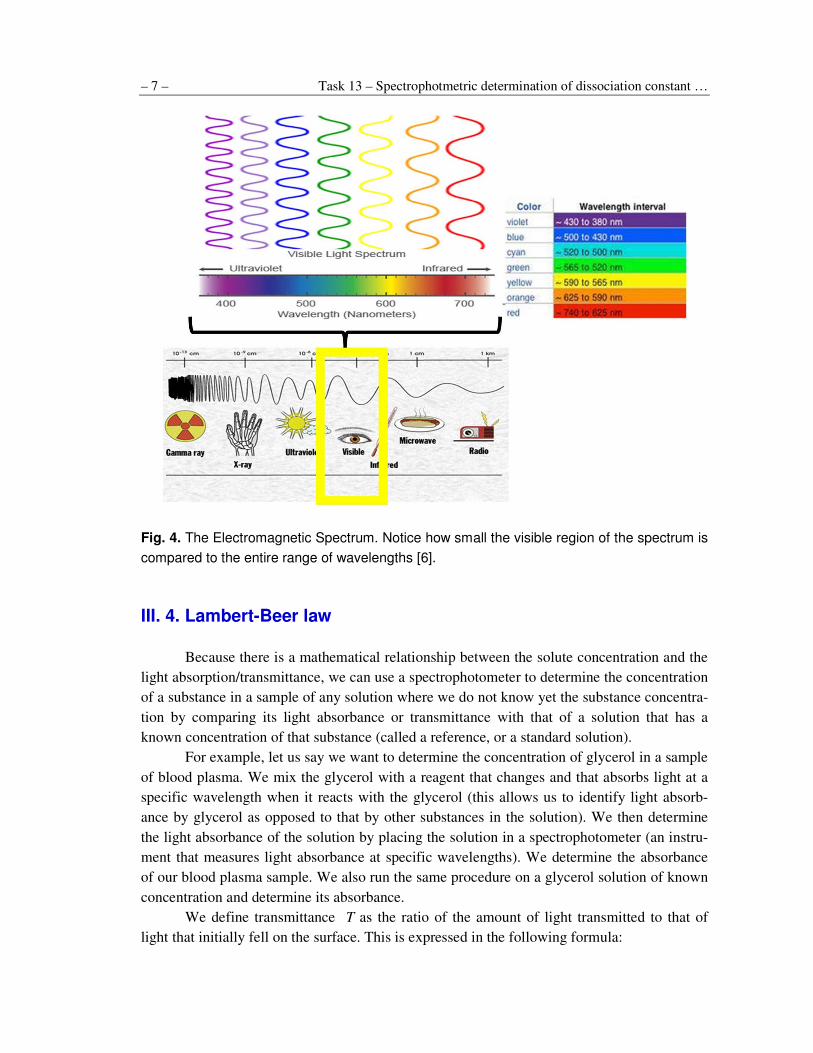
Physicists classify light waves by their energies (wavelengths). The wavelength, λ
(lambda), is the distance between the adjacent wave crests. Labelled in decreasing energy, we
might draw the entire electromagnetic spectrum as shown in the figure below:
Electromagnetic radiation can be divided into various regions according to the wave-
length. The visible region has the wavelengths of 400-700nm. In this region, lights of differ-
ent energy have different colours: violet and blue in the low wavelength region and orange
and red in the high wavelength region. When a substance in solution appears blue, it means
that the substance is absorbing red light and transmitting blue light. A substance which ap-
pears red absorbs blue light and transmits red light. A substance is said to have absorption
spectra for a blue substance and a red substance.
– 7 – Task 13 – Spectrophotmetric determination of dissociation constant …
Fig. 4. The Electromagnetic Spectrum. Notice how small the visible region of the spectrum is
compared to the entire range of wavelengths [6].
III. 4. Lambert-Beer law
Because there is a mathematical relationship between the solute concentration and the
light absorption/transmittance, we can use a spectrophotometer to determine the concentration
of a substance in a sample of any solution where we do not know yet the substance concentra-
tion by comparing its light absorbance or transmittance with that of a solution that has a
known concentration of that substance (called a reference, or a standard solution).
For example, let us say we want to determine the concentration of glycerol in a sample
of blood plasma. We mix the glycerol with a reagent that changes and that absorbs light at a
specific wavelength when it reacts with the glycerol (this allows us to identify light absorb-
ance by glycerol as opposed to that by other substances in the solution). We then determine
the light absorbance of the solution by placing the solution in a spectrophotometer (an instru-
ment that measures light absorbance at specific wavelengths). We determine the absorbance
of our blood plasma sample. We also run the same procedure on a glycerol solution of known
concentration and determine its absorbance.
We define transmittance T as the ratio of the amount of light transmitted to that of
light that initially fell on the surface. This is expressed in the following formula:
Physical Chemistry – 8 –
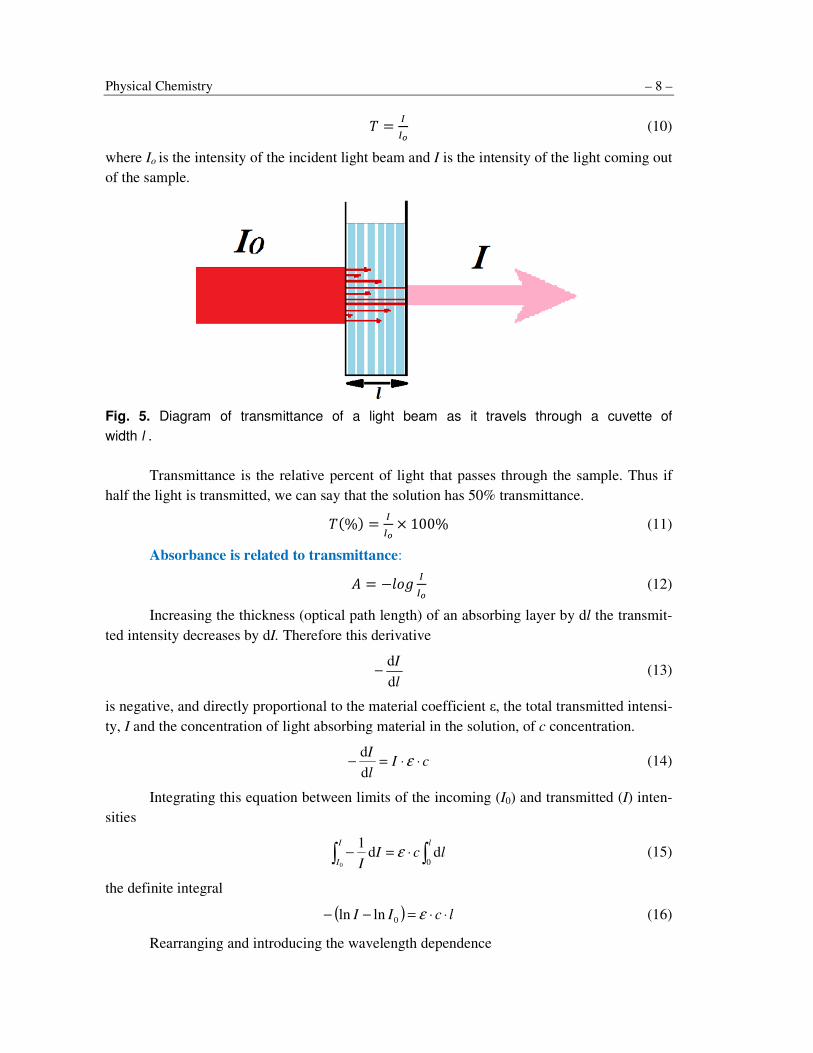
� ��
�� (10)
where Io is the intensity of the incident light beam and I is the intensity of the light coming out
of the sample.
Fig. 5. Diagram of transmittance of a light beam as it travels through a cuvette of
width l .
Transmittance is the relative percent of light that passes through the sample. Thus if
half the light is transmitted, we can say that the solution has 50% transmittance.
��%� ��
��� 100% (11)
Absorbance is related to transmittance:
� � � ���
�� (12)
Increasing the thickness (optical path length) of an absorbing layer by dl the transmit-
ted intensity decreases by dI. Therefore this derivative
l
I
d
d− (13)
is negative, and directly proportional to the material coefficient ε, the total transmitted intensi-
ty, I and the concentration of light absorbing material in the solution, of c concentration.
cIl
I⋅⋅=− ε
d
d (14)
Integrating this equation between limits of the incoming (I0) and transmitted (I) inten-
sities
∫∫ ⋅=−lI
IlcI
I 0dd
1
0
ε (15)
the definite integral
( ) lcII ⋅⋅=−− ε0lnln (16)
Rearranging and introducing the wavelength dependence
– 9 – Task 13 – Spectrophotmetric determination of dissociation constant …
lcAI
I⋅⋅== ε0ln (17)
( ) ( ) lcA ⋅⋅= λελ (18)
where: A is a dimensionless number, ε is the proportionality constant (called the molar ex-
tinction coefficient or the molar absorptivity). It is a constant for a given substance, provid-
ed the temperature and wavelength are constant. It has units of [dm3/mol], c is a concentration
[mol/dm3], l is a path length of the cuvette containing the sample.
The absorbance is linearly dependent on the concentration of absorbing material and
the optical path length, l. When the concentration is given in [mol dm-3
] the coefficient ε is
called the molar absorbance.
The usual non SI unit of thickness is cm, and the unit of ε is [dm3mol
-1cm
-1]. The ab-
sorbance and molar absorbance are wavelength or frequency dependent. Absorbance is the
concentration and optical path length dependent too, but molar absorbance is not.
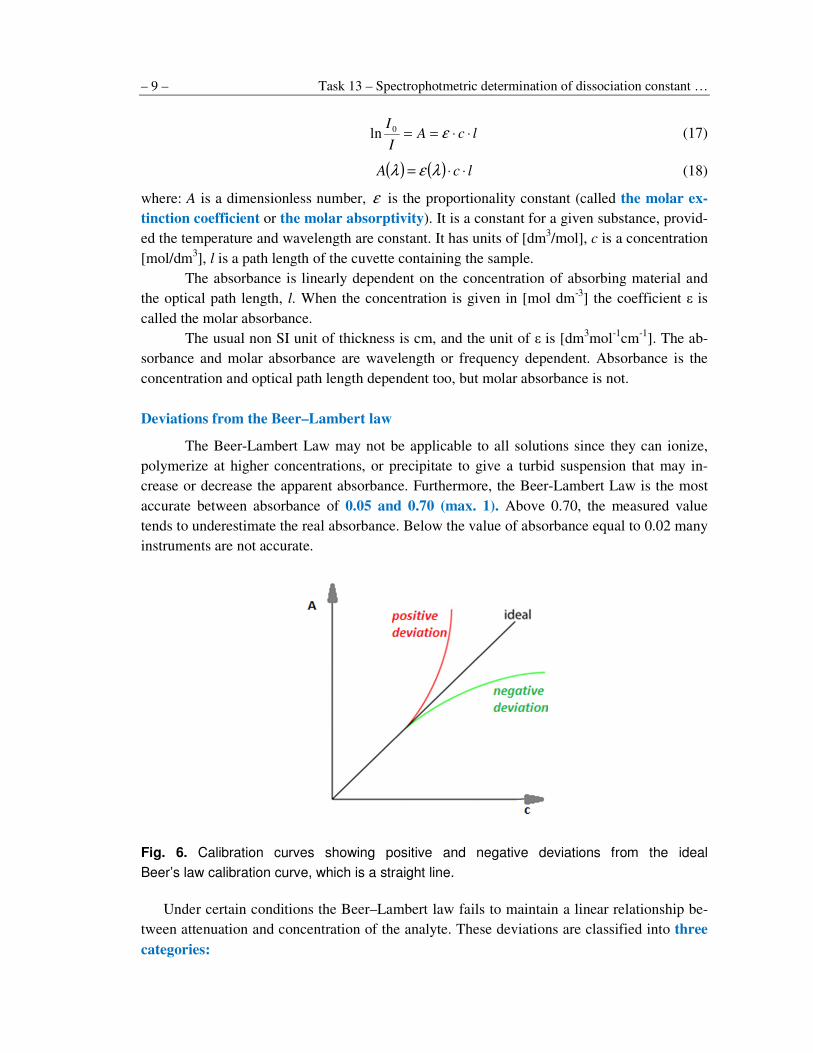
Deviations from the Beer–Lambert law
The Beer-Lambert Law may not be applicable to all solutions since they can ionize,
polymerize at higher concentrations, or precipitate to give a turbid suspension that may in-
crease or decrease the apparent absorbance. Furthermore, the Beer-Lambert Law is the most
accurate between absorbance of 0.05 and 0.70 (max. 1). Above 0.70, the measured value
tends to underestimate the real absorbance. Below the value of absorbance equal to 0.02 many
instruments are not accurate.
Fig. 6. Calibration curves showing positive and negative deviations from the ideal
Beer’s law calibration curve, which is a straight line.
Under certain conditions the Beer–Lambert law fails to maintain a linear relationship be-
tween attenuation and concentration of the analyte. These deviations are classified into three
categories:
Physical Chemistry – 10 –
1. Real– the fundamental deviations due to the limitations of the law itself.
2. Chemical– the deviations observed due to specific chemical species of the sample
which are being analyzed.
3. Instrument – the deviations which occur due to how the attenuation measurements
are made.
– 11 – Task 13 – Spectrophotmetric determination of dissociation constant …
IV. Experimental
A. Devices and materials
1. Device: Spectrophotometer Cecil 1011.
2. Equipment:
– Erlenmeyer flask: 50 cm3 – 6u,
– measuring flask: 25 cm3 – 10 u,
– graduated pipettes: 10 cm3
and 25 cm3,
– cuvette of the thickness d = 1 cm (1 x 2 x 3 cm).
3. Materials:
– p-nitrophenol solution in NaOH, 5·10-4
mol/dm3;
– aqueous solution of p-nitrophenol, 5·10-3
mol/dm3;
– buffers: pH = 6.0; 6.5; 7.0; 7.5 and 8.0;
– NaOH solution, 0.01 mol/dm3
B. Program
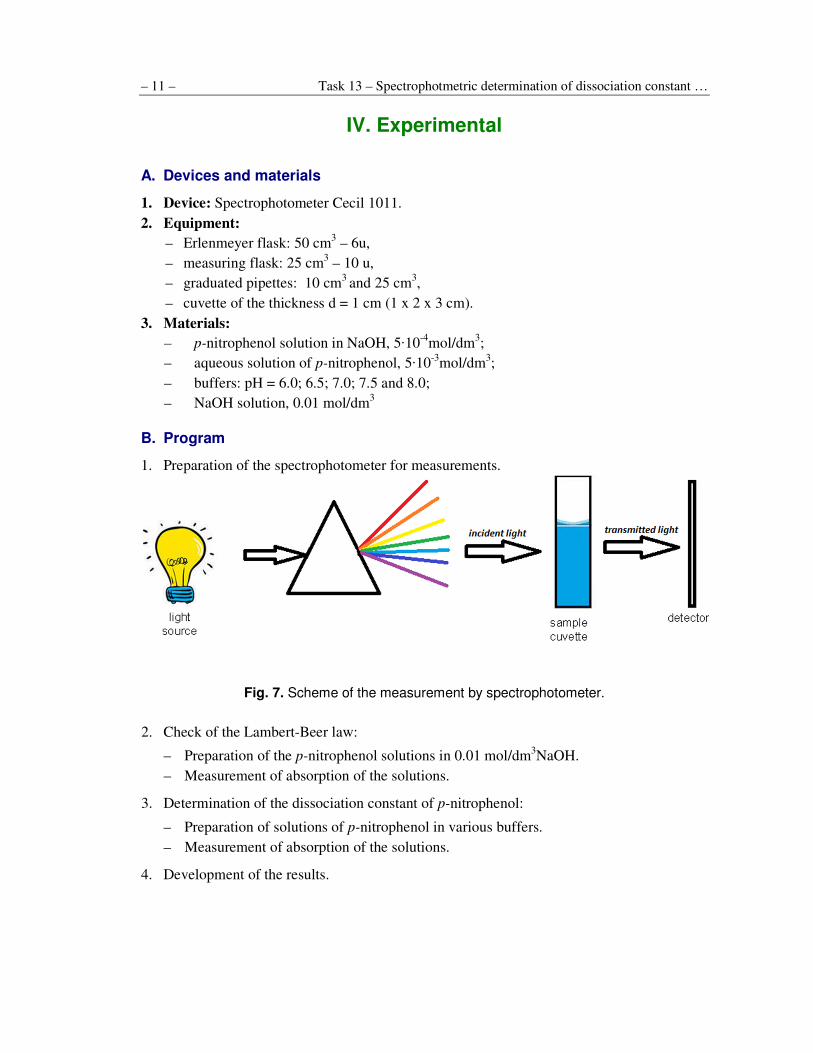
1. Preparation of the spectrophotometer for measurements.
Fig. 7. Scheme of the measurement by spectrophotometer.
2. Check of the Lambert-Beer law:
– Preparation of the p-nitrophenol solutions in 0.01 mol/dm3NaOH.
– Measurement of absorption of the solutions.
3. Determination of the dissociation constant of p-nitrophenol:
– Preparation of solutions of p-nitrophenol in various buffers.
– Measurement of absorption of the solutions.
4. Development of the results.
Physical Chemistry – 12 –
C. Methods
Check the Lambert-Beer law.
The above-mentioned method of determination of the dissociation constant of
p-nitrophenol demands using the Lambert-Beer law for the solutions of this substance.
One should check if there is a linear dependence between the absorbance and the con-
centration of phenolan ion in a wide range of concentration.
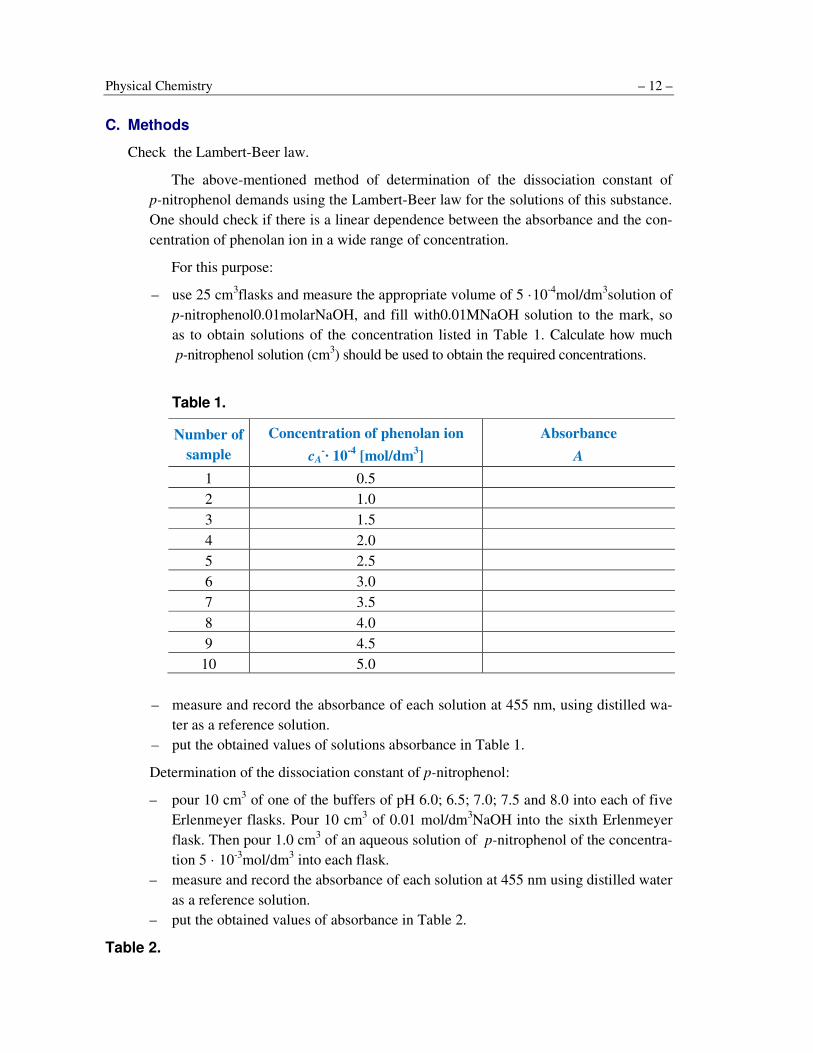
For this purpose:
– use 25 cm3flasks and measure the appropriate volume of 5 ·10
-4mol/dm
3solution of
p-nitrophenol0.01molarNaOH, and fill with0.01MNaOH solution to the mark, so
as to obtain solutions of the concentration listed in Table 1. Calculate how much
p-nitrophenol solution (cm3) should be used to obtain the required concentrations.
Table 1.
Number of
sample
Concentration of phenolan ion
cA
-· 10
-4 [mol/dm
3]
Absorbance
A
1 0.5
2 1.0
3 1.5
4 2.0
5 2.5
6 3.0
7 3.5
8 4.0
9 4.5
10 5.0
– measure and record the absorbance of each solution at 455 nm, using distilled wa-
ter as a reference solution.
– put the obtained values of solutions absorbance in Table 1.
Determination of the dissociation constant of p-nitrophenol:
– pour 10 cm3 of one of the buffers of pH 6.0; 6.5; 7.0; 7.5 and 8.0 into each of five
Erlenmeyer flasks. Pour 10 cm3 of 0.01 mol/dm
3NaOH into the sixth Erlenmeyer
flask. Then pour 1.0 cm3 of an aqueous solution of p-nitrophenol of the concentra-
tion 5 · 10-3
mol/dm3 into each flask.
– measure and record the absorbance of each solution at 455 nm using distilled water
as a reference solution.
– put the obtained values of absorbance in Table 2.
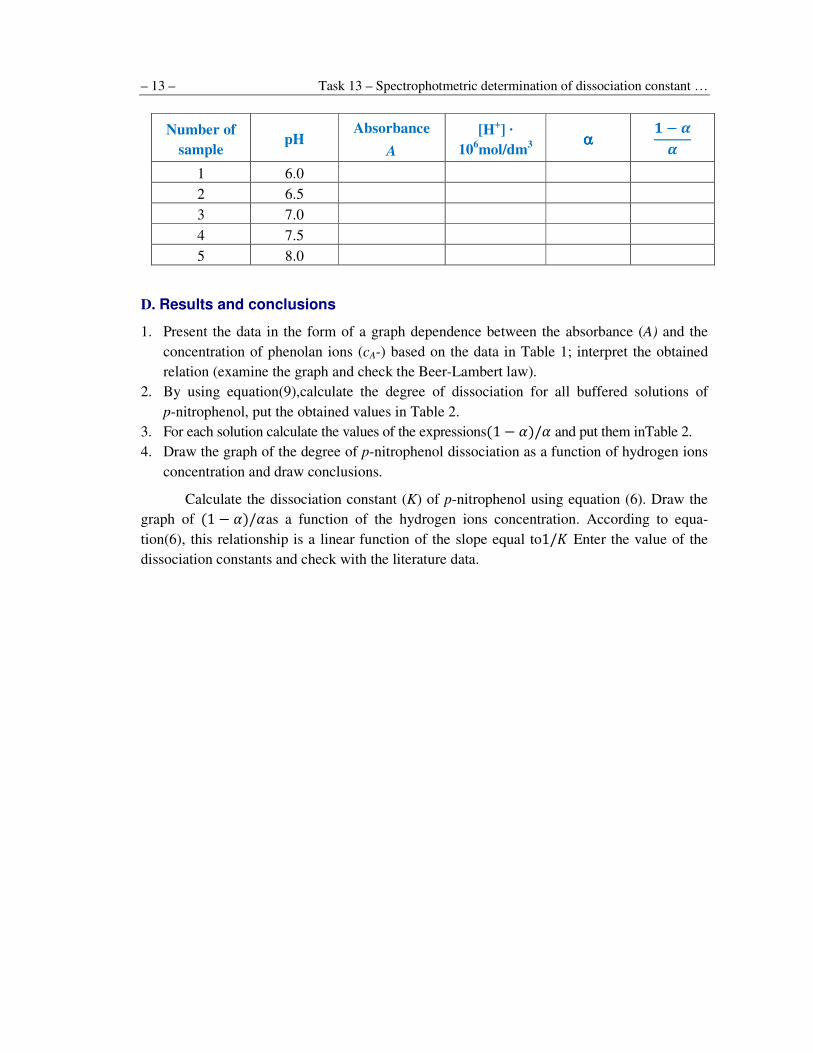
Table 2.
– 13 – Task 13 – Spectrophotmetric determination of dissociation constant …
Number of
sample pH
Absorbance
A
[H+] ·
106mol/dm
3
αααα � � �
�
1 6.0
2 6.5
3 7.0
4 7.5
5 8.0
D. Results and conclusions
1. Present the data in the form of a graph dependence between the absorbance (A) and the
concentration of phenolan ions (cA-) based on the data in Table 1; interpret the obtained
relation (examine the graph and check the Beer-Lambert law).
2. By using equation(9),calculate the degree of dissociation for all buffered solutions of
p-nitrophenol, put the obtained values in Table 2.
3. For each solution calculate the values of the expressions�1 � ��/� and put them inTable 2.
4. Draw the graph of the degree of p-nitrophenol dissociation as a function of hydrogen ions
concentration and draw conclusions.
Calculate the dissociation constant (K) of p-nitrophenol using equation (6). Draw the
graph of �1 � ��/�as a function of the hydrogen ions concentration. According to equa-
tion(6), this relationship is a linear function of the slope equal to1/� Enter the value of the
dissociation constants and check with the literature data.