spatial and temporal fluctuations of methane production in anoxic coastal marine sediments
TRANSCRIPT

Spatial and Temporal Fluctuations of Methane Production in Anoxic Coastal Marine SedimentsAuthor(s): Patrick M. Crill and Christopher S. MartensSource: Limnology and Oceanography, Vol. 28, No. 6 (Nov., 1983), pp. 1117-1130Published by: American Society of Limnology and OceanographyStable URL: http://www.jstor.org/stable/2836273 .
Accessed: 14/06/2014 10:52
Your use of the JSTOR archive indicates your acceptance of the Terms & Conditions of Use, available at .http://www.jstor.org/page/info/about/policies/terms.jsp
.JSTOR is a not-for-profit service that helps scholars, researchers, and students discover, use, and build upon a wide range ofcontent in a trusted digital archive. We use information technology and tools to increase productivity and facilitate new formsof scholarship. For more information about JSTOR, please contact [email protected].
.
American Society of Limnology and Oceanography is collaborating with JSTOR to digitize, preserve andextend access to Limnology and Oceanography.
http://www.jstor.org
This content downloaded from 188.72.127.150 on Sat, 14 Jun 2014 10:52:19 AMAll use subject to JSTOR Terms and Conditions
Limnol Oceanogr, 28(6), 1983, 1117-1130 ?) 1983, by the American Society of Limnology and Oceanography, Inc.
Spatial and temporal fluctuations of methane production in anoxic coastal marine sediments
Patrick M. Crill and Christopher S. Martens Marine Sciences Program, 12-5 Venable Hall, University of North Carolina, Chapel Hill 27514
Abstract
In vitro rates of net methane production and sulfate reduction were measured at various depths from October 1979 to November 1981 in anoxic coastal marine sediments from Cape Lookout Bight, N.C. In sulfate-rich surface sediments at 1-4 cm, calculated methane production rates were within the experimental error of 0.011 mM CH4 d-1. The depth of maximum meth- ane production rate varied from 7-30 cm from summer to winter with summer maxima at the shallower depth. A maximum rate of 0.305 mM CH4&d-1 was measured at 7-10 cm during July 1981. At intermediate depths low rates of methane production were observed in the presence of low concentrations of dissolved sulfate; however, these rates were near or within experimental error. Integrated rates of sediment column methane production ranged from 20,umol m-2 h-I in April to 2,000 in August. These rates compared well with previously measured CH4 sediment- water fluxes measured in sediments from the same field site in 1977. The total methane flux then ranged from 50 to 2,600 ,umol CH4m2 h.
We present here the first comprehen- sive study of the spatial and temporal dis- tribution of methane production rates during early diagenesis in anoxic marine sediments. In combination with simulta- neous measurements of sulfate reduction rate and previous measurements of sedi- ment-water flux at the same site, it per- mits tests of hypotheses concerning the in- fluence of sulfate reducers on the depth distribution of methane production in or- ganic-rich sediments.
Sulfate reduction and methane produc- tion are the terminal processes of organic carbon remineralization in anoxic marine sediments (Zehnder 1978). They generally occur where there is a high input of labile organic materials and a consequent rapid depletion of dissolved oxygen as well as other inorganic hydrogen acceptors near the sediment-water interface. The depth distribution of the various modes of res- piration in marine sediments, termed an "ecological succession" by Claypool and Kaplan (1974), can be predicted by the thermodynamic efficiencies of the anaer- obic microorganisms, assuming a similar initial substrate. The organism or sym- biotic group of organisms capable of ob- taining the most energy from existing sub- strates and hydrogen (electron) acceptors should dominate. In organic-rich marine
environments, sulfate reduction becomes the principal mode of respiration very near the oxic-anoxic interface after the ex- haustion of dissolved 2, nitrate, and other oxidants including manganese and iron oxides; methane does not begin to accu- mulate in the interstitial water until the deeper layers of the sediments where dis- solved sulfate becomes depleted (Claypool and Kaplan 1974; Martens and Berner 1974). Cape Lookout Bight is no exception to these general observations (Martens and Klump 1980). However, rather than just a thermodynamically derived efficiency it is the particular interplay of several fac- tors such as temperature, labile organic matter concentration, sedimentation rate, competition for substrate, interspecies substrate transfer, and oxidative processes that result in the biogeochemical zonation at a given site. Recent in vitro studies of microbially mediated processes such as sulfate reduction, methane oxidation, vol- atile fatty acid cycling, and the interac- tion of sulfate reduction and methane production are beginning to make it pos- sible to quantify the various dynamic con- trols on the zonation of anoxic organic- rich marine sediments. We continue in this direction by presenting rate measure- ments determined through changes in the concentrations of dissolved methane and
1117
This content downloaded from 188.72.127.150 on Sat, 14 Jun 2014 10:52:19 AMAll use subject to JSTOR Terms and Conditions

1118 Crill and Martens
sulfate during in vitro incubations of an- oxic marine sediments taken from Cape Lookout Bight, North Carolina.
We thank the members of CH4AO2S for help with field and laboratory work, es- pecially G. Kipphut, J. V. Klump, F. San- sone, and J. Chanton. We also thank J. Murray, K. Kuivila, and B. B. J0rgensen for their reviews. The UNC Institute of Marine Sciences, Morehead City, supplied logistic support and laboratory and office space. Under adverse weather conditions Calico Jack's Marina, Harker's Island, provided boat launching facilities. We also thank F. Johnson, A. Fitchett, H. Crill, S. Fisher, and D. Reinhold. This research was supported by NSF grants OCE 80- 09245 and OCE 82-08666 (Oceanography Section, Marine Chemistry Program).
Site description Cape Lookout Bight traps fine-grained
particles transported out of Core and Back Sounds via Barden Inlet mainly by tidal currents (Martens and Klump 1980). The bight has been enlarged in recent decades by a northward prograding sand spit which has enclosed a portion of the Ho- locene sand sheet on the inner continental shelf (Chanton 1979). The protected quiet basin is an ideal settling area for fine- grained organic-rich sediments (3-4% or- ganic carbon: Martens and Klump 1980) whose labile organic component in part originates in the extensive Zostera sp. and Haladule sp. beds and Spartina sp. marshes in the sounds landward of Core and Shackleford Banks.
Unlike freshwater lakes or pelagic en- vironments where organic carbon input to the sediments may be controlled largely by productivity in the overlying water column, Cape Lookout Bight is dominat- ed by horizontal input processes (Chanton et al. 1983).
The present sediment accumulation rate at the interior station in the bight where our study was conducted is between 8.4 and 11.6 cm yr-1 (Chanton 1979). The re- sulting input and rapid utilization of la- bile organic matter is greater than the rate at which oxygen can diffuse into the sed- iment; therefore, heterotrophic organisms
rapidly deplete 02 at or very near the sed- iment-water interface. Anoxic conditions are maintained at or within 5 cm of this interface throughout the year (Bartlett 1981). Remineralization of the organic carbon continues at depth in the sedi- ments, primarily in association with sul- fate reduction and methanogenesis (Mar- tens and Klump 1980).
A seasonality of microbial activities in the sediments is induced primarily by temperature variation. The temperature of the sediments oscillates annually be- tween 50 and 27?C; rapid equilibration with the overlying water maintains a rea- sonably uniform temperature distribution to at least 30-cm depth in the sediments (Klump 1980). From late May to early November, methane is produced in quan- tities that permit bubble supersaturation and ebullition from the sediments when the hydrostatic pressure of the overlying water column is released by a low tide (Martens and Klump 1980). During warm summer months sulfate gradients are steep and sulfate is depleted within the top 10 cm (Martens 1976; Klump 1980; Bartlett 1981); black ferrous monosulfides persist to near or at the sediment-water interface and mats of Beggiatoa sp. form on the sediment surface (Martens 1976). When temperatures drop in the winter, micro- bial activities slow, methane bubbling stops, and sulfate diffuses deeper into the sediment, ultimately, in midwinter, to be- low 25 cm. A 3-5-cm-thick, brown oxi- dized layer consisting in part of recently sedimented material and sparsely colo- nized by small polychaetes develops on the surface. These polychaetes, primarily of the family Spionidae, are generally the only benthic macrofauna at interior sta- tions within the bight and are found in appreciable numbers only during winter (Bartlett 1981). A thin, bright red line, presumably of iron oxide, that forms dur- ing winter at about 0.5 cm deep in the brown oxidized layer may represent the limit of intrusion of molecular oxygen.
Methods Mud sample collection and handling-
Cores (5-cm diam) were taken by diver or gravity corer from station A-1 (see Mar-
This content downloaded from 188.72.127.150 on Sat, 14 Jun 2014 10:52:19 AMAll use subject to JSTOR Terms and Conditions

Methane production in marine sediments 1119
tens and Klump 1980) in Cape Lookout Bight, covered, and returned via small boat to the Institute of Marine Sciences at Morehead City. The cores were stored overnight at 0?-5? C to lower the temper- ature and the metabolism of the micro- organisms in the mud and to minimize the effects of packing and transfer.
The next day the cores were extruded and sectioned quickly in the lab after the overlying water had been siphoned off. The core section of interest was immedi- ately placed in a glove bag filled with ni- trogen. Oxygen exposure of the sediments was kept to a minimum by the high nat- ural concentrations of sulfide (3-8 mM: Chanton unpubl. data) and by rapid sec- tioning which limited the time of atmo- spheric exposure of the sediment section to <3 min. The mud from the same depth interval from several cores was homoge- nized by stirring and then packed into 25- ml Corex high-speed centrifuge tubes (Corning No. 8330). The centrifuge tubes were sealed with gray butyl rubber septa and open top caps (both from Pierce Chemical Co.). Each tube was packed and sealed by hand under an O2-free nitrogen atmosphere in a glove bag.
The sediment-filled tubes were placed on ice, transferred to Chapel Hill the same day they were packed, and there held in an incubator at a constant temperature in the dark to equilibrate for 24 h before the day 1 samples were run.
Sample tubes were removed from the covered water bath and centrifuged at 8,500 rpm for 10 min in a Sorvall S-3 high- speed centrifuge; this yielded 10-15 ml of porewater overlying a reasonably tight sediment pellet. The amount of porewater sampled was determined by weighing the centrifuge tubes on a top-loading balance before and after the sample was removed.
The tubes were placed directly in. line with the carrier gas flow of a Carle AGC 311 gas chromatograph by piercing the butyl rubber septum with 21-gauge can- nulae connected to the gas flow path with 3-mm-o.d. polypropylene tubing. By use of a series of six-port rotary valves to alter the gas flow, an aliquot of porewater (usu- ally 7-8 ml) was transferred anaerobically to the stripping tube with the helium car-
rier gas flow and the tubing and valving shown in Fig. 1. The method was a mod- ification of that described by Weiss and Craig (1973).
Methane in the carrier gas was delayed by a 0.5-m silica gel drying column in se- ries with a 2-m Molecular Sieve 5a col- umn before being detected by flame ion- ization. Peak areas were quantified by a Perkin-Elmer Sigma 10 data system.
Methane gas standards were run after the last porewater sample on a given day. Grade 2 (99%) methane was blown into a standard loop of known volume (0.1833 ml) and injected into the gas chromato- graph using a rotary six-port valve after a short pause (3 s) so that the pressure in the standard loop could equilibrate with at- mospheric pressure. The gas was carried through the last porewater sample left bubbling in the stripping tube so that the shape of the standard peak more closely resembled that of the sample peaks. The temperature was noted so that the amount of standard gas injected could be calcu- lated.
The liquid sample in the stripping tube was recovered by a backflush configura- tion of the valving. Recovered, back- flushed samples were acidified with three drops of concentrated HCI, refrigerated, and then later analyzed for sulfate con- centration.
Sulfate reduction rate measurement- Sulfate reduction rates were measured by following the disappearance of dissolved sulfate in the porewater of the sediment in the centrifuge tubes. Dissolved sulfate was determined gravimetrically as BaSO4 filtered onto tared 0.4-,um Nuclepore fil- ters in samples processed before June 1981. After that date, sulfate concentrations were determined by ion chromatography (Dionex, model 10). To minimize inter- ference by high Cl- concentrations, we di- luted porewater samples 1:10 with the standard eluent before injecting a known volume onto a series of anion precolumn, fast-run anion, and anion suppressor col- umns all supplied by the Dionex Corpo- ration (Sunnyvale, Calif.). To reduce sam- ple manipulation, we made no attempt to remove Cl- with ion exchange resins. The anions were eluted with a standard eluent
This content downloaded from 188.72.127.150 on Sat, 14 Jun 2014 10:52:19 AMAll use subject to JSTOR Terms and Conditions
1120 Crill and Martens
He. carrier gas
r > ~~hackf Ilush n as l iquid
_ _ J chromatograph stripping drierite column tube
f lame ionization detectorwat<
5-mm O.D. polypropylene
ix-port tubing
0.1833-ml i ject t 20-ga. standard loop 1alve cannulae 2 (-)L vae
, 25-ml Corex 4 2 centrifuge tube valve sample recovery
position
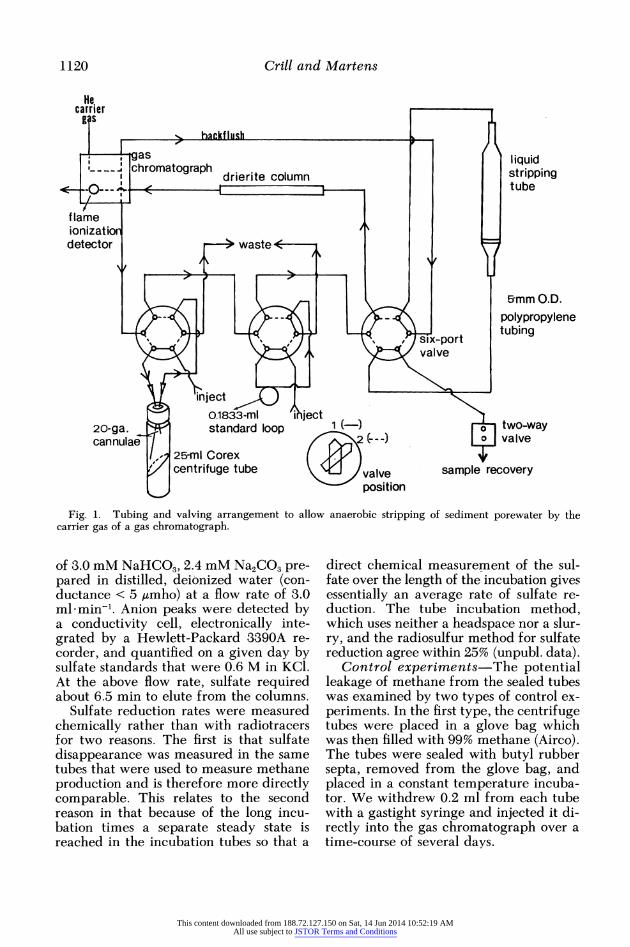
Fig. 1. Tubing and valving arrangement to allow anaerobic stripping of sediment porewater by the carrier gas of a gas chromatograph.
of 3.0 mM NaHCO3, 2.4 mM Na2CO3 pre- pared in distilled, deionized water (con- ductance < 5 ,umho) at a flow rate of 3.0 ml min-'. Anion peaks were detected by a conductivity cell, electronically inte- grated by a Hewlett-Packard 3390A re- corder, and quantified on a given day by sulfate standards that were 0.6 M in KCI. At the above flow rate, sulfate required about 6.5 min to elute from the columns.
Sulfate reduction rates were measured chemically rather than with radiotracers for two reasons. The first is that sulfate disappearance was measured in the same tubes that were used to measure methane production and is therefore more directly comparable. This relates to the second reason in that because of the long incu- bation times a separate steady state is reached in the incubation tubes so that a
direct chemical measurement of the sul- fate over the length of the incubation gives essentially an average rate of sulfate re- duction. The tube incubation method, which uses neither a headspace nor a slur- ry, and the radiosulfur method for sulfate reduction agree within 25% (unpubl. data).
Control experiments-The potential leakage of methane from the sealed tubes was examined by two types of control ex- periments. In the first type, the centrifuge tubes were placed in a glove bag which was then filled with 99% methane (Airco). The tubes were sealed with butyl rubber septa, removed from the glove bag, and placed in a constant temperature incuba- tor. We withdrew 0.2 ml from each tube with a gastight syringe and injected it di- rectly into the gas chromatograph over a time-course of several days.
This content downloaded from 188.72.127.150 on Sat, 14 Jun 2014 10:52:19 AMAll use subject to JSTOR Terms and Conditions
Methane production in marine sediments 1121
2 Aug 1981 -15
1-4cm 0.5 5
0
1.5 -
7-10 cm
0.5 - 5
E C... . n
Zww 2.0 - m
I 13-16cm 3
1.0 /
1.5 -
28 -31 CM
0.5 -
- 0 3 6
TIME, days
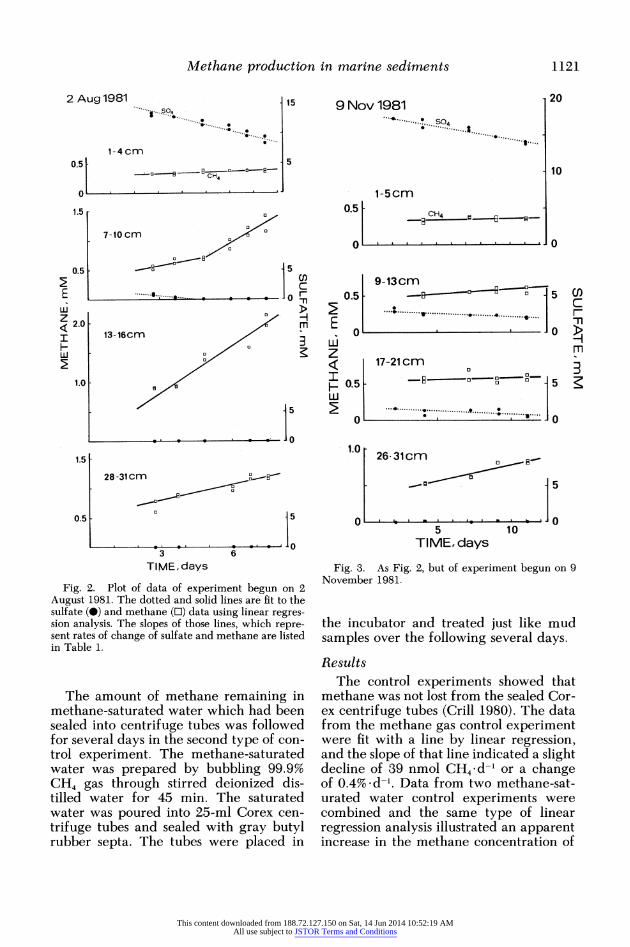
Fig. 2. Plot of data of experiment begun on 2 August 1981. The dotted and solid lines are fit to the sulfate (0) and methane (O) data using linear regres- sion analysis. The slopes of those lines, which repre- sent rates of change of sulfate and methane are listed in Table 1.
The amount of methane remaining in methane-saturated water which had been sealed into centrifuge tubes was followed for several days in the second type of con- trol experiment. The methane-saturated water was prepared by bubbling 99.9% CH4 gas through stirred deionized dis- tilled water for 45 min. The saturated water was poured into 25-ml Corex cen- trifuge tubes and sealed with gray butyl rubber septa. The tubes were placed in
9 Nov 1981 20 *~~*...........,.
so4........
10
1-5cDM 0.5p -e
o . i . . .
.7
9-13Cm 0.5 - ilr 5C
.. . . . ...... :......
E n
z 17-21 cm < 3
I05 -E o
S 5 g
E~~~~~~~~. . . . . .... . . . . . . . 9. . .. . . .......... w o
1.0 26- 31 cm 0
o Jo 5 10
TIME, days
Fig. 3. As Fig. 2, but of experiment begun on 9 November 1981.
the incubator and treated just like mud samples over the following several days.
Results The control experiments showed that
methane was not lost from the sealed Cor- ex centrifuge tubes (Crill 1980). The data from the methane gas control experiment were fit with a line by linear regression, and the slope of that line indicated a slight decline of 39 nmol CH4 d-l or a change of 0.4% d-l. Data from two methane-sat- urated water control experiments were combined and the same type of linear regression analysis illustrated an apparent increase in the methane concentration of
This content downloaded from 188.72.127.150 on Sat, 14 Jun 2014 10:52:19 AMAll use subject to JSTOR Terms and Conditions

1122 Crill and Martens
Table 1. Rates of methane production and sulfate reduction from linear regression analyses of data similar to that shown in Figs. 2-3. Temperature given below the experiment date is the incubation temper- ature for the experiment. (-SO4) indicates the methane production rate after sulfate concentration drops to undetectable levels. Numbers in parentheses are standard errors of the regression coefficients computed as in Snedecor and Cochran (1967). Some of the data were fit with two regression lines, one before sulfate concentration dropped to zero and one after. This was done when the errors of the regression coefficients were less for two lines than for one.
Exp Depth (cm) Methane production* Sulfate reduction*
21 Feb 81 2-4 0.002(0.0001) 0.16(0.02) 11?C 18-21 0.004(0.004) 0.03(0.02)
26-29 0.010(0.004) 0 32-35 0.005(0.005) 0
24 Apr 81 1-4 0.006(0.001) 0.46(0.12) 170C 15-18 -0.016(0.003) 0.09(0.02)
25-28 -0.006(0.0003) 0.04(0.01) 30-33 0.019(0.0007) 0
19 May 80 1-4 0.003(0.006) 1.38(0.10) 230C 6-9 0.002(0.007) 1.16(0.46)
11-14 0.002(0.007) 0.54(0.12) 17-20 0.015(0.006) 0.32(0.12)
29 May 80 1-4 -0.006(0.003) 0.49(0.03) 250C 6-9 0.006(0.005) 0.02(0.03)
12-15 0.007(0.009) 0.03(0.03) 18-21 0.160(0.045) 0
2 Jul 81 7-10 0.106(0.075) 0.36(0.08) 230C (-SO4) 0.305(0.40) 0
12-15 0.075(0.040) t (-SO4) 0.217(0.019) t 18-21 0.132(0.007) t 25-28 0.093(0.005) t
2 Aug 81 1-4 0.012(0.004) 0.92(0.10) 270C 7-10 0.070(0.021) 0.34(0.16)
(-SO4) 0.226(0.036) 0 13-16 0.261(0.036) 0.01(0.007) 19-22 0.156(0.014) 0 28-31 0.085(0.011) 0
30 Aug 81 1-5 0.009(0.004) 0.82(0.11) 260C 7-11 0.005(0.006) 0.24(0.05)
(-SO4) 0.067(0.012) 0 13-17 0.082(0.013) 0.08(0.05) (-SO4) 0.159(0.021) 0 19-23 0.087(0.010) 0.003(0.02) 25-29 0.056(0.013) 0.009(0.01)
5 Oct 80 1-4 0.006(0.002) 0.70(0.24) 260C 12-15 -0.011(0.003) 0.28(0.10)
(-SO4) 0.150(0.014) 0 18-21 0.014(0.040) 0.15(0.07) (-SO4) 0.084(0.011) 0 23-26 0.052(0.005) 0
8 Oct 79 2-5 0.002(0.003) 0.58(0.19) 220C 6-9 0.010(0.009) 0.27(0.15)
17-20 0.112(0.001) 0.16(0.08) (-SO4) 0.247(0.059) 0
9 Nov 81 1-5 0.004(0.004) 0.39(0.06) 190C 9-13 0.014(0.003) 0.09(0.03)
17-21 0.004(0.004) 0.04(0.07) 26-30 0.043(0.006) 0
* Rates expressed as mM CH, produced* d-l or mM SO,2- reduced d-l t Data lost.
This content downloaded from 188.72.127.150 on Sat, 14 Jun 2014 10:52:19 AMAll use subject to JSTOR Terms and Conditions
Methane production in marine sediments 1123
0.011 mM d-l or 0.7% d-1. When the un- certainty in the regression coefficient (0.014 mMol CH4 d-l) was added to the slope it showed that the method could de- tect changes of 1.7% d-1 (1 a) when the methane concentration of the sample was near saturation.
Data from two typical incubation ex- periments are shown in Figs. 2 and 3; the rates of change in the concentrations of methane and sulfate for all experiments comprise Table 1. The rates are calculated by fitting the data of the experiments with regression lines; the rates at a given depth are expressed as the slope of those lines. Some of the methane data were fit with two lines, as in the 7-10-cm interval of the 2 August 1981 experiment (Fig. 2, Ta- ble 2), when the errors of the regression coefficients were less for two lines than for one. The sulfate concentrations found at these depths (to 21 cm) were higher than those expected from the sulfate porewater data of Martens and Klump (1980) for 1977-1978, Kipphut and Martens (1982) for 1979, or Chanton and Crill (unpubl. data) for 1981-1982. There was probably some smearing of sediment along the core barrel during extrusion and packing. Hor- izontal variability in the sediment may also have contributed to some mixing of higher sulfate-containing sediment into meth- ane-producing mud. The presence of sul- fate and sulfate-reducing activity inhib- ited methane production in the centrifuge tubes. Only in the 7-10-cm interval of 2 August 1981 and the 17-20-cm interval of 8 October 1979 were methane production rates measured at the same time that sul- fate was being reduced (rate values > 2of).
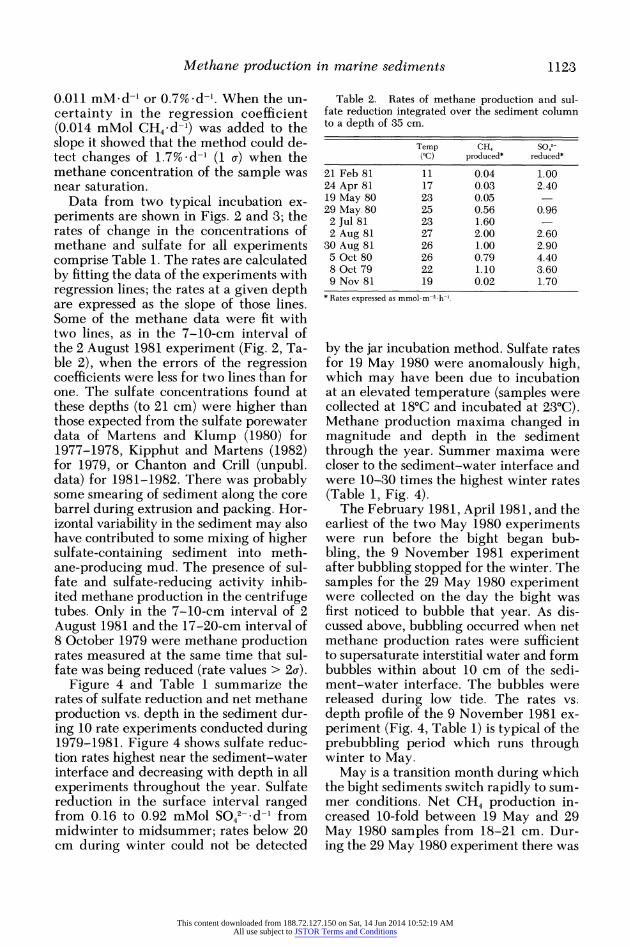
Figure 4 and Table 1 summarize the rates of sulfate reduction and net methane production vs. depth in the sediment dur- ing 10 rate experiments conducted during 1979-1981. Figure 4 shows sulfate reduc- tion rates highest near the sediment-water interface and decreasing with depth in all experiments throughout the year. Sulfate reduction in the surface interval ranged from 0.16 to 0.92 mMol SO42- d-l from midwinter to midsummer; rates below 20 cm during winter could not be detected
Table 2. Rates of methane production and sul- fate reduction integrated over the sediment column to a depth of 35 cm.
Temp CH, SO,2- (IC) produced* reduced*
21 Feb 81 11 0.04 1.00 24 Apr 81 17 0.03 2.40 19 May 80 23 0.05 29 May. 80 25 0.56 0.96 2 Jul 81 23 1.60 2 Aug 81 27 2.00 2.60
30 Aug 81 26 1.00 2.90 5 Oct 80 26 0.79 4.40 8 Oct 79 22 1.10 3.60 9 Nov 81 19 0.02 1.70
* Rates expressed as mmol M2 h-1.
by the jar incubation method. Sulfate rates for 19 May 1980 were anomalously high, which may have been due to incubation at an elevated temperature (samples were collected at 180C and incubated at 230C). Methane production maxima changed in magnitude and depth in the sediment through the year. Summer maxima were closer to the sediment-water interface and were 10-30 times the highest winter rates (Table 1, Fig. 4).
The February 1981, April 1981, and the earliest of the two May 1980 experiments were run before the bight began bub- bling, the 9 November 1981 experiment after bubbling stopped for the winter. The samples for the 29 May 1980 experiment were collected on the day the bight was first noticed to bubble that year. As dis- cussed above, bubbling occurred when net methane production rates were sufficient to supersaturate interstitial water and form bubbles within about 10 cm of the sedi- ment-water interface. The bubbles were released during low tide. The rates vs. depth profile of the 9 November 1981 ex- periment (Fig. 4, Table 1) is typical of the prebubbling period which runs through winter to May.
May is a transition month during which the bight sediments switch rapidly to sum- mer conditions. Net CH4 production in- creased 10-fold between 19 May and 29 May 1980 samples from 18-21 cm. Dur- ing the 29 May 1980 experiment there was
This content downloaded from 188.72.127.150 on Sat, 14 Jun 2014 10:52:19 AMAll use subject to JSTOR Terms and Conditions

1124 Crill and Martens
mM SO4 reduced per day ...............
mM CH4 produced per day x 10
0.1 I 1 2 1 2 1 2 3
+ +i..~z** 10
20 21 Feb 81 24 Apr 81 . 19 May 80- * 110 170 230
30 ,' 29 May280 " 2 Jul 81
40~~~~~~~~~~~~~~~~~~~~~~~~~~~~~~~~~~~
1 2 3 1 2 1 2 1 2 3 1
* .* . . ~~~~~~~~~~~~~~~8 OCt79 9 Nov 81
0 C<220 19
20(
30- 20ug81 ,
30Aug981 / 5 Oct 80 301L
270 260 260
40LL
Fig. 4. Rates of sulfate reduction and methane production plotted vs. depth. Horizontal lines through data points are the standard errors of the regression coefficients; vertical lines are the depth intervals of the samples.
no significant methane production at shal- lower depths even though sulfate concen- trations approached zero and sulfate re- duction rates decreased exponentially within 6 cm of the sediment surface.
In all the experiments there was no net methane production in the shallowest (1-5 cm) samples where the sulfate re- duction rates were always largest (Table 1). Net methane production at 7-10 cm in the 2 August 1981 experiment (Fig. 2, Table 1) showed two distinct behaviors, one when sulfate was present and being reduced and the other after the sulfate concentration went to zero. In the 7-10- cm interval 0.070 (?0.021) mMol CH4 d-l was produced when 0.34 (?0.16) mMol SO42- d-l was being reduced. Net methane production became 0.226 (?0.036) mMol CH4 d-l once the sulfate was depleted. All three rates were larger than twice the uncertainty in the regres- sion coefficients. The deepest intervals
where no sulfate was detected demon- strated a steady CH4 production through- out the experiment. This inhibitory effect on methane production at middle depths (7-20 cm) was observed in all the summer experiments where sulfate reduction was present.
To estimate rates of whole sediment column net methane production, we in- tegrated theoretical rate-depth curves for both the SO42- reduction and the CH4 pro- duction shown in Fig. 4. The curves for CH4 production were the same shape as the rate-depth curve for the 5 October 1980 experiment and were drawn on the assumption that the highest measured rate was the depth of the maximum CH4 pro- duction rate for the particular experi- ments. The production rate was taken to decline to zero at a depth of 35 cm, and then the theoretical rate-depth curve was integrated to give net methane production for the whole sediment column. Three in-
This content downloaded from 188.72.127.150 on Sat, 14 Jun 2014 10:52:19 AMAll use subject to JSTOR Terms and Conditions
Methane production in marine sediments 1125
dependent lines of evidence based on pre- vious work at station A-1 supported the assumption of a 35-cm lower limit. San- sone and Martens (1981) reported a peak in the apparent CH4 production from ace- tate at 15-20 cm which declined to near zero at 35 cm; Kipphut and Martens (1982) observed that the dissolved radioactive noble gas 222Rn was generally stripped from the sediments only between 8 and 35 cm by methane production and sub- sequent ebullition; and Martens and Klump (unpubl.) observed that the organ- ic carbon content of the sediment showed little change below 35-40 cm, indicating near completion of early diagenetic deg- radation processes. The integrated rates are listed in Table 2.
Discussion Depth distribution of sulfate reduction
and methane production rates-The winter experiments were started when bubbling had stopped in the bight, pre- sumably because of lowered rates of sed- imentary methane production associated with lower temperatures (see Zeikus and Winfrey 1976). As mentioned above sul- fate reduction was measured in all depth intervals to 20 cm during the experiments, and a slow but measurable net methane production was measured in the deepest intervals (Fig. 4). Once the sediments warmed and bubbling began, CH4 was al- ways produced at depths >18 cm.
Ten days after the 19 May 1980 exper- iment the bight had begun to bubble at low tide, sulfate at 18-21 cm had dropped to below the gravimetric method's detec- tion limit of 0.2 mM SO42-, and net meth- ane production had increased > 10-fold at the same depth (Fig. 4, Table 1). The most striking features of the 29 May 1980 ex- periment are the very low rates of net methane production and sulfate reduction in the intermediate depths, below the near-surface maximum of sulfate reduc- tion and above the very high net methane production. This apparent gap in activi- ties may be due to anaerobic methane ox- idation or perhaps to a nonsteady state re- sponse in which methane production has not kept pace with sulfate reduction after
the temperature increase. Reeburgh (1980) and Iversen and Blackburn (1981) have reported direct measurements of methane oxidation in anoxic marine sediments. Murray et al. (1978) suggested that up to 75% of the sulfate reduction observed in anoxic Saanich Inlet sediments may be supported by anaerobic methane oxida- tion. In sediments of Kysing Fjord, Iver- sen and Blackburn (1981) reported that only a very small percentage of reduced carbon for sulfate reduction is provided by methane. Methane oxidation should not be an important source of electrons in the presence of large amounts of acetate un- less most of the acetate measured is un- available to the sulfate reducers given the larger free energy of reaction (- 11.4 kcal) for the oxidation of acetate with sulfate compared to the 4.1 kcal (from Thauer et al. 1977) evolved for similar methane ox- idation.
As sulfate becomes more scarce, sulf ate- reducing bacteria could shift toward fer- mentation reactions producing acetate, CO2, and H2 from larger fatty acids and alcohols (see Mountford et al. 1980). The reducing equivalents from the oxidation of these last molecules by sulfate reducers or other organisms are transferred to methanogens as H2, or perhaps some re- duced organic compound, and should serve to stimulate methanogenesis at the same time that acetate builds up (as ob- served in Cape Lookout Bight sediments: Sansone and Martens 1982). Acetate con- centrations reach a peak in late August to early September below the base of the sul- fate reduction zone in the same depth in- tervals (10-15 cm: Sansone and Martens 1982) as the maxima in methane produc- tion observed in August 1981 and October 1980 (Fig. 4, Table 1).
Dissolved SO42- profiles (Klump and Martens 1981) indicated that sulfate con- centrations went to below detectable levels at 10-12-cm depth in October of 1978, and Sansone and Martens (1982) drew their 1 mM SO42- isopleth at 16 cm for October 1979. It is therefore surprising to find high sulfate concentrations (>2.5 mMol) in 18-21-cm samples from the Oc- tober 1979 experiment. The high sulfate
This content downloaded from 188.72.127.150 on Sat, 14 Jun 2014 10:52:19 AMAll use subject to JSTOR Terms and Conditions
1126 Crill and Martens
in this case is possibly due to smearing and mixing of the sediment along the walls of the core tubes during coring and section- ing. Sulfate was not present below 10 cm at this time of year from 1976 to 1978 (Klump 1980; Bartlett 1981). Unpublished data of Chanton and Crill for 1981 and 1982 show the 1 mM SO42- isopleth to be at 12-16 cm in October. We found 1 mM SO42- at 10 cm from mid-July to mid-Au- gust 1981 with the 1-mM isopleth drop- ping deeper after mid-August. Initial SO42- concentrations, determined by extrapolat- ing the sulfate reduction rates measured in this study back to time zero, agree in the 1981 experiments to within 10% of the sulfate concentrations determined in sep- arate cores taken when the samples were gathered. Also the horizontal variability in the sediments may have caused mixing of higher sulfate mud with samples from a sulfate-poor zone. However, bight sedi- ments are remarkably uniform in pore- water composition over an area of about 1 km2 (see Bartlett 1981).
In spring, when sediment temperatures rise, there is an initial burst of activity by the SO42- reducers in the depths inter- mediate between the sulfate zone and the methane zone which rapidly depletes the concentrations of sulfate, and probably of hydrogen and metabolizable organic car- bon substrates. When sulfate is depleted there is a rapid recovery of methane pro- duction capacity in the intermediate depths from 7 to 20 cm. It should be noted that the sediments at the depths where methane production commences are ap- proximately a year old and so are not sub- jected to sudden changes in the amount or type of organic carbon. This suggests, in line with the observations of Cappen- berg (1974) and Winfrey and Zeikus (1977), that at these depths there are large enough numbers of methanogens to com- pete successfully with sulfate-reducing bacteria for available substrates so that they can maintain populations for at least brief periods. The actual interactions in the sediments are perhaps more compli- cated and the simultaneous occurrence of methane production and sulfate reduction may involve other organisms that can pro-
vide methanogenic substrates such as Clostridium sp. (Weimer and Zeikus 1977). Data of Sansone and Martens (1982) show that by May 1980, acetate was al- ready beginning to accumulate in the 6- 15-cm depth interval.
By early October the bight sediments are still actively bubbling, but the meth- ane fluxes (Martens and Klump 1980) and acetate turnover rates (Sansone and Mar- tens 1981) have dropped considerably from their midsummer peaks. Acetate concentrations in the sediments below 10 cm are declining (Sansone and Martens 1982), suggesting that methanogens may be utilizing acetate. Other anaerobic het- erotrophs, such as Clostridia and sulfate- reducing organisms, may also be consum- ing acetate. Laanbroek and Pfenning (1981) indicated that acetate is not min- eralized in the absence of sulfate by sul- fate reducers without a convenient elec- tron sink. McInerney and Bryant (1981) showed that lactate and acetate can be de- graded anaerobically in the absence of sulfate by Desulfovibrio provided that a proper electron sink is available. In Mc- Inerney and Bryant's case it is coculture with a particular species of methanogen that allows the complete degradation of lactate. During the warmer months in the sediments of Cape Lookout Bight below the sulfate reduction zone, the rapid use of H2 or other organic electron carriers by methanogens would enable sulfate re- ducers to metabolize more of the larger organic molecules by providing an elec- tron sink, causing a buildup of acetate and an increase in net methane production.
In Table 3 we compare the apparent CH4 production rates from the [1,2- 14C]acetate turnover experiments of San- sone and Martens (1982) with the CH4 production measured at the same site dur- ing this study. The labeled acetate data overestimate the methane production in all but the October 1979 experiments. Taken at face value, the numbers indicate that most of the CH4 production is de- rived from acetate. There is enough vari- ation in the sediments to require caution in making direct comparisons from year to year. The samples for the October 1979
This content downloaded from 188.72.127.150 on Sat, 14 Jun 2014 10:52:19 AMAll use subject to JSTOR Terms and Conditions

Methane production in marine sediments 1127
Table 3. Comparison of rates of methane production from incubation experiments and from [14C]acetate turnover experiments of Sansone (1980). Samples are all from the same site in Cape Lookout Bight. SE in parentheses.
Sansone (1980) This study
Temp (?C) Depth* (cm) CH4 productiont Temp (?C) Depth* (cm) CH4 productiont
21 Mar 79 16 28-33 0.132(0.029) 24 Apr 81 17 30-33 0.019(0.001) 24 May 79 22 18-23 0.016(0.011) 19 May 80 23 17-20 0.015(0.006)
29 May 80 25 18-21 0.160(0.045) 14 Jul 79 24 10-15 0.456(0.120) 2 Jul 81 23 12-15 0.217(0.019)
2 Aug 81 27 13-16 0.261(0.036) 30 Aug 79 27 10-15 2.112(0.576) 30 Aug 81 26 13-17 0.159(0.021)
5 Oct 80 26 18-21 0.084(0.011) 11 Oct 79 21 15-20 0.204(0.055) 8 Oct 79 22 17-20 0.247(0.059) 27 Nov 79 18 20-25 0.240(0.072) 9 Nov 81 19 26-30 0.043(0.006) * From sediment-water interface t In mM CH4 produced d-l
experiments were taken from the bight 3 days apart and represent late summer conditions in the sense that the bight is still bubbling at low tide, but they follow behind the summer's maximum methane flux activities (Fig. 5) by about 1-2 months (Martens and Klump 1980). These pre- vious flux results indicate that October methane production rates were slowing, and the data of Sansone and Martens (1982) show that total wet sediment ace- tate concentrations were falling. Their production rate from acetate of 0.204 +
0.55 gmol CH4 cm-3 d-l underestimates the measured net methane production from the present study by about 20%, which indicates that a significant propor- tion of the methanogenesis may be de- rived from sources other than acetate. If anything, the CH4 from labeled acetate should overestimate the true CH4 produc- tion from acetate, because the production data are calculated with whole sediment acetate concentrations which are probably larger than the acetate pool sizes available for methanogenesis (Sansone and Martens 1981). The rest, and possibly even most, of the methane is presunYably produced from the reduction of CO2 by hydrogen (Mah et al. 1977; Zeikus 1977), which yields 32.4 kcal (Thauer et al. 1977).
Thermodynamically it is unclear why methanogens would preferentially use acetate as a substrate since the free energy evolved upon the dissimilation of acetate
to CO2 and CH4 is only 7.4 keal, less than the 7.6-12 keal required by a cell to phos- phorylate ADP (Thauer et al. 1977). Yet Smith and Mah (1980) did report a species of Methanosarcina that can grow solely on acetate although long periods are required for cultures grown on CO2-H2 to adapt to acetate utilization.
There are other pressures on methano- genic bacteria to utilize CO2 and H2 rather than acetate in addition to the lower en- ergy yield. In the sulfate reduction zone acetate can be used directly to reduce sul- fate with a higher free energy yield (-11.4 kcal mol-h S042-: Thauer et al. 1977) than that gained from the splitting of acetate by methanogens, so they are less efficient and thus outcompeted, in thermodynamic terms, for acetate as well as for molecular hydrogen: such competition has been ob- served in lake sediments (Winfrey and Zeikus 1977). Once sulfate is depleted there is a need in the sediment for an elec- tron acceptor-a role that the reduction of CO2 with H2 can fill (Bryant et al. 1976) but production of CO2 and CH4 from ace- tate cannot. Methanogenesis as an elec- tron sink would allow the coexistence of a sizable population of sulfate reducers which become hydrogen-donating organ- isms in zones of net methane production where sulfate has been depleted. The pro- duction of methane in the presence of S042- reduction at middepth intervals during the 9 October 1979 and 2 August
This content downloaded from 188.72.127.150 on Sat, 14 Jun 2014 10:52:19 AMAll use subject to JSTOR Terms and Conditions
1128 Crill and Martens
3.0 -
0 Methane sed-water flux, 1976-78 x~ * 0 Methane production, 1979-81
CL
0
,0 1.0 A
J- IN M
190 O;tiEsuy*
c-)
CE
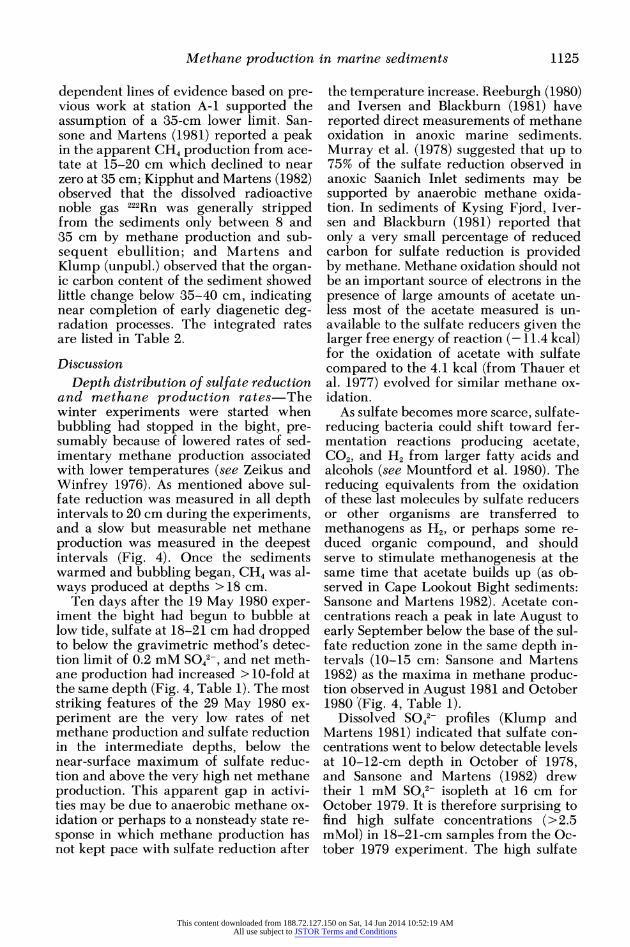
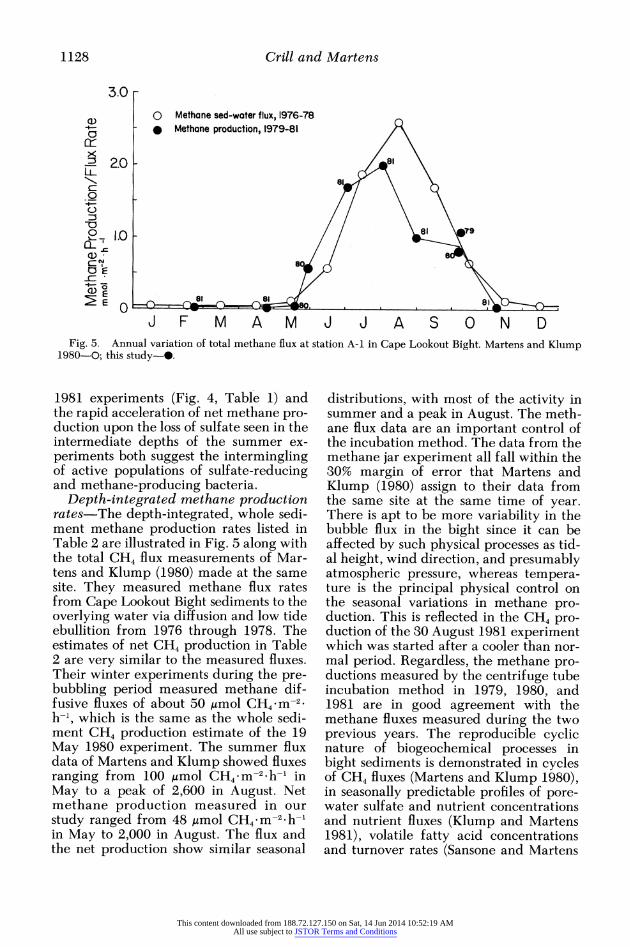
J F M A M J J A SON D Fig. 5. Annual variation of total methane flux at station A-i in Cape Lookout Bight. Martens and Kiump
1980-0; this study-@.
1981 experiments (Fig. 4, Table 1) and the rapid acceleration of net methane pro- duction upon the loss of sulfate seen in the intermediate depths of the summer ex- periments both suggest the intermingling of active populations of sulfate-reducing and methane-producing bacteria.
Depth-integrated methane production rates-The depth-integrated, whole sedi- ment methane production rates listed in Table 2 are illustrated in Fig. 5 along with the total CH4 flux measurements of Mar- tens and Klump (1980) made at the same site. They measured methane flux rates from Cape Lookout Bight sediments to the overlying water via diffusion and low tide ebullition from 1976 through 1978. The estimates of net CH4 production in Table 2 are very similar to the measured fluxes. Their winter experiments during the pre- bubbling period measured methane dif- fusive fluxes of about 50 Amol CH4 m-2 h-1, which is the same as the whole sedi- ment CH4 production estimate of the 19 May 1980 experiment. The summer flux data of Martens and Klump showed fluxes ranging from 100 Amol CH4 mM-2 h- in May to a peak of 2,600 in August. Net methane production measured in our study ranged from 48 gmol CH4 m-2 h-I in May to 2,000 in August. The flux and the net production show similar seasonal
distributions, with most of the activity in summer and a peak in August. The meth- ane flux data are an important control of the incubation method. The data from the methane jar experiment all fall within the 30% margin of error that Martens and Klump (1980) assign to their data from the same site at the same time of year. There is apt to be more variability in the bubble flux in the bight since it can be affected by such physical processes as tid- al height, wind direction, and presumably atmospheric pressure, whereas tempera- ture is the principal physical control on the seasonal variations in methane pro- duction. This is reflected in the CH4 pro- duction of the 30 August 1981 experiment which was started after a cooler than nor- mal period. Regardless, the methane pro- ductions measured by the centrifuge tube incubation method in 1979, 1980, and 1981 are in good agreement with the methane fluxes measured during the two previous years. The reproducible cyclic nature of biogeochemical processes in bight sediments is demonstrated in cycles of CH4 fluxes (Martens and Klump 1980), in seasonally predictable profiles of pore- water sulfate and nutrient concentrations and nutrient fluxes (Klump and Martens 1981), volatile fatty acid concentrations and turnover rates (Sansone and Martens
This content downloaded from 188.72.127.150 on Sat, 14 Jun 2014 10:52:19 AMAll use subject to JSTOR Terms and Conditions

Methane production in marine sediments 1129
1981, 1982), and temperature (Bartlett 1981). The regular fluctuations of these parameters over the preceding 4-5 years allows rough comparisons of data from dif- ferent years to be made.
Rates of whole sediment methane pro- duction ranged from 20 Amol CH4 m-2 h-1 during the winter nonbubbling period to 2,000 in August 1981. The integrated production rates were very similar to methane flux data from the sediments at the same station, showing that jar experi- ments in these sediments accurately re- flect in situ conditions.
References BARTLETT, K. 1981. Macrofauna distribution and
seasonal influences on interstitial water chemis- try of Cape Lookout Bight, N.C. M.S. thesis, Univ. North Carolina, Chapel Hill. 98 p.
BRYANT, M. P., E. A. WOLIN, AND R. S. WOLFE. 1976. Methanobacillus omelianskii, a symbiot- ic association of two species of bacteria. Arch. Microbiol. 59: 20-31.
CAPPENBERG, T. E. 1974. Interrelations between sulfate-reducing and methane-producing bacte- ria in bottom deposits of a fresh water lake. 1. Field observations. Antonie van Leeuwenhoek (J. Serol. Microbiol.) 40: 285-295.
CHANTON, J. P. 1979. Lead-210 geochronology in a changing environment: Cape Lookout Bight, North Carolina. M.S. thesis, Univ. North Caro- lina, Chapel Hill. 85 p.
, C. S. MARTENS, AND G. W. KIPPHUT. 1983. Lead-210 sediment geochronology in a changing coastal environment. Geochim. Cosmochim. Acta 47: in press.
CLAYPOOL, G. E., AND I. R. KAPLAN. 1974. The origin and distribution of methane in marine sediments, p. 99-139. In I. R. Kaplan [ed.], Nat- ural gases in marine sediments. Plenum.
CRILL, P. M. 1980. Methane production and sulfate reduction in the anoxic, coastal marine sediment of Cape Lookout Bight, North Carolina. M.S. thesis, Univ. North Carolina, Chapel Hill. 44 p.
IVERSEN, N., AND T. H. BLACKBURN. 1981. Season- al rates of methane oxidation in anoxic marine sediments. Appl. Environ. Microbiol. 41: 1295- 1299.
KIPPHUT, G. W., AND C. S. MARTENS. 1982. Bio- geochemical cycling in an organic-rich coastal marine basin-3. Dissolved gas transport in methane-saturated sediments. Geochim. Cos- mochim. Acta 46: 2049-2060.
KLUMP, J. V. 1980. Benthic nutrient regeneration and the mechanisms of chemical sediment-water exchange in an organic rich coastal marine sed- iment. Ph.D. thesis, Univ. North Carolina, Chapel Hill. 160 p.
, AND C. S. MARTENS. 1981. Biogeochemical cycling in an organic-rich coastal marine ba-
sin-2. Nutrient sediment-water exchange pro- cesses. Geochim. Cosmochim. Acta 45: 101-121.
LAANBROEK, H. J., AND N. PFENNIG. 1981. Oxi- dation of short-chain fatty acids by sulfate-re- ducing bacteria in freshwater and in marine sed- iments. Arch. Microbiol. 128: 330-335.
McINERNEY, M. J., AND M. P. BRYANT. 1981. An- aerobic degradation of lactate by syntrophic as- sociations of Methanosarcina barkeri and De- sulfovibrio species and effect of H2 on acetate degradation. Appl. Environ. Microbiol. 41: 346- 354.
MAH, R. A., D. M. WARD, L. BARESI, AND T. L. GLASS. 1977. Biogenesis of methane. Annu. Rev. Microbiol. 31: 309-341.
MARTENS, C. S. 1976. Control of methane sedi- ment-water bubble transport by macro-infaunal irrigation in Cape Lookout Bight, North Caro- lina. Science 192: 998-1000.
5 AND R. A. BERNER. 1974. Methane pro- duction in the interstitial waters of sulfate-de- pleted marine sediments. Science 185: 1067- 1069.
5 AND J. V. KLUMP. 1980. Biogeochemical cycling in an organic-rich coastal marine basin. 1. Methane sediment-water exchange processes. Geochim. Cosmochim. Acta 44: 471-490.
MOUNTFORD, D. 0., R. A. ASHER, E. L. MAYS, AND J. M. TIEDJE. 1980. Carbon and electron flow in mud and sandflat intertidal sediments at Del- aware Inlet, Nelson, New Zealand. Appl. Envi- ron. Microbiol. 39: 686-694.
MURRAY, J. W., V. GRUNDMANIS, AND W. M. SME- THIE, JR. 1978. Interstitial water chemistry in the sediments of Saanich Inlet. Geochim. Cos- mochim. Acta 42: 1011-1026.
REEBURGH, W. S. 1980. Anaerobic methane oxi- dation: Rate depth distribution in Skan Bay sed- iments. Earth Planet. Sci. Lett. 47: 345-352.
SANSONE, F. J. 1980. Volatile fatty acid cycling in anoxic coastal sediments. Ph.D. thesis, Univ. North Carolina, Chapel Hill.
5 AND C. S. MARTENS. 1981. Methane pro- duction from acetate and associated methane fluxes in anoxic coastal sediments. Science 211: 707-709.
, AND . 1982. Volatile fatty acid cy- cling in organic-rich marine sediments. Geo- chim. Cosmochim. Acta 46: 1575-1589.
SMITH, M. R., AND R. A. MAH. 1980. Acetate as sole carbon and energy source for growth of Methanosarcina strain 277. Appl. Environ. Mi- crobiol. 39: 993-999.
SNEDECOR, G. S., AND W. G. COCHRAN. 1967. Sta- tistical methods. Iowa State.
THAUER, R. K., K. JUNGERMANN, AND K. DECKER. 1977. Energy conservation in chemotrophic an- aerobic bacteria. Bacteriol. Rev. 41: 100-180.
WEIMER, P. J., AND J. G. ZEIKUS. 1977. Fermen- tation of cellulose and cellobiose by Clostridium thermocellum in the absence and presence of Methanobacterium thermoautotrophicum. Appl. Environ. Microbiol. 33: 289-297.
WEISS, R. F., AND H. CRAIG. 1973. Precise ship- board determination of dissolved nitrogen, oxy-
This content downloaded from 188.72.127.150 on Sat, 14 Jun 2014 10:52:19 AMAll use subject to JSTOR Terms and Conditions

1130 Crill and Martens
gen, argon and total inorganic carbon by gas chromatography. Deep-Sea Res. 20: 291-303.
WINFREY, M. R., AND J. G. ZEIKUS. 1977. Effect of sulfate on carbon and electron flow during mi- crobial methanogenesis in freshwater sediments. Appl. Environ. Microbiol. 33: 275-281.
ZEHNDER, A. J. 1978. Ecology of methane forma- tion, p. 349-376. In R. Mitchell [ed.], Water pol- lution microbiology, v. 2. Wiley.
ZEIKUS, J. G. 1977. The biology of methanogenic bacteria. Bacteriol. Rev. 41: 514-541.
, AND M. R. WINFREY. 1976. Temperature limitation of methanogenesis in aquatic sedi- ments. Appl. Environ. Microbiol. 31: 99-107.
Submitted: 16 February 1982 Accepted: 11 April 1983
This content downloaded from 188.72.127.150 on Sat, 14 Jun 2014 10:52:19 AMAll use subject to JSTOR Terms and Conditions