spatial analysis of soil fertility parameters
TRANSCRIPT

Ž .Precision Agriculture, 1, 5]14 1999Q 1999 Kluwer Academic Publishers. Manufactured in The Netherlands.
Spatial Analysis of Soil Fertility ParametersC. A. CAMBARDELLA AND D. L. KARLEN
USDA-ARS, National Soil Tilth Laboratory, Ames, IA 50011-4420
Abstract. Databases identifying spatial distributions of soil properties are needed to implementsite-specific management practices. This study examined spatial patterns for nine soil chemical proper-
Ž . w Ž . xties in two adjacent fields, one in a corn Zea mays L. -soybean Glycine max L. Merr. rotation withŽ .inorganic fertilizer and the other in a 5-yr corn-soybean-corn-oat A¨ena sati a L. -meadow rotation
with organic nutrient sources. We established sampling grids in both fields and collected soil cores to aŽdepth of 30 cm. Soil properties with strong spatial correlations low nugget variancertotal variance
. Ž .ratio and the maximum distance to which those properties were correlated range differed for the twofields. Soil pH, exchangeable Ca, total organic C, and total N were strongly correlated and had rangevalues greater than 182 m in the conventional field. Bray P and exchangeable Mg were stronglycorrelated with range values of less than 100 m within the other. Low nuggetrtotal variance ratios andsmall range values for P and Mg suggest patchy distributions, probably from long-term animal manureand municipal sludge application. Since most variance was structural in the organic field, placingsampling points closer together would improve data precision. In contrast, a relatively coarse samplinggrid with fewer sampling points spaced further apart appears adequate for the conventional field. Todevelop accurate sampling strategies for precision agriculture, long-term field management historiesshould be documented since the practices appear to affect both the properties that are stronglycorrelated and the range to which the correlation exists.
Introduction
Ž .Precision agriculture requires three primary components: I global positioning toŽ .know where equipment is located, II real-time mechanisms for controlling nutri-
Ž .ent, pesticide, seed, water, or other crop production inputs, and III databases thatprovide information needed to develop an appropriate input response to varioussite-specific conditions. Technologies associated with requirements I and II arewell advanced compared to development and interpretation of databases that areneeded to obtain the full economic and environmental benefits of precisionagriculture. Assessing soil fertility is one of the first operations needed to developdatabases for precision agriculture.
Ž .Franzen and Peck 1995 stated that addressing soil heterogeneity is one of theoldest challenges facing farmers and agricultural researchers. They also acknowl-edged that long ago, extensive soil sampling was recognized as a basis for site-specific fertilizer application. However as fertilizers became less expensive, it wassimpler to treat entire fields than to complicate the process with spot application.As a result, soil sampling protocol was generally based on finding a centraltendency for a field or field segment. The development of computer-controlledfertilizer application equipment and global positioning systems have renewedchallenges to develop efficient sampling and mapping procedures that accurately

CAMBARDELLA AND KARLEN6
Figure 1. Site map with location of sampling grids and description of soils.
Ždefine spatial variability Wollenhaupt et al., 1994; Franzen and Peck, 1995; Pierce.et al., 1995 .
Recent studies conducted to determine appropriate soil-test sampling protocolfor precision agriculture have suggested that grid points should not be spaced more
Žthan 66 to 100 m apart Wollenhaupt et al., 1994; Franzen and Peck, 1995; Pierce.et al., 1995 . However, those studies were not conducted in fields with grid points
located closer than 25 m, and there was no indication that animal manure ormunicipal sludge was being applied to any of the sites. The objective for this studywas to examine spatial variability in soil test parameters within 1.5- and 2.3-hasegments of adjacent 16 ha fields in central Iowa that had distinctly differentlong-term management histories.
Materials and methods
Field histories
The ‘‘organic’’ field has been managed for the past 25 y in a 5-year corn, soybean,corn, oat, and mixed hay rotation. Ridge-tillage is used for row crops and a
Žmanurermunicipal sludge-kiln dust mixture is the primary nutrient source Karlen.and Colvin, 1992 . A 1.5-ha sampling area was located in the center portion of theŽ .east 16 ha field Fig. 1 . The ‘‘conventional’’ field has been in a 2-y, corn and
Ž .soybean rotation since 1957 Karlen and Colvin, 1992 . The farm is managed usingconventional practices for tillage, weed control and fertilization typical for Boone

SPATIAL ANALYSIS OF SOIL FERTILITY PARAMETERS 7
County, Iowa. A 2.3-ha sampling area was located on the west side of the west 16Ž .ha field Fig. 1 .
Sampling design
We established two systematic sampling grids, one in the conventional field in 1992and one in the organic field in 1993. Each grid represented approximately 25% ofthe total area in each field. The long axis of each grid was placed in the samedirection as the corn rows. Both grids were sampled in June, which was also priorto ridge-building in the organic field. The fields were sampled in different years sothat both were planted to corn at the time of sample collection. The grid in the
Ž .organic field was 290 m long by 46 m wide 1.5 ha . Samples were collected at thegrid intersection points, every 15 m = 15 m, to produce a total of 80 sampling
Ž .points. The grid dimensions in the conventional field were 320 m by 30 m 2.3 ha ,with intersection points every 15 m to produce a total of 66 sampling points.
Three, 5-cm diameter soil cores were collected within a 1-m radius of each gridpoint using a hydraulic soil sampler. Cores were fractionated into 0 to 5-, 5 to 10-,10 to 20-, and 20 to 30-cm depth increments and composited. Samples were airdried, crushed and passed through a 2 mm sieve.
Laboratory analysis
Soil pH was determined using a soil to solution ratio of 1:1 in water. BrayŽ . Ž .extractable phosphorous P concentrations Knudsen and Beegle, 1988 were
measured colorimetrically using ascorbic acid-ammonium molybdate reagents withŽ 1 .a flow-injection analyzer Lachat Instruments, Milwaukee, WI . Exchangeable
Ž . Ž . Ž . Ž .potassium K , calcium Ca , and magnesium Mg Brown and Warncke, 1988were measured using atomic absorption spectrophotometry. Total organic carbonŽ . Ž .tot org C and total nitrogen total N were measured using dry combustion
Žmethods in a Carlo-Erba NA1500 NCS elemental analyzer Haake Buchler Instru-.ments, Paterson, NJ .
Statistical analyses
Ž .Data analysis for each of the grids was done in three stages: i normality tests wereŽ .conducted; ii distributions were described using traditional summary statistics
Ž . Ž .mean, standard deviation, and CV ; and iii semivariograms were defined anddifferences in nugget and total semivariance and range examined for the variables.Normality tests were conducted using PROC UNIVARIATE and non-normal datawere log-transformed to stabilize the variance prior to calculation of the semivari-
Ž . Žance SAS Institute, 1985 . Geostatistical software GSq , Gamma Design Soft-.ware, St. Plainwell, MI was used to analyze the spatial structure of the data and to
define the semivariograms. Maximum lag distance for the grid in the organic fieldwas 290 m, resulting in 12 lag distance classes. Each lag distance class contained at

CAMBARDELLA AND KARLEN8
least 175 pairs of points for the calculation of semivariance and most containedmore than 300 pairs of data points. Maximum lag distance for the grid in theconventional field was 296 m, resulting in 12 lag distance classes. Each lag distanceclass contained at least 78 pairs of points and most contained more than 125 pairsof data points. The active lag distance for both grids was 183 m. Selection ofmodels for semivariograms was made based on visual fit and the r 2 values for theregression. Isotropic models were fitted in all cases. The nugget variance expressedas a percentage of the total semivariance was used to define distinct classes ofspatial dependence for the soil variables. If the ratio was less than or equal to 25%,
Ž .the variable is considered strongly spatially dependent S ; if the ratio was betweenŽ .25 and 75%, the variable was considered moderately spatially dependent M ; and
if the ratio was greater than 75%, the variable was considered weakly spatiallyŽ . Ž .dependent W Cambardella et al., 1994 . If the slope of the semivariogram was
close to zero, regardless of the nugget ratio, the variable was considered to beŽ .randomly distributed R .
Results and discussion
Inspection of whole grid mean values for soil properties within the conventionalfield reveals a consistent trend toward lower soil pH, lower exchangeable Ca andMg, lower total organic C and total N, and higher soil nitrate-N, compared with theorganic field. Values for Bray’s P, exchangeable K, and soil ammonium-N were
Ž .similar for the two farming systems Tables 1 and 2 . Soil pH and exchangeable Kand Mg were normally distributed in the organic field. Bray’s P and total N werenormally distributed in the conventional field. All other soil variable distributionsat all depths within both fields were non-normal and were transformed usingŽ .ln z q 1 as the transformation factor prior to the calculation of semivariance.The soil properties displayed differences in spatial dependence as determined by
Ž .semivariance analysis Table 3 and 4 . Spherical and linear isotropic models weredefined for most of the soil variables measured for both sites. The remainder of thesoil variables were defined by exponential models, with the exception of ammo-nium-N at 5]10 cm in the conventional field, which was defined by a gaussianmodel. For spherical, exponential, and gaussian models, semivariance increases
Ž . Žwith distance between samples lag distance to a constant value sill or total. Ž .semivariance at a given separation distance range of influence . For linear
models, as the distance between the two samples increases, the semivariance alsoincreases. Linear models where the slope is not equal to zero describe variablesthat are spatially correlated at all lag distances greater than the grid spacingdistance. If the linear model has a slope that is close to zero, then the totalvariance equals the nugget variance, and the variables are not correlated at
Ž .distances equal to or greater than the smallest lag interval randomly distributed .The semivariogram for soil nitrate-N in the organic field exhibited a slope close tozero in the top 10 cm, suggesting nitrate-N is randomly distributed at this site.Exchangeable Mg in the conventional field was randomly distributed for three ofthe four sampling depths.
SPATIAL ANALYSIS OF SOIL FERTILITY PARAMETERS 9
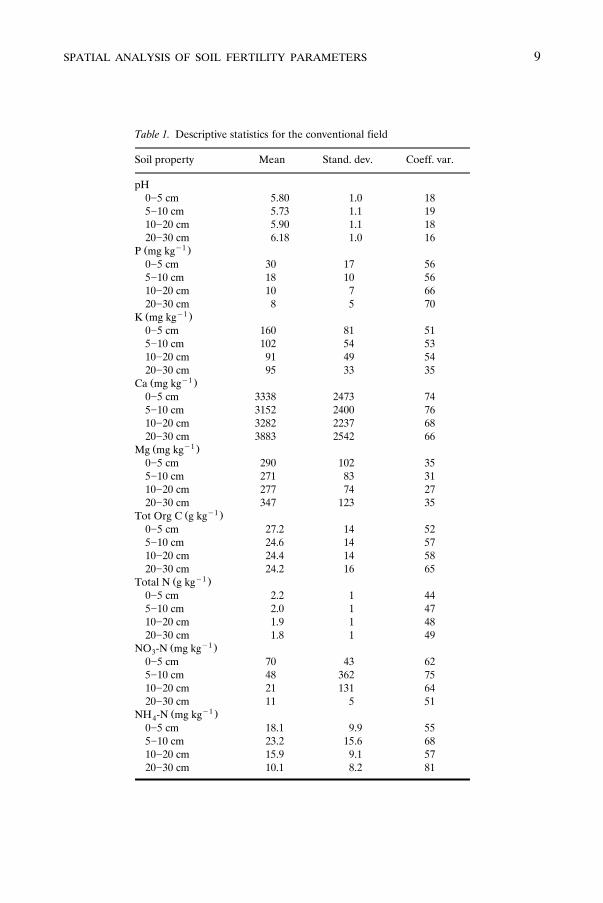
Table 1. Descriptive statistics for the conventional field
Soil property Mean Stand. dev. Coeff. var.
pH0]5 cm 5.80 1.0 185]10 cm 5.73 1.1 1910]20 cm 5.90 1.1 1820]30 cm 6.18 1.0 16
y1Ž .P mg kg0]5 cm 30 17 565]10 cm 18 10 5610]20 cm 10 7 6620]30 cm 8 5 70
y1Ž .K mg kg0]5 cm 160 81 515]10 cm 102 54 5310]20 cm 91 49 5420]30 cm 95 33 35
y1Ž .Ca mg kg0]5 cm 3338 2473 745]10 cm 3152 2400 7610]20 cm 3282 2237 6820]30 cm 3883 2542 66
y1Ž .Mg mg kg0]5 cm 290 102 355]10 cm 271 83 3110]20 cm 277 74 2720]30 cm 347 123 35
y1Ž .Tot Org C g kg0]5 cm 27.2 14 525]10 cm 24.6 14 5710]20 cm 24.4 14 5820]30 cm 24.2 16 65
y1Ž .Total N g kg0]5 cm 2.2 1 445]10 cm 2.0 1 4710]20 cm 1.9 1 4820]30 cm 1.8 1 49
y1Ž .NO -N mg kg30]5 cm 70 43 625]10 cm 48 362 7510]20 cm 21 131 6420]30 cm 11 5 51
y1Ž .NH -N mg kg40]5 cm 18.1 9.9 555]10 cm 23.2 15.6 6810]20 cm 15.9 9.1 5720]30 cm 10.1 8.2 81

CAMBARDELLA AND KARLEN10
Table 2. Descriptive statistics for the organic field
Soil property Mean Stand. dev. Coeff. var.
pH0]5 cm 7.62 0.3 35]10 cm 7.52 1.0 1310]20 cm 7.65 0.5 620]30 cm 7.58 1.1 14
y1Ž .P mg kg0]5 cm 58 37 655]10 cm 28 26 9210]20 cm 10 9 9520]30 cm 7 6 83
y1Ž .K mg kg0]5 cm 240 68 295]10 cm 122 40 3310]20 cm 116 27 2420]30 cm 110 27 24
y1Ž .Ca mg kg0]5 cm 4689 762 165]10 cm 4647 1014 2210]20 cm 4794 922 1920]30 cm 4533 1044 23
y1Ž .Mg mg kg0]5 cm 409 99 245]10 cm 392 121 3110]20 cm 399 115 2920]30 cm 413 126 31
y1Ž .Tot Org C g kg0]5 cm 50.8 7 145]10 cm 41.2 10 2510]20 cm 38.6 9 2420]30 cm 32.3 9 29
y1Ž .Total N g kg0]5 cm 4.0 1 135]10 cm 3.1 1 2310]20 cm 2.8 1 2120]30 cm 2.2 1 29
y1Ž .NO -N mg kg30]5 cm 28 6 225]10 cm 23 7 3110]20 cm 21 4 2120]30 cm 19 5 26
y1Ž .NH -N mg kg40]5 cm 20 13 695]10 cm 12 5 4710]20 cm 9 4 5120]30 cm 7 4 61

SPATIAL ANALYSIS OF SOIL FERTILITY PARAMETERS 11
Table 3. Semivariance parameters for conventional field grid
2Ž .Soil property Range m r Nugget ratio Class, model
pH0]5 cm ) 182 0.992 0.0 S, linear5]10 cm ) 182 0.993 0.0 S, linear10]20 cm ) 182 0.993 0.0 S, linear20]30 cm ) 182 0.994 0.0 S, linear
P0]5 cm 78 0.970 54.8 M, spherical5]10 cm 47 0.713 31.4 M, spherical10]20 cm 59 0.765 48.4 M, spherical20]30 cm 57 0.899 0.035 S, spherical
K0]5 cm 37 0.867 24.1 S, spherical5]10 cm 40 0.157 62.8 M, spherical10]20 cm 55 0.854 42.7 M, spherical20]30 cm 0 0.302 100.0 R
Ca0]5 cm 102 0.928 24.1 S, spherical5]10 cm ) 182 0.996 - 3.1 S, linear10]20 cm ) 182 0.986 - 10.9 S, linear20]30 cm 71 0.893 15.6 S, exponential
Mg0]5 cm 0 0.920 100.0 R5]10 cm 120 0.780 64.0 M, spherical10]20 cm 0 0.806 100.0 R20]30 cm 0 0.548 100.0 R
Tot Org C0]5 cm 78 0.978 4.7 S, spherical5]10 cm ) 182 0.973 - 11.2 S, linear10]20 cm ) 182 0.947 - 20.5 S, linear20]30 cm ) 182 0.941 - 19.9 S, linear
Total N0]5 cm 84 0.978 6.1 S, spherical5]10 cm ) 182 0.980 - 12.5 S, linear10]20 cm ) 182 0.964 - 17.7 S, linear20]30 cm ) 182 0.934 - 24.0 S, linear
NO -N30]5 cm ) 182 0.779 - 63.7 M, linear5]10 cm 168 0.738 70.2 M, spherical10]20 cm 73 0.762 59.1 M, spherical20]30 cm 0 0.513 100.0 R
NH -N40]5 cm 42 0.333 72.7 M, spherical5]10 cm 21 0.450 34.7 M, gaussian10]20 cm 0 0.848 100.0 R20]30 cm 69 0.897 17.9 S, exponential
Ž .UNugget Ratio s Nugget semivariancertotal semivariance 100Spatial Class: S s strong spatial dependence; M s moderate spatial dependence;R s random

CAMBARDELLA AND KARLEN12
Table 4. Semivariance parameters for organic field grid
2Ž .Soil property Range m r Nugget ratio Class, model
pH0]5 cm 60 0.671 0.136 S, spherical5]10 cm 55 0.068 56.1 M, spherical10]20 cm 54 0.886 0.044 S, spherical20]30 cm ) 182 0.444 - 60.7 M, linear
P0]5 cm 76 0.644 4.55 S, spherical5]10 cm 69 0.650 14.6 S, spherical10]20 cm 62 0.986 18.1 S, spherical20]30 cm 53 0.985 10.4 S, spherical
K0]5 cm 42 0.401 28.9 M, spherical5]10 cm 75 0.596 55.8 M, spherical10]20 cm 79 0.958 8.91 S, spherical20]30 cm 101 0.955 24.1 S, spherical
Calcium0]5 cm 63 0.817 2.81 S, exponential5]10 cm 55 0.099 55.7 M, spherical10]20 cm 42 0.826 0.192 S, exponential20]30 cm 171 0.997 33.9 M, spherical
Magnesium0]5 cm 51 0.369 0.107 S, spherical5]10 cm 46 0.341 0.074 S, spherical10]20 cm 51 0.323 5.31 S, spherical20]30 cm 61 0.357 12.1 S, spherical
Total Org C0]5 cm 101 0.986 14.5 S, exponential5]10 cm ) 182 0.835 - 42.1 M, linear10]20 cm 75 0.940 10.9 S, exponential20]30 cm 173 0.942 29.4 M, spherical
Total N0]5 cm ) 182 0.964 - 30.9 M, linear5]10 cm ) 182 0.640 - 65.1 M, linear10]20 cm 35 0.925 2.0 S, exponential20]30 cm 119 0.899 35.0 M, spherical
Nitrate-N0]5 cm 0 0.004 100.0 R5]10 cm 0 0.244 100.0 R10]20 cm 49 0.649 2.96 S, spherical20]30 cm ) 182 0.639 - 61.1 M, linear
Ammonium-N0]5 cm 31 0.394 20.2 S, spherical5]10 cm 32 0.111 60.3 M, spherical10]20 cm 38 0.614 4.26 S, spherical20]30 cm 36 0.579 27.2 M, spherical
Ž .UNugget Ratio s Nugget semivariancertotal semivariance 100Spatial Class: S s strong spatial dependence; M s moderate spatial dependence;R s random

SPATIAL ANALYSIS OF SOIL FERTILITY PARAMETERS 13
ŽThe specific soil properties that were strongly spatially correlated low nugget.variancertotal variance ratio and the maximum distance to which they were
Ž .correlated range differed for the two farming systems. There was no consistentŽ .spatial pattern at either site with depth of sampling Table 3 and 4 . Soil pH, Ca,
total organic C and total N were strongly spatially correlated at all depths for theconventionally managed field and range values for these soil properties were
Ž .generally greater than 183 m Table 3 . Previous research conducted on conven-tionally managed cornrsoybean fields in central Iowa showed similar trendsŽ .Cambardella et al., 1994 . Bray’s P and soil nitrate-N are moderately spatiallydependent for three of the four depths, soil ammonium-N and exchangeable Kexhibited moderate spatial dependence for two of the four depths, and exchange-able Mg was randomly distributed for three of the four depths in the conventionalfield. Bray’s P and exchangeable Mg were strongly spatially correlated at all depthswithin the organic field, and the range of correlation for both variables was less
Ž .than 100 m Table 4 . The low nuggetrtotal variance ratios and small range valuesfor the two properties suggest the distributions are patchy. The patchy distributionof P is likely a result of long-term manure and municipal sludge application at thissite. Hydrated lime was used to stabilize the manure-sludge mixture and thispractice may have contributed to the patchy distribution of Mg at this site.Although cement kiln-dust has a lower Mg content than lime, the application of
Žthe dust to the land may also have contributed to this pattern Rodale Institute,.1990 .
It has been hypothesized that strongly spatially dependent soil variables may beŽcontrolled by intrinsic variations in soil characteristics Rao and Wagenet, 1985;
.Cambardella et al., 1994 . The results presented here suggest that this may be trueonly for conventional systems with one or two crops, intensive tillage, and highchemical inputs. Extrinsic factors, such manure application, appear to play a largerrole in controlling strong spatial dependence for management systems with greaterthan two crops, less-intensive tillage, and low chemical inputs.
Conclusions
This study was undertaken to examine the small-scale spatial variability of selectedsoil-test parameters for two adjacent field sites with known but different long-termsoil and crop management histories. The study demonstrated agricultural manage-ment can affect the types of soil properties that are strongly spatially correlated aswell as the range of correlation of these properties. These results have importantimplications for how site-specific information should be collected and interpreted.The organic field would require relatively fine grid-spacing to describe thesmaller-scale spatial variability occuring at this site. Since most of the variance is
Ž .structural for this field, placing the sampling points closer together - 15 mŽ .should improve data precision Flatman and Yfantis, 1984 . In contrast, most of the
spatial variability within the conventional field could have been captured by usingrelatively coarse grid-spacing, with fewer sampling point spaced further apart. Todevelop sampling strategies for precision agriculture, long-term field management
CAMBARDELLA AND KARLEN14
histories should be documented since the practices appear to affect both theproperties that are strongly correlated and the range to which the correlationexists.
Notes
1. Mention of trademark, proprietary product, or vendor does not constitute a guarantee or warranty ofthe product by the USDA and does not imply its approval to the exclusion of other products orvendors that may also be suitable.
References
1. J. R. Brown and D. Warncke, ‘‘Recommended cation tests and measures of cation exchangecapacity,’’ in Recommended chemical soil test procedures for the North Central Region, W. C. DahnkeŽ . Ž .Ed. , NCR Publ. No. 221 Revised , North Dakota Agric. Exp. Stn., Fargo, 1988, p. 15]16.
2. C. A. Cambardella, T. B. Moorman, J. M. Novak, T. B. Parkin, D. L. Karlen, R. F. Turco, and A. E.Konopka, ‘‘Field-scale variability of soil properties in central Iowa soils,’’ Soil Sci. Soc. Am. J. vol.58, pp. 1501]1511, 1994.
3. G. T. Flatman and A. A. Yfantis, ‘‘The survey and the census.’’ En¨ironmental Monitoring andAssessment vol. 4, pp. 335]349, 1984.
4. D. W. Franzen and T. R. Pec, ‘‘Sampling for site-specific application,’’ in Site-Specific ManagementŽ .for Agricultural Systems, P. C. Robert, R. H. Rust, and W. E. Larson Eds. , ASA-CSSA-SSSA, Inc.,
Madison, WI, 1995, pp. 535]551.5. D. L. Karlen and T. S. Colvin, ‘‘Alternative farming system effects on profile nitrogen concentra-
tions on two Iowa farms,’’ Soil Sci. Soc. Am. vol. 56, pp. 1249]1256, 1992.6. D. Knudsen and D. Beegle, ‘‘Recommended phosphorus tests,’’ in Recommended chemical soil test
Ž . Ž .procedures for the North Central Region, W. C. Dahnke Ed. , NCR Publ. No. 221 Revised , NorthDakota State Agric. Exp. Stn., Fargo, 1988, p. 12]14.
7. F. J. Pierce, D. D. Warncke, and M. W. Everett, ‘‘Yield and nutrient variability in glacial soils ofMichigan,’’ in Site-Specific Management for Agricultural Systems, P. C. Robert, R. H. Rust, and W. E.
Ž .Larson Eds. , ASA-CSSA-SSSA, Inc., Madison, WI, 1995, pp. 133-151.8. P. S. C. Rao and R. J. Wagenet, ‘‘Spatial variability of pesticides in field soils: Methods for data
Ž .analysis and consequences,’’ Weed Sci. vol. 33 Suppl. 2 , pp. 18]24, 1985.9. Rodale Institute, ‘‘The Thompson Farm On-farm Research,’’ Rodale Institute, Emmaus, PA, 1990,
p. 5.10. SAS Institute, SAS user’s guide, Version 5, Cary, NC, 1985.11. N. C. Wollenhaupt, R. P. Wolkowski, and M. K. Clayton, ‘‘Mapping soil test phosphorus and
potassium for variable-rate fertilizer application,’’ J. Prod. Agric. vol. 7, pp. 441]448, 1994.