south west indian ocean risk assessment and financing...
TRANSCRIPT
South West Indian Ocean Risk Assessment and Financing Initiative (SWIO-RAFI)SUMMARY REPORT
2017P
ublic
Dis
clos
ure
Aut
horiz
edP
ublic
Dis
clos
ure
Aut
horiz
edP
ublic
Dis
clos
ure
Aut
horiz
edP
ublic
Dis
clos
ure
Aut
horiz
ed

© 2017 The International Bank for Reconstruction and Development/The World Bank1818 H Street NWWashington DC 20433Telephone: 202-473-1000Internet: www.worldbank.orgAll rights reserved
This publication is a product of the staff of the International Bank for Reconstruction and Development/The World Bank. The findings, interpretations, and conclusions expressed in this volume do not necessarily reflect the views of the Executive Directors of the World Bank or the governments they represent.
The World Bank does not guarantee the accuracy of the data included in this work. The boundaries, colors, denominations, and other information shown on any map in this work do not imply any judgment on the part of The World Bank concerning the legal status of any territory or the endorsement or acceptance of such boundaries.
Rights and Permissions The material in this publication is copyrighted. Copying and/or transmitting portions or all of this work without permission may be a violation of applicable law. The International Bank for Reconstruction and Development/The World Bank encourages dissemination of its work and will normally grant permission to reproduce portions of the work promptly.
For permission to photocopy or reprint any part of this work, please send a request with complete information to the Copyright Clearance Center Inc., 222 Rosewood Drive, Danvers, MA 01923, USA; telephone: 978-750-8400; fax: 978-750-4470; Internet: www.copyright.com.
All other queries on rights and licenses, including subsidiary rights, should be addressed to the Office of the Publisher, The World Bank, 1818 H Street NW, Washington, DC 20433.
Disclaimer: The sole responsibility of this publication lies with the authors. The European Union is not responsible for any use that may be made of the information contained therein.

South West Indian Ocean Risk Assessment and Financing Initiative (SWIO-RAFI)SUMMARY REPORT
II SOUTH WEST INDIAN OCEAN RISK ASSESSMENT AND FINANCING INITIATIVE (SWIO-RAFI)
The South West Indian Ocean Risk Assessment and Financing Initiative (SWIO-RAFI) is a joint initiative between the World Bank Group(WBG), the Indian Ocean Commission (IOC), and the five participating Island States of the Comoros, Madagascar, Mauritius, Seychelles and the Archipelago of Zanzibar—a semi-auton-omous Region of Tanzania.
The SWIO-RAFI was implemented by a WBG led by Doekle Wielinga and Alanna Simpson and Julie Dana, with support from Emily White, Emma Philips, Liana Razafindrazay, Luis Corrales, Richard Murnane, Richard Poulter, Samantha Cook, Simone Balog, Stuart Fraser and Vivien Deparday, with technical inputs from AIR Worldwide.
The technical materials used in this summary report were produced by a team from AIR Worldwide, led by Aaron Michel.
The report greatly benefited from data, information and other invaluable contribu-tions made available by the participating Island States, United Nations International Secretariat for Disaster Reduction (UNISDR), other development partners and pri-vate sector partners.
We would like to thank the financial support from the European Union (EU) in the framework of the Africa Caribbean Pacific (ACP)-EU Natural Disaster Risk Reduction (NDRR) Program,1 as well as the ACP-EU Africa Disaster Risk Financing (ADRF) Initiative2, both managed by GFDRR. In the GFDRR secretariat, the team we would like to particularly thank Luis Tineo, Manuela Chiapparino, Henriette Mampuya and Rossella Della Monica who all contributed to the success of the project in terms of liaising with the ACP Secretariat and the EU.
The team greatly appreciates the support and guidance received throughout the project from Mark Lundell, Sameh Wahba, Bernice van Bronkhorst, Olivier Mahul, and Christoph Pusch.
Acknowledgements
1 https://www.gfdrr.org/acp-eu
2 The ADRF Initiative is part of the EU funded program “Building Disaster Resilience in Sub-Saharan Africa”, implemented by several partners, including the African Development Bank, that African Union Commission, UNISDR and GFDRR-WBG. For more info http://www.prevention-web.net/resilient-africa/

IIICONTENTS
Contents
List of Tables
Acknowledgements IIAcronyms VExecutive Summary VII
Chapter 1. Genesis, Objective and Scope of the SWIO-RAFI Initiative 1Introduction 1Objective and Scope 2Regional Context and Relevance 2
Chapter 2. Methodology and Validation 5
Chapter 3. Country-specific Catastrophe Risk Profiles 14
Chapter 4. Risk Financing 25Annex 1: Financial Protection against Natural Disasters 33
TABLE ES1. Average Annual Loss (AAL). All Modeled Perils (AP) by SWIO Island State VIII
TABLE 1.1. Natural Disaster Effects in Comoros, Madagascar, Mauritius, and Seychelles from 1964 to 2014 4
TABLE 2.1. Number of Recorded Tropical Cyclone Events for Each SWIO Island Nation, by Decade. 7
TABLE 2.2. Number of Recorded Non-Tropical Cyclone Flooding Events 8
TABLE 2.3. Total Replacement Value of Residential/Non-Residential Assets by Island Nation (2015 Million USD) 9
TABLE 2.4. Census Year for Each Participating Country and Population Projections to 2015 10
TABLE 2.5. Administrative Region Classifications and Counts, from Coarsest (0) to Finest (4) 10
TABLE 2.6. SWIO Exposure Summary Statistics 12
TABLE 3.1. Natural Catastrophe Risk Profile for Comoros 16
TABLE 3.2. Natural Catastrophe Risk Profile for Madagascar 18
TABLE 3.3. Natural Catastrophe Risk Profile for Mauritius 20
TABLE 3.4. Natural Catastrophe Risk Profile for Seychelles 22
TABLE 3.5. Natural Catastrophe Risk Profile for Zanzibar 24
TABLE 4.1. Summary of Existing Regional Risk Pools 26
IV SOUTH WEST INDIAN OCEAN RISK ASSESSMENT AND FINANCING INITIATIVE (SWIO-RAFI)
List of Figures
FIGURE ES1. Replacement Cost as Percentage of Modeled Exposed Assets by Sector IX
FIGURE ES2. Financing Tools for Managing Sovereign Disaster Risk XI
FIGURE 3.2. Average Annual Loss Distribution in Comoros by Sector (left) and by Peril (right) 15
FIGURE 3.1. Replacement Cost of Exposed Assets in Comoros by Sector 15
FIGURE 3.3. Spatial Distribution of AAL for Comoros from All Perils Combined 16
FIGURE 3.5. Average Annual Loss Distribution in Madagascar by Sector (left) and by Peril (right) 17
FIGURE 3.4. Replacement Cost of Exposed Assets in Madagascar by Sector 17
FIGURE 3.6. Spatial Distribution of AAL for Madagascar from All Perils Combined 18
FIGURE 3.8. Average Annual Loss Distribution in Mauritius by Sector (left) and by Peril (right) 19
FIGURE 3.7. Replacement Cost of Exposed Assets in Mauritius by Sector 19
FIGURE 3.9. Spatial Distribution of AAL for Mauritius from All Perils Combined 20
FIGURE 3.11. Average Annual Loss Distribution in Seychelles by Sector (left) and by Peril (right) 21
FIGURE 3.10. Replacement Cost of Exposed Assets in Seychelles by Sector 21
FIGURE 3.12. Spatial Distribution of AAL for Seychelles from All Perils Combined 22
FIGURE 3.14. Average Annual Loss Distribution in Zanzibar by Sector (left) and by Peril (right) 23
FIGURE 3.13. Replacement Cost of Exposed Assets in Zanzibar by Sector 23
FIGURE 3.15. Spatial Distribution of AAL for Zanzibar from All Perils Combined 24
FIGURE 4.1. Sovereign Disaster Risk Layering 29

VACRONYMS
AAL Average Annual Loss
ACP - EU Africa, Caribbean and Pacific - European Union
ADRF Africa Disaster Risk Financing Initiative
AEL Annual Expected Loss
AIR AIR Worldwide
AP All Modeled Perils
BoM Australian Bureau of Meteorology
CCRIF Caribbean Catastrophe Risk Insurance Facility
ComMIT Community Model Interface for Tsunami
CRED Centre for Research on the Epidemiology of Disasters
DF Damage Function
DR Damage Ratio
EM-DAT CRED's Emergency Events Database
EP Exceedance Probability
EQ Earthquake
EU European Union
GAR United Nations Global Assessment Report
GDACS Global Disaster Alert and Coordinate System
GDP Gross Domestic Product
GEM Global Earthquake Magnitude
GFDRR Global Facility for Disaster Reduction and Recovery
GIS Geographic Information System
GMPE Ground Motion Prediction Equations
GoM Government of Madagascar
GSOD Global Surface Summary of the Day
IFPP ISLANDS Financial Protection Programme
IOC Indian Ocean Commission
IPF Investment Project Financing
IRIS Incorporated Research Institutions for Seismology
ISC International Seismic Centre
JAXA Japan Aerospace Exploration Agency
JTWC Joint Typhoon Warning Center
KfW KfW German Development Bank
KMF Comorian franc (currency)
Acronyms

VI SOUTH WEST INDIAN OCEAN RISK ASSESSMENT AND FINANCING INITIATIVE (SWIO-RAFI)
MDR Mean Damage Ratio
MGA Malagasy Ariary (currency)
MMI Modified Mercalli Intensity
MRP Mean Return Period
M USA Million(s) USA Dollars
MUR Mauritian Rupee (currency)
NASA National Aeronautics and Space Administration
NDRR Natural Disaster Risk Reduction Programme
NGO Non-Governmental Organization
NOAA National Oceanic and Atmospheric Administration
NTC Non-Tropical Cyclone
OFDA Office of United States Foreign Disaster Assistance
PCRAFI Pacific Catastrophe Risk Assessment and Financing Initiative
PDNA Post Disaster Needs Assessment
PGA Peak Ground Acceleration
PML Probable Maximum Loss
PPP Purchasing Power Parity
RSMC Regional Specialized Meteorological Center
SCR Seychelles Rupee (currency)
SDI Spatial Data Infrastructure
SIDS Small Island Developing States
SSHS Saffir-Simpson Hurricane Wind Scale
SWIO South West Indian Ocean
SWIO-RAFI SWIO Risk Assessment and Financing Initiative
TC Tropical Cyclone
TRMM Tropical Rainfall Measuring Mission
TZS Tanzanian Shilling (currency)
UNDP United Nations Development Programme
UNISDR United Nations Office for Disaster Risk Reduction
USD United States Dollar
USGS United States Geological Service
WBG World Bank Group
VIIEXECUTIVE SUMMARY
The South West Indian Ocean (SWIO) Island States are highly exposed to adverse natural events. On average, 13 tropical cyclones with wind speeds exceeding 63 km/h form in the SWIO basin every year. The tropical cyclones that form in this area can affect the SWIO Island States, resulting in affected population and financial losses, caused by high winds, flooding and storm surges. These countries are also exposed to flooding from non-tropical cyclone induced precipitation (e.g. monsoons), earthquakes, tsunamis, and other hazards such as drought, volca-nic activity, and landslides. As a result, SWIO Island States face high levels of physical and financial risk exposure.
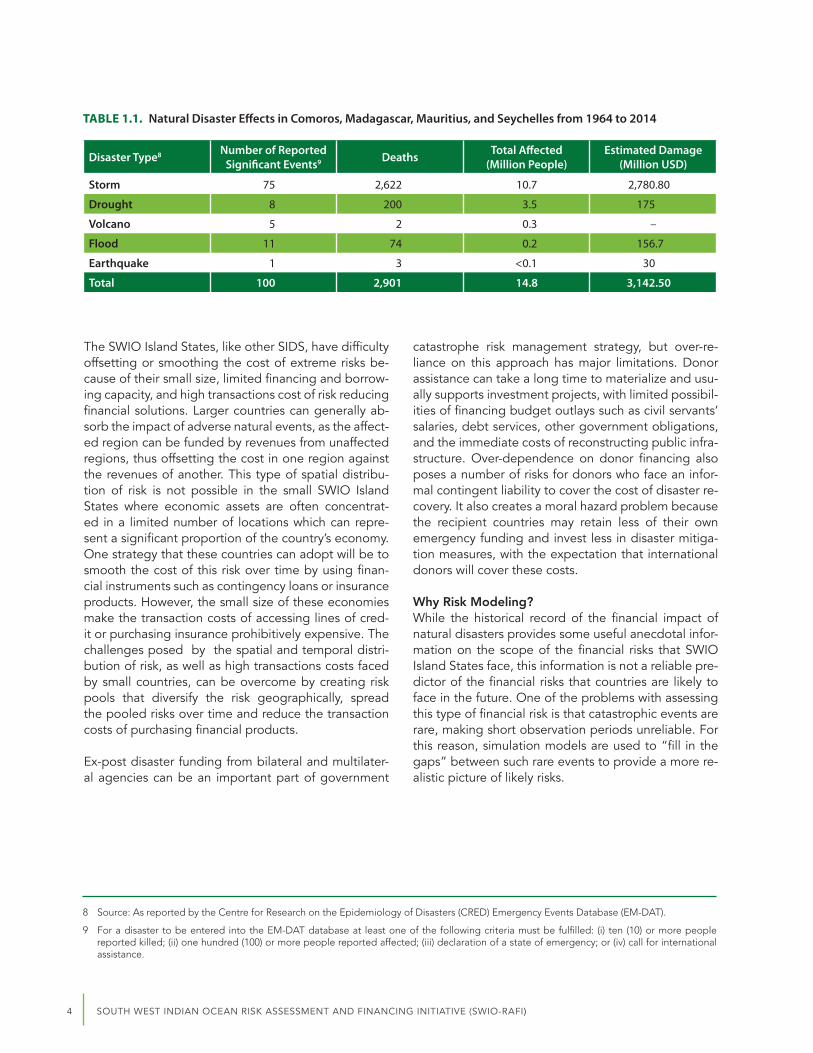
The review of historical catastrophic events in the SWIO region3 revealed that during the 50-year period of 1964–2014, the Comoros, Madagascar, Mauritius and the Seychelles experienced a total of 100 significant adverse nat-ural events4 of which 94 were related to hydro-meteorological phenomena (75 storms; 11 floods; and 8 drought events). This figure does not include low-intensity, high frequency hydro-meteorological events that, with increas-ing frequency, affect the SWIO Island States. The death toll of weather-related disasters during the period was 2,896 people (or 99.8 percent of all lives lost to major natural disasters including earthquakes and other natural hazards), and the affected population was estimated at 14.4 million. In addition, physical damages resulting from weather-related events were estimated at USD 3.1 billion.
The Indian Ocean Commission (IOC) requested technical and financial support from the WBG and other interna-tional development organizations for its efforts to improve the understanding of the region’s disaster risks, as input for the future implementation of disaster risk financing mechanisms. A key expected outcome of the IOC request was the preparation of countries’ disaster risk profiles for tropical cyclone, flood triggered by non-tropical cyclone rainfall, and earthquake hazards; as well as an initial evaluation of their potential fiscal and financial impacts under different scenarios of frequency, intensity, and magnitude.
In response to the IOC’s request, and informed by the successful implementation of the similar initiatives in the Caribbean and the Pacific regions (i.e. CCRIF; and PCRAFI, respectively), the WBG engaged in the implementa-tion of the South West Indian Ocean Catastrophe Risk Assessment and Financing Initiative (SWIO-RAFI). The main goal of SWIO-RAFI was to provide a solid basis for, and to promote the implementation of cost-effective disaster risk financing mechanisms that incorporate an improved understanding of the SWIO Island States’ risk profiles, potential contingent liabilities, and their fiscal situations.
Ongoing disaster risk reduction and resilience building dialogues with the IOC were informed by the outcomes of the SWIO-RAFI initiative and lessons-learned from the CCRIF and PCRAFI. Working with the regional organiza-tion, and SWIO governments, this report seeks to substantially contribute to the dialogue and build an improved understanding of regional and national disaster risks, through providing technical underpinnings to the findings and recommendations, as presented in this summary report.
3 Source: Centre for Research on the Epidemiology of Disasters (CRED) Emergency Events Database (EM-DAT).
4 Duringthesameperiodof1964-2014,sixearthquakes;37floodingevents;onetropicalcyclone,andfournon-tropicalstormswererecordedin the EM-DAT database as having affected the Republic of Tanzania. The information, however, is not disaggregated to the subnational level as to determine whether or not the archipelago of Zanzibar was also affected by any of these events.
Executive Summary

VIII SOUTH WEST INDIAN OCEAN RISK ASSESSMENT AND FINANCING INITIATIVE (SWIO-RAFI)
Key Findings
The main findings of the risk analysis for each participating SWIO Island State are presented below. Additional in-formation on country-specific disaster risk assessments is presented in Chapter 3. The risk analysis revealed that tropical cyclones and extreme non-tropical cyclone rainfall are the main drivers of disaster risk in the participating SWIO Island States.
The increasing trend in the frequency and intensity of extreme weather related events across the entire SWIO re-gion, and the exacerbating effects of climate variability and change, pose additional challenges to the financial and fiscal sustainability of the region’s governments. These governments are confronted with increasing contin-gent liabilities resulting from the potential materialization of external shocks, particularly those triggered by weath-er and climate related hazards. The risk analysis provides the technical underpinnings for developing a regional framework for natural disaster risk financing, as well as comprehensive national disaster risk financing and insur-ance strategies that can help protect the countries’ development and social gains.
SWIO Island States Risk Profiles
The risk profiles presented in Chapter 3 identified Tropical Cyclone wind as the most impactful hazard in the region, particularly for Comoros, Madagascar, and Zanzibar, while earthquake shaking was found to have less loss-causing potential for all countries. The risk profiles provide detailed information of the risks that each Island State faces, but also give an indication of the frequency of events and the associated economic and fiscal losses. The Average Annual Loss (AAL) represents the broadest measure of risk in each country. The combined AAL for the ground-up losses are estimated at 225.8 Million USD, while there is a 2% chance that the region will face di-saster losses up to 1.4 billion USD.
TABLE ES1. Average Annual Loss (AAL). All Modeled Perils (AP) by SWIO Island State
SWIO Island State or Territory
Exceedance Probability:AAL
0.1 0.04 0.02 0.01 0.004 0.002
Mean Return Period (years): 10 25 50 100 250 500
Risk Profile: All Modeled Perils (AP)
Comoros Ground-up Loss (M USD) 5.7 8.4 12.5 18.1 48.4 148 258.7
Emergency Loss (M USD) 1.3 1.9 2.8 4 11.1 34 59.5
Madagascar Ground-up Loss (M USD) 101.9 244.4 446.8 600.9 826.7 1,176.20 1,745.00
Emergency Loss (M USD) 23.3 56 102.6 138.2 189 270.5 401.4
Mauritius Ground-up Loss (M USD) 113.2 145.2 356.8 800.6 1,906.50 3,642.30 5,730.40
Emergency Loss (M USD) 26 33.4 82.1 184.1 438.5 837.7 1,318.00
Seychelles Ground-up Loss (M USD) 2.8 8.6 12.2 14.8 17.9 21 23.4
Emergency Loss (M USD) 0.6 2 2.8 3.4 4.1 4.8 5.4
Zanzibar Emergency Loss (M USD) 2.2 5.7 8.8 11.1 13.8 17.8 26.6
Emergency Loss (M USD) 0.5 1.3 2.0 2.5 3.2 4.0 4.8

IXEXECUTIVE SUMMARY
The total replacement value5 of modeled exposed physical assets in the participating SWIO Island States was es-timated at USD 82 billion. The replacement cost of modeled exposed assets, disaggregated by the total percent-age by sector in each participating SWIO Island State was found to be as follows.
Comoros
In Comoros the risk analysis indicates that, on average, TC and NTC flooding contribute similarly to the financial risk, with an AAL of US 5.7 Million USD. However, infrequent (i.e., higher return period) TC events are expect-ed to generate significantly higher losses than similarly infrequent non-tropical cyclone floods. Both TC and NTC have larger impacts than EQ, which is consistent with historical observations in Comoros and the SWIO region in general.
Madagascar
In Madagascar the risk analysis indicates that TC losses are both more frequent and more severe than losses due to NTC flooding or EQ. The AAL is estimated at 101.9 Million USD. Both TC and NTC have larger impacts than EQ, which is consistent with historical observations in Madagascar and the SWIO region in general. Exposure to normalized losses in Madagascar are lower than many of the other SWIO Island States due to the large size of the island and geographically diverse exposure, which, contrasting with smaller islands, is unlikely to be impacted in its entirety by a single event.
Mauritius
In Mauritius the risk analysis indicates that TC losses are both more frequent and more severe than losses due to NTC flooding or EQ, the estimated AAL of 113.2 Million is substantial. Both TC and NTC have larger impacts than EQ, which is consistent with historical observations on the main island of Mauritius, Rodrigues, and the SWIO re-gion in general. Particularly for TC, the exposure normalized losses in Mauritius tend to be higher than many of the other SWIO Island States due to relatively concentrated exposure, which can be impacted in its entirety by a single event.
FIGURE ES1. Replacement Cost as a Percentage of Modeled Exposed Physical Assets by Sector
0%
Comoros
Madagascar
Mauritius
Seychelles
Zanzibar
50%10% 60%20% 70%30% 80%40% 90% 100%
Residential Commercial Industrial Public Building Infrastructure
5 Replacementvaluereferstotheestimatedcosttorebuildastructureasnew,anddoesnotincludesecondaryfinancialmetrics,suchasdepreciation.

X SOUTH WEST INDIAN OCEAN RISK ASSESSMENT AND FINANCING INITIATIVE (SWIO-RAFI)
Seychelles
In Seychelles the risk analysis indicates that NTC flooding losses are both more frequent and more severe than losses due to TC or EQ, which is consistent with historical observations in Seychelles, leading to an AAL of 2.8 Million USD. Exposure normalized losses in Seychelles are lower than many of the other SWIO Island States due to low probability of significant loss from any peril and the geographically diverse exposure, which is unlikely to be impacted in its entirety by any single event.
Zanzibar
In Zanzibar, the risk analysis indicates that NTC flooding losses are both more frequent and more severe than loss-es due to TC and EQ, the AAL is estimated to be 2.2 Million USD. Infrequent (i.e. higher return period) TC and EQ events have the potential to generate significant losses in Zanzibar, but these events are considered rare.
Country-Level Dialogue, Demand, and the Current State of Risk Financing
At the inception of the SWIO-RAFI Risk Financing project, dialogue related to risk financing was initiated, two countries, Madagascar and Comoros, expressed interest in technical assistance in this area, specifically in the area of gaining a better understanding of current sources of financing for disaster losses.
In Madagascar, an initial review of impacts on the budget from TC Chezda was undertaken; two cyclones and extensive flooding caused considerable damages and losses. It is estimated that the government faced over USD8 million in fiscal revenue losses, while public spending increased by almost USD14 million and an interim re-port was produced which can be used as input to future work. It was also found that the financial capacity of the Government of Madagascar (GoM) to deal with the impacts of disasters remains weak, and relies heavily on finan-cial support from international partners as well as on budget reallocation.
The Status of Risk Pooling in the Region
The principle of risk pooling is used frequently in the management of catastrophe risks, and over the past decade it has been used to establish sovereign catastrophe risk pools, including the Caribbean Catastrophe Risk Financing Facility, the Pacific Catastrophe Risk Financing Facility, and the African Risk Capacity.
In 2014, African Risk Capacity established ARC Insurance Company Limited (ARC Ltd) to manage the risk taken on through underwriting a pool of weather and other disaster risks for the region. Currently seven African coun-tries purchased drought insurance cover from ARC Ltd. During the 2015-2016 ARC formally launched its tropical cyclone product targeting Mozambique, Madagascar, Mauritius and Comoros.
The significant investment made by member countries and donors to establish ARC, combined with the invest-ment ARC made to extend its product range to include cyclone coverage, have created a path to risk pool mem-bership for SWIO Island States.
During the implementation of the SWIO RAFI the WBG established the Africa-wide ADRF Initiative, which is work-ing in parallel on the issues of risk information, financing and insurance. To increase efficiency the SWIO RAFI project activities have been integrated into the ADRF Initiative, which can support specific requests for technical assistance to e.g.: (i) support the development of risk financing strategies at regional, national and local levels to help countries make informed decisions; (ii) improve post disaster financial response capacities and mitigate the socio-economic, fiscal and financial impacts of disasters in countries; and (iii) enhance data sharing and data col-lection efforts at national and sub-national levels.

XIEXECUTIVE SUMMARY
General Recommendations on Risk Financing
Many governments around the world are adopting a strategic approach to risk financing that uses a range of pre-planned, pre-negotiated financial instruments that can help address varied needs and face different hazards. Options available to governments include: (i) contingency/reserve funds to finance relief, rehabilitation, reconstruction and prevention activities for national emergencies (ii) contingent loans, and; (iii) market-based risk transfer solutions.
Combining instruments enables governments to take into account the evolving needs for funds.
The range of instruments offered by the WBG to help countries strengthen financial resilience to disasters has evolved over the past 15 years in response to client demand. Ex Ante Instruments include: Investment Project Financing (IPF); a Development Policy Loan with Catastrophe Deferred Draw-Down Option (Cat-DDO) as a con-tingent line of credit; a Contingent Emergency Response Component with an IPF; the Immediate Response Mechanism to access undisbursed IDA resources; and market-based risk transfer solutions such as weather hedg-es, intermediation services for index-based weather derivatives and Catastrophe bonds. Ex Post Instruments in-clude IDA’s Crisis Response Window; Emergency Response Loans; and Budget support through Development Policy Operations.
FIGURE ES2. Financing Tools for Managing Sovereign Disaster Risk
Insurance of Public Assets
Post-crisis Financing• Emergency Lending Operations• MDB financing
Sovereign Risk Transfer• Insurance (including through risk pools)• Derivatives• Cat bonds
Contigent Emergency Response Components• Sovereign Reserve Funds• Governments Reserves• IDA Crisis Response Window (CRW)
Budget Reallocation
Contigent Financing• IBRD DPL with a CAT-DDO• Hybrid IPF with a contingent financing component• IDB Deferred draw-down option (DDO)• IDB Contingent Credit Facility for Natural Disaster (CCF)• IMF Flexible Credit Line
Contigent Emergency Response Components• IDA Immediate Response Mechanism (IRM) Contingent
Emergency Response Components (CERCs)
HAZARD
TIME
MARKET-BASED INSTRUMENTS
LENDING
CONTINGENCY FUNDS
BUDGETARY INSTRUMENTS
Short-term liquidity Long-term financing needs
High frequency/ Low severity
Low frequency/ High severity
Source: WBG Disaster Risk Finance & Insurance Program, 2017
XII SOUTH WEST INDIAN OCEAN RISK ASSESSMENT AND FINANCING INITIATIVE (SWIO-RAFI)
SWIO-Specific Recommendations to Strengthen Risk Financing
SWIO governments face critical challenges for financial resilience to natural disasters. Most SWIO Island States have restricted options for securing immediate liquidity and are constrained by their size, borrowing capacity, and limited access to international insurance markets. To strengthen fiscal policy, and for the ability to better respond to needs in the event of a disaster, the following recommendations might be considered by SWIO countries, build-ing on the risk modelling work undertaken as part of this project:
• Evaluate feasibility of establishing contingency/reserve funds; • Consider using contingent loans to help strengthen the government’s capacity for disaster risk management
and improve access to liquidity following a shock; • Participate in knowledge sharing and global dialogue on lessons learned from existing sovereign risk pools,
including the African Risk Capacity; • Invest in building insurance markets; • Integrate capacity building on risk financing into work undertaken by Ministries of Finance on related topics,
such as debt management, public financial management, management of contingent liabilities.
Specifically, for Madagascar, where the dialogue in risk financing is more advanced than other SWIO Island States, the areas for potential collaboration are: (i) operationalizing the National Contingency Fund;(ii) establishment of a specific budget line for disaster response; (iii) strengthening the understanding of insurance coverage through the regional risk pool; (iv) identify gaps in the current financing framework and suggest financial solutions.
1CHAPTER 1. GENESIS, OBJECTIVE AND SCOPE OF THE SWIO-RAFI INITIATIVE
CHAPTER 1
Genesis, Objective and Scope of the SWIO-RAFI Initiative
INTRODUCTION
The ISLANDS Project of the IOC was launched in August 2011 and funded by the European Union for EUR 10 million. The project involves the Comoros, Reunion, Madagascar, Mauritius, Seychelles and Zanzibar.
The project’s overall objective was to implement the Mauritius Strategy (MS) 2004-2014 in the Eastern and Southern Africa - Indian Ocean (ESA-IO) region. All United Nations (UN) member countries adopted the strategy following the International Conference on the Sustainable Development of Small Island Developing States (SIDS) held in Mauritius in January 2005. The strategy remains the only global development plan that sets out the basic principles and specific actions needed to support sustainable development at nation-al, regional and international levels.
The Action Plan of the MS places a strong emphasis on the need to develop adequate financial protection mechanisms to guard Island States and their popula-tions against economic and financial losses resulting from disasters. To address this concern, the ISLANDS project includes an important activity component, namely, the “Feasibility study of a financial scheme for risk transfer adapted to the region, and support for the establishment of such a scheme.” A regional platform, the ISLANDS Financial Protection Programme (IFPP), was created to find ways and means to establish this financial scheme.
After ISLANDS made contact with the UNISDR and the WBG in June 2012, the Second Regional Platform
Meeting, held in Mauritius in September 2012, decid-ed to request both international organizations to ini-tiate a joint program to develop risk profiles and risk assessments for the region. The resulting information would then be used to help set up appropriate preven-tion policies as well as a regional system for financial protection against catastrophes. Whereas the UNISDR focused on establishing historic Loss and Damage da-tabases for the participating Island States, the WBG was requested to provide Technical Assistance (TA) in the areas of risk assessment, risk modeling, profiling, and risk financing and insurance.
The SWIO-RAFI worked in partnership with the Ministries of Finance, National Disaster Risk Manage- ment Offices and Insurance sector representatives from the Comoros, Madagascar, Mauritius, Seychelles and Zanzibar, the IOC ISLANDS Project, the UNISDR and the French Development Agency (AFD) in collecting existing hazard and exposure data, including the his-toric loss and damage databases that were produced with the technical support of UNISDR. The project was complemented by a parallel activity,6 which support-ed the establishment, operation and maintenance of geospatial risk information platforms (or complement-ed existing ones). In addition, discussions were initiat-ed with the respective Ministries of Finance in varying degrees and details to explore the demand for techni-cal assistance in disaster risk financing.
The SWIO-RAFI undertook a competitive process to hire an experienced and market-tested risk modelling firm, AIR Worldwide (AIR), to create new hazard, expo-sure and risk data that were used in the development
6 Africa Understanding Risk Financing (P153188).
2 SOUTH WEST INDIAN OCEAN RISK ASSESSMENT AND FINANCING INITIATIVE (SWIO-RAFI)
of risk-related data and risk profiles for the participat-ing Island States.
All geospatial and tabulated results from this analysis are available for each country, and the reports on ex-posure and risk profiles have been used as inputs for this summary report. For communication purposes, the WBG team has produced summary risk profiles high-lighting key results.
OBJECTIVE AND SCOPE
The SWIO-RAFI seeks to improve the understand-ing of disaster risks and risk financing solutions of the participating Indian Ocean States—the Comoros, Madagascar, Mauritius, Seychelles, and the archipela-go of Zanzibar—and provide a solid basis for future implementation of disaster risk financing strategies. Catastrophic phenomena considered in this initiative include tropical cyclones, with their associated wind, precipitation, flooding, and storm surge flooding haz-ards; non-tropical cyclone flooding hazards; as well as earthquakes—with their associated ground shaking and tsunami hazards. In addition, landslide susceptibil-ity was modeled for the Comoros.
The exposure data included residential, commer-cial, industrial, public facilities, including educational, healthcare and emergency facilities; and infrastructure such as roads and highways, airports, ports, and utili-ties. Finally, risk modelling produced annual average loss and probable maximum loss metrics at different return periods for each hazard and exposure type at national levels and to decentralized levels where ap-propriate. The catastrophe risk profiles developed are based on state-of-the-art catastrophe risk modeling using historical records, technical knowledge of these natural phenomena and their likely economic impacts.
The risk profiles can be used to highlight geograph-ic and sector vulnerability, which in turn can be used to prioritize further analysis and subsequently risk re-duction interventions, including flood and storm surge protection.
In addition to capacity building, technical assistance was provided through the GFDRR Labs Team’s Open Data for Resilience Initiative (OpenDRI), in collabora-tion with local consultants, to establish and maintain
geospatial data platforms to make existing datasets available, (or strengthen where data platforms already exist) including those created by the SWIO-RAFI. It is foreseen that the datasets can be used for purpos-es other than risk profiling or disaster risk financing, including sectoral planning to make better informed disaster risk management decisions. Moreover, key datasets can be used in a post disaster situation to more rapidly determine the scale of a disaster and the potential loss in the weeks after an event, comple-menting a Post Disaster Needs Assessment.
In terms of risk financing, Ministries of Finance and other key actors were engaged to get a better under-standing on whether the Island States have any di-saster risk financing strategies in place and what the demand is to further strengthen risk financing in partic-ipating countries.
The following sections present an overview of the outcomes of the catastrophe risk assessment and are based on material produced by AIR for SWIO-RAFI, describing the current knowledge of hazard exposure characteristics, primarily perils, vulnerability of assets and previous related studies. These sections also pro-vide a description of the risk assessment methodology, tools, and data sets.
REGIONAL CONTEXT AND RELEVANCE
The adverse impacts of extreme natural events that strike SIDS can be greater than what might be expect-ed from the experience of similar events striking larg-er countries. Typically, SIDS have little resilience due to their remoteness, limited fiscal space, lack of diversifi-cation, poor access to capital, and limited resilience to natural disasters.
The SWIO region resides in the South-West Indian Ocean tropical cyclone basin, which is located with-in the Southern Hemisphere, between Africa’s east coast and 90°E. The vulnerability of the SWIO Island States to extreme events such as cyclones, floods, earthquakes and tsunamis is exacerbated by the com-mon structural challenges7 faced by SIDS, including a narrow resource base, particularly limited agricultural land; their small domestic markets and distance from export markets and import resources that inhibit their ability to develop economies of scale; high costs for
7 United Nations. 2011. Small Island Developing States. Small Islands Big(ger) Stakes. http://unohrlls.org/custom-content/uploads/2013/08/SIDS-Small-Islands-Bigger-Stakes.pdf.

3CHAPTER 1. GENESIS, OBJECTIVE AND SCOPE OF THE SWIO-RAFI INITIATIVE
energy, infrastructure, transportation, communication and services; low international traffic volumes; as well as fragile natural environments impacted by growing populations.
Tropical Cyclones and Non-Tropical Cyclone RainfallTropical cyclones are the most frequent catastrophic hazard in the SWIO region, and have been responsi-ble for significant historical economic losses and casu-alties, particularly in the Island States of Madagascar and Mauritius. In terms of tropical cyclone formation, the Southwest Indian basin is one of the most active areas in the world. Not only are tropical cyclones more frequent in this ocean basin, but they are also more in-tense than in other parts of the world. On average, 13 tropical cyclones with wind speeds exceeding 63 km/h form here each year. The SWIO has some of the warm-est sea surface temperatures (SST) anywhere and has unique environmental pressure and storm size charac-teristics compared to other basins. High wind speeds, which are inversely related to the central pressure of storms, are a key contributor to damage from tropical cyclones.
The SWIO Island States are exposed to flooding, par-ticularly due to tropical cyclone induced precipitation. In particular, the northeastern portion of Madagascar, frequently experiences high levels of rainfall during storms, and as a result, this region faces frequent flooding. In 2000, Tropical Cyclones Eline and Gloria caused severe flooding in Madagascar. According to Red Cross estimates, the flooding resulted in over 130 deaths, and over 10,000 people lost their homes. Hundreds of thousands more were affected by the storms.
Regular precipitation, or non-tropical cyclone (NTC) rainfall induced flood events are significant throughout the SWIO region. Characterizing NTC flood hazards is particularly important for describing the flooding risk in countries that are rarely subjected to tropical cyclones, such as Zanzibar, Comoros, and Seychelles.
Earthquakes and TsunamisThe SWIO region is located between two highly seis-mic active zones. The SWIO region is part of the African Plate and is bounded, at the West, by the Central Indian Ridge; at the East, by the Nubian Plate through the East-African Ridge; at the North by the Arabian Plate; and at the South, by the Antarctic Plate, via the Southwest Indian Ridge. In this region, earthquakes
represent a frequent natural event, but the major seis-mic sources in the region are distant from any of the Island States in the region. As a consequence, little or no historical economic losses and casualties have been reported in the five nations considered in this study, of which Comoros, Madagascar and Zanzibar are the risk-iest. On average, ten earthquakes of an average mo-ment magnitude of less than or equal to 5.3 occur each year in the SWIO region.
Due to the relatively low intensity of earthquakes in the SWIO region, the risk of tsunamis induced by lo-cal earthquakes is minor. There have been no recorded instances of large tsunamis resulting from earthquakes in the SWIO region. This is because tsunamis are usu-ally the result of high-magnitude subduction zone earthquakes, and the SWIO region does not experi-ence many high magnitude earthquakes or contain any major subduction zones. However, the entire re-gion is at risk of tsunamis generated by subduction zones elsewhere in the Indian Ocean, which are capa-ble of traveling across the ocean (tele-tsunamis). The only historical tele-tsunami event to affect the SWIO region in recent history was the 2004 Indian Ocean tsu-nami. This tele-tsunami triggered by the 2004 Indian Ocean earthquake caused death and destruction in Seychelles, Madagascar, and Mauritius.
Over the past 50 years, SWIO Island States have expe-rienced catastrophic events mostly caused by tropical cyclones (Table 1.1). Tropical Cyclone Gafilo in 2004—one of the most intense tropical cyclones ever record-ed in the South-West Indian Ocean (SSHS Category 5)—was particularly damaging. TC Gafilo killed at least 237 people and had a financial impact of about USD250 million (2004 USD) in Madagascar, making it the most devastating storm to the island country on reliable record. Tropical Cyclone Fantala, hit the Seychelles’ Farquhar Atoll—a major high-end tour-ism destination—in April 2016, completely destroy-ing, with the exception of the cyclone shelter, the land infrastructure, including the Seychelles Coast Guard’s post and telecommunications tower.
In addition to hydro-meteorological events, SWIO na-tions are exposed to earthquakes and tsunamis. For instance, the tsunami triggered by the 2004 Indian Ocean earthquake caused death and destruction in Seychelles, Madagascar, and Mauritius. Nonetheless, adverse hydro-meteorological events remain the pri-mary risk drivers in the SWIO region.
4 SOUTH WEST INDIAN OCEAN RISK ASSESSMENT AND FINANCING INITIATIVE (SWIO-RAFI)
The SWIO Island States, like other SIDS, have difficulty offsetting or smoothing the cost of extreme risks be-cause of their small size, limited financing and borrow-ing capacity, and high transactions cost of risk reducing financial solutions. Larger countries can generally ab-sorb the impact of adverse natural events, as the affect-ed region can be funded by revenues from unaffected regions, thus offsetting the cost in one region against the revenues of another. This type of spatial distribu-tion of risk is not possible in the small SWIO Island States where economic assets are often concentrat-ed in a limited number of locations which can repre-sent a significant proportion of the country’s economy. One strategy that these countries can adopt will be to smooth the cost of this risk over time by using finan-cial instruments such as contingency loans or insurance products. However, the small size of these economies make the transaction costs of accessing lines of cred-it or purchasing insurance prohibitively expensive. The challenges posed by the spatial and temporal distri-bution of risk, as well as high transactions costs faced by small countries, can be overcome by creating risk pools that diversify the risk geographically, spread the pooled risks over time and reduce the transaction costs of purchasing financial products.
Ex-post disaster funding from bilateral and multilater-al agencies can be an important part of government
catastrophe risk management strategy, but over-re-liance on this approach has major limitations. Donor assistance can take a long time to materialize and usu-ally supports investment projects, with limited possibil-ities of financing budget outlays such as civil servants’ salaries, debt services, other government obligations, and the immediate costs of reconstructing public infra-structure. Over-dependence on donor financing also poses a number of risks for donors who face an infor-mal contingent liability to cover the cost of disaster re-covery. It also creates a moral hazard problem because the recipient countries may retain less of their own emergency funding and invest less in disaster mitiga-tion measures, with the expectation that international donors will cover these costs.
Why Risk Modeling?While the historical record of the financial impact of natural disasters provides some useful anecdotal infor-mation on the scope of the financial risks that SWIO Island States face, this information is not a reliable pre-dictor of the financial risks that countries are likely to face in the future. One of the problems with assessing this type of financial risk is that catastrophic events are rare, making short observation periods unreliable. For this reason, simulation models are used to “fill in the gaps” between such rare events to provide a more re-alistic picture of likely risks.
TABLE 1.1. Natural Disaster Effects in Comoros, Madagascar, Mauritius, and Seychelles from 1964 to 2014
Disaster Type8 Number of Reported Significant Events9 Deaths Total Affected
(Million People)Estimated Damage
(Million USD)
Storm 75 2,622 10.7 2,780.80
Drought 8 200 3.5 175
Volcano 5 2 0.3 –
Flood 11 74 0.2 156.7
Earthquake 1 3 <0.1 30
Total 100 2,901 14.8 3,142.50
8 Source: As reported by the Centre for Research on the Epidemiology of Disasters (CRED) Emergency Events Database (EM-DAT).
9 Foradisastertobeentered intotheEM-DATdatabaseat leastoneofthefollowingcriteriamustbefulfilled: (i) ten (10)ormorepeoplereported killed; (ii) one hundred (100) or more people reported affected; (iii) declaration of a state of emergency; or (iv) call for international assistance.

5CHAPTER 2. METHODOLOGY AND VALIDATION
CHAPTER 2
Methodology and Validation
This chapter presents a summary of the methodolo-gy used to develop state-of-the-art, country-specif-ic catastrophe risk models for Comoros, Madagascar, Mauritius, Seychelles and Zanzibar. The AIR methodol-ogy10 is implemented through four modules, logically sequenced to offer a reliable estimate of the poten-tial economic impact of major natural disasters, name-ly: (i) hazard (ii) exposure (iii) vulnerability and (iv) loss modules. Catastrophe risk models have been devel-oped for the following hazards: tropical cyclone (in-cluding wind, storm surge, and precipitation hazards); non-tropical cyclone flooding; and earthquake (includ-ing ground-shaking and earthquake-generate tsunami hazards).
The models are validated using available report-ed data on the intensity of the event—wind speed, peak ground acceleration—and reported direct loss-es. While the catastrophe risk models could be refined further, particularly through an enhanced exposure da-tabase, the validation process shows that the direct losses modeled and those reported show generally consistent patterns.
Hazard Module – includes an assessment of earth-quake, tropical cyclone, and flood hazards using AIR’s proprietary models. These models have the capabili-ty to generate probabilistic estimates of each peril at any location within the region using information on historical events, earthquake faults, precipitation data, land use, topography, soil conditions, etc. The mod-els utilize stochastic event catalogs from thousands of
simulated years and allow for the determination of the probability of exceedance of different levels of hazard intensity at any location within the modeled region.
For the participating SWIO Island States, the hazards are tropical-cyclone-generated winds, ocean surg-es, tropical-cyclone-generated floods, non-tropical floods, earthquake-generated ground shaking and earthquake-generated tsunamis. Historical databas-es of tropical cyclone and earthquake activity, and statistical techniques are used to derive the simulat-ed rates of occurrence of future events in the SWIO region. They are also used to probabilistically model the parameters that characterize these events, (e.g., central pressure for storms, and magnitude for earth-quakes). Empirically-based mathematical relationships are then used to estimate the effects of these events. For storms, the effects are: wind speed in the affected area, storm-induced ocean surge above mean water level, flooding based upon precipitation pattern and the precipitation amount generated by tropical cy-clones of given characteristics. For earthquakes, the ef-fects are based on ground shaking, wind speed, surge height, and precipitation account for factors such as topography, bathymetry, and land use. Ground shak-ing, however, depends on other factors, such as soil type. Wave height, flow velocity, and inundation foot-print depend on bathymetry and topography.
This modeling effort allows possible events to be simu- lated with characteristics that are statistically consis-tent with historical events, but are not identical. In
10 Air Worldwide, Technical Proposal, October 2014; AIR Worldwide, South West Indian Ocean Risk Assessment and Financing Initiative (SWIO-RAFI), Final Report Submitted to the WBG, Component 1 – Hazard, June 1st, 2016; South West Indian Ocean Risk Assessment and Financing Initiative (SWIO-RAFI), Final Report Submitted to the WBG, Component 2 – Exposure, March 18th, 2016; AIR Worldwide, South West Indian Ocean Risk As-sessmentandFinancingInitiative(SWIO-RAFI),DraftReportSubmittedtotheWBG,Component4-RiskProfiles,July29th,2016.

6 SOUTH WEST INDIAN OCEAN RISK ASSESSMENT AND FINANCING INITIATIVE (SWIO-RAFI)
other words, the catalogs of simulated tropical cy-clones and earthquakes contain events that have not been observed, given the limited time window of ob-servation, but can potentially occur. In this study, the catalogs of earthquakes, floods and tropical cyclones contained 10,000 realizations of annual activity. In any given year, any one of the participating SWIO Island States can experience any number of tropical cyclones or events. These catalogs are hereafter loosely referred to as 10,000 year catalogs. The catalogs of simulated events, and the models of their effects, can be used at any site of interest to derive hazard curves for wind, surge, flood, ground-shaking. These curves express the annual probability, at a site, of the different levels of severity that can occur for the following: storm-gen-erated wind speed, surge height, flood depth and ground shaking.
Exposure Module – includes an assessment of the distribution of the built environment (physical charac-teristics and values) that would be impacted by the cat-astrophic events. AIR’s proprietary models applicable for the region include an Industry Exposure Database that contains at-risk assets in the country. This database includes commercial, industrial, and residential expo-sure and classifies buildings by their construction type and occupancy, among other characteristics. Valuations of the exposure are explicitly developed within the Exposure Database. The prioritization of public build-ings and infrastructure requires specific pertinent infor-mation about the buildings, such as location, structural characteristics, valuations, and functionality. The data that are collected include basic information, such as the replacement cost, location, and asset count. It also includes more complex information, such as the per-centage of assets belonging to different construction classes, which in turn may have different types of vul-nerability to storms and earthquakes.
Vulnerability Module – determines the potential phys-ical damage given the information generated in the preceding Hazard and Exposure modules. The vul-nerability assessment module defines the relationship between the intensity of the event (wind speed and in-land and coastal water height for storms, ground shak-ing for earthquakes) and the level of losses for all of the assets that constitute the exposure. In this study, these relationships or Damage Functions (DF) are de-rived for the construction classes. In the DF, the loss-es are quantified in terms of the Damage Ratio (DR),
which represents the repair cost of the damaged item as a fraction of its total replacement cost.
Loss Module – AIR’s proprietary model allows for com-bining the hazard, exposure, and engineering (e.g., damage estimation and mitigation) modules to gener-ate probabilistic estimates of the physical loss to the ex-posure considered in the Exposure Database. Results from the site Hazard Module and the Vulnerability Module are combined to determine the annual mean rate of exceedance curves for losses caused both by single events, and by an aggregation of all events (storms and earthquakes) that may occur during a sin-gle year. The losses considered in this study are the direct (ground-up) losses and the emergency losses. Important metrics can be extracted from these curves, such as the Annual Expected Loss (AEL) and the loss that is expected to occur or be exceeded, on average, once every 10, 25, 50, 100, 250, 500, and 1,000 years.
The four modules mentioned above are integrated into a probabilistic framework. This assessment is necessary because many aspects of a risk analysis are affected by uncertainty. A Monte Carlo simulation procedure is ad-opted to include the main sources of uncertainty.
Hazard Profiles
Hazard intensity profiles were produced for tropical cyclone (TC) wind, TC precipitation flood, TC storm surge flood, non-tropical cyclone (NTC) precipitation flood, and earthquake (EQ) ground shaking for sto-chastic mean return periods of 25, 50, 100, 250, 500, and 1,000 years. The mean return period (MRP) pro-vides only one average perspective of the hazard in-tensity for each peril, and significant uncertainty exists at each MRP.
Tropical CyclonesThe historical record of tropical cyclones in the SWIO region, which is based on information from local meteorological agencies (e.g., RSMC La Reunion, Australian Bureau of Meteorology, BoM; Joint Typhoon Warning Center, JTWC) includes 847 events that took place between the years 1950 and 2014. Parametric statistics derived from the historical catalog, such as annual frequency, landfall frequency, seasonality, genesis location, forward speed, central pressure, and radius of maximum winds, serve as the basis for the stochastic catalog.

7CHAPTER 2. METHODOLOGY AND VALIDATION
Wind HazardAccurate wind speed weather station measurements during tropical cyclone conditions are often chal-lenging to obtain due to power or instrument failure. In the SWIO region, wind speed recordings are both sparse and, when available, often report inconsistent or unrealistic wind speeds, when compared to glob-al agencies. Modeled wind speeds were compared with weather station observations provided by local agencies (e.g., Direction Générale de la Météorologie -MDG, Mauritius Meteorological Services) or ancillary global agencies (e.g., NASA, NOAA). The tropical cy-clone wind speeds for Mauritius and Madagascar were compared using local agency data and NOAA Global Summary of Day (GSOD) readings from automated weather stations.
Precipitation Hazard and FloodingValidating the precipitation and flooding models re-quires reliable spatial and temporal recording of rain-fall and flood depths during tropical cyclone events. The Tropical Rainfall Measuring Mission (TRMM), con-ducted jointly by the National Aeronautics and Space Administration (NASA) and the Japan Aerospace Exploration Agency (JAXA), has been extensively val-idated and is widely used. TRMM data is ideal for de-veloping and calibrating parametric precipitation models, particularly in areas where the coverage of the hydro-meteorological networks is low, as is the case in the SWIO region.
Storm Surge FloodingTropical cyclone-induced surge is an abnormal rise in sea levels accompanying intense storms. During in-tense storms, the wind circulation around the eye of the storm blows against the ocean surface and pro-duces vertical circulation in the ocean. As the storm moves towards the coast, the ocean becomes shallow-er, and, as a result, the vertical circulation of ocean wa-ter is pushed inland.
Since measured storm surge values are not available in the SWIO region, validation of the storm surge model adopted in this study was performed by comparing the AIR model estimates with the model estimates provid-ed by the Global Disaster Alert and Coordinate System (GDACS). The estimated surge heights compare rea-sonably well despite some expected differences be-tween the two models.
Tropical Cyclone Consequence SummaryWhile the historical record includes nearly 850 tropical cyclone events, many of these storms are bypassing or cause little damage. Events are documented in the consequence database when they impact a population center or cause physical damage. These documented events are then further classified as “catastrophic” if; more than 10,000 people are reportedly affected, at least USD10 million in losses are reported, or if 10 or more deaths are reported. The tropical cyclone conse-quence database contains information gathered from publically available sources about the impact of 103 events. The distribution of total events and catastroph-ic events (enclosed in parentheses) are provided in Table 2.1.
TABLE 2.1. Number of Recorded Tropical Cyclone Events for Each SWIO Island Nation, by Decade. Events considered to be “catastrophic” are provided in parentheses.
Decade Comoros Madagascar Mauritius Seychelles Zanzibar
1950–1959 1 (1) 0 (0) 0 (0) 0 (0) 0 (0)
1960–1969 0 (0) 2 (2) 6 (3) 0 (0) 0 (0)
1970–1979 0 (0) 6 (6) 4 (3) 0 (0) 0 (0)
1980–1989 5 (4) 7 (6) 11 (6) 0 (0) 0 (0)
1990–1999 1 (1) 9 (8) 5 (3) 1 (0) 0 (0)
2000–2009 1 (0) 26 (17) 4 (3) 3 (1) 0 (0)
2010–2015 1 (1) 9 (9) 1 (1) 0 (0) 0 (0)
Total 9 (7) 59 (48) 31 (19) 4 (1) 0 (0)
8 SOUTH WEST INDIAN OCEAN RISK ASSESSMENT AND FINANCING INITIATIVE (SWIO-RAFI)
Non-Tropical Cyclone FloodingIn order to generate a stochastic catalog of non-trop-ical cyclone (NTC) rainfall, the TRMM dataset used for the tropical cyclone precipitation model was also used to derive statistics regarding NTC precipitation. Tropical cyclone induced rainfall events that occurred within a radius of 500 km of the central track of each storm were removed from the TRMM dataset. The re-maining dataset was used to develop a stochastic catalog of daily NTC rainfall for 10,000 simulated in-dependent years.
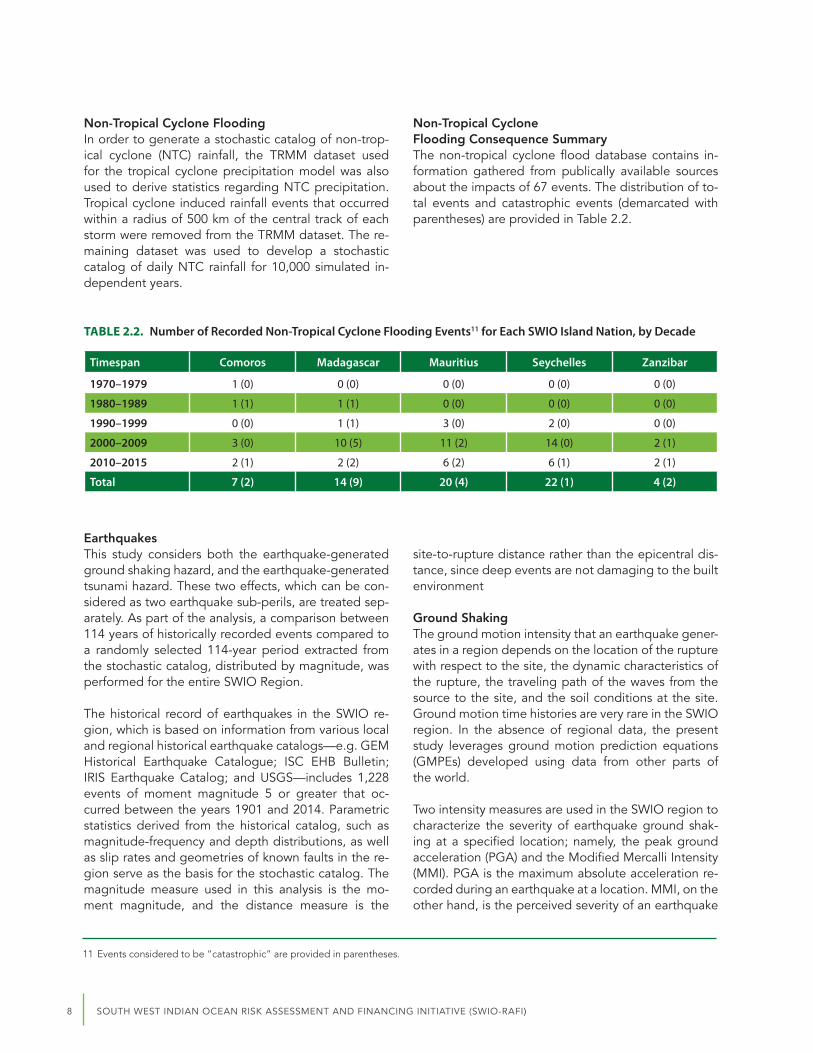
Non-Tropical Cyclone Flooding Consequence SummaryThe non-tropical cyclone flood database contains in-formation gathered from publically available sources about the impacts of 67 events. The distribution of to-tal events and catastrophic events (demarcated with parentheses) are provided in Table 2.2.
TABLE 2.2. Number of Recorded Non-Tropical Cyclone Flooding Events11 for Each SWIO Island Nation, by Decade
Timespan Comoros Madagascar Mauritius Seychelles Zanzibar
1970–1979 1 (0) 0 (0) 0 (0) 0 (0) 0 (0)
1980–1989 1 (1) 1 (1) 0 (0) 0 (0) 0 (0)
1990–1999 0 (0) 1 (1) 3 (0) 2 (0) 0 (0)
2000–2009 3 (0) 10 (5) 11 (2) 14 (0) 2 (1)
2010–2015 2 (1) 2 (2) 6 (2) 6 (1) 2 (1)
Total 7 (2) 14 (9) 20 (4) 22 (1) 4 (2)
EarthquakesThis study considers both the earthquake-generated ground shaking hazard, and the earthquake-generated tsunami hazard. These two effects, which can be con-sidered as two earthquake sub-perils, are treated sep-arately. As part of the analysis, a comparison between 114 years of historically recorded events compared to a randomly selected 114-year period extracted from the stochastic catalog, distributed by magnitude, was performed for the entire SWIO Region.
The historical record of earthquakes in the SWIO re-gion, which is based on information from various local and regional historical earthquake catalogs—e.g. GEM Historical Earthquake Catalogue; ISC EHB Bulletin; IRIS Earthquake Catalog; and USGS—includes 1,228 events of moment magnitude 5 or greater that oc-curred between the years 1901 and 2014. Parametric statistics derived from the historical catalog, such as magnitude-frequency and depth distributions, as well as slip rates and geometries of known faults in the re-gion serve as the basis for the stochastic catalog. The magnitude measure used in this analysis is the mo-ment magnitude, and the distance measure is the
site-to-rupture distance rather than the epicentral dis-tance, since deep events are not damaging to the built environment
Ground ShakingThe ground motion intensity that an earthquake gener-ates in a region depends on the location of the rupture with respect to the site, the dynamic characteristics of the rupture, the traveling path of the waves from the source to the site, and the soil conditions at the site. Ground motion time histories are very rare in the SWIO region. In the absence of regional data, the present study leverages ground motion prediction equations (GMPEs) developed using data from other parts of the world.
Two intensity measures are used in the SWIO region to characterize the severity of earthquake ground shak-ing at a specified location; namely, the peak ground acceleration (PGA) and the Modified Mercalli Intensity (MMI). PGA is the maximum absolute acceleration re-corded during an earthquake at a location. MMI, on the other hand, is the perceived severity of an earthquake
11 Events considered to be “catastrophic” are provided in parentheses.

9CHAPTER 2. METHODOLOGY AND VALIDATION
and is based on human judgement and the observed post-event damage.
The SWIO region has minimal strong motion data re-sulting from the low seismicity and scarcity of instru-mentation in the region. This deficit of data creates a challenge to validating the model’s ground motion prediction equations (GMPEs). The ground motions in the SWIO earthquake model are calculated under the generally tenable assumption that the attenuation of seismic waves in different regions of the world, with the same tectonic setting, is very similar. Fortunately, the SWIO countries have similar tectonic characteris-tic to countries in the Southeast Asia region. The AIR Earthquake Model for the SWIO region uses GMPEs similar to those applied for the AIR’s Earthquake mod-el in Southeast Asia.
TsunamiModels of theoretical events from the AIR Southeast Asia Earthquake catalog were implemented in the ComMIT modeling platform, developed by NOAA, to produce “worst-case” tele-tsunami risk maps for each of the major SWIO islands. The earthquake and tsuna-mi database contains information gathered from publi-cally available sources about the impacts of 22 events. Between 1883 and 2015, Comoros is the only country to experience significant ground shaking intensity, with minor events recorded in Madagascar and Mauritius.
Other Hazards
LandslidesThe landslide susceptibility of a region is generally de-fined as the probability of a landslide occurrence, which
may be based on empirical or modeled information. When the conditions that promote slope instability are identified, it may be possible to give a qualitative or a semi-quantitative measure about the landslide sus-ceptibility for the area under consideration. This ap-proach to landslide susceptibility zonation implicitly assumes that future slope failures will occur with simi-lar probability and under the same conditions that led to past and present soil instabilities. However, the geo-morphological factors which generate landslides for a particular area may vary over time, and the resulting zonation maps should be interpreted with care.
Landslide susceptibility zonation maps have been gen-erated for the three islands of Comoros and indicate areas of high, medium, and low susceptibility. The landslide susceptibility zonation maps categorize the area of the three islands as approximately 4% high sus-ceptibility, 40% medium susceptibility, and 56% low susceptibility.
Exposure AssessmentThe exposure databases for residential, commercial, industrial, and government assets represent the built environment of each island nation and provide nationally appropriate replacement values,12 construc- tion characteristics, and occupancy classes. The ex- posure database13 for each island nation is constructed by combining information from sources such as government censuses, local agencies, satellite imagery, publically available spatial statistics, and previous regional studies.
The total replacement value of structures for each is-land nation is provided in Table 2.3.
12Replacement value refers to theestimatedcost to rebuilda structureasnew, anddoesnot include secondaryfinancialmetrics, suchas depreciation.
13 The exposure database does not include the value of building contents or business interruption.
TABLE 2.3. Total Replacement Value of Residential/Non-Residential Assets by Island Nation (2015 Million USD)
Island Nation Residential (M USD) Non-Residential (M USD) Total (M USD)
Comoros 1,711 869 2,580
Madagascar 19,576 15,220 34,796
Mauritius 13,574 19,886 33,460
Seychelles 3,368 3,557 6,925
Zanzibar 3,170 1,128 4,298
SWIO Region 41,398 40,661 82,059
10 SOUTH WEST INDIAN OCEAN RISK ASSESSMENT AND FINANCING INITIATIVE (SWIO-RAFI)
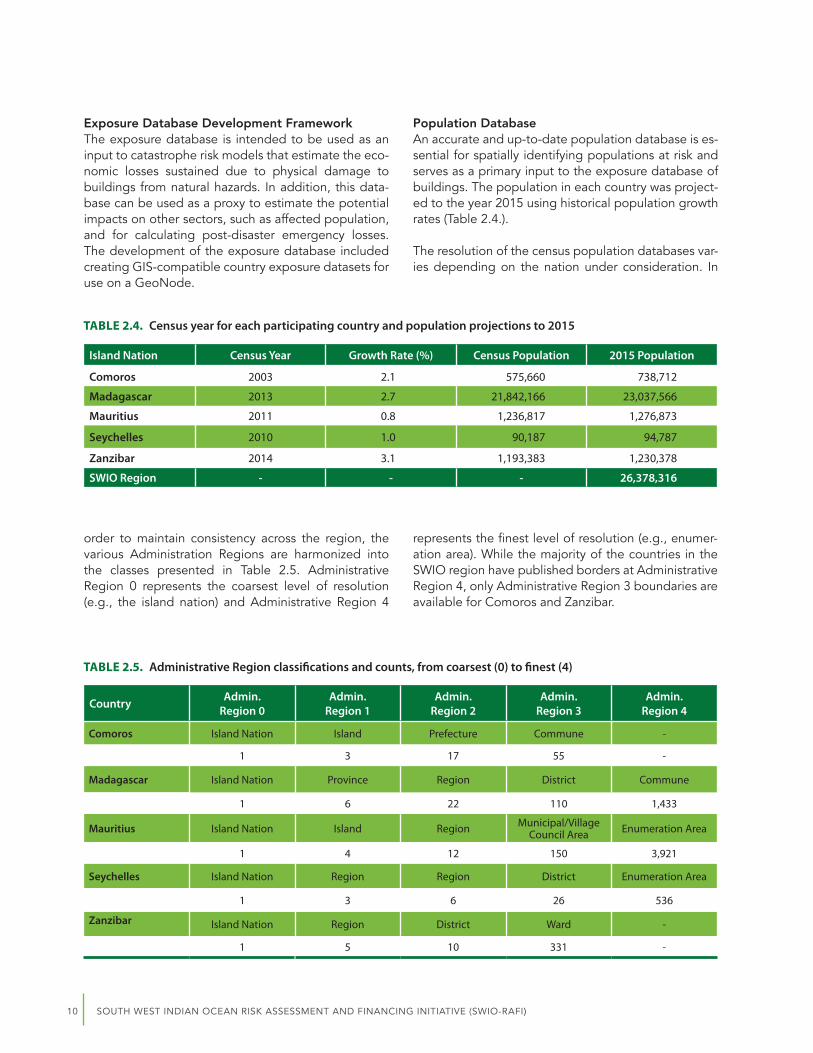
Exposure Database Development FrameworkThe exposure database is intended to be used as an input to catastrophe risk models that estimate the eco-nomic losses sustained due to physical damage to buildings from natural hazards. In addition, this data-base can be used as a proxy to estimate the potential impacts on other sectors, such as affected population, and for calculating post-disaster emergency losses. The development of the exposure database included creating GIS-compatible country exposure datasets for use on a GeoNode.
Population DatabaseAn accurate and up-to-date population database is es-sential for spatially identifying populations at risk and serves as a primary input to the exposure database of buildings. The population in each country was project-ed to the year 2015 using historical population growth rates (Table 2.4.).
The resolution of the census population databases var-ies depending on the nation under consideration. In
TABLE 2.4. Census year for each participating country and population projections to 2015
TABLE 2.5. Administrative Region classifications and counts, from coarsest (0) to finest (4)
Island Nation Census Year Growth Rate (%) Census Population 2015 Population
Comoros 2003 2.1 575,660 738,712
Madagascar 2013 2.7 21,842,166 23,037,566
Mauritius 2011 0.8 1,236,817 1,276,873
Seychelles 2010 1.0 90,187 94,787
Zanzibar 2014 3.1 1,193,383 1,230,378
SWIO Region - - - 26,378,316
Country Admin.Region 0
Admin.Region 1
Admin.Region 2
Admin.Region 3
Admin.Region 4
Comoros Island Nation Island Prefecture Commune -
1 3 17 55 -
Madagascar Island Nation Province Region District Commune
1 6 22 110 1,433
Mauritius Island Nation Island Region Municipal/Village Council Area Enumeration Area
1 4 12 150 3,921
Seychelles Island Nation Region Region District Enumeration Area
1 3 6 26 536
Zanzibar Island Nation Region District Ward -
1 5 10 331 -
order to maintain consistency across the region, the various Administration Regions are harmonized into the classes presented in Table 2.5. Administrative Region 0 represents the coarsest level of resolution (e.g., the island nation) and Administrative Region 4
represents the finest level of resolution (e.g., enumer-ation area). While the majority of the countries in the SWIO region have published borders at Administrative Region 4, only Administrative Region 3 boundaries are available for Comoros and Zanzibar.
11CHAPTER 2. METHODOLOGY AND VALIDATION
Developing the Exposure Database of BuildingsAIR leverages information and data from sources such as official censuses, local agencies, publically available reports, and academic papers to derive risk counts (e.g., number of dwellings) and associated statistics (e.g. percentage of dwellings by occupancy and con-struction type). Additional information obtained from census and ancillary datasets pertaining to the phys-ical characteristics of the risks is used in conjunction with construction cost estimates to derive the replace-ment values. While certain agencies in Mauritius and Seychelles maintain detailed regional construction and building-use statistics, in general, the availability of high-quality exposure data throughout the SWIO re-gion is quite limited.
Occupancy and Construction TypesOccupancy, in the context of the exposure database and subsequent risk profiles, refers to the primary use of a building or asset. Occupancy is an essential com-ponent to consider for assessing the replacement value of an asset and its vulnerability to natural catastrophes. The occupancy classes considered in the SWIO expo-sure database include residential, commercial, gen-eral industrial, public, and infrastructure assets. The residential occupancies consist of single-family and multi-family dwellings. The residential occupancy class also includes traditional or rural housing. The com-mercial and industrial occupancies consist of non-in-frastructure commercial and general industrial assets (e.g., hotels, office buildings, manufacturing buildings, warehouses). The public occupancy class consists of education facilities, public services, healthcare facili-ties, government buildings, and religious institutions. Lastly, the infrastructure occupancy class consists of roads, bridges, transportation facilities (e.g., airports, ports), water utilities, and energy utilities.
Similar to occupancy, risk attributes, such as construc-tion type and height, are key components for assess-ing the value and vulnerability of assets in the exposure database. In classifying the building stock, buildings are grouped according to their main structural char-acteristics, namely construction material, load resisting mechanism, and height.
Replacement ValuesFollowing the derivation of risk locations and their re-spective attributes, a replacement or rebuild cost ap-proach is used to generate building replacement values by occupancy and construction type. Urban and rural designations that incorporate the regional build-ing size and cost of construction are used to further differentiate regional construction costs within each island nation. Occupancy, construction, and cost sta-tistics are typically dependent on the urbanization cat-egory. The relationship between cost and urbanization category is considered in the exposure database by (i) using a higher unit replacement cost for occupancy classes that are more likely to exist in urban areas and (ii) employing a GDP based spatial cost adjustment fac-tor that accounts for regional variation in urbanization.
Validating the Industry Exposure DatabaseRecent collaborations between UNISDR and IOC-ISLANDS project have yielded the most comprehen-sive risk profiles in region to date. These multi-hazard studies consider earthquake and tropical cyclone risk in each of the SWIO Island States, and leverage a data-base of regional urban capital stock developed for the UNISDR’s 2015 Global Assessment Report (GAR). For validation, the AIR SWIO exposure database was resa-mpled and compared to the GAR urban capital stock. A quantitative comparison at each grid point demon-strates statistically significant correlation and generally good agreement between the datasets for each mod-eled country and the SWIO region in its entirety.

12 SOUTH WEST INDIAN OCEAN RISK ASSESSMENT AND FINANCING INITIATIVE (SWIO-RAFI)
Summary of the Exposure DatabaseThe total replacement value of modeled buildings in the SWIO region is approximately USD 82 billion.14
Loss EstimatesThis section describes the development of the finan-cial loss models and generation of risk-profiles for each participating SWIO Island State, including an overview of the financial loss modeling framework, loss valida-tion exhibits, and risk profiles for each Island State. The financial loss model requires an engineering relation-ship between hazard intensities and damage estimates for the considered exposure. To this end, regional dam-age, or vulnerability functions for the construction and occupancy types most commonly found in the SWIO region have been developed. These functions are in-tegrated with the hazard and exposure developed in Hazard and Exposure modules, respectively, in order to calculate expected financial losses for each mod-eled peril.
AIR generates statistical distributions of ground-up losses using the modeled loss for each event in the stochastic hazard catalogs. These probabilistic results are then used to calculate meaningful loss metrics, such as Average Annual Loss (AAL), loss Exceedance Probabilities (EP), and losses at specific Mean Return
Periods (MRP). Each island nation risk profile contains ground-up financial losses aggregated to three admin-istrative levels: Admin Region 0 (i.e., national), Admin Region 1 (i.e., islands, regions), and Admin Region 2 (i.e., provinces, districts). The risk profiles include AAL distributions by sector, peril, and Admin Region 2 and national total and emergency loss exceedance proba-bilities. The risk profile data-files are the primary out-puts of this assessment and are provided as a digital addendum to this report.
Historical Financial LossesAIR financial loss modules are compared with any losses reported following major historical catastrophic events. National governments, local agencies, insurers, NGOs, or foreign aid groups typically report losses. Reported losses for the SWIO region are collected and collat-ed into a Consequence Database, which comprises all publically reported historical natural catastrophe losses from sources such as DesInventar, ReliefWeb, EM-DAT, and PDNAs, among others.
14 The replacement values presented in Table 2.6 include structure value only.
TABLE 2.6. SWIO Exposure Summary Statistics
Island Nation Comoros Madagascar Mauritius Seychelles Zanzibar
Capital Moroni Antananarivo Port Louis Victoria Zanzibar City
GDP (2013, USD Billion) 0.62 10.61 11.94 1.45 1.16
GDP per Capita (USD) 846 463 9,593 15,565 848
GDP (PPP, USD) 1.1 32.41 22.3 2.3 117.66
Total Population 738,712 23,037,566 1,276,873 94,787 1,230,378
Urban Population 58% 22% 70% 40% 70%
Exposure Vintage 2015 2015 2015 2015 2015
Replacement Value (2015, USD M)
Residential 1,710.8 19,575.7 13,573.6 3,368.0 3,169.6
Commercial 138.3 3,865.5 6,649.2 2,112.0 484.6
Industrial 22.2 2,491.2 3,208.0 270.0 54.7
Public 271.0 3,564.7 1,441.7 298.0 88.6
Infrastructure 437.7 5,298.5 8,587.4 877.3 500.2
Total 2,580.0 34,795.7 33,460.0 6,925.3 4,297.8
13CHAPTER 2. METHODOLOGY AND VALIDATION
Overall, the reported loss history for the SWIO region is considered incomplete, as reliable loss estimates have not been captured for all events in the historical re-cord. Nonetheless, the historical reported losses sug-gest that tropical cyclones and flooding are dominant perils in the SWIO region and demonstrate that these perils are responsible for the majority of natural ca-tastrophe induced loss of life and economic damage.
Financial Loss ValidationFor major historical events, losses are generated using the hazard and financial loss modules with historical event parameters. The historical economic loss record in the SWIO region is limited and the most represent-ed peril is the tropical cyclone. Thus, the majority of loss calibration and comparison is performed using re-ports for tropical cyclones.
Reported Loss ValidationThe SWIO financial loss model outputs correlate well with historical reports of tropical cyclone losses in Comoros, Madagascar, and Mauritius and do not in-dicate an appreciable high or low bias in the mod-el. Modeled loss variability results from uncertainty in the exposure data, event parameters, physical mod-el properties, hazard intensity calculation, and vul-nerability functions. The absence of any high or low bias in the calculated mean historical losses suggest that the country-level losses for stochastic events are
representative of potential future losses for each par-ticipating island nation.
Comparison to Third-Party StudiesDue to the limited availability of loss data and, particu-larly in the case of earthquakes, loss-causing events; a loss validation exercise was performed using data from the recent UNISDR study in the SWIO region (UNISDR, 2015). This study investigated tropical cyclone wind and earthquake ground shaking perils in each of the participating SWIO Island States. While the UNISDR analysis employs generic damage functions and a sim-plified historical hazard catalog, the study represents the most comprehensive historical loss assessment to date in the SWIO region.
Exposure-normalized losses—which represent the per- centage of the modeled exposure value that is dam-aged in an event—are useful for comparing loss esti-mates calculated using different exposures. In general, the results of the AIR investigation compare favor-ably with the UNISDR study, particularly on the basis of AAL, which represents the broadest measure of risk in each country. Both studies identify TC wind as the most impactful hazard in the region, particularly for Comoros, Madagascar, and Zanzibar, while EQ shak-ing is determined to have less loss-causing potential for all countries.
14 SOUTH WEST INDIAN OCEAN RISK ASSESSMENT AND FINANCING INITIATIVE (SWIO-RAFI)
CHAPTER 3
Country-specific Catastrophe Risk Profiles
Risk Profiles15 The risk profiles presented here are derived from cal-culated ground-up losses resulting from direct dam-age to buildings and infrastructure assets caused by stochastically generated events. The ground-up losses comprise the cost of repairing or replacing the dam-aged assets, but do not include other losses, such as building contents, agriculture, and business interrup-tion, or policy terms, such as limits and deductibles. The modeled losses for tropical cyclones include losses caused by wind, flooding due to excess precipitation, and storm surge. The modeled losses for non-tropi-cal cyclone precipitation are caused by flooding due to excess precipitation. The modeled losses for earth-quakes are caused by ground shaking.
The regional tsunami model and the landslide model for Comoros are deterministic, which make them un-suitable for use in the financial loss module and are not included in the risk-profiles.
After modeling the cost of repairing or rebuilding the damaged assets due to the impact of all stochastic events, it is then possible to estimate the likelihood,
or exceedance probability (EP), and severity of loss-es for potential future catastrophes. The total losses for any potential future event are equal to the sum of the losses at all locations affected by each event. AAL are calculated by averaging all losses incurred in the 10,000-year stochastic catalog, which represents 10,000 independent realizations of the loss potential in a given year.16
Emergency losses are provided in addition to ground-up losses and represent losses associated with imme-diate relief activities, such as emergency food, medical care, transportation, temporary shelter, debris remov-al, etc., that the government can expect to incur fol-lowing a catastrophic event. These emergency losses are, in addition to the direct losses, generated by the event. Based on historical data, emergency losses are considered to be log-normally distributed with a mean of 16% of the total ground-up losses for earth-quakes and 23% of the total ground-up losses for oth-er perils. These mean values are employed to estimate emergency losses from total ground-up losses in the risk-profiles presented below.
15 This chapter is a summary of the material produced by AIR for the SWIO-RAFI: South –West Indian Ocean Risk Assessment and Financing Initiative(SWIO-RAFI):Component4–RiskProfiles,DraftReportSubmittedtotheWBG,July29th,2016.
16Notethatexceedanceprobabilitymetricsarenotadditiveacrossindividualriskprofilesfordifferentperils.Asaresult,theriskprofilesfortropicalcyclone,non-tropicalcycloneflooding,andearthquakeshownbelowwillnotaddtothelossesshownforallperilsatthesamereturnperiod.
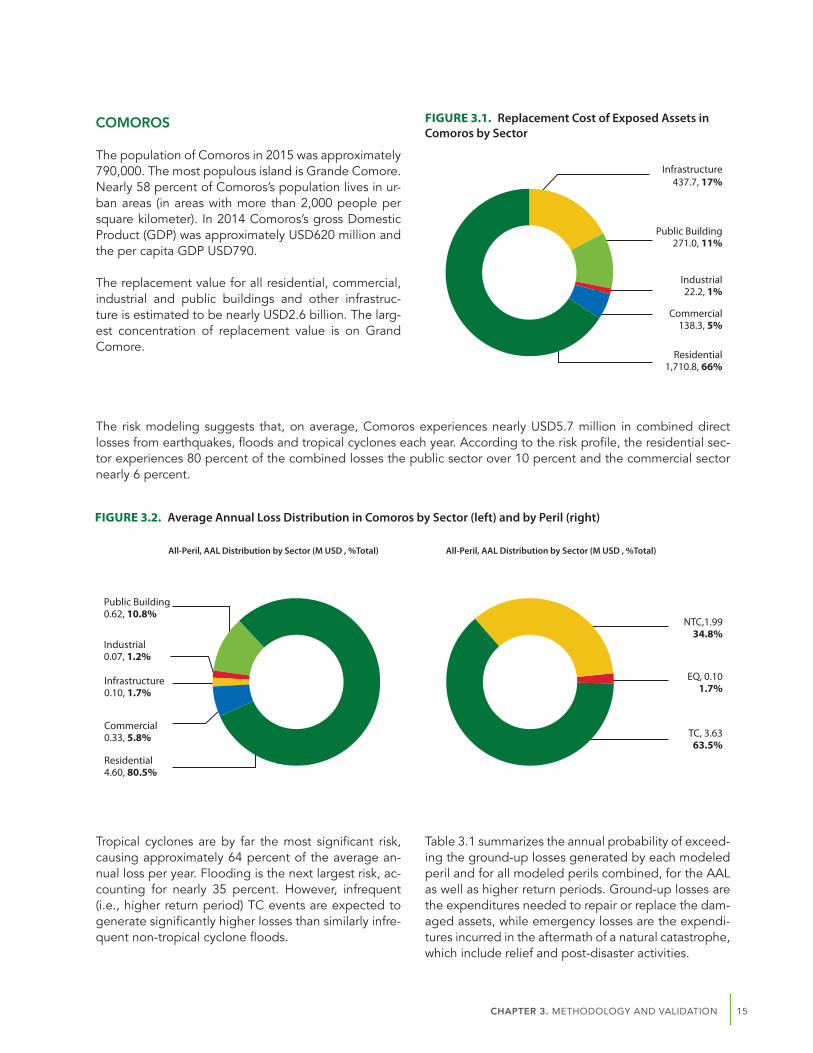
15CHAPTER 3. METHODOLOGY AND VALIDATION
COMOROS
The population of Comoros in 2015 was approximately 790,000. The most populous island is Grande Comore. Nearly 58 percent of Comoros’s population lives in ur-ban areas (in areas with more than 2,000 people per square kilometer). In 2014 Comoros’s gross Domestic Product (GDP) was approximately USD620 million and the per capita GDP USD790.
The replacement value for all residential, commercial, industrial and public buildings and other infrastruc-ture is estimated to be nearly USD2.6 billion. The larg-est concentration of replacement value is on Grand Comore.
The risk modeling suggests that, on average, Comoros experiences nearly USD5.7 million in combined direct losses from earthquakes, floods and tropical cyclones each year. According to the risk profile, the residential sec-tor experiences 80 percent of the combined losses the public sector over 10 percent and the commercial sector nearly 6 percent.
FIGURE 3.2. Average Annual Loss Distribution in Comoros by Sector (left) and by Peril (right)
FIGURE 3.1. Replacement Cost of Exposed Assets in Comoros by Sector
Tropical cyclones are by far the most significant risk, causing approximately 64 percent of the average an-nual loss per year. Flooding is the next largest risk, ac-counting for nearly 35 percent. However, infrequent (i.e., higher return period) TC events are expected to generate significantly higher losses than similarly infre-quent non-tropical cyclone floods.
Table 3.1 summarizes the annual probability of exceed-ing the ground-up losses generated by each modeled peril and for all modeled perils combined, for the AAL as well as higher return periods. Ground-up losses are the expenditures needed to repair or replace the dam-aged assets, while emergency losses are the expendi-tures incurred in the aftermath of a natural catastrophe, which include relief and post-disaster activities.
All-Peril, AAL Distribution by Sector (M USD , %Total) All-Peril, AAL Distribution by Sector (M USD , %Total)
Infrastructure 437.7, 17%
Public Building 271.0, 11%
EQ, 0.10 1.7%
TC, 3.63 63.5%
NTC,1.99 34.8%
Industrial 22.2, 1%
Commercial 138.3, 5%
Residential 1,710.8, 66%
Residential 4.60, 80.5%
Commercial 0.33, 5.8%
Infrastructure 0.10, 1.7%
Public Building 0.62, 10.8%
Industrial 0.07, 1.2%

16 SOUTH WEST INDIAN OCEAN RISK ASSESSMENT AND FINANCING INITIATIVE (SWIO-RAFI)
TABLE 3.1. Natural Catastrophe Risk Profile for Comoros
Exceedance Probability:AAL
0.1 0.04 0.02 0.01 0.004 0.002
Mean Return Period (years): 10 25 50 100 250 500
Risk Profile: All Modeled Perils (AP)
Ground-up Loss (M USD) 5.7 8.4 12.5 18.1 48.4 148.0 258.7
(% Total Exposure Value) 0.2% 0.3% 0.5% 0.7% 1.9% 5.7% 10.0%
Emergency Loss (M USD) 1.3 1.9 2.8 4.0 11.1 34.0 59.5
Risk Profile: Tropical Cyclone (TC)
Ground-up Loss (M USD) 3.6 4.8 8.6 13.7 43.0 147.6 258.2
(% Total Exposure Value) 0.1% 0.2% 0.3% 0.5% 1.7% 5.7% 10.0%
Emergency Loss (M USD) 30,640.7 0.0 2.0 3.1 9.9 33.9 59.4
Risk Profile: Non-Tropical Cyclone Flood (NTC)
Ground-up Loss (M USD) 2.0 4.8 6.8 8.4 10.0 11.5 12.4
(% Total Exposure Value) 0.1% 0.2% 0.3% 0.3% 0.4% 0.4% 0.5%
Emergency Loss (M USD) 0.5 1.1 1.6 1.9 2.3 2.7 2.9
Risk Profile: Earthquake (EQ)
Ground-up Loss (M USD) 0.1 0.0 0.0 0.1 1.8 7.0 11.2
(% Total Exposure Value) <0.1% <0.1% <0.1% <0.1% <0.1% 0.3% 0.4%
Emergency Loss (M USD) 0.0 0.0 0.0 0.0 0.3 1.1 1.8
The analysis also shows that a specific event, such as a severe tropical cyclone can produce significant losses. For example, results suggest that a 100-year return period tropical cyclone event could produce direct losses of USD43 million, equivalent to 75 of the 2014 GDP, and require approximately USD9.9 million in emergency costs.
The highest losses take place in Anjouan, which ex-periences nearly 80% of the AAL for the three perils combined, In addition to the direct losses, an annu-al average of nearly USD1.3 million is estimated for emergency costs.
It is important to note that an important risk on Grand Comore, the Khartala volcano, was not included in this analysis.
FIGURE 3.3. Spatial Distribution of AAL for Comoros from All Perils Combined

17CHAPTER 3. METHODOLOGY AND VALIDATION
MADAGASCAR
Madagascar’s population in 2015 was approximate-ly 23 million. The most populous regions are around Antananarivo and the coastline. Nearly 22 percent of the population lives in metropolitan areas (exceeding 2,000 people per square kilometer) and slightly more than 76 percent in rural areas (fewer than 1,600 peo-ple per square kilometer). In 2015 the GDP was ap-proximately USD10.3 billion and the per capita GDP USD420.
The estimated total replacement value for all residen-tial, commercial, industrial and public buildings and other infrastructure is estimated to be nearly USD356 billion. The largest concentration of replacement value is in the Antananarivo region.
The residential sector accounts for over 55 percent of the total replacement value. In terms of construction type, buildings with concrete and masonry walls account for nearly 62 percent of the total replacement value.
Madagascar experiences on average over USD100 million in combined direct losses from earthquakes, floods and tropical cyclones each year. According to the risk profile the residential sector experiences 75, the commercial sec-tor 9 percent and the public sector 8 percent.
FIGURE 3.5. Average Annual Loss Distribution in Madagascar by Sector (left) and by Peril (right)
FIGURE 3.4. Replacement Cost of Exposed Assets in Madagascar by Sector
All-Peril, AAL Distribution by Sector (M USD , %Total) All-Peril, AAL Distribution by Sector (M USD , %Total)
Tropical cyclones are by far the most significant risk, causing approximately 85 percent of the average an-nual loss per year. Flooding is the next largest risk, ac-counting for nearly 13 percent. However, infrequent (i.e., higher return period) TC events are expected to generate significantly higher losses than similarly infre-quent non-tropical cyclone floods.
Table 3.2 summarizes the annual probability of exceed-ing the ground-up losses generated by each modeled peril and for all modeled perils combined, for the AAL as well as higher return periods. Ground-up losses are the expenditures needed to repair or replace the dam-aged assets, while emergency losses are the expendi-tures incurred in the aftermath of a natural catastrophe, which include relief and post-disaster activities.
Infrastructure 5,298.5, 15%
Public Building 3,564.7, 10%
Industrial 2,491.2, 7%
Commercial 3,865.5, 11%
Residential 19,575.7, 57%
Residential 76.12, 74.7%
Commercial 8.92, 8.8%
Infrastructure 2.42, 2.4%
Public Building 8.28, 8.1%
Industrial 6.10, 6.0%
EQ, 1.26 1.2%
TC, 87.14 85.6%
NTC,13.45 13.2%

18 SOUTH WEST INDIAN OCEAN RISK ASSESSMENT AND FINANCING INITIATIVE (SWIO-RAFI)
TABLE 3.2. Natural Catastrophe Risk Profile for Madagascar
Exceedance Probability:AAL
0.1 0.04 0.02 0.01 0.004 0.002
Mean Return Period (years): 10 25 50 100 250 500
Risk Profile: All Modeled Perils (AP)
Ground-up Loss (M USD) 101.9 244.4 446.8 600.9 826.7 1,176.2 1,745.0
(% Total Exposure Value) 0.3% 0.7% 1.3% 1.7% 2.4% 3.4% 5.0%
Emergency Loss (M USD) 23.3 56.0 102.6 138.2 189.0 270.5 401.4
Risk Profile: Tropical Cyclone (TC)
Ground-up Loss (M USD) 87.1 224.0 433.0 585.0 813.0 1,150.0 1,740.0
(% Total Exposure Value) 0.3% 0.6% 1.2% 1.7% 2.3% 3.3% 5.0%
Emergency Loss (M USD) 20.0 51.5 99.6 135.0 187.0 265.0 401.0
Risk Profile: NTC Flood (NTC)
Ground-up Loss (M USD) 13.4 31.4 58.7 83.0 115.8 146.3 170.2
(% Total Exposure Value) <0.1% <0.1% 0.2% 0.2% 0.3% 0.4% 0.5%
Emergency Loss (M USD) 3.1 7.2 13.5 19.1 26.6 33.6 39.1
Risk Profile: Earthquake (EQ)
Ground-up Loss (M USD) 1.3 1.0 3.5 7.4 14.6 35.2 134.0
(% Total Exposure Value) <0.1% <0.1% <0.1% <0.1% <0.1% 0.1% 0.4%
Emergency Loss (M USD) 0.2 0.2 0.6 1.2 2.3 5.6 21.5
This analysis also shows that a specific event, such as a severe tropical cyclone can produce significant losses. For example, results suggest that a 100-year return pe-riod tropical cyclone event could produce direct loss-es of USD813 million, equivalent to 8 percent of the 2015 GDP, and require approximately USD187 million in emergency costs.
Exposure to normalized losses in Madagascar are low-er than many of the other SWIO Island States due to the large size of the island and geographically diverse exposure, which, contrasting with smaller islands, is unlikely to be impacted in its entirety by a single event.
The highest losses take place in Diana, which experi-ences nearly 30% of the AAL for the three perils com-bined, followed by Atsinanana. In addition to the direct losses, an annual average of nearly USD23 mil-lion is estimated for emergency costs for the Diana region alone.
FIGURE 3.6. Spatial Distribution of AAL for Madagascar from All Perils Combined
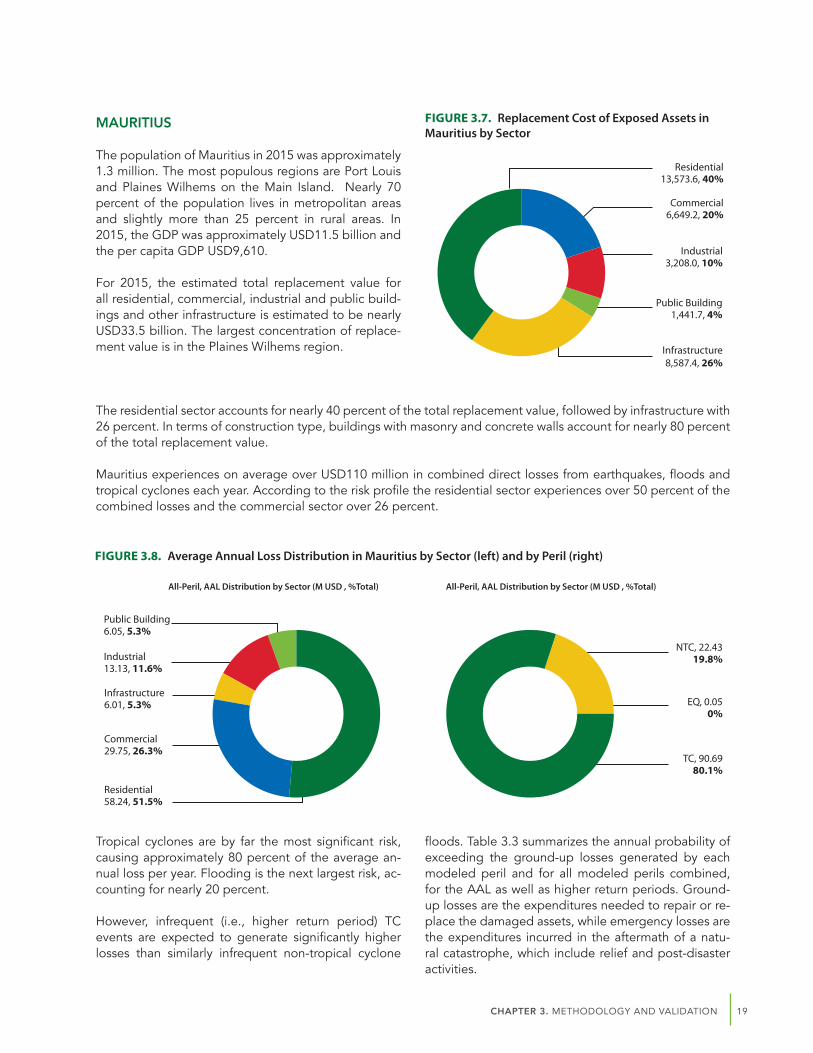
19CHAPTER 3. METHODOLOGY AND VALIDATION
MAURITIUS
The population of Mauritius in 2015 was approximately 1.3 million. The most populous regions are Port Louis and Plaines Wilhems on the Main Island. Nearly 70 percent of the population lives in metropolitan areas and slightly more than 25 percent in rural areas. In 2015, the GDP was approximately USD11.5 billion and the per capita GDP USD9,610.
For 2015, the estimated total replacement value for all residential, commercial, industrial and public build-ings and other infrastructure is estimated to be nearly USD33.5 billion. The largest concentration of replace-ment value is in the Plaines Wilhems region.
The residential sector accounts for nearly 40 percent of the total replacement value, followed by infrastructure with 26 percent. In terms of construction type, buildings with masonry and concrete walls account for nearly 80 percent of the total replacement value.
Mauritius experiences on average over USD110 million in combined direct losses from earthquakes, floods and tropical cyclones each year. According to the risk profile the residential sector experiences over 50 percent of the combined losses and the commercial sector over 26 percent.
FIGURE 3.8. Average Annual Loss Distribution in Mauritius by Sector (left) and by Peril (right)
FIGURE 3.7. Replacement Cost of Exposed Assets in Mauritius by Sector
All-Peril, AAL Distribution by Sector (M USD , %Total) All-Peril, AAL Distribution by Sector (M USD , %Total)
Tropical cyclones are by far the most significant risk, causing approximately 80 percent of the average an-nual loss per year. Flooding is the next largest risk, ac-counting for nearly 20 percent.
However, infrequent (i.e., higher return period) TC events are expected to generate significantly higher losses than similarly infrequent non-tropical cyclone
floods. Table 3.3 summarizes the annual probability of exceeding the ground-up losses generated by each modeled peril and for all modeled perils combined, for the AAL as well as higher return periods. Ground-up losses are the expenditures needed to repair or re-place the damaged assets, while emergency losses are the expenditures incurred in the aftermath of a natu-ral catastrophe, which include relief and post-disaster activities.
Infrastructure 8,587.4, 26%
Public Building 1,441.7, 4%
Industrial 3,208.0, 10%
Commercial 6,649.2, 20%
Residential 13,573.6, 40%
Residential 58.24, 51.5%
Commercial 29.75, 26.3%
Infrastructure 6.01, 5.3%
Public Building 6.05, 5.3%
Industrial 13.13, 11.6%
EQ, 0.05 0%
TC, 90.69 80.1%
NTC, 22.43 19.8%

20 SOUTH WEST INDIAN OCEAN RISK ASSESSMENT AND FINANCING INITIATIVE (SWIO-RAFI)
TABLE 3.3. Natural Catastrophe Risk Profile for Mauritius
Exceedance Probability:AAL
0.1 0.04 0.02 0.01 0.004 0.002
Mean Return Period (years): 10 25 50 100 250 500
Risk Profile: All Modeled Perils (AP)
Ground-up Loss (M USD) 113.2 145.2 356.8 800.6 1,906.5 3,642.3 5,730.4
(% Total Exposure Value) 0.3% 0.4% 1.1% 2.4% 5.7% 10.9% 17.1%
Emergency Loss (M USD) 26.0 33.4 82.1 184.1 438.5 837.7 1,318.0
Risk Profile: Tropical Cyclone (TC)
Ground-up Loss (M USD) 90.7 97.3 329.1 757.3 1,880.7 3,632.9 5,702.3
(% Total Exposure Value) 0.3% 0.3% 1.0% 2.3% 5.6% 10.9% 17.0%
Emergency Loss (M USD) 0.0 0.0 75.7 174.2 432.6 835.6 1,311.5
Risk Profile: Non-Tropical Cyclone Flood (NTC)
Ground-up Loss (M USD) 22.4 63.0 100.5 126.1 149.7 179.5 203.5
(% Total Exposure Value) <0.1% 0.2% 0.3% 0.4% 0.4% 0.5% 0.6%
Emergency Loss (M USD) 5.2 14.5 23.1 29.0 34.4 41.3 46.8
Risk Profile: Earthquake (EQ)
Ground-up Loss (M USD) 0.1 0.0 0.0 0.0 0.0 0.0 0.0
(% Total Exposure Value) <0.1% <0.1% <0.1% <0.1% <0.1% <0.1% <0.1%
Emergency Loss (M USD) 0.0 0.0 0.0 0.0 0.0 0.0 0.0
This analysis also shows that for example a 100-year return period tropical cyclone event could produce di-rect losses of USD1.9 billion, equivalent to 16 percent of the 2015 GDP, and require approximately USD430 million in emergency costs.
Particularly for tropical cyclones, the exposure normal-ized losses in Mauritius tend to be higher than many of the other SWIO Island States due to relatively concen-trated exposure, which can be impacted in its entirety by a single event.
The highest losses take place on the Main Island, which experiences nearly 90% of the AAL for the three per-ils combined, with the remaining losses occurring on Rodrigues. In addition to the direct losses, an annual average of nearly USD26 million is estimated for emer-gency costs.
FIGURE 3.9. Spatial Distribution of AAL for Mauritius from All Perils Combined

21CHAPTER 3. METHODOLOGY AND VALIDATION
SEYCHELLES
The population of Seychelles in 2015 was approxi-mately 93,000. Victoria on Mahé Island is the largest urban center. Nearly 40 percent of the population lives in urban areas, and slightly less than 50 percent in ru-ral areas. In 2015, the GDP was approximately USD1.4 billion and the per capita GDP USD14,760.
For 2015, the estimated total replacement value for all residential, commercial, industrial and public build-ings and other infrastructure is estimated to be nearly USD6.9 billion. The largest concentration of replace-ment value is in and around Victoria.
The residential sector accounts for nearly 49 percent of the total replacement value, followed the commercial sec-tor with 30 percent. In terms of construction type, buildings with masonry and concrete walls account for nearly 80 percent of the total replacement value.
Seychelles experiences on average over USD2.8 million in combined direct losses from earthquakes, floods and tropical cyclones each year. According to the risk profile the residential sector experiences 52 percent of the com-bined losses and the commercial sector 35 percent.
FIGURE 3.11. Average Annual Loss Distribution in Seychelles by Sector (left) and by Peril (right)
FIGURE 3.10. Replacement Cost of Exposed Assets in Seychelles by Sector
All-Peril, AAL Distribution by Sector (M USD , %Total) All-Peril, AAL Distribution by Sector (M USD , %Total)
Flooding is the most significant risk, causing approx-imately 88 percent of the average annual loss per year. Although infrequent, strong tropical cyclones can cause losses comparable to those of the worst floods, particularly on the Outer Islands located to the south of the three main islands.
Table 3.4 summarizes the annual probability of exceed-ing the ground-up losses generated by each modeled peril and for all modeled perils combined, for the AAL as well as higher return periods. Ground-up losses are the expenditures needed to repair or replace the dam-aged assets, while emergency losses are the expendi-tures incurred in the aftermath of a natural catastrophe, which include relief and post-disaster activities.
Infrastructure 877.3, 13%
Public Building 298.0, 4%
Industrial 270.0, 4%
Commercial 2,112.0, 30%
Residential 3,368, 49%
EQ, 0.00 0%
TC, 0.35 12.4%
NTC, 2.45 87.6%
Residential 1.48, 52.9%
Commercial 0.98, 35.1%
Infrastructure 0.01, 0.2%
Public Building 0.17, 6.2%
Industrial 0.15, 5.5%
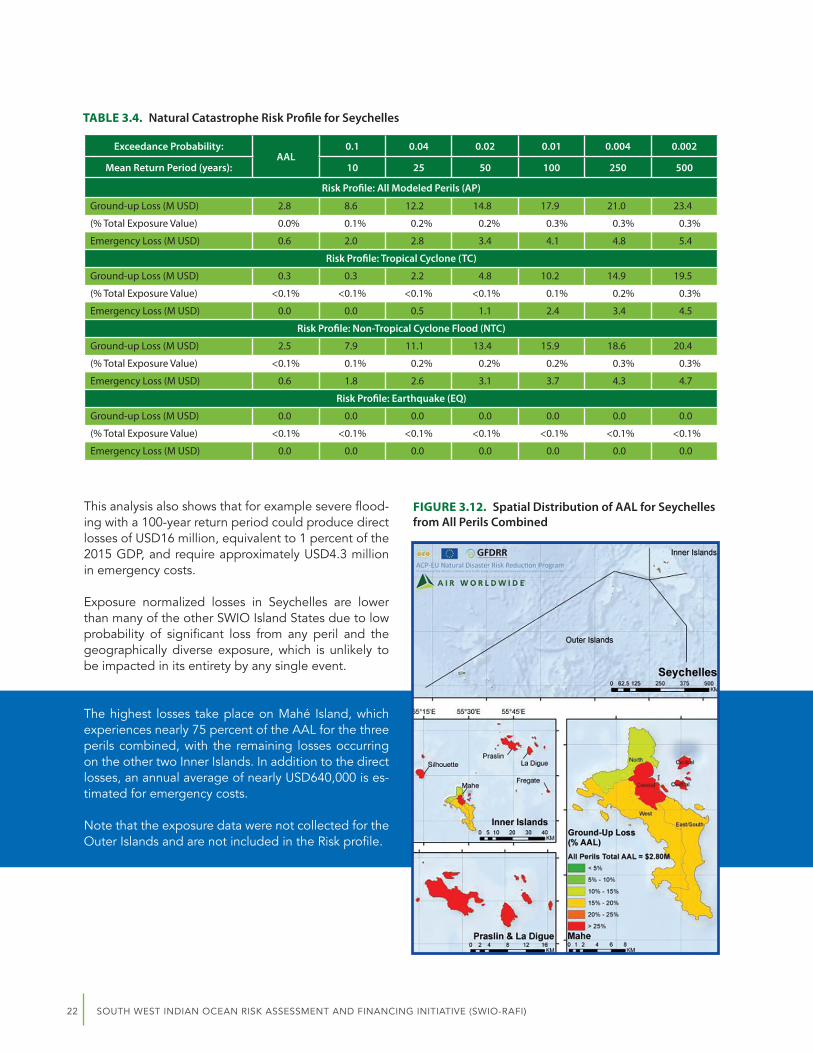
22 SOUTH WEST INDIAN OCEAN RISK ASSESSMENT AND FINANCING INITIATIVE (SWIO-RAFI)
TABLE 3.4. Natural Catastrophe Risk Profile for Seychelles
Exceedance Probability:AAL
0.1 0.04 0.02 0.01 0.004 0.002
Mean Return Period (years): 10 25 50 100 250 500
Risk Profile: All Modeled Perils (AP)
Ground-up Loss (M USD) 2.8 8.6 12.2 14.8 17.9 21.0 23.4
(% Total Exposure Value) 0.0% 0.1% 0.2% 0.2% 0.3% 0.3% 0.3%
Emergency Loss (M USD) 0.6 2.0 2.8 3.4 4.1 4.8 5.4
Risk Profile: Tropical Cyclone (TC)
Ground-up Loss (M USD) 0.3 0.3 2.2 4.8 10.2 14.9 19.5
(% Total Exposure Value) <0.1% <0.1% <0.1% <0.1% 0.1% 0.2% 0.3%
Emergency Loss (M USD) 0.0 0.0 0.5 1.1 2.4 3.4 4.5
Risk Profile: Non-Tropical Cyclone Flood (NTC)
Ground-up Loss (M USD) 2.5 7.9 11.1 13.4 15.9 18.6 20.4
(% Total Exposure Value) <0.1% 0.1% 0.2% 0.2% 0.2% 0.3% 0.3%
Emergency Loss (M USD) 0.6 1.8 2.6 3.1 3.7 4.3 4.7
Risk Profile: Earthquake (EQ)
Ground-up Loss (M USD) 0.0 0.0 0.0 0.0 0.0 0.0 0.0
(% Total Exposure Value) <0.1% <0.1% <0.1% <0.1% <0.1% <0.1% <0.1%
Emergency Loss (M USD) 0.0 0.0 0.0 0.0 0.0 0.0 0.0
This analysis also shows that for example severe flood-ing with a 100-year return period could produce direct losses of USD16 million, equivalent to 1 percent of the 2015 GDP, and require approximately USD4.3 million in emergency costs.
Exposure normalized losses in Seychelles are lower than many of the other SWIO Island States due to low probability of significant loss from any peril and the geographically diverse exposure, which is unlikely to be impacted in its entirety by any single event.
The highest losses take place on Mahé Island, which experiences nearly 75 percent of the AAL for the three perils combined, with the remaining losses occurring on the other two Inner Islands. In addition to the direct losses, an annual average of nearly USD640,000 is es-timated for emergency costs.
Note that the exposure data were not collected for the Outer Islands and are not included in the Risk profile.
FIGURE 3.12. Spatial Distribution of AAL for Seychelles from All Perils Combined
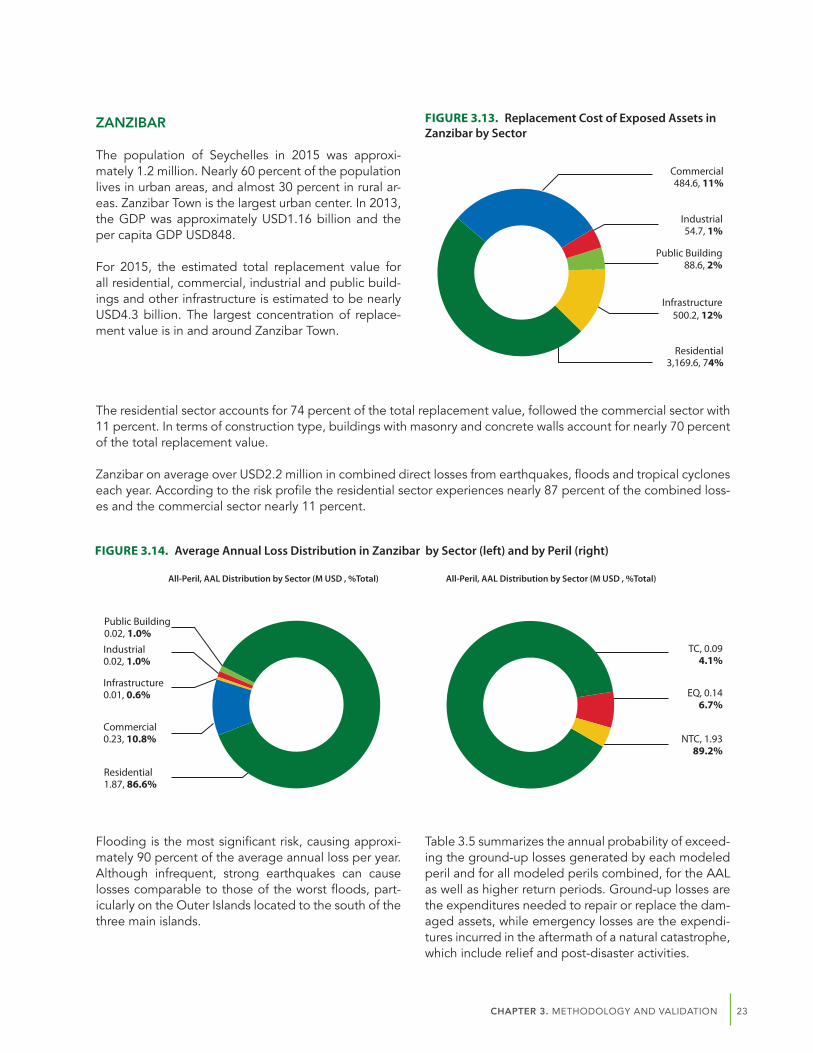
23CHAPTER 3. METHODOLOGY AND VALIDATION
ZANZIBAR
The population of Seychelles in 2015 was approxi-mately 1.2 million. Nearly 60 percent of the population lives in urban areas, and almost 30 percent in rural ar-eas. Zanzibar Town is the largest urban center. In 2013, the GDP was approximately USD1.16 billion and the per capita GDP USD848.
For 2015, the estimated total replacement value for all residential, commercial, industrial and public build-ings and other infrastructure is estimated to be nearly USD4.3 billion. The largest concentration of replace-ment value is in and around Zanzibar Town.
The residential sector accounts for 74 percent of the total replacement value, followed the commercial sector with 11 percent. In terms of construction type, buildings with masonry and concrete walls account for nearly 70 percent of the total replacement value.
Zanzibar on average over USD2.2 million in combined direct losses from earthquakes, floods and tropical cyclones each year. According to the risk profile the residential sector experiences nearly 87 percent of the combined loss-es and the commercial sector nearly 11 percent.
FIGURE 3.14. Average Annual Loss Distribution in Zanzibar by Sector (left) and by Peril (right)
FIGURE 3.13. Replacement Cost of Exposed Assets in Zanzibar by Sector
All-Peril, AAL Distribution by Sector (M USD , %Total) All-Peril, AAL Distribution by Sector (M USD , %Total)
Flooding is the most significant risk, causing approxi-mately 90 percent of the average annual loss per year. Although infrequent, strong earthquakes can cause losses comparable to those of the worst floods, part- icularly on the Outer Islands located to the south of the three main islands.
Table 3.5 summarizes the annual probability of exceed-ing the ground-up losses generated by each modeled peril and for all modeled perils combined, for the AAL as well as higher return periods. Ground-up losses are the expenditures needed to repair or replace the dam-aged assets, while emergency losses are the expendi-tures incurred in the aftermath of a natural catastrophe, which include relief and post-disaster activities.
Infrastructure 500.2, 12%
Public Building 88.6, 2%
Industrial 54.7, 1%
Commercial 484.6, 11%
Residential 3,169.6, 74%
EQ, 0.14 6.7%
TC, 0.09 4.1%
NTC, 1.93 89.2%
Residential 1.87, 86.6%
Commercial 0.23, 10.8%
Infrastructure 0.01, 0.6%
Public Building 0.02, 1.0%Industrial 0.02, 1.0%

24 SOUTH WEST INDIAN OCEAN RISK ASSESSMENT AND FINANCING INITIATIVE (SWIO-RAFI)
TABLE 3.5. Natural Catastrophe Risk Profile for Zanzibar
Exceedance Probability:AAL
0.1 0.04 0.02 0.01 0.004 0.002
Mean Return Period (years): 10 25 50 100 250 500
Risk Profile: All Modeled Perils (AP)
Ground-up Loss (M USD) 2.2 5.7 8.8 11.1 13.8 17.8 26.6
(% Total Exposure Value) <0.1% 0.1% 0.2% 0.3% 0.3% 0.4% 0.6%
Emergency Loss (M USD) 0.5 1.3 2.0 2.5 3.2 4.0 4.8
Risk Profile: Tropical Cyclone (TC)
Ground-up Loss (M USD) 0.1 0.0 0.0 0.0 0.1 0.3 0.7
(% Total Exposure Value) <0.1% <0.1% <0.1% <0.1% <0.1% <0.1% <0.1%
Emergency Loss (M USD) 0.0 0.0 0.0 0.0 0.0 0.1 0.2
Risk Profile: Non-Tropical Cyclone Flood (NTC)
Ground-up Loss (M USD) 1.9 5.6 8.5 10.6 12.8 15.6 17.1
(% Total Exposure Value) 0.1% 0.2% 0.3% 0.4% 0.5% 0.6% 0.7%
Emergency Loss (M USD) 0.4 1.3 1.9 2.4 2.9 3.6 3.9
Risk Profile: Earthquake (EQ)
Ground-up Loss (M USD) 0.1 0.0 0.0 0.0 0.0 3.9 18.9
(% Total Exposure Value) <0.1% <0.1% <0.1% <0.1% <0.1% 0.2% 0.7%
Emergency Loss (M USD) 0.0 0.0 0.0 0.0 0.0 0.6 3.0
This analysis also shows that for example severe flood-ing with a 100-year return period could produce di-rect losses of USD13 million and require approximately USD2.9 million in emergency costs.
FIGURE 3.15. Spatial Distribution of AAL for Zanzibar from All Perils Combined
In terms of absolute amount and amount relative to the value of local assets, the highest loss takes place in the Kusini-Pemba region. Of the country’s two main Islands, Zanzibar Island has slightly higher absolute flood losses than Pemba Island, but Pemba Island has higher losses relative to local assets. In addition to the direct losses, an annual average of nearly USD500,000 is estimated for emergency costs.
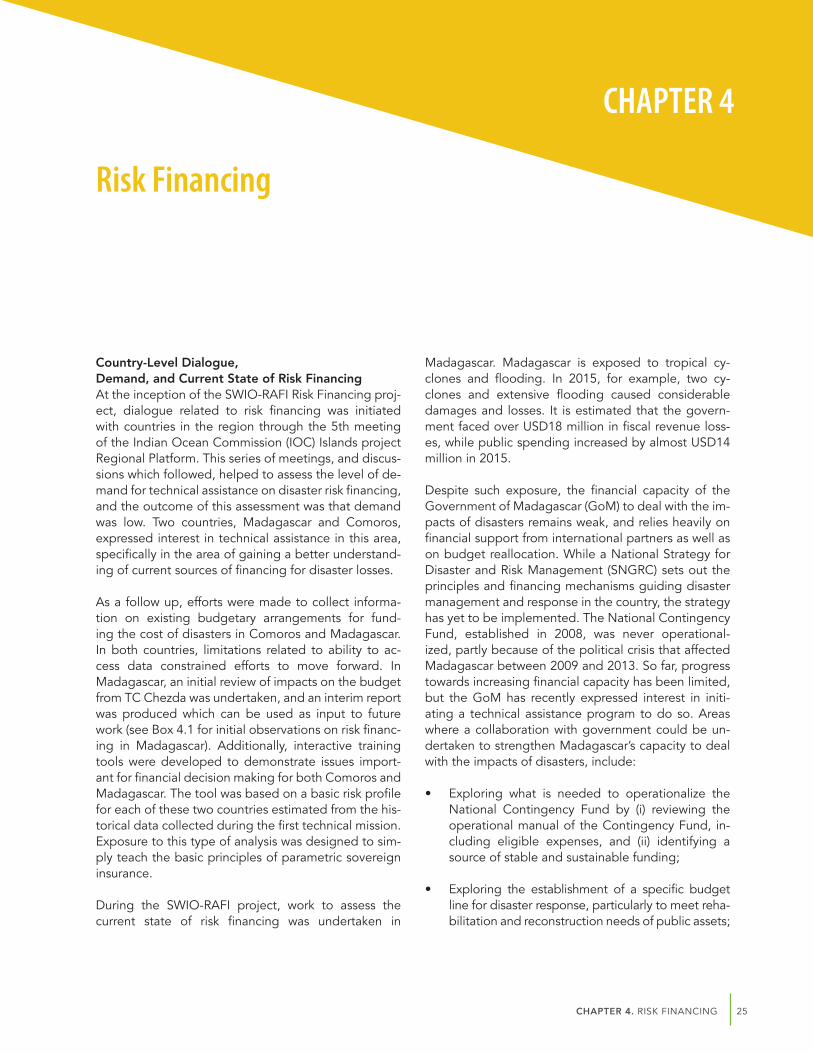
25CHAPTER 4. RISK FINANCING
CHAPTER 4
Risk Financing
Country-Level Dialogue, Demand, and Current State of Risk FinancingAt the inception of the SWIO-RAFI Risk Financing proj-ect, dialogue related to risk financing was initiated with countries in the region through the 5th meeting of the Indian Ocean Commission (IOC) Islands project Regional Platform. This series of meetings, and discus-sions which followed, helped to assess the level of de-mand for technical assistance on disaster risk financing, and the outcome of this assessment was that demand was low. Two countries, Madagascar and Comoros, expressed interest in technical assistance in this area, specifically in the area of gaining a better understand-ing of current sources of financing for disaster losses.
As a follow up, efforts were made to collect informa-tion on existing budgetary arrangements for fund-ing the cost of disasters in Comoros and Madagascar. In both countries, limitations related to ability to ac-cess data constrained efforts to move forward. In Madagascar, an initial review of impacts on the budget from TC Chezda was undertaken, and an interim report was produced which can be used as input to future work (see Box 4.1 for initial observations on risk financ-ing in Madagascar). Additionally, interactive training tools were developed to demonstrate issues import-ant for financial decision making for both Comoros and Madagascar. The tool was based on a basic risk profile for each of these two countries estimated from the his-torical data collected during the first technical mission. Exposure to this type of analysis was designed to sim-ply teach the basic principles of parametric sovereign insurance.
During the SWIO-RAFI project, work to assess the current state of risk financing was undertaken in
Madagascar. Madagascar is exposed to tropical cy-clones and flooding. In 2015, for example, two cy-clones and extensive flooding caused considerable damages and losses. It is estimated that the govern-ment faced over USD18 million in fiscal revenue loss-es, while public spending increased by almost USD14 million in 2015.
Despite such exposure, the financial capacity of the Government of Madagascar (GoM) to deal with the im-pacts of disasters remains weak, and relies heavily on financial support from international partners as well as on budget reallocation. While a National Strategy for Disaster and Risk Management (SNGRC) sets out the principles and financing mechanisms guiding disaster management and response in the country, the strategy has yet to be implemented. The National Contingency Fund, established in 2008, was never operational-ized, partly because of the political crisis that affected Madagascar between 2009 and 2013. So far, progress towards increasing financial capacity has been limited, but the GoM has recently expressed interest in initi-ating a technical assistance program to do so. Areas where a collaboration with government could be un-dertaken to strengthen Madagascar’s capacity to deal with the impacts of disasters, include:
• Exploring what is needed to operationalize the National Contingency Fund by (i) reviewing the operational manual of the Contingency Fund, in-cluding eligible expenses, and (ii) identifying a source of stable and sustainable funding;
• Exploring the establishment of a specific budget line for disaster response, particularly to meet reha-bilitation and reconstruction needs of public assets;
26 SOUTH WEST INDIAN OCEAN RISK ASSESSMENT AND FINANCING INITIATIVE (SWIO-RAFI)
• Strengthening the capacity of government stake-holders to understand the insurance coverage that is being offered through the regional risk pool; and
• Developing a national disaster risk financing strat-egy would identify gaps in the current financing framework and look for financial solutions that could improve the efficiency, timeliness and trans-parency of disaster response.
Status of Risk Pooling Globally, and in the RegionThe principle of risk pooling is used frequently in the management of catastrophe risks, and over the past decade it has been used to establish sovereign catastrophe risk pools. Starting with the Caribbean
Catastrophe Risk Insurance Facility, which was estab- lished in 2007, a growing number of governments and development partners have recognized that there are benefits to be gained by pooling sovereign risk across countries, and creating a foundation for a regional approach to risk management.
A short summary of existing and regional risk pools follows below in Table 4.1, along with a summary of pre-requisites for successful risk pools in Box 4.1. A more comprehensive review of sovereign risk pooling is currently being carried out by the WBG’s Disaster Risk Finance & Insurance Program, in collaboration with partners, and will be disseminated in the form of a technical report for the G20 in July, 2017.
Program Caribbean Catastrophe Risk Insurance Facility African Risk Capacity
Pacific Catastrophe Risk Assessment & Finance
Initiative
Date of first policies 2007 2014 2013
Countries participating Anguilla, Antigua & Barbuda, Barbados, Belize, Cayman Islands, Dominica, Grenada, Haiti, Jamaica, St. Kitts &Nev-is, Saint Lucia, St. Vincent & the Grenadines, Trinidad & Tobago, Turks & Caicos, Nicaragua
Burkina Faso, Mali, Mauri-tania, Niger, Senegal, the Gambia
Cook Islands, Marshall Is-lands, Samoa, Tonga, Vanuatu
2016/7 aggregate coverage limit USD 725 Million USD 100 Million USD 45 Million
2016 average premium income USD 29.2 Million USD 25 Million USD 2.3 Million
TABLE 4.1. Summary of Existing Regional Risk Pools
Significant strides have been made over the past decade on disaster risk financing and risk pooling. Support from bilateral donors, multilateral development banks, and regional organizations has led to the creation of a number of regional sover-eign-level risk pooling mechanisms, including the Caribbean Catastrophe Risk Financing Facility, the Pacific Catastrophe Risk Financing Facility, and the African Risk Capacity. Lessons learned from those experiences have indicated that there are a number of key pre-requisites, including:
• Confirmed, well-documented demand from member countries• Political coherence and institutional leadership among groups of countries• Investment in risk assessment and risk modelling for participating countries• Investment in preparation, negotiation, and implementation, estimated to take 3-5 years and require an investment of
USD5-15 million.• Proof-of-concept ability to transfer risk to capital markets• Implementation support and/or complementary technical assistance from impartial third party
BOX 4.1. On Pre-Requisites for Regional Risk Pools

27CHAPTER 4. RISK FINANCING
In 2014, African Risk Capacity, a regional risk pool es-tablished by member governments of the African Union Commission, established ARC Insurance Company Limited (ARC Ltd), the Agency’s financial af-filiate, which is licensed as a mutual insurer, to man-age the risk taken on through underwriting a pool of weather and other disaster risks for the region. The risk pool was established with an investment of re-turnable risk capital of USD200 million by the United Kingdom’s Department for International Development (DFID) and Germany’s KfW Development Bank (KfW) on behalf of the German Federal Ministry for Economic Cooperation and Development. In paral-lel, several donors including the UK Department for International Development, KfW, the Swiss Agency for Development and Cooperation, the Swedish International Development Coordination Agency, the International Fund for Agricultural Development, the United States Agency for International Development, the Rockefeller Foundation, and the United Nations World Food Programme have financially supported the work of the Agency and continue to do so.
In its first year of operation, four African governments, Kenya, Mauritania, Niger and Senegal, purchased USD129 million in drought insurance cover from ARC Ltd at a total of USD17 million in premium costs paid by those governments. Following a poor agricultural season in the Sahel, by February 2015, three member states received payouts from ARC Ltd totaling over USD26 million, which allowed these governments to deliver timely assistance to 1.3 million people and over half a million livestock. In May 2015, ARC added three countries to the pool, The Gambia, Mali, and Malawi. Each of these countries, in addition to the original four members, secured drought coverage for the 2015/16 policy year totaling USD178 million with correspond-ing premium of USD24.7 million.
During the 2015-2016 period, ARC responded to in-terest from SWIO Island States for cyclone coverage by investing in the development of a cyclone model that could be used to underwrite cyclone insurance for SWIO Island States. ARC formally launched its tropi-cal cyclone product at a workshop in June 2016 at-tended by all four AU member countries at risk, namely Mozambique, Madagascar, Mauritius and Comoros.
The significant investment made by donors to estab-lish ARC, combined with the investment ARC has made to extend its product range to include cyclone cover-age, have created a path to risk pool membership for SWIO Island States that is cost-effective, efficient, and more likely to be sustainable than the consideration of a stand-alone risk pool supported by a smaller sub-set of countries. ARC’s approach, and outreach to the SWIO Island States, meets the pre-requisites for estab-lishment of risk pools listed in box 4.1. Mozambique, Madagascar and Comoros have all signed the ARC Treaty and all have MoUs in place to cover ARC en-gagement. Mauritius has not yet signed the treaty, nor the MoU (although the latter has been discussed in detail).
The question of demand for insurance purchased through a regional risk pool, however, continues to be an open one. ARC Ltd has an option to include cy-clone risk into its 2016-2017 portfolio reinsurance pro-gram, and engagement is ongoing with Comoros, Madagascar and Mozambique. Discussions have also taken place with Mauritius, in preparation for purchase of policies (and meeting other conditions precedent including approved contingency plan for cyclone haz-ard) to cover the 2016-2017 SWIO cyclone season (starting 1 November) or in subsequent seasons. As of April 2017, no countries have firmly committed to join-ing the Tropical Cyclone pool.
General Recommendations on Risk Financing17 To better manage the cost of disaster, ensure pre-dictable and timely access to much needed resourc-es, and ultimately mitigate long-term fiscal impacts, many governments around the world are adopting a strategic approach to risk financing that uses a range of pre-planned, pre-negotiated financial instruments. This approach complements other elements of a com-prehensive disaster risk management strategy, includ-ing programs to identify and reduce risk. It does so by helping a government to proactively manage the re-sidual risk which cannot be fully mitigated (either be-cause this is not feasible or not cost effective).
Risk financing involves planning ahead and setting re-sources aside to finance disaster response activities before the disaster actually happens. To do so, govern-ments have access to a menu of financial instruments
17 This section of the document is drawn from “Financial Protection Against Natural Disasters: An Operational Framework for Disaster Risk Fi-nancing and Insurance”, and the forthcoming “Sovereign Climate and Disaster Risk Pooling” a WBG technical contribution to the G20. WBG, Disaster Risk Finance & Insurance Program, 2014 and 2017.
28 SOUTH WEST INDIAN OCEAN RISK ASSESSMENT AND FINANCING INITIATIVE (SWIO-RAFI)
and mechanisms that can help address varied needs and face different hazards. Based on the global experi-ence over the past 15 years across more than 60 coun-tries, the menu of ex-ante financing options available to governments includes:
• Contingency/reserve funds – in many countries, such funds are used to finance relief, rehabilita-tion, reconstruction and prevention activities for national emergencies. Sovereign funds specifically dedicated to disaster response exist in Colombia, Costa Rica, India, Indonesia, the Marshall Islands, Mexico, the Philippines, Lao PDR and Vietnam, among others. In the Philippines, the National Disaster Risk Reduction and Management Fund fi-nances a range of disaster-related expenditures, but it is not able to disburse rapidly in response to a crisis. For that reason, the government cre-ated the Quick Response Fund, which focuses on an emergency response. In Mexico, FONDEN was created as a budgetary tool to rapidly allocate fed-eral funds for emergency response and rehabilita-tion of public infrastructure affected by disasters. A number of other countries are working on the establishment of similar funds. In Kenya, for exam-ple, the government is in the final stages of opera-tionalizing a national contingency fund dedicated to drought emergencies.
• Contingent loans – contingent loans are finan-cial instruments designed to give countries access to liquidity immediately following an exogenous shock, such as terms of trade shock, financial shock, or natural disaster. They are typically of-fered by multilateral development banks and in-ternational financial institutions (including the WBG, the Asian Development Bank, and the Inter-American Development Bank and the IMF).
• Market-based risk transfer solutions – market- based instruments are used in every sector of the economy and have growing relevance in devel-opment due to increased exposure to risks which result in economic loss. A broad menu of under-lying instruments—derivative contracts, insur-ance contracts, or catastrophe bonds—can be used to transfer the risk of specific meteorologi-cal or geological events (droughts, hurricanes, earthquakes, and floods) to actors in the market (insurance companies, reinsurance companies, banks, and investors) who are willing to accept them. These market-based risk transfer products use scientific information and actuarial modelling
to estimate losses that would be sustained due to a specific event and “price” the risk. Disaster risk transfer solutions can rely on a parametric trigger. Payments are triggered by the performance of a pre-specified underlying parametric index such as levels of rainfall, length and intensity of drought, tropical cyclone wind speeds, etc.
Not all instruments serve the same purpose and gov-ernments can take a strategic approach to financial protection by combining instruments with different characteristics. Depending on the frequency and se-verity of risks to be managed, governments can com-bine (or layer) financing instruments that address different needs and have different cost implications. Such an approach prioritizes cheaper sources of fund-ing, ensuring that the most expensive instruments are only used in exceptional circumstances. For example, sovereign insurance may provide cost-effective cov-er against extreme events, but it may be inefficient and costly to protect against low intensity and recur-ring events. For such disasters, a dedicated contin-gency fund that ‘retains’ this lowest layer of risk may be a more appropriate solution. Figure 4.1 provides a graphic representation of this risk layering approach.
Combining instruments also enables governments to take into account the evolving needs for funds – from emergency response to long term reconstruction. For example, a government could decide to purchase (ex-ante) quick-disbursing risk transfer instruments to ensure immediate liquidity in the aftermath of extreme events, but it will raise the much larger sums required to finance reconstruction efforts through (ex-post) bud-get reallocations or by issuing bonds.
Policy makers considering the most effective approach to financial protection need to evaluate various poten-tial instruments. An evaluation framework helps pub-lic officials assess (i) whether a given instrument is the right tool to achieve their objectives, and (ii) how well the selected instrument is implemented and ways to make it more efficient.
A possible framework to help governments evaluate risk financing solutions can draw on the key principles of effective financial protection:
• How cost effective is the instrument in accessing financial resources post disaster, either in absolute terms (“how much does USD1 of disaster response cost”) or relative to other instruments available.
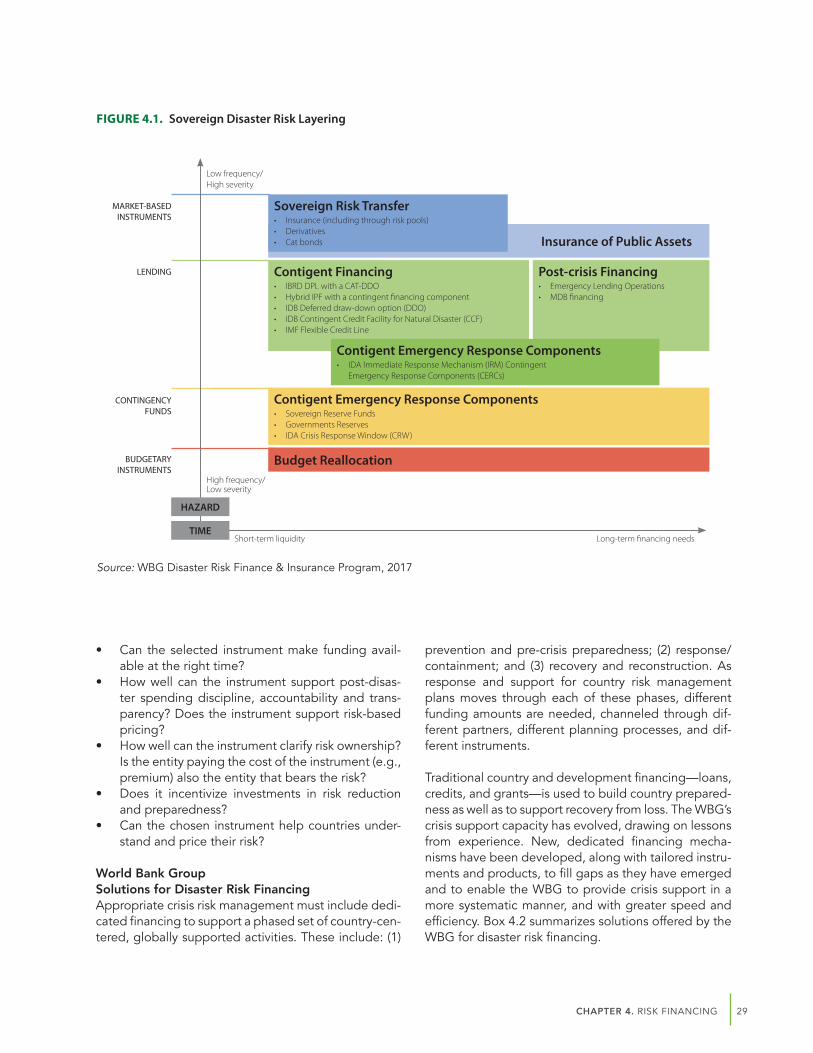
29CHAPTER 4. RISK FINANCING
FIGURE 4.1. Sovereign Disaster Risk Layering
• Can the selected instrument make funding avail-able at the right time?
• How well can the instrument support post-disas-ter spending discipline, accountability and trans-parency? Does the instrument support risk-based pricing?
• How well can the instrument clarify risk ownership? Is the entity paying the cost of the instrument (e.g., premium) also the entity that bears the risk?
• Does it incentivize investments in risk reduction and preparedness?
• Can the chosen instrument help countries under-stand and price their risk?
World Bank Group Solutions for Disaster Risk FinancingAppropriate crisis risk management must include dedi-cated financing to support a phased set of country-cen-tered, globally supported activities. These include: (1)
prevention and pre-crisis preparedness; (2) response/containment; and (3) recovery and reconstruction. As response and support for country risk management plans moves through each of these phases, different funding amounts are needed, channeled through dif-ferent partners, different planning processes, and dif-ferent instruments.
Traditional country and development financing—loans, credits, and grants—is used to build country prepared-ness as well as to support recovery from loss. The WBG’s crisis support capacity has evolved, drawing on lessons from experience. New, dedicated financing mecha-nisms have been developed, along with tailored instru-ments and products, to fill gaps as they have emerged and to enable the WBG to provide crisis support in a more systematic manner, and with greater speed and efficiency. Box 4.2 summarizes solutions offered by the WBG for disaster risk financing.
Insurance of Public Assets
Post-crisis Financing• Emergency Lending Operations• MDB financing
Sovereign Risk Transfer• Insurance (including through risk pools)• Derivatives• Cat bonds
Contigent Emergency Response Components• Sovereign Reserve Funds• Governments Reserves• IDA Crisis Response Window (CRW)
Budget Reallocation
Contigent Financing• IBRD DPL with a CAT-DDO• Hybrid IPF with a contingent financing component• IDB Deferred draw-down option (DDO)• IDB Contingent Credit Facility for Natural Disaster (CCF)• IMF Flexible Credit Line
Contigent Emergency Response Components• IDA Immediate Response Mechanism (IRM) Contingent
Emergency Response Components (CERCs)
HAZARD
TIME
MARKET-BASED INSTRUMENTS
LENDING
CONTINGENCY FUNDS
BUDGETARY INSTRUMENTS
Short-term liquidity Long-term financing needs
High frequency/ Low severity
Low frequency/ High severity
Source: WBG Disaster Risk Finance & Insurance Program, 2017

30 SOUTH WEST INDIAN OCEAN RISK ASSESSMENT AND FINANCING INITIATIVE (SWIO-RAFI)
The range of instruments offered by the World Bank Group to help countries strengthen financial resilience to disasters has evolved over the past 15 years in response to client demand. Instruments can be arranged prior to a natural disaster, or after a shock. They include:
Ex ante Instruments (planned, negotiated, and put in place prior to a natural disaster shock)
• Investment Project Financing can be used to strengthen the capacity of country systems to respond to crisis and invest in resilience.
• A contingent loan for natural disasters, the Development Policy Loan with Catastrophe Deferred Draw-Down Option (CAT-DDO) allows countries eligible to borrow from the International Bank for Reconstruction and Develop-ment (IBRD) to secure immediate access to budget support of up to USD 500 million, or 0.25 percent of GDP (whichever is lower) following declaration of a national emergency. Since the introduction of the instrument in 2008, CAT-DDOs have been used in 13 countries for an aggregate amount of USD2.3 billion. These loans also provide a platform for policy reform which has proven to be a key driver to strengthen national risk management capacity. Under IDA-18, the CAT-DDO will be adapted to also address pandemic risks and be made available to low income countries.
• A Contingent Emergency Response Component is a contingent component built into IDA projects which allow for pre-agreed process of allocating undisbursed resources to emergency response in the event of a shock.
• The Immediate Response Mechanism (IRM) provides rapid access to undisbursed IDA resources to address immedi-ate post-crisis financing needs. It allows a country to access undisbursed IDA balances to address immediate post-crisis financing needs. The IRM has been used to respond to natural disasters. Once specific prior actions are met, the IRM provides for pooling of uncommitted resources across projects to allow IDA countries to make use of USD5 million or 5 percent of undisbursed funds soon after an emergency.
• The Bank has arranged a number of innovative, market-based risk transfer solutions that provide levels of protec-tion depending on the type, frequency, and severity of the event. Weather hedges—based on an underlying weath-er index—transfer the risk to the financial markets. Payments are triggered by adverse weather events according to pre-specified conditions (e.g. levels of rainfall, seasonal temperatures, etc.). The Bank offers intermediation services for index-based weather derivatives to both middle and low income countries. Catastrophe bonds transfer the risk of a natural disaster to investors by allowing the issuer to not repay the bond principal if a major natural disaster occurs. The MultiCat Program—a bond issuance platform developed by the Bank—transfers diversified risk to private investors. Through its work on intermediating cat risk transfer transactions for member countries, the Bank has helped member countries transfer more than USD1.5 billion of risk to the private markets.
Ex post Instruments (planned, negotiated, and put in place after a natural disaster shock)
• IDA’s Crisis Response Window – is an effective tool for countries to mount emergency responses, as well as build long-term resilience and crisis management capacity in a systematic way.
• Emergency Response Loans – can be used to provide immediate relief following an event. Examples include USD200 million Nepal Earthquake Housing Reconstruction Project and the USD80 million Malawi Emergency Recovery Project.
• Budget support through Development Policy Operations can provide fiscal adjustment after a crisis, much need- ed countercyclical financing, and policy advice to help countries protect public investment and services and build targeted social safety nets to protect the most vulnerable.
BOX 4.2. World Bank Group Financial Solutions for Disaster Risk Financing

31CHAPTER 4. RISK FINANCING
Next StepsSWIO governments face critical challenges for financial resilience to natural disasters. Most SWIO Island States have restricted options for securing immediate liquid-ity for swift post-disaster emergency response without compromising their long-term fiscal balance. In addi-tion, SWIO Island States are at times constrained by their size, borrowing capacity, and limited access to in-ternational insurance markets. In the absence of easy access to debt and well-functioning insurance markets, a large portion of the economic losses stemming from adverse natural events are borne by governments and households, with support from development partners.
Strengthening fiscal policy, and the ability of govern-ments to better respond to needs in the event of a disaster, requires design and implementation of a ro-bust ex ante risk management plan. To date, many governments dealing with a spectrum of risks and fis-cal challenges have not had the appropriate resources to prioritize risk management for disasters. Given both the overall need to protect investments by the gov-ernments and the uncertainty associated with climate change, there continues to be a strong case for im-plementing risk financing strategies, which draw on a number of financial tools, to strengthen financial plan-ning and preparation for shocks.
The following represent next steps which SWIO coun-tries may want to consider in order to build on the risk modelling work undertaken as part of this project and take steps to strengthen financial resilience to natural disasters.
• Evaluate feasibility of establishing contingency/ reserve funds. A number of Small Islands States have begun the process of establishing dedicat-ed reserves to facilitate relief and early recovery. These funds are governed by legislation according to country-specific public financial management legislation, and they vary in complexity. Although there are not yet established global best practic-es for these funds, there are a number of countries in the region and around the world exploring this approach, and as a result there may be opportu-nities to share experiences and learn from other countries.
• Consider using contingent loans to help strengthen the government’s capacity for disas-ter risk management and improve access to li-quidity following a shock. Several SWIO Island States have manageable levels of debt, and the
associated risk of debt distress is low to moderate. As a result, they may be well-placed to explore the use of contingent credit as a DRFI tool. In 2016 the Seychelles implemented the WBG’s Disaster Risk Management Development Policy Loan (DPL) with a Catastrophic Drawdown Option (Cat DDO). The flexibility and fast disbursement characteris-tics of the contingent loan are designed to allow the government to focus on emergency response measures in the aftermath of a disaster, and re-duce the time spent trying to raise funds.
• Participate in knowledge sharing and global di-alogue on lessons learned from existing sov-ereign risk pools, including the African Risk Capacity. In response to increased interested in sovereign risk pooling and in what can be done to scale up access to the risk pools and their im-pact, the WBG’s Disaster Risk Finance & Insurance Program is collaborating with partners to produce a technical report for the G20 on the topic, which will be available in July, 2017. Drawing on a re-view of sovereign risk pooling and transfer mecha-nisms for national and sub-national governments, including lessons learned from existing pools, the study will discuss institutional, operational and fi-nancial considerations to meet diverse country hazard profiles (rapid and slow onset) and expo-sure profiles (assets and populations), political considerations, and stakeholder roles and respon-sibilities. The report and dialogue at the G20 will examine how those pooling mechanisms could be further expanded and replicated (potentially through concessional finance support for paying premiums) and how the cooperation between G20 countries and developing countries could be fur-ther strengthened.
• Invest in building insurance markets. The insur-ance market in the SWIO is small. Most SOEs in SWIO Island States have some form of proper-ty insurance, but the purchase of insurance is not centrally coordinated or recorded. Several SWIO Island States have expressed concern at not be-ing able to access cost-effective infrastructure in-surance from the marketplace since it was either too expensive or simply not available. SWIO Island States also lack up-to-date centrally held asset registers or insurance registers. Identifying a pool of key public properties, strengthening regulatory frameworks, and improving information about ex-posure would be important steps forward to build-ing insurance markets.
32 SOUTH WEST INDIAN OCEAN RISK ASSESSMENT AND FINANCING INITIATIVE (SWIO-RAFI)
• Integrate capacity building on risk financing into work undertaken by Ministries of Finance on related topics, such as debt management, public financial management, management of contingent liabilities. Although the SWIO-RAFI project is coming to a close, technical assistance on risk financing for Ministries of Finance will con-tinue to be available through the WBG’s Disaster Risk Finance & Insurance Program (DRFIP), a part-nership of the Finance & Markets Global Practice and the Global Facility for Disaster Reduction and Response (GFDRR), with funding from the EU/ACP Africa Disaster Risk Financing Initiative. Under this program, technical assistance will be available for Madagascar (which has requested support) and the other SWIO Island States (if there is interest). The WBG stands ready to provide technical assistance and capacity building. Annex 1 includes informa-tion about the activities that could be supported.
33ANNEX 1: FINANCIAL PROTECTION AGAINST NATURAL DISASTERS
Annex 1: Financial Protection against Natural Disasters
Phases of Engagement for Customized Technical Assistance to Develop a Disaster Risk Financing Strategy
Technical assistance on disaster risk financing can help national and sub-national authorities establish an insti-tutional framework that can support policy measures, investment decisions and the development of a broad-er menu of tailored financial solutions, along with the development of analytical tools that can be used to drive decision-making and institutional change.
The WBG Disaster Risk Financing and Insurance Program (DRFIP), a joint program between the Finance and Markets Global Practice of the WBG and the Global Facility for Disaster Reduction and Recovery (GFDRR), has worked in more than 50 countries around the world to improve policy-makers’ abilities to quan-tify the economic and fiscal impact of disasters, take stock of existing mechanisms to finance these costs, either in a planned manner or ad-hoc, develop pol-icy frameworks and implementation plans that can support a more comprehensive approach to manag-ing these costs, and design risk financing products and vehicles that can leverage the reinsurance and capital markets.
In Africa, technical assistance for this activity is fund-ed through the Africa Disaster Risk Financing Initiative, which is part of the program “Building Disaster Resilience in Sub-Saharan Africa,” an initiative of the African, Caribbean and Pacific Group of States, fi-nanced by the European Union.
The overall objectives of this initiative are to i) support the development of multi-risk financing strategies at regional, national and local levels to help African coun-tries make informed decisions; ii) improve financial response capacity post-disaster; and iii) mitigate the socio-economic, fiscal and financial impacts of disas-ters in African countries.
This document lays out the main topics that are covered in a technical assistance engagement led by DRFIP, which builds on three phases: Diagnostic, Preparation
and Implementation periods. The program is a flexible one that can be customized to meet the specific needs of governments based on priorities.
Phase 1 – Diagnostic – Support to Identification
1. Financial risk assessment of natural disasters. Financial analysis of the economic, social and fis-cal impact of natural disasters, relying on historical data and/or simulated data from catastrophe risk models.
2. Analysis of contingent liabilities (explicit and im-plicit). Reviews the legal responsibility and policy commitment of national governments to finance post-disaster response and recovery, and makes clear the liability of the government with regards to any private assets; government liability for any property catastrophe risk insurance, agricultural in-surance or social protection programs; and gov-ernment guarantees for disaster losses incurred by SOEs and/or PPPs. Summarizes requirements on the government for quantification and reporting of contingent liabilities overall; legal requirements, mandate or historical experience in quantifying contingent liabilities from disasters; experience with integration of different sources of contingent liabilities; reviews existence of fiscal risk state-ment; integrates disasters in fiscal risk statement, etc. Includes assessment of gaps and/or areas that need strengthening.
3. Review existing portfolio of disaster risk finance and response mechanisms. Documents the key characteristics of the existing portfolio of instru-ments used for disaster risk financing, including those used by development partners, through the risk layering framework. These could include, but are not limited to: disaster reserve funds, contin-gent credit facilities, agricultural insurance, prop-erty catastrophe insurance (for public and private assets), sovereign insurance, weather derivatives, catastrophe bonds, etc. Produces a descriptive summary of each of these instruments, mapping out rules, data requirements, risk layer covered,

34 SOUTH WEST INDIAN OCEAN RISK ASSESSMENT AND FINANCING INITIATIVE (SWIO-RAFI)
timing, targets, pre-requisites, and budgets, along with a review of decision-making and implementa-tion arrangements.
4. Cost sharing between national and subnation-al government and national government and donors. Analyses of implicit or explicit cost-shar-ing arrangements for response and recovery be-tween the national and subnational governments and donors; as well as legal liability or policy com-mitments by national government to support sub-national responses.
5. Institutional foundation for risk financing poli-cies and instruments. Analyzes the existing legal and institutional framework that defines and gov-erns the institutional mandate, responsibility, and accountability within the government for financial protection against natural disasters, with a partic-ular emphasis on the responsibility of the Ministry of Finance, line ministries and other government agencies. Includes assessment of gaps and/or ar-eas that need strengthening.
6. Framework governing resource mobilization. Analyzes budget allocations, processes for re-al-location, off-budget accounts, and contingency funds, with special attention to transparency, ac-countability and rules as to who allocates, controls, and can access those funds, and the procedures and circumstances that can lead to disbursement. Analyzes mechanisms for budget reallocation fol-lowing disasters. Includes assessment of gaps and/or areas that need strengthening.
7. Framework governing resource execution. Reviews the interaction between mobilization of funds and executing agencies, in particular, re-garding rules governing the declaration of emer-gencies, (including. who can declare an emergency and under which conditions), emergency proce-dures for fund allocation and reporting, and emer-gency procurement procedures. Include a review of these issues for government instruments and donor funded mechanisms.
8. Scope for improving coordination and synergies between related policy areas. Analyses the links between disaster and climate financing and adap-tation, resilience activities, fiscal risk management, agricultural risk management, social protection, and other relevant policy areas.
9. Review of domestic financial and insurance mar-kets. Review market-based financial instruments available to homeowners, famers/herders, SMEs, to protect their assets and livelihood against di-sasters: crop and livestock insurance, proper-ty catastrophe risk insurance (including business interruption, etc). Review of legal and regulato-ry framework for catastrophe risk insurance (e.g., capital requirements, reserving, etc.). Review oth-er financial instruments, such a contingent credit, available for private stakeholders.
10. Fiscal gap analysis. Analyses historical data demonstrating impacts of disasters on the whole economy, government’s budget, fiscal balance, and debt. Estimates the fiscal gap as the differ-ence between estimated fiscal losses and funds available to meet those losses, including consid-erations of timing of expenditure on relief, recov-ery, and reconstruction (short-term and long-term funding gap), and consideration of timing of disas-ter relative to fiscal year and possible budgetary adjustments.
11. Economic and financial analysis of options for improved financial protection. Defines, analyses and compares financial solutions for improved fi-nancial protection. Builds on cost and benefit anal-ysis of financial options.
This phase is summarized in a DRF Diagnostic report.
Phase 2. Preparation – Support to Development of a Risk Financing Strategy and Action Plan
This phase of the work builds and extends the diagnos-tic phase. It is undertaken in close collaboration with the Ministry of Finance, and driven by government pri-orities. The approach used is similar to other areas of risk management and public financial management. In the light of the DRF diagnostic conducted in phase 1, leads to the preparation of a formal risk financing framework with the following components:
• Formalized objectives and scope,• Identification and analysis of instruments• Scenario analysis• Analysis of options for improved financial protec-
tion, including cost-benefit analysis;• Strategic decisions• Criteria for evaluation

35ANNEX 1: FINANCIAL PROTECTION AGAINST NATURAL DISASTERS)
This phase produces a DRF Strategy setting the long term DRF objectives, and a DRF Action Plan setting the short term objectives.
Phase 3. Implementation – Support to Operationalization of Disaster Risk Financing Policies and Instruments
This phase provides national and subnational entities with the necessary technical, legal, operational and institutional support to evaluate and, if appropriate, implement policy reforms and financial instruments, as articulated on the DRF Strategy and Action Plan. Support for implementation can include:
• Assistance with new legislation and regulation, in-stitutional reform
• Improvements to public financial management and budgetary systems
• Design of new structures or funds within the budget
• Design of market-based financial solutions such as insurance products and insurance pools or vehi-cles to leverage domestic and international (re)in-surance and capital markets
• Development of disaster risk insurance program through public-private partnerships
• Development of new delivery mechanisms for so-cial protection and insurance
• Assistance in evaluating market-based finan-cial solutions (e.g., through cost-benefit financial analysis)
• Assistance with legal and regulatory infrastructure to enable the development of domestic disaster risk insurance markets
The approach is similar to those used in other areas of risk management and public financial management by focusing on:
• Governance (legal framework and contracts, man-agerial structure, audit processes)
• Coordination with other entities and policies• Cash flow management and supporting budget
systems• Operations (data, policies and procedures, staff
capacity) and reporting


South West Indian Ocean Risk Assessment and Financing Initiative (SWIO-RAFI)