south sudan ireland - action against · pdf file1 south sudan ireland nutritional...
TRANSCRIPT

1
South Sudan Ireland
NUTRITIONAL ANTHROPOMETRIC SURVEYCHILDREN UNDER FIVE YEARS OLD
FINAL REPORTTWIC/ABYEI COUNTIES, BAHR-EL-GHAZAL
March 28TH – April 13th, 2005
Jane Ndungu – Nutritionist (ACF-USA)Rose Ogwaro- Nutrition co-coordinator (Goal Ireland)
Deborah Morris - Nutrition Survey Program Officer (ACF-USA)

2
ACKNOWLEDGMENTS
ACF-USA and GOAL Ireland acknowledges the invaluable support and assistance of the following:
• ECHO for funding the survey,
• Sudan Relief and Rehabilitation Commission (SRRC), both in Lokichoggio and Twic/Abyei for facilitatingthe work in the field,
• The local survey teams for working tirelessly,
• Mothers and caretakers, local authorities, and community leaders for their co-operation.

3
TABLE OF CONTENTS.I. EXECUTIVE SUMMARY................................................................................................................................................ 5
.I.1. INTRODUCTION .............................................................................................................................................................. 5
.I.2. JUSTIFICATION FOR THE NUTRITION SURVEY................................................................................................................. 6
.I.3. OBJECTIVES ................................................................................................................................................................... 6
.I.4. METHODOLOGY ............................................................................................................................................................. 6
.I.5. RESULTS ........................................................................................................................................................................ 7
.I.6. DISCUSSION ................................................................................................................................................................... 7
.I.7. RECOMMENDATIONS...................................................................................................................................................... 8
.II. INTRODUCTION ............................................................................................................................................................ 8
.II.1. CONTEXT...................................................................................................................................................................... 8
.II.2. SECURITY ..................................................................................................................................................................... 9
.II.3. INTERNALLY DISPLACED PERSONS (IDP’S) AND RETURNEES POPULATION ................................................................. 9
.II.4. TRADE .......................................................................................................................................................................... 9
.II.5. AGRICULTURE AND FOOD SECURITY .......................................................................................................................... 10
.II.6. HEALTH ...................................................................................................................................................................... 11
.II.7. WATER AND SANITATION ........................................................................................................................................... 12
.II.8. EDUCATION ................................................................................................................................................................ 13
.III. METHODOLOGY ....................................................................................................................................................... 14
.III.1. TYPE OF SURVEY AND SAMPLE SIZE ......................................................................................................................... 14
.III.2. SAMPLING METHODOLOGY ....................................................................................................................................... 14
.III.3. DATA COLLECTION ................................................................................................................................................... 15
.III.4. INDICATORS, GUIDELINES, AND FORMULA’S USED................................................................................................... 16.III.4.1. Acute Malnutrition............................................................................................................................................. 16.III.4.2. Mortality ............................................................................................................................................................ 16
.III.5. FIELD WORK ............................................................................................................................................................. 17.III.5.1. Constraints Encountered During Implementation............................................................................................. 17
.III.6. DATA ANALYSIS........................................................................................................................................................ 17
.IV. RESULTS ...................................................................................................................................................................... 18
.IV.1. DISTRIBUTION BY AGE AND SEX............................................................................................................................... 18
.IV.2. ANTHROPOMETRIC ANALYSIS................................................................................................................................... 19.IV.2.1. Acute Malnutrition............................................................................................................................................. 19.IV.2.2. Risk of Mortality: Children’s MUAC................................................................................................................. 22
.IV.3. MEASLES VACCINATION COVERAGE......................................................................................................................... 22
.IV.4. HOUSEHOLD STATUS................................................................................................................................................. 23
.IV.5. MORTALITY RATE..................................................................................................................................................... 23
.IV.6. CAUSES OF MORTALITY ............................................................................................................................................ 24
.V. DISCUSSION.................................................................................................................................................................. 24
.VI. RECOMMENDATIONS.............................................................................................................................................. 26
.VII. APPENDICES.............................................................................................................................................................. 28
.VII.1. TWIC/ABYEI RETURNEES STATUS REPORT .............................................................................................................. 28
.VII.2. CLUSTER SELECTION TWIC AND ABYEI COUNTIES MARCH 2005............................................................................. 30
.VII.3. ANTHROPOMETRIC SURVEY QUESTIONNAIRE.......................................................................................................... 38
.VII.4. RETROSPECTIVE MORTALITY SURVEY QUESTIONNAIRE.......................................................................................... 39
.VII.5. ANTHROPOMETRIC SURVEY QUESTIONNAIRE FOR CHILDREN LESS THAN 6 MONTHS OF AGE .................................. 40
.VII.6. CALENDAR OF EVENTS, TWIC/ABYEI, APRIL 2005.................................................................................................. 41
.VII.7. FOOD AND NON-FOOD ITEMS AND PRICES IN THE TWIC AND ABYEI MARKETS ......................................................... 43

4
LIST OF TABLESTABLE 1 ANTHROPOMETRIC, MORTALITY AND MEASLES COVERAGE RESULTS....................................................................... 7TABLE 2 DISTRIBUTION OF BOREHOLES IN THE COUNTIES:...................................................................................................... 12TABLE 3 ORGANIZATIONS INTERVENING IN TWIC/ABYEI COUNTIES....................................................................................... 13TABLE 4 DISTRIBUTION OF THE SAMPLE BY AGE AND SEX....................................................................................................... 18TABLE 5 WEIGHT FOR HEIGHT DISTRIBUTION BY AGE IN Z-SCORES ....................................................................................... 19TABLE 6 WEIGHT FOR HEIGHT VS. OEDEMA IN Z-SCORE ........................................................................................................ 19TABLE 7 GLOBAL AND SEVERE ACUTE MALNUTRITION BY AGE GROUP IN Z-SCORES ........................................................... 20TABLE 8 NUTRITIONAL STATUS IN Z-SCORES BY GENDER ...................................................................................................... 20TABLE 9 WEIGHT/HEIGHT: DISTRIBUTION BY AGE IN PERCENTAGE OF MEDIAN..................................................................... 20TABLE 10 WEIGHT FOR HEIGHT VS. OEDEMA IN PERCENTAGE OF MEDIAN.............................................................................. 20TABLE 11 GLOBAL AND SEVERE ACUTE MALNUTRITION BY AGE GROUP IN PERCENTAGE OF MEDIAN................................. 21TABLE 12 AGE DISTRIBUTION OF THE UNDER SIX MONTHS...................................................................................................... 21TABLE 13 FEEDING PRACTICES ............................................................................................................................................... 21TABLE 14 MUAC DISTRIBUTION ACCORDING TO NUTRITIONAL STATUS ................................................................................ 22TABLE 15 MEASLES VACCINATION COVERAGE ....................................................................................................................... 22TABLE 16 HOUSEHOLD STATUS .............................................................................................................................................. 23TABLE 17 CAUSE OF DEATH ................................................................................................................................................... 24
LIST OF FIGURESFIGURE 1 DISTRIBUTION OF THE SAMPLE BY AGE AND SEX ..................................................................................................... 18FIGURE 2 Z-SCORES DISTRIBUTION WEIGHT-FOR-HEIGHT, TWIC/ABYEI ................................................................................ 19

5
.I. EXECUTIVE SUMMARY
.I.1. Introduction
Twic and Abyei Counties are located in the Bahr El Ghazal region. Twic County is divided into 6 payams namelyWunrok, Akoch, Ajakuach, Turalei, Panyok and Aweng. Abyei has 4 payams; Alal, Rummer, Malual-aleu andJuol-Jok. The two Counties share the same geographical features, and are characterized by green vegetation (RichSavannah) with fertile alluvial soil. There are 3 main rivers in the counties: rivers Lol and Lal in Twic County and river Kiir in Abyei. Seasonal riverscut through the payam. Twic County lies in the flood plains agro-ecological zone, and receives extensiveseasonal flooding from the tributaries of the Nile. The populations are agro-pastoralist, mainly depending on sorghum and cattle. Trading is significant in theCounties with barter the main form of trade. The inhabitants are predominantly Dinka, with the total population ofTwic and Abyei Counties estimated at 105,000 and 25,000 respectively.
The last insecurity incident had occurred in February and March in Akoch Payam, and Mayen abun in WunrokPayam of Twic County. The two locations were still level 4 at the beginning of the survey, but Akoch had its levellowered during the survey period.
Several agencies are intervening in different sectors in the counties as outlined below:
• GOAL runs health services in the two counties. It has 5 Primary Health Care Centres (PHCC’s) and 8Primary Health Care Units (PHCU’s). The health facilities offer both preventive and curative service.GOAL also has other programs, such as water and sanitation, health and hygiene (awarenesscampaign), malaria control (distribution of bed nets) and HIV/AIDS campaign.
• MERCY CORPS conducts food security activities in Twic County. • VSF-CH is conducting veterinary services in Twic County that include animal restocking, provision of
drugs and capacity building.• DOE (Diocese of El Obeid) runs a PHCU in Turalei Payam in Twic county • ADRA is conducting health (1 PHCC and 6 PHCU’s), education and watsan activities.• SUPRAID conducts agricultural activities, water drilling and organizes the Twic Olympics.• UNDP coordinate for UN agencies, built capacity of the national NGO and good governance especially
on returns of IDP’s.• WFP World Food Program distributes food in Twic County.• SUVAD (Sudanese Voluntary Agency for Development) deal with seed banks and food security
activities in Twic.
Health services in the Counties are well distributed, though some of the villages are distant to the locations ofthe health facilities. There are 6 PHCC’s in Twic county and 13 PHCU’s, whereas in Abyei, there is 1 PHCC and2 PHCU’s. In Twic all the payams have health facilities, whereas in Abyei, only three payams have a healthfacility. The health units offer curative services as well as some preventive health services.
Safe drinking water in the counties is provided through boreholes. There are more than 100 boreholes in Twic,while Abyei has more than 50 boreholes. The boreholes are, however, not able to cater for the population’sneeds as some of the villages are far, and populations can not access the boreholes. Open wells are alsopresent in the Counties, and swamp water is used by a large populace during the rainy season. River water isalso used in locations that are distant to the boreholes. Latrines are very few, and are mainly located in thehealth facilities, schools and NGO compounds.

6
The food security situation appeared to be poor. In Twic many households reported to have minimal sorghumstocks with a few reporting their stocks to having been depleted. Communities had already stated eating wildfoods at the time of the survey. The last distribution in most of the County had been last year in October toDecember. In Abyei, households still had sorghum stocks but they reported this would not be able to last themlong. Abyei does not receive food distributions from WFP.
.I.2. Justification for the Nutrition Survey
GOAL received informal reports that the food security and nutritional situation in their program areas of Bahr elGazaal, namely Twic and Abyei Counties, is of concern. The WFP Annual Needs Assessment 2004/5 identifiedBahr El Gazaal as an ‘at risk’ area, and likely to be in need of food aid in 2005. The local population havereported that they have had a very poor harvest this season. This has been supported by reports from the localauthorities. Food shortages were reported to be already experienced in some of the payams in Twic County.Taking the above into consideration, GOAL Ireland and ACF-USA decided to conduct a nutritional survey in thetwo Counties.
.I.3. Objectives
• To evaluate the nutritional status of children 6 to 59 months of age.• To estimate the measles immunisation coverage of children 9 to 59 months of age.• To identify groups at higher risk to malnutrition: age group and sex.• To estimate the crude mortality rate through a retrospective survey.• To assess the current food security situation within the survey area.• To assess the extent of household movement.
.I.4. Methodology
The two-stage cluster survey methodology was applied to both Counties collectively as they share similargeographical features. The 30 by 30 cluster methodology was used with 916 children being included in thesurvey. This sample size has been taken to provide the estimates of the prevalence of malnutrition with a 95%confidence interval. The design effect is 2 per default.
Data was collected in three payams of Twic County (Turalei.Ajak-kuac and Akoc Payam) and two payams ofAbyei County (Alal and Rum-Amer Payam).
In each cluster, households, which were defined as a woman and her children, were randomly selected andsurveyed. All the children between the ages of 6 to 59 months of the same family were included in the survey.
A retrospective mortality survey (over the past three months) was conducted
Household questionnaires were conducted in every five household, which focused mainly on feeding practice,water, and hygiene and food security. In addition, focus group discussions and observations were done tocapture more food security and health information.
7
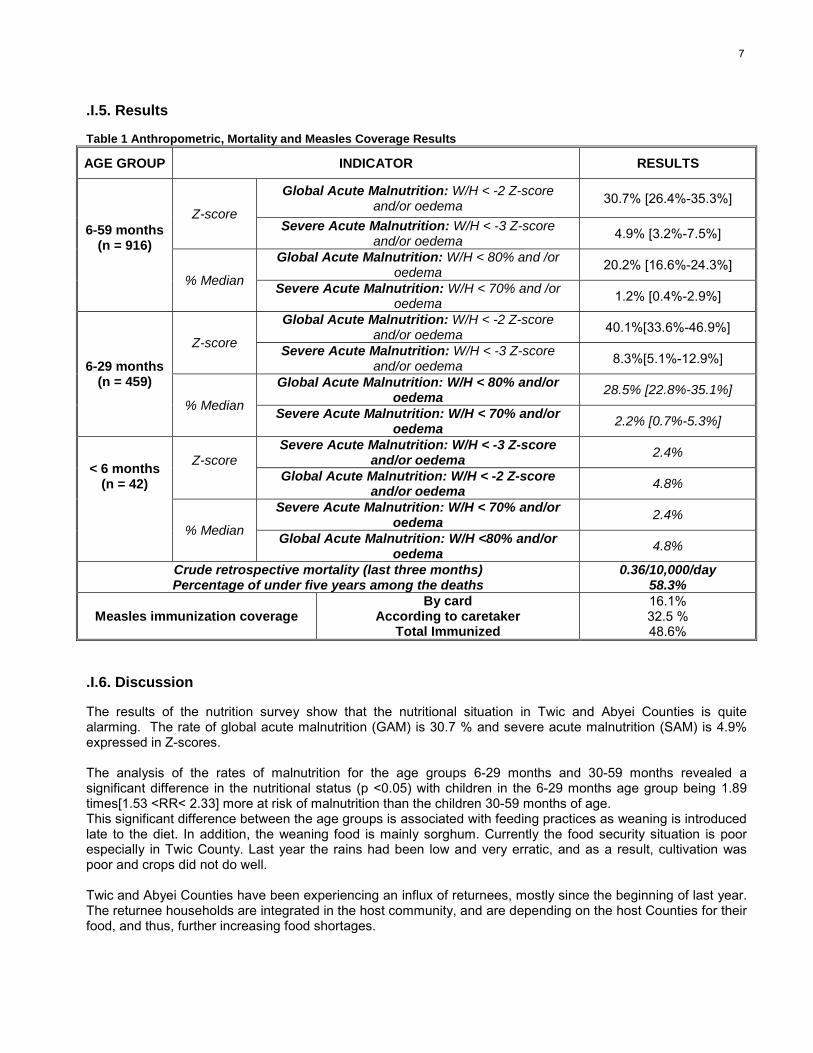
.I.5. Results
Table 1 Anthropometric, Mortality and Measles Coverage Results
AGE GROUP INDICATOR RESULTS
Global Acute Malnutrition: W/H < -2 Z-scoreand/or oedema 30.7% [26.4%-35.3%]
Z-scoreSevere Acute Malnutrition: W/H < -3 Z-score
and/or oedema 4.9% [3.2%-7.5%]
Global Acute Malnutrition: W/H < 80% and /oroedema 20.2% [16.6%-24.3%]
6-59 months(n = 916)
% Median Severe Acute Malnutrition: W/H < 70% and /oroedema 1.2% [0.4%-2.9%]
Global Acute Malnutrition: W/H < -2 Z-scoreand/or oedema 40.1%[33.6%-46.9%]
Z-score Severe Acute Malnutrition: W/H < -3 Z-scoreand/or oedema 8.3%[5.1%-12.9%]
Global Acute Malnutrition: W/H < 80% and/oroedema 28.5% [22.8%-35.1%]
6-29 months(n = 459)
% Median Severe Acute Malnutrition: W/H < 70% and/oroedema 2.2% [0.7%-5.3%]
Severe Acute Malnutrition: W/H < -3 Z-scoreand/or oedema 2.4%Z-score
Global Acute Malnutrition: W/H < -2 Z-scoreand/or oedema 4.8%
Severe Acute Malnutrition: W/H < 70% and/oroedema 2.4%
< 6 months(n = 42)
% Median Global Acute Malnutrition: W/H <80% and/oroedema 4.8%
Crude retrospective mortality (last three months)Percentage of under five years among the deaths
0.36/10,000/day58.3%
Measles immunization coverageBy card
According to caretakerTotal Immunized
16.1%32.5 %48.6%
.I.6. Discussion
The results of the nutrition survey show that the nutritional situation in Twic and Abyei Counties is quitealarming. The rate of global acute malnutrition (GAM) is 30.7 % and severe acute malnutrition (SAM) is 4.9%expressed in Z-scores. The analysis of the rates of malnutrition for the age groups 6-29 months and 30-59 months revealed asignificant difference in the nutritional status (p <0.05) with children in the 6-29 months age group being 1.89times[1.53 <RR< 2.33] more at risk of malnutrition than the children 30-59 months of age.This significant difference between the age groups is associated with feeding practices as weaning is introducedlate to the diet. In addition, the weaning food is mainly sorghum. Currently the food security situation is poorespecially in Twic County. Last year the rains had been low and very erratic, and as a result, cultivation waspoor and crops did not do well. Twic and Abyei Counties have been experiencing an influx of returnees, mostly since the beginning of last year.The returnee households are integrated in the host community, and are depending on the host Counties for theirfood, and thus, further increasing food shortages.

8
The health status of the population where diarrhoea and malaria are prevalent in the community, and theleading causes of morbidity are also associated with the high rate of malnutrition. In addition, poor healthseeking behaviour, distance to health facilities for a big part of the population, inadequate water and sanitationfacilities are also contributing factors.
In conclusion, the nutritional situation in Twic and Abyei Counties is alarming, and requires immediateemergency intervention, and in the future, long-term impact interventions to prevent recurrence of such highmalnutrition rates.
.I.7. Recommendations
Taking into consideration the analysis of the situation, ACF-USA and GOAL recommend the following:
• GOAL/ACF-USA to implement nutritional treatment programs in the location to address the high rates ofacute malnutrition and prevent mortalities, and further deterioration, especially among the children under 5years of age.
• GOAL/ACF-USA to continue monitoring the nutrition situation in both Counties, especially over the currenthunger gap.
• WFP to provide food aid to the residents of the Twic community according to their needs. • WFP, GOAL, ACF-USA to continue monitoring the food security situation.• GOAL, ADRA and DOE to consider programs/strategies to potentially increase the coverage of primary
health services in the counties.• SUPRAID, GOAL and ADRA to continue the provision of safe drinking water through drilling of more
boreholes, while ensuring even distribution, and repairing the non-functional units.• GOAL to continue offering EPI services.• GOAL to emphasize health education activities in the location, and community leaders to actively participate
in creating awareness of health seeking behavior, child feeding practice, hygiene and sanitation. • VSF to educate farmers on the pasture preservation methods.
.II. INTRODUCTION
.II.1. Context
Twic and Southern Abyei Counties are 2 out of the 12 counties located in the Bahr el Ghazal region. TwicCounty borders Abyei to the north, the Upper Nile province to the east, Gogrial County to the south, Aweil EastCounty to the west, and Leech County to the east. Abyei borders Twic, Gogrial and Aweil East Counties to thesouth, Ruweng County to the East, Aweil North County and Babunusa to the west and the Nuba Mountains tothe North.1
The two Counties share the same geographical features, and are characterized by green vegetation (RichSavannah) with fertile alluvial soil. There are 3 main rivers in the counties: rivers Lol and Lal in Twic County andriver Kiir in Abyei. Seasonal rivers cut through the Counties. Twic County is interspersed by swamp, majority ofthe population use the Lol River and its floodwaters as their primary water source. Twic County is divided into 6payams namely Wunrok, Akoch, Ajakuach, Turalei, Panyok and Aweng. Abyei has got 4 payams; Alal, Rum-Amer, Malual-aleu and Ameth-Aguok.
1 Starbase report 2004

9
Southern Abyei has not had many NGO’s intervening, as it is considered a frontline to Northern Abyei, which isunder the control of the Government of Sudan (GoS). Due to this, GoS had not opened up the area to agencies,until 2004. The inhabitants of the two Counties are predominantly Dinka: in Twic - Dinka Twic, and in Abyei - theDinka ngok. The population of Twic and Abyei counties is estimated at 105,000 and 25,000 respectively.
.II.2. Security
No security incidents have been reported in Abyei in the recent past. The last insecurity incident was reportedonly in Aweil west (Akoch) that borders Abyei.
In Twic, insecurity incidents have been reported with the most recent having occurred in February and March2005 in Akoch Payam and Mayenabun in Wunrok Payam of Twic County. The two locations were still level 4 atthe beginning of the survey, but Akoch had its level lowered during the survey period.
.II.3. Internally Displaced Persons (IDP’s) and Returnees Population
An influx of returnees is being experienced from the North (Khartoum) since the beginning of 2004. The relativepeace and stability throughout the Bahr-el-Ghazal region (BEG) has encouraged IDP’s and returnees to returnback to their places of origin. According to the Sudan Relief and Reconstruction Committee (SRRC),approximately 50,000 people had returned to the BEG region, primarily to the Southern areas of Aweil East andWest, Twic and Gogrial.2 As of July 2004, 23,4743 returnees had been registered in Twic County. In Abyei11,931 returnees were registered in 2004.
.II.4. Trade
Trading is significant in both Twic and Abyei Counties. The main market in Twic is Abindou in Wunrok Payam.Goods from the North are taken there first as the market serves as a whole sale market. Access to externalmarket is significant and products are imported from Abyei town (north), Warwar (Aweil east) and Mayen marketin Gogrial County. The largest market in the county however, is in Turalei which is the headquarters of thecounty and which is a retail market. There are smaller markets in all the other payams, which, trade in livestock,fish, grain, tobacco, tea, sugar, and soap.
In Abyei, there is one main market in Abyei town (Southern), and goods mainly come form Abyei town (GoS)and Khartoum. It serves both as wholesale and retail.
Bartering is the main form of the medium of exchange for trade, with cattle and crop produce being exchangedfor grains and other items such as tea, sugar, and soap. Sorghum is the most critical item of trade, and themarket price fluctuates depending on sorghum availability (ANA 2002/2003). Similarly, livestock sales andexchange also have an important role in the market, with cattle often being exchanged for food. The currencyused in the markets is the Sudanese Dinar.
Food stuffs available in the market include sorghum, lentils, rice, fish, groundnuts and oil. (A list of all the foodstuffs and non-foodstuffs available in the market is provided in appendix 4). Trade in the Counties, therefore,serves to boost the food security. However, affordability of most of the foodstuffs is limited to mostly the wealthyin the community who form the minority.
2 ANA 2004-53 Figures as given by ACAD

10
.II.5. Agriculture and Food Security
Twic County lies in the flood plains agro-ecological zone, and receives extensive seasonal flooding from thetributaries of the Nile. The county has low-lying wetlands along the rivers Lol and Alal, a forest between the tworivers, and highlands north of the river Alal. Ajak Kuac Payam has two sorghum crops in a year, and is rankedbest in crop production, while the rest of the payams have only one crop.4 The lowlands generally have betteryields than the highlands, but almost every year, water logging or floods reduce production. The wet lowlandsare a major source of fish and water lily and the forests and highland offer most of the wet season grazinggrounds and other wild fruits.
Abyei is characterized by green vegetation (Rich Savannah) with fertile alluvial soil. This has encouragedcommunities from Twic, Gogrial and Aweil East Counties to migrate and cultivate in the area. Twic County lies inthe flood plains agro-ecological zone, and receives extensive seasonal flooding from the tributaries of the Nile.The two main rivers crossing the county (the lal and Lol) make Twic one of the leading fish producing counties insouthern Sudan. There is forest between the rivers, and high ground north of the river Alal. The low lyingswampy areas, locally known as toic, are rich fishing grounds, rich in wild foods and provide grazing in the dryseason.5
The climate is characterized by a wet season from April until September, with a dry spell in June. Floodingbegins October to February, the dry season from March to April, while heavy rainfalls from July and August.Abyei cultivates twice, with the planting seasons being in May-June and harvest in September and secondplanting is in September and harvest in December- January. In Twic, the planting season is only once in May-June with the harvesting in September. The hunger gap in both counties takes place from April to July.
The populations of Twic and Abyei are agro-pastoralist, and the formers population depends on sorghum,maize, sesame, cowpeas, fish and beans. Rice is also produced, but in a very small quantity for householdconsumption. In Abyei, the population depends on sorghum, simsim, and fish. On average, people cultivate on 1feddan6 of land per person.
In case of food shortage especially during the hunger gap, the community has the following coping mechanisms:- Sale or barter of animals (cows, goat and chicken) for sorghum. - Collecting and eating wild fruits and vegetables (lalop, thou-desert dates, tuk-palm fruit, gor and kei
water lily root and seed, respectively, cuei tamarind and akuadha wild rice).- Eating Eggs.- Dependence on WFP distributions (in Twic County only).- Kinship.- Buying from market.
Livestock is a major source of food; the community keeps cattle, shoats and chicken. The peaceful environmentover the last few years facilitated restocking. VSF-CH is actively involved in the process, but mainly of goats.The reported current status of livestock ownership is: rich –100, middle 30 – 40 and poor 0-10 cows.
In the month of February, cattle are usually moved to the toic, which is 2-3 kilometers away, although, milkingcows are left to drink spill offs from water points. Currently, there is not enough pasture. Twic is a swamp, andduring the dry season, other counties bring their cattle to Twic for grazing, and therefore, the pasture becomesinadequate in quantity for the Twic cattle. In addition, burning grass as a way to enhance the growth of newgrass decreases the amount of available grass. Currently, the cows are estimated to be producing half a liter ofmilk per cow.
Most households in Twic County rely on fish during the peak fishing season, the only exception being Ajak KuacPayam, which has few rivers. Of the 2004 food basket, fish production was projected to contribute some 10-
4 Starbase report 20045 Starbase report 20046 1 Feddan is approximately equal to 60 * 70 m².
11
15%, and 5-20% for the poor and better-off groups respectively7. When rainfall is good and floods occur, thecommunity is reported to be able to fish for 9 months continuously. On the other hand, the Abyei population donot practice fishing, but buy from Twic County or from the market.
Taking the above-mentioned into consideration, therefore, Twic and Abyei Counties have the capacity to befood secure if conditions that include rainfall, climate and good farming practices are in place. In the current andpast year, however, this has not been the case as rains were erratic and minimal. The Counties are, thus, foodinsecure currently, with many households reporting to have minimal sorghum stocks with a number alreadyhaving depleted their stocks.
.II.6. Health
There are 3 agencies offering health services in Twic and Abyei counties namely GOAL, ADRA and DOE. GOAL runs PHCCs and PHCU’s and other services that include water and sanitation, health and hygiene(awareness campaign), MCH (maternal and child health), Malaria control (distribution of bed nets) andHIV/AIDS campaign. It has 5 Primary Health Care Centres (PHCC’s) and 8 Primary Health Care Units (PHCU’s)in both counties. The health facilities offer both preventive and curative services. Medical officers run the healthcenters with the assistance of other primary health care personnel. GOAL also offers outreach services forhealth education, as well as EPI services, and implements mass measles immunization during reportedoutbreaks.
ADRA runs 1 PHCC and 6 PHCU’s in Twic only, manned by Sudanese medical assistants. The facilities offerpreventive, curative and have diagnostic services. UNICEF provides PHCU kits and vaccines for the ADRAhealth facilities. EPI services are also offered in the centers, and in the schools also run by the agency; trainingson health education to include HIV/AIDS are included in the curriculum for upper school pupils. The healthcenters also offer health education sessions every morning. ADRA has been running a guinea wormprogramme before and is also proposing to open a trachoma programme.
DOE (Diocese of El-Obeid) runs a PHCC in Turalei payam in Twic County. The health center offers bothpreventive (including MCH) and curative services and is run by missionary sisters who are well trained inmedicine. The center offers minor and major surgical services twice yearly, performed by MSF (“doctors withoutborders”) personnel. The center is currently working on a proposal to have a resident doctor.
Health services in the counties are well distributed, though some of the villages are distant to the locations of thehealth facilities. There are 6 PHCC’s in Twic county and 13 PHCU’s, enabling coverage of the entire county,whereas in Abyei there is 1 PHCC and 2 PHCU’s located in only 3 payams.
Health seeking behavior in both counties was reported to be below satisfactory by all the agencies. Most of thecommunity seek other traditional means of treatment first, and only go to the health facilities when healthconditions are at advanced stages. However, through the influence of returnees from the North, the number ofthose seeking care from the health facilities is reportedly increasing.
Common diseases reported by all the health facilities as having high prevalence are: malaria, diarrhoea andRTI’s (Respiratory tract infections). Other reported conditions, though at a lower magnitude, include STD’s,trauma, intestinal worms, eye and skin problems.
Health services in the counties are, therefore, adequate in regard to quality; however, the health facilities are stillinaccessible to a large populace due to distance. In addition, the poor health seeking behavior and practices ofthe communities who do not utilize the health facilities appropriately limits the impact potential of the PHCservices available.
7 Starbase report 2004
12
.II.7. Water and Sanitation
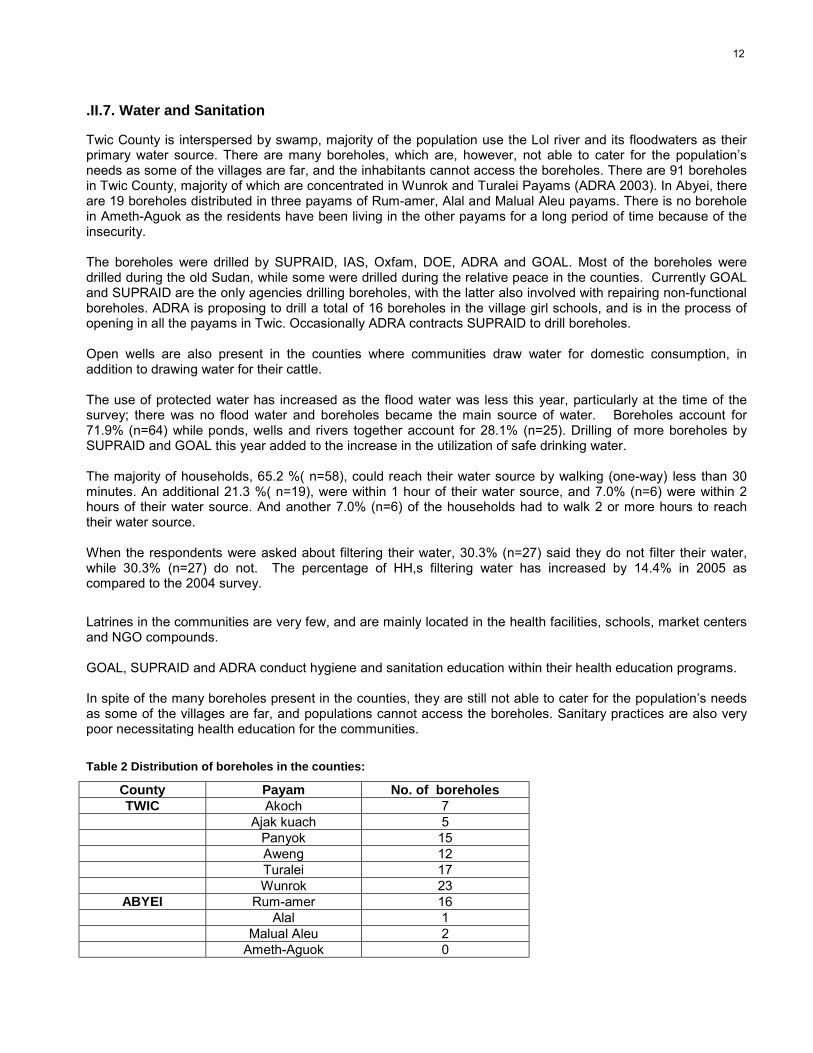
Twic County is interspersed by swamp, majority of the population use the Lol river and its floodwaters as theirprimary water source. There are many boreholes, which are, however, not able to cater for the population’sneeds as some of the villages are far, and the inhabitants cannot access the boreholes. There are 91 boreholesin Twic County, majority of which are concentrated in Wunrok and Turalei Payams (ADRA 2003). In Abyei, thereare 19 boreholes distributed in three payams of Rum-amer, Alal and Malual Aleu payams. There is no boreholein Ameth-Aguok as the residents have been living in the other payams for a long period of time because of theinsecurity.
The boreholes were drilled by SUPRAID, IAS, Oxfam, DOE, ADRA and GOAL. Most of the boreholes weredrilled during the old Sudan, while some were drilled during the relative peace in the counties. Currently GOALand SUPRAID are the only agencies drilling boreholes, with the latter also involved with repairing non-functionalboreholes. ADRA is proposing to drill a total of 16 boreholes in the village girl schools, and is in the process ofopening in all the payams in Twic. Occasionally ADRA contracts SUPRAID to drill boreholes.
Open wells are also present in the counties where communities draw water for domestic consumption, inaddition to drawing water for their cattle.
The use of protected water has increased as the flood water was less this year, particularly at the time of thesurvey; there was no flood water and boreholes became the main source of water. Boreholes account for71.9% (n=64) while ponds, wells and rivers together account for 28.1% (n=25). Drilling of more boreholes bySUPRAID and GOAL this year added to the increase in the utilization of safe drinking water.
The majority of households, 65.2 %( n=58), could reach their water source by walking (one-way) less than 30minutes. An additional 21.3 %( n=19), were within 1 hour of their water source, and 7.0% (n=6) were within 2hours of their water source. And another 7.0% (n=6) of the households had to walk 2 or more hours to reachtheir water source.
When the respondents were asked about filtering their water, 30.3% (n=27) said they do not filter their water,while 30.3% (n=27) do not. The percentage of HH,s filtering water has increased by 14.4% in 2005 ascompared to the 2004 survey.
Latrines in the communities are very few, and are mainly located in the health facilities, schools, market centersand NGO compounds.
GOAL, SUPRAID and ADRA conduct hygiene and sanitation education within their health education programs.
In spite of the many boreholes present in the counties, they are still not able to cater for the population’s needsas some of the villages are far, and populations cannot access the boreholes. Sanitary practices are also verypoor necessitating health education for the communities.
Table 2 Distribution of boreholes in the counties:
County Payam No. of boreholesTWIC Akoch 7
Ajak kuach 5Panyok 15Aweng 12Turalei 17Wunrok 23
ABYEI Rum-amer 16Alal 1
Malual Aleu 2Ameth-Aguok 0

13
.II.8. Education
ADRA and DOE run schools in Twic County. ACAD with the funding grant from USAID support schools in Abyei.ADRA runs 65 primary community schools that are distributed in all the payams and also sponsors training forteachers for 9 months. The agency supplies school materials and uniforms to the schools. In addition, theschools offer adult education classes and an intensive English course for women.
Enrolment in the schools is high with 18 000 registered pupils in 2004. ADRA is promoting girl child education,and is currently proposing to open a total of 16 schools for girls exclusively, at least 2 in each payam.
DOE is running 2 primary schools in Turalei payam. Currently the schools have an enrolment of over 300 pupils.Adult education is also offered in the schools. DOE is in the process of establishing a secondary school.
School feeding is implemented by WFP in 52 of the schools that have met the criteria of having more than threeclassrooms, a toilet and storage facilities.
Table 3 Organizations intervening in Twic/Abyei Counties
Agency Activities
ADRA Health: (1 PHCC and 6 PHCUs), Education: Training of teachers;
SUPRAID Agriculture: Agriculture; Water; Twic Olympics (Sports for Peace)
GOAL Health services, Nutrition, Watsan, Health & hygiene education, Malaria control,HIV/AIDs
UNDP Coordinate for UN agencies, built capacity of the national NGO and good governanceespecially on returns of IDPs.
WFP Food Security: Food Aid
UNICEF Provides PHCU kits and vaccines to ADRA
DOE Health services
Mercy Corps Food security: Diversification of crops, crop husbandry, integrated pest management,farming techniques, capacity building.
VSF-CH Livestock: Veterinary animal restocking and capacity building.
ADRA Education, do not support Abyei anymore; they are in Twic County currently.
IAS Water and sanitation
ACAD Peace keeping, education, maintenance of boreholes, food security through FAO(distribution of seeds and tools).
SUVAD Deals with seed banks and food security activities in Twic.
WVI, ACF-USA Non Food Items to IDP’s-this was distributed in response to an assessment done byWFP in Dec 2003.

14
.III. METHODOLOGY
The survey was conducted from 28th March to 13th April 2005 in Twic and Abyei counties of Bahr-el-Gazal.Population figures were estimated at 47,262 persons; the number of children under the age of five years wasestimated at 9,453 (20% of the entire population)8. Three payams of Twic County (Turalei.Ajak-kuac and Akocpayam) and two payams of Abyei County (Alal and Rum-Amer payam) were included in the survey.
.III.1. Type of Survey and Sample Size
Based on the population figures used by Carter Center for guinea worm campaign, a two-stage cluster surveymethodology was applied to both counties collectively as they share similar geographical features. The 30 by 30cluster methodology was used. This sample size has been taken to provide the estimates of the prevalence ofmalnutrition with a 95% confidence interval.
In each cluster, households, which were defined as a woman and her children, were randomly selected andsurveyed. All the children between 6 to 59 months of age belonging to the same family were included in thesurvey.
A retrospective mortality survey (over the past three months) was concurrently conducted.
Household questionnaires focusing on feeding practice, water, and hygiene and food security were applied in 89households. Focus group discussions and observations were done to capture food security and healthinformation.
.III.2. Sampling Methodology
In the anthropometric survey, a two-stage cluster sampling was used:
• At the first stage, 30 clusters were randomly selected from the list of the villages within the selectedpayams. (see appendix 2 for village list and estimated population). The probability of selection wasproportional to the village population size. Each cluster included 30 or more children.
• At the second stage, i.e. the selection of the households within each cluster, the standard EPImethodology was used: a pen was spun while being at the central point of the selected cluster,defining a random direction. All the children 6-59 months of age belonging to the same householdsencountered in that direction were measured. A household was defined as a group of people whoshared a ‘cooking pot’.
In the household survey, systematic sampling was used with every 5th household visited, being interviewedregardless of whether there were any eligible survey children in the household.
8 Population figures based on Carter Center data for guinea worm

15
.III.3. Data Collection
During the anthropometric survey, for each selected child 6 to 59 months of age, the following informationwas recorded (See appendix 3 for the anthropometric questionnaire):
• Age: recorded with the help of a local calendar of events (See appendix 4 for the calendar ofevents).
• Gender: male or female. • Weight: children were weighed without clothes, with a SALTER weighing scale of 25kg (precision of
100g).• Height: children were measured on a measuring board (precision of 0.1cm). Children less than
85cm were measured lying down, while those greater than or equal to 85cm were measuredstanding up.
• Mid-Upper Arm Circumference: MUAC was measured at mid-point of left upper arm for measuredchildren (precision of 0.1cm).
• Bilateral oedema: assessed by the application of normal thumb pressure for at least 3 seconds toboth feet.
• Measles vaccination: assessed by checking for measles vaccination on EPI cards and askingcaretakers.
• Household status: for the surveyed children, households were asked if they were permanentresidents, temporarily in the area, or displaced.
During the retrospective mortality survey in all the visited households, including where there were nochildren less than five years old, the teams asked for the number of household members alive per agegroups, the number of people present within the recall period, the number of deaths and births over the lastthree months and if any, the presumed cause of death, and the number of persons who left or arrived in thelast three months. (See appendix 5 for the mortality questionnaire).
During the household survey, in all the visited households information was collected on the following areas:• Household demography• Feeding patterns• Livestock and cattle holdings• Crop planting and harvesting• Land cultivated• Income sources• Water sources• Hygiene practices• Health seeking behaviour• Household food security• Normal diet at this period of the year• Meals taken per day• Coping mechanism

16
.III.4. Indicators, Guidelines, and Formula’s Used
.III.4.1. Acute Malnutrition
Weight for Height IndexFor the children, acute malnutrition rates were estimated from the weight for height (WFH) index valuescombined with the presence of oedema. The WFH indices are compared with NCHS9 references. WFH indiceswere expressed in both Z-scores and percentage of the median. The expression in Z-scores has true statisticalmeaning and allows inter-study comparison. The percentage of the median on the other hand is commonly usedto identify eligible children for feeding programs.
Guidelines for the results expressed in Z-scores:• Severe malnutrition is defined by WFH < -3 SD and/or existing bilateral oedema on the lower limbs of the
child.• Moderate malnutrition is defined by WFH < -2 SD and ≥ -3 SD and no oedema.• Global acute malnutrition is defined by WFH < -2 SD and/or existing bilateral oedema.
Guidelines for the results expressed in percentage according to the median of reference:• Severe malnutrition is defined by WFH < 70 % and/or existing bilateral oedema on the lower limbs.• Moderate malnutrition is defined by WFH < 80 % and ≥ 70 % and no oedema.• Global acute malnutrition is defined by WFH <80% and/or existing bilateral oedema.
Children’s Mid-Upper Arm Circumference (MUAC)The weight for height index is the most appropriate index to quantify wasting in a population in emergencysituations where acute forms of malnutrition are the predominant pattern. However, the mid-upper armcircumference (MUAC) is a useful tool for rapid screening of children at a higher risk of mortality. The MUAC isonly taken for children with a height of 75cm and more. The guidelines are as follows:
MUAC < 110 mm severe malnutrition and high risk of mortality MUAC ≥ 110 mm and <120 mm moderate malnutrition and moderate risk of mortalityMUAC ≥ 120 mm and <125 mm high risk of malnutritionMUAC ≥ 125 mm and <135 mm moderate risk of malnutritionMUAC ≥ 135 mm ‘adequate’ nutritional status
.III.4.2. Mortality
The crude mortality rate (CMR) is determined for the entire population surveyed for a given period. The CMR iscalculated from the death rate for the entire population (DR).
The formulas are as follows:
Death Rate (DR) = n / [((n+M1) + M2) / 2]Where n = number of deaths within a given period
M1 = number of persons alive over a given periodM2 = number of persons alive at the time of the survey
Crude Mortality Rate (CMR) = (DR x 10,000) / number of days in the period. The period corresponds to 3months (90 days) preceding the survey.
Therefore, CMR = (DR x 10,000) /90. It is expressed per 10,000-people / day.
9 NCHS: National Center for Health Statistics (1977) NCHS growth curves for children birth-18 years. United States. VitalHealth Statistics. 165, 11-74.

17
The thresholds are defined as follows10:
Alert level: 1/10,000 people/dayEmergency level: 2/10,000 people/day
The proportion of deaths within the past three months among the under five years old is also calculated.
.III.5. Field Work
All the surveyors participating in the survey underwent a 5 day training, which included a pilot survey. Six teamsof three surveyors each executed the fieldwork. ACF-USA and GOAL staff supervised all the teams in thevillages. The survey, including the training, lasted for a period of 18 days.
.III.5.1. Constraints Encountered During Implementation
• Methodology: The list of villages in both Abyei and Twic was quite extensive with over 700 villages inboth counties. It was, therefore, difficult to cluster the villages, and grouping the villages proximal toeach other, and in the same direction, then clustering the village groups was employed.
• Security: In the period prior to the survey, 2 locations including one of the targeted payams for surveyhad experienced insecurity incidents; security level was raised to level 4 in Akoch Payam, but was liftedthe day before the team moved to the location.
.III.6. Data Analysis
Data processing and analysis were carried out using EPI-INFO 5.0 software, EPINUT 2.2
10 Health and nutrition information systems among refugees and displaced persons, Workshop report on refugee’s nutrition,ACC / SCN, Nov 95.

18
.IV. RESULTS
A total of 920 children were measured but due to some aberrant data the measurements of 916 children onlywere included in the analysis.
.IV.1. Distribution by Age and Sex
Table 4 Distribution of the sample by age and sex
BOYS GIRLS TOTALAGE(In months) N % N % N %
SexRatio
06 – 17 100 49.0 104 51.0 204 22.3 0.9618 – 29 128 50.2 127 49.8 255 27.8 1.0130 – 41 98 46.0 115 54.0 213 23.3 0.8542 – 53 85 49.4 87 50.6 172 18.8 0.9854 – 59 38 52.8 34 47.2 72 7.9 1.12Total 449 49.0 467 50.1 916 100 0.96
The distribution of the sample by gender shows there are slightly more girls than boys. The sex ratio, however,is equal to 0.96, indicating a random selection of the sample.
Figure 1 Distribution of the sample by age and sex
The results show a slight imbalance in age distribution, which may, however, also be the result of the difficultyfor caretakers in precisely determining the age (there is no official registration).
-60% -40% -20% 0% 20% 40% 60%
Percentage
06'-17
18-29
30-41
42-53
54-59
Age in mont
Distribution by Age and Sex, Twic/Abyei April 2005
Boys
Girls

19
.IV.2. Anthropometric Analysis
.IV.2.1. Acute Malnutrition
Distribution of Malnutrition in Z-Score for Children ages 6-59 monthsThe distribution of acute malnutrition in Z-scores shows that the global acute malnutrition is 30.7% with 4.9% ofthe children being severely malnourished and 25.8% moderately malnourished.
Table 5 Weight for Height Distribution by age in Z-scores
AGE(in months) Total < -3 SD ≥ -3 SD & < - 2 SD ≥ -2 SD Oedema
N N % N % N % N %06-17 204 19 9.3 66 32.4 119 58.3 0 0.0
18-29 255 19 7.5 80 31.4 156 61.2 0 0.030-41 213 6 2.8 34 16.0 173 81.2 0 0.042-53 172 1 0.6 44 25.6 127 73.8 0 0.054-59 72 0 0.0 12 16.7 60 83.3 0 0.0
TOTAL 916 45 4.9 236 25.8 635 69.3 0 0.0
Table 6 Weight for Height vs. Oedema in Z-score
Presence of Oedema < -2 SD ≥ -2 SDMarasmus/Kwashiorkor Kwashiorkor
YES 0 0.0% 0 0.0%
Marasmus Normal
NO 281 30.7% 635 69.3%
No case of oedema – Marasmus/Kwashiorkor was found in the sample.
Figure 2 Z-scores distribution Weight-for-Height, Twic/Abyei
Weight for Height distribution in Z-scores Twic/Abyei 2005
-5
0
5
10
15
20
25
-6 -4 -2 0 2 4 6
ReferenceSex Combined

20
A displacement of the sample curve to the left of the reference curve is observed, indicating a poor nutritionalsituation among the target population. The mean Z-Scores of the sample, – 1.52 (SD: 1.00), indicates an under-nourished population.
Table 7 Global and Severe Acute Malnutrition by Age Group in Z-scores
Statistically, there is a significant difference between the malnutrition rates observed among the children 6-29months and 30-59 months of age(p < 0.05). Children 6-29 months of age present 1.89 [1.53<RR<2.33] morerisk of being malnourished than the children 30-59 months of age.
Table 8 Nutritional Status in Z-scores by gender
Boys GirlsNutritional status Definition N % N %
Severe malnutrition Weight for Height < -3 SD or oedema 24 5.3 21 4.5
Moderatemalnutrition -3 SD ≤ Weight for Height < -2 SD 138 30.7 98 21.0
Normal Weight for Height ≥ -2 SD 287 63.9 348 74.5Total 449 49.0 467 51.0
There is a statistical significance between the malnutrition rates observed among boys and girls (p< 0.05). Theanalysis shows that boys are 1.42 [1.23RR<1.73] more at risk of malnutrition than girls.
Distribution of Malnutrition in percentage of the Median for children 6-59 months of ageThe distribution of acute malnutrition in percentage of the median reveals a global acute malnutrition rate of20.2%: 1.2% of the children were severely malnourished and 19.0% were moderately malnourished.
Table 9 Weight/Height: Distribution by Age in percentage of median
AGE(In months) < 70% ≥ 70% & < 80% ≥ 80% Oedema
N N % N % N % N %06-17 204 4 2.0 59 28.9 141 69.1 0 0.018-29 255 6 2.4 62 24.3 187 73.3 0 0.030-41 213 1 0.5 26 12.2 186 87.3 0 0.042-53 172 0 0.0 21 12.2 151 87.8 0 0.054-59 72 0 0.0 6 8.3 66 91.7 0 0.0
TOTAL 916 11 1.2 174 19.0 731 79.8 0 0.0
Table 10 Weight for Height vs. oedema in percentage of median
Presence of oedema < -2 SD ≥ -2 SDMarasmus/Kwashiorkor Kwashiorkor
YES 0 0.0% 0 0.0%Marasmus Normal
NO 185 20.2% 731 79.8%
6-59 months (N =916) 6-29 months (N =459)Global acute malnutrition 30.7 % [26.4%-35.3%] 40.1% [33.6%-46.9%]Severe acute malnutrition 4.9 % [3.2% - 7.5%] 8.3% [5.1%-12.9%]

21
No case of oedema – Marasmus/Kwashiorkor was found in the sample
Table 11 Global and Severe Acute Malnutrition by Age Group in Percentage of Median
6-59 months (n =916) 6-29 months (n =459)
Global Acute Malnutrition (GAM) 20.2% [16.6%-24.3%] 28.5% [22.8-35.1%]
Severe Acute Malnutrition (SAM) 1.2% [0.4%-2.9%] 2.2% [0.7%-5.3%]
According to weight for height in percentage of the median, there is a significant statistical difference betweenthe malnutrition rates observed among the children 6-29 months and 30-59 months of age (p < 0.05). Children6-29 months of age present 2.42 [1.81<RR<3.23] more risk of being malnourished than the children 30-59months of age.
Nutritional Status of Children below 6 months of age77 children below 6 months of age were present in the households at the time of the survey. Only 42 of thechildren were measured in order to determine their nutritional status; some caretakers did not accept theirchildren to be measured. 39 (50.6%) of the all the children below 6 months of age were boys, and 38 (49.4%)were girls.
Table 12 Age distribution of the under six monthsAge in month N %
1 25 32.5%2 16 20.8%3 14 18.2%4 8 10.4%5 14 18.2%
Total 77 100%
No child below 49cm height was found, so all the records were analyzed through the NCSH reference tables.
According to the Weight for Height index, for 42 infants measured in both Z-scores and percentage of themedian, there were two (4.8%) moderately malnourished children, and one (2.4%) severely malnourished infant.The nutritional situation of the children under the age of 6 months is considered as generally good as 92.9% hadgood nutritional status.
Feeding PractisesAbout 37.7% of the mothers who had children less than six months of age had breastfed, but had also begunweaning, mainly with cow’s milk and porridge. 62.3% of the children were being exclusively fed.
Table 13 Feeding practices
Feeding practices Frequency Percentage
Exclusive breastfeeding 48 62.3%
Mixed feeding (breast milk and weaning food) 29 37.7%
Total 77 100%

22
.IV.2.2. Risk of Mortality: Children’s MUAC
As MUAC overestimates the level of under nutrition in children less than one year old, the analysis refers only tochildren having height equal to or greater than 75cm. A total of 760 children were, therefore, included in theanalysis.
Table 14 MUAC distribution according to nutritional status
Total 75 – 90 cm height ≥ 90 cm heightCriteria Nutritional
status N % N % N %
< 110 mm Severemalnutrition 3 0.4 3 1.0 0 0.0
110 mm ≥ MUAC < 120 mm Moderatemalnutrition 22 2.9 18 6.1 4 0.9
120 mm ≥ MUAC < 135 mm At risk ofmalnutrition 195 25.7 127 49.8 68 14.6
MUAC ≥ 135 mm Normal 540 71.1 147 49.8 393 84.5
TOTAL 760 100.0 295 100.0 465 100.0
MUAC measurements revealed that 0.4% of the measured children were severely malnourished, i.e. at high riskof mortality, while 2.9% were moderately malnourished, and 25.7% at risk of malnutrition. 71.1% had goodnutritional status.
.IV.3. Measles Vaccination Coverage
The regular EPI services administers measles vaccination to children from the age of nine months; therefore,only the children ages 9-59 months (852 children) were included in this analysis.
Table 15 Measles vaccination coverage
Measles Vaccination N %According to the EPI card 139 16.3%According to the caretaker 277 32.5%
Not immunized 436 51.2%Total 852 100%
The results reveal fair coverage of measles vaccination compared to other parts of South Sudan, but poor ascompared to SPHERE standards of 95% coverage.

23
.IV.4. Household Status
The information on the residential status was collected from 603 caretakers during the anthropometric survey.
Table 16 Household Status
Residential status N %Residents 536 88.9%
Internally Displaced 27 4.5Temporarily residents 40 6.6%
Total 603 100%
The average number of children under 5 years of age per household was 1.68 (SD 0.82), while the averagenumber of persons above 5 years of age was 4.83 (SD 2.09).
.IV.5. Mortality Rate
The crude mortality was calculated from the figures collected from all visited households, whether or not theyhad children under the age of 5. There were 935 children under 5 years of age alive at the time of the survey, aswell as 2,693 above the age of 5 years, meaning a total of 3628 individuals alive. The under 5 years of agegroup represented 25.8% of the population.
A total of 12 deaths were reported within the preceding three months, among who 7 (58.3%) were below 5yearsof age.
Over the three months preceding the survey, the following demographic changes were observed during theparticular period:
• 40 births;• 124 persons had arrived in the location;• And 122 people had left the location.
At the beginning of the recall period, the total population was then 3598.
Death Rate (DR) = 12/[((3598+3628)/2] = 0.000332Crude Mortality Rate (CMR) = [0.003305 x 10,000]/90 people/day = 0.36
According to the above formula, the crude mortality rate is 0.36/10,000/day.
24
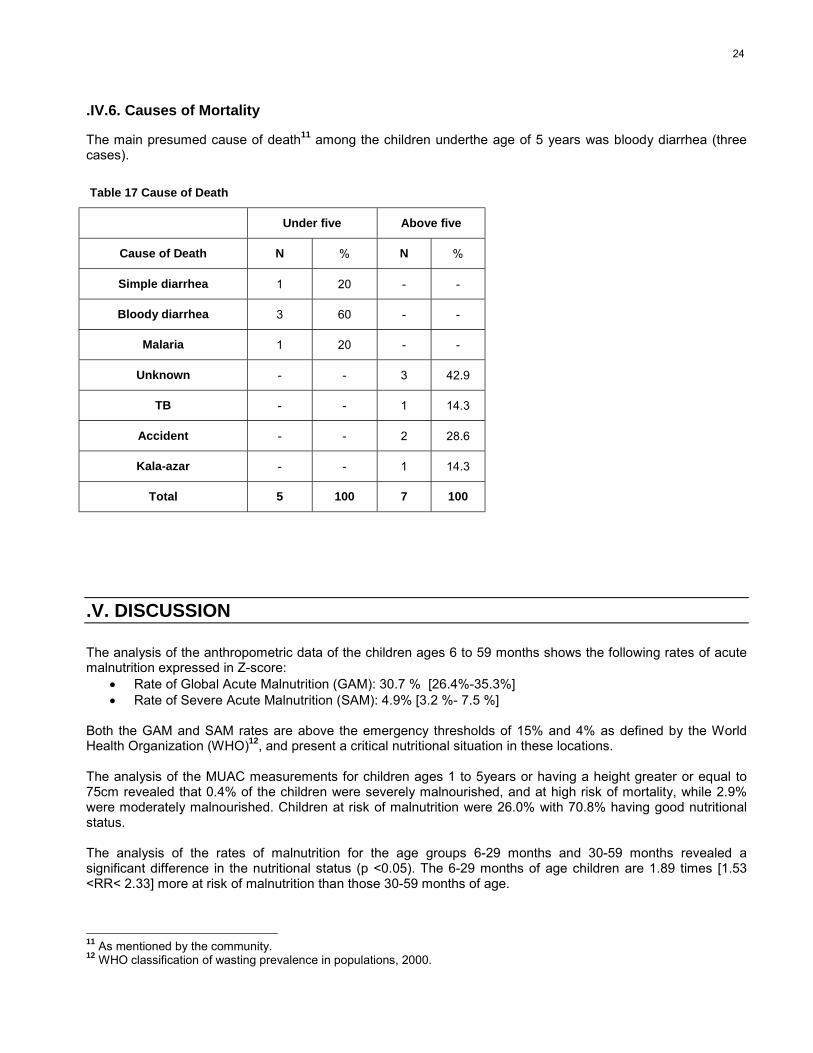
.IV.6. Causes of Mortality
The main presumed cause of death11 among the children underthe age of 5 years was bloody diarrhea (threecases).
Table 17 Cause of Death
Under five Above five
Cause of Death N % N %
Simple diarrhea 1 20 - -
Bloody diarrhea 3 60 - -
Malaria 1 20 - -
Unknown - - 3 42.9
TB - - 1 14.3
Accident - - 2 28.6
Kala-azar - - 1 14.3
Total 5 100 7 100
.V. DISCUSSION
The analysis of the anthropometric data of the children ages 6 to 59 months shows the following rates of acutemalnutrition expressed in Z-score:
• Rate of Global Acute Malnutrition (GAM): 30.7 % [26.4%-35.3%]• Rate of Severe Acute Malnutrition (SAM): 4.9% [3.2 %- 7.5 %]
Both the GAM and SAM rates are above the emergency thresholds of 15% and 4% as defined by the WorldHealth Organization (WHO)12, and present a critical nutritional situation in these locations. The analysis of the MUAC measurements for children ages 1 to 5years or having a height greater or equal to75cm revealed that 0.4% of the children were severely malnourished, and at high risk of mortality, while 2.9%were moderately malnourished. Children at risk of malnutrition were 26.0% with 70.8% having good nutritionalstatus.
The analysis of the rates of malnutrition for the age groups 6-29 months and 30-59 months revealed asignificant difference in the nutritional status (p <0.05). The 6-29 months of age children are 1.89 times [1.53<RR< 2.33] more at risk of malnutrition than those 30-59 months of age.
11 As mentioned by the community. 12 WHO classification of wasting prevalence in populations, 2000.

25
The crude mortality rate, 0.36/10,000/day, is below the alert level of 1/10,000/day13. More than half (58.3%) ofthe individuals who died during the three months preceding the survey were children under 5 years of age (7 outof 12 cases). The main presumed cause of death14 for them is bloody diarrhoea followed by simple diarrhoeaand malaria. Among the children above 5 years of age, the main presumed cause of death was accidents, whileTB and Kala-azar ranked next.
The reported high malnutrition might be explained by the following factors:
Food insecurity• The food security situation is, at present, precarious especially in Twic County. Last year the rains were
poor and erratic resulting in poor yield. The community reported that last seasons harvest was belowaverage with many of the households reported to be running out of food stocks. In some of thehouseholds visited in Twic, people had already started eating wild food. Of the surveyed householdsonly 71.0% reported that they had planted crops last season. Out of this, 51.0 % reported that they hadharvested less crops than the previous year and 28.1% reporting a harvest of less than half that of lastyear. The last food distribution was reported to have been in October/December 2004. Few of thehouseholds (34.0%) reported to have received a general ration.
• Lack of flooding due to the low rains has been associated with the food shortage. Flooding is vital as itacts as a source of fish for most of the community who are distant to the rivers or who cannot afford tobuy from the markets.
• Currently, most cattle had been taken to the toic with only a few milking cows left. Pasture for theremaining cattle is also minimal because of overgrazing from animals from other counties. According toANA, the concentration of large herds of cattle was likely to lead to overgrazing, completion andpotential conflict over the scarce resources. The milking cows are, therefore, not able to produce a lot ofmilk; a cow was reported to be producing on average only half a liter of milk. Of the interviewedhouseholds regarding the consumption of milk by children under the age of 5 years the day before thesurvey, only 27.0% reported to having given milk, whereas 73% reported a shortage of milk to be thelimiting factor.
Returnees/Kinship ties:• Twic and Abyei Counties have been experiencing an influx of returnees since the beginning of last
year. A total of 23,474 returnees have been reported in Twic, and 11,931 in Abyei in 2004. Proximityto the North (Khartoum) makes the counties the entry points for many of the returnees coming fromthe Northern side. The returnee households are integrated in the host community, and depend on thehost counties for their food, thus, increasing the food demand. According to ANA, the influx ofreturnees and low and erratic rainfall were anticipated to undermine the food security situation inBahr-el-Ghazal in SPLM/A areas.15
Feeding and childcare practices• Of the surveyed households, 81% household’s survey reported eating two meals per day, while 19.0%
reported eating one meal per day. Complimentary foods were introduced by most caretakers (58.4%)after the recommended age of 6 months. Only 18% reported to begin weaning at the age of 6 monthswith several reporting 9 months to be the introductory age. This is a late introduction, as by this timebreast milk is not sufficient to provide all the required nutrients for the child. The weaning food used ismainly porridge. In addition, currently, most children are being fed on solely sorghum-based diets due todepletion of other food stocks.
13 Health and nutrition information systems among refugees and displaced persons, Workshop report on refugee’s nutrition,ACC / SCN, Nov 95.14 As mentioned by the community. 15 ANA 2004-2005

26
Health status, health seeking practice and access to health facilities• Reports from all the health centers indicated that diarrhoea and malaria are the leading causes of
morbidity among the population. Likewise, the survey showed that diarrhoea and malaria were the mainpresumed causes of deaths. The high prevalence of malaria and respiratory infections have also beenreported to the ANA to continuously affect the children under 5 years of age, and the elderly in theregion.16 Both diseases highly compromise nutritional status and can, therefore, be associated with thehigh rate of malnutrition.
• Health seeking practice is poor despite the presence of adequate (quality) health facilities in thecounties. In spite of as many as 90% of households reporting to seek care from health facilities, healthpersonnel stated that most of the population (as high as 60%)17 of the community still preferred to seektraditional ways of health. Most people seek medical advice when the disease conditions haveadvanced, this could be attributed to lack of accessibility to the health facilities in some locations.
• Access to health facilities is still a limitation in seeking health care, despite the well distribution of healthfacilities. In Twic County, which is very vast, health facilities are still distant to many of the villages. InAbyei, there are fewer health facilities, which are unable to cover majority of the population.
Water and Sanitation situation• Despite the many boreholes that have been drilled in the County, a number of them are currently not
functioning. This leaves large part of the population without access to clean water. In Twic County, ahuge proportion of the population still rely on water from the river; only 30% of respondents reported totreat their water before household consumption. The larger population therefore, is pre-disposed toinfections such as diarrhoea, which has been reported as a leading cause of morbidity and mortality.
• Latrines in the communities are very few, and are mainly located in the health facilities, schools, marketcenters and NGO compounds. Of the interviewed households, 53.0% reported to have no designatedarea for use as a toilet, with most of the population simply defecating in open areas. This increases therisk of contamination, and is related to the high water and sanitation related diseases.
.VI. RECOMMENDATIONS
Taking into consideration the analysis of the situation, ACF-USA and GOAL recommend the following:
• GOAL/ACF-USA to implement nutritional treatment programs in the location to address the high rates ofacute malnutrition and prevent mortalities and further deterioration, especially among the children under 5years of age.
• GOAL/ACF-USA to continue monitoring the nutrition situation in both counties, especially over the currenthunger gap.
• WFP to provide food aid to the residents in Twic community according to their needs. • WFP, GOAL, ACF-USA to continue monitoring the food security situation.• GOAL, ADRA and DOE to consider programs/strategies to potentially increase the coverage of primary
health services in the counties.• SUPRAID, GOAL and ADRA to continue the provision of safe drinking water through drilling of more
boreholes while ensuring even distribution, and repairing the non-functional units.• GOAL to continue offering EPI services.
16 ANA 2004-200517 As reported by the Goal health personnel

27
• GOAL to emphasise health education activities in the location, and community leaders to actively participatein creating awareness on health seeking behaviour, child feeding practices, hygiene and sanitation.
• VSF to educate farmers on the pasture preservation methods.

28
.VII. APPENDICES
.VII.1. Twic/Abyei Returnees Status Report
THE RETURNEES STATUS REPORT TWIC2004MONTH JAN FEB MARCH APRIL MAY JUNE JULY TOTALTURALEI 672 646 670 680 686 533 251 3,364PANNYOK 622 621 619 594 658 672 301 3,114WUNROCK 602 601 540 578 690 333 121 3,344AWENG 570 510 580 490 500 494 143 3,144AKOC 502 503 460 480 568 532 97 3,045AJAK-KUAC 300 301 210 290 499 841 60 2,441MAYEN ABUN 291 484 493 569 779 626 115 3,242GRAND TOTAL 3,559 3,676 3,574 3,679 4,380 1,985 3,242 20,853ABDUCTEES 373
THE TOTAL OF TWIC COUNTY= 557,485RETURNEESOF TWIC COUNTY= 23,989G/TOTAL 581,474
DETAILED POPULATION IN EACH PAYAM
S/NO PAYAM POPULATION RETURNEES G/TOTAL1 Turalei Payam 157,320 4,148 161,4682 Panyok 86,424 4,087 90,5113 Aweng 85,498 3,287 88,7854 Wunrock 112,368 6,822 119,9905 Akoc 68,691 3,144 71,8356 Ajak-Kuac 47,184 2,501 49,685
373G/Total 557,485 23,989 581,847
Airstrip Presentation and the Population served
S/N PAYAM AIRSTRIP NUMBER OFPOPULATION
NUMBER OFRETURNEES
G/TOTAL
1 TURALEI AISTRIP 100,120 4,148 104,2682 LIIL AIRSTRIP 52,984 4,216 57,2003 PANNOK AIRSTRIP 52,300 3,037 55,3374 AKAK AIRSTRIP 43,124 1,050 35,1745 AWENG AIRSTRIP 43,353 1,643 44,9966 MAPER AIRSTRIP 42,145 1,644 43,7897 WUNROCK AISTRIP 87,238 3,465 90,7038 MAYEN-ABUN 25,130 3,357 28,4879 AKOC AIRSTRIP 68,691 3,144 71,83510 AJAK-KUAC AIRSTRIP 47,184 2,501 49,685
TOTAL 557,485 23,989 581,474

29
THE RETURNEES STATUS REPORT ABYEI2003-2004
Estimated population all county ,2003 63814IDP’s ,2003 12.000Abyei returnees 2003 10,000Abyei returnees 2004 11,931Total 97,745
DETAILED POPULATION IN EACH PAYAM
S/NO PAYAM MALE FEMALE CHILDREN1 ALAL 7331 10263 117262 RUM-AMER 6842 9579 109473 MIJAK 5376 7526 86024 AMETH-AGUOK 4887 6843 7820
G/Total 24435 34211 39098
2005 RETURNEESS
S/NO MONTH HOUSE BENEFICIARIES1 January 30 1862 February 181 8503 March 343 2059
G/Total 554 3095
Airstrip Presentation and the Population served
S/N PAYAM AIRSTRIP NUMBER OFPOPULATION
NUMBER OFRETURNEES
G/TOTAL
1 TURALEI AISTRIP 100,120 4,148 104,2682 LIIL AIRSTRIP 52,984 4,216 57,2003 PANNOK AIRSTRIP 52,300 3,037 55,3374 AKAK AIRSTRIP 43,124 1,050 35,1745 AWENG AIRSTRIP 43,353 1,643 44,9966 MAPER AIRSTRIP 42,145 1,644 43,7897 WUNROCK AISTRIP 87,238 3,465 90,7038 MAYEN-ABUN 25,130 3,357 28,4879 AKOC AIRSTRIP 68,691 3,144 71,83510 AJAK-KUAC AIRSTRIP 47,184 2,501 49,685
TOTAL 557,485 23,989 581,474
Compiled by: Mr Mangok Kom Nyuol SRRC Secretary-Twic County Turalei
30
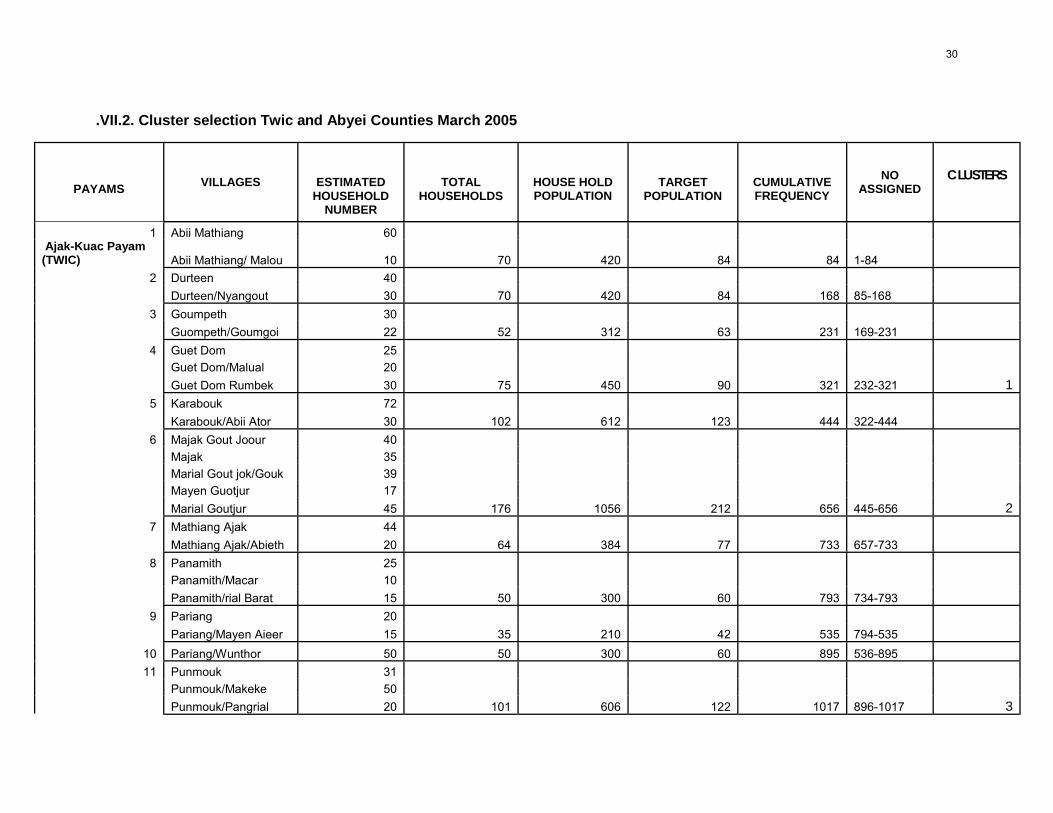
.VII.2. Cluster selection Twic and Abyei Counties March 2005
PAYAMS VILLAGES ESTIMATEDHOUSEHOLD
NUMBER
TOTALHOUSEHOLDS
HOUSE HOLDPOPULATION
TARGETPOPULATION
CUMULATIVEFREQUENCY
NOASSIGNED
CLUSTERS
1 Abii Mathiang 60 Ajak-Kuac Payam(TWIC) Abii Mathiang/ Malou 10 70 420 84 84 1-84
2 Durteen 40 Durteen/Nyangout 30 70 420 84 168 85-168
3 Goumpeth 30 Guompeth/Goumgoi 22 52 312 63 231 169-231
4 Guet Dom 25 Guet Dom/Malual 20 Guet Dom Rumbek 30 75 450 90 321 232-321 1
5 Karabouk 72 Karabouk/Abii Ator 30 102 612 123 444 322-444
6 Majak Gout Joour 40 Majak 35 Marial Gout jok/Gouk 39 Mayen Guotjur 17 Marial Goutjur 45 176 1056 212 656 445-656 2
7 Mathiang Ajak 44 Mathiang Ajak/Abieth 20 64 384 77 733 657-733
8 Panamith 25 Panamith/Macar 10 Panamith/rial Barat 15 50 300 60 793 734-793
9 Pariang 20 Pariang/Mayen Aieer 15 35 210 42 535 794-535
10 Pariang/Wunthor 50 50 300 60 895 536-895 11 Punmouk 31
Punmouk/Makeke 50 Punmouk/Pangrial 20 101 606 122 1017 896-1017 3

31
1 Panther 40 Camel 20 Turalei (Twic) Majok Non 20 80 480 96 1113 1018-1113 2 Wuncuom 20 Miir 20 Rum Rit 20 Makoc 20 80 480 96 1209 1114-1209 3 Majok 30 Rit 50 Yok Chen 20 Wuny 20 Thuec 23 Malek 30 173 1038 208 1417 1210-1417 44 Aril 25 Wunriak 20 Paulit 29 Yombol-dit 30 104 624 125 1542 1418-1542 55 Wlim 40 40 240 48 1590 1543-1590 6 Cuiei 30 Anyie 20 Awiel 25 Nyen Pur 40 Gok 40 Kuliny 40 Manyiel 23 218 1308 262 1852 1591-1852 67 Wunring 30 Wargor 30 Dong Ping 20 Nyiel 40 120 720 144 1996 1853-1996 8 Ayet 26 Amar 30 Warcor 30 Guot-jak 20 Ayuong 20 126 756 152 2148 1997-2148 9 Kuch Biek 20 Akot 30 Turalei 100

32
Pantiok 50 200 1200 240 2388 2149-2388 7
10 Wardi 40 Wungop 40 Rual 30 Rum Cuar 45 Majok Amol 50 Agang 30 Majak 20 255 1530 306 2694 2389-2694 8
11 Pan Abei 30 Malek Lul 40 Ring Zhei 40 Madil 30 140 840 168 2862 2695-2862 9
12 Chok 46 Makol 20 Majok Kuel 30 96 576 116 2978 2863-2978
13 Juoch 100 100 600 120 3098 2979-3098 1014 Myko (Nyiel Kou) 20
Monuor 37 Kuac 15 Kuac Agok 40 Akel 30 Athony 30 192 1152 235 3333 3099-3333
15 Mabior 30 Majakher 45 Pandit 100 Apeth 40 250 1500 300 3633 3334-3633 11
16 Lil 37 Reuo 40 77 462 93 3726 3634-3726 12
17 Moun 34 Amer 30 64 384 77 3803 3727-3803
1 Amor 45
Tocthoek 26 AkocPayam (TWIC) Aciir

33
Majail Deng 20 Apiok 40
Kowic 40 Abaping 171 1026 206 4009 3804-4009 Akoc 29
2 Majak Cuer Ayap 20 Mathiang Thii 30 Mathiang Thon 49 Riamgkou 26 Mindik 48 Maker Thon 30 Manyuar Thii 48 Maper 20 Denganyuopbek 39 Dhiauagal 44 Mayom Week 37 Manyuar Dit 46 Dimo 30 Akoc Dit 48 544 3264 653 4662 4010-4662 13,14,15 Agorkou 28 Akiolthii 39
3 Akuac Goc 39 Deng Deng Kuac 31 Marial Ayuong 40 Warawar Thon Goumalual 42 Anyel Bongayiir 42 Pantit 15 Palmek Agorkou 2 28 304 1824 365 5027 4663-5027 16, Ajogliit 41
4 Achol 56 Thur Majok 13

34
Gowan 42 Manyiel Acuei Dit 45 Thur Adut Chol Mior 47 Manyiel Awar Luai Pajok 29 Panlit 20 Jiawan 30 Achol Anyar 20 343 2058 412 5439 5028-5439 17 Abii 20 Awut 30 5 Deng Kuat Cogem Wardhur 36 Gowanthii 10 Mabil 40 Mabior 21 Abiith 30 187 1122 225 5664 5340-5664 186 Amarjal Panthou 50 Tiithoon 48 Tell Mou Nyam Ameth 30 Cuiei Manyiel Adol 30 Wel 30 Mading 36 Weeknoon 34 Gueng Cuar 28 Guet Abok Noon Mayen Thon 30 Akoknoon 35 351 2106 422 6086 5665-6086 19 Athorjiep 46 Pannlial 50 7 Cuomic 25 Makem 20

35
Guenglaai 18 Pandit Anyan Chol 159 954 191 6277 6087-6277 20
Amuthum 45 Ruomakon 30 Atong Aguak 30
8 Ruomwol 30 Awriakok Wun Abie Wunaciec 30 Wunaguak 50 Wunawar 39 Mangok 40 Mayar Baai Adhengbett 26 320 1920 384 6661 6278-6661 21 Akec Pinu 42 Gumel 46
9 Athoc 40 Kolpur 36 Panrock 46 Panrock 22 Rumajok 30 Rumanjuei 30 Wareham 40 Rummapur 25 Mangar Kuel Kuel Adhur 11 368 2208 442 7103 6662-7103 22 Awang Thoy Lolkul 18
10 Panamakon 20 Week Mabior Athony 32 Riak Thoc 37 Pantiok 45

36
Machar Achok 36 Ayiidit 33 Mangar Cuar 25 Ajuen Dur 37 283 1698 240 7343 7104-7343 23 Bana Anyanchol Roor Diar Gangamal 30 Jibi 30
11 Magar 48 Lual Yar Kuei 30 Makuac Ajak Rac 14 Awnyiir 36 188 1128 226 7569 7344-7569 24 Bangabok 37
12 Getabok 39 Bangrual Gomgok Majok Wedit Maker 30 Maker Thii 15 Makoroyo 48 Maiwac Roor Jeng 10 Roor Jong 32 Akok Gar Ajuoc 211 1266 254 7823 7570-7823 25
13 Mayen Bala 46 Malualawil 49 95 570 114 7937 7824-7937
Awal 14
Rummer Payam(ABYEI) Nyin-dier 13
Kol-dier 16 Agigo 48 Wun-aran 24 Achook 98 Miyenachook 52 Nyalchor 31 Achel-kow 31
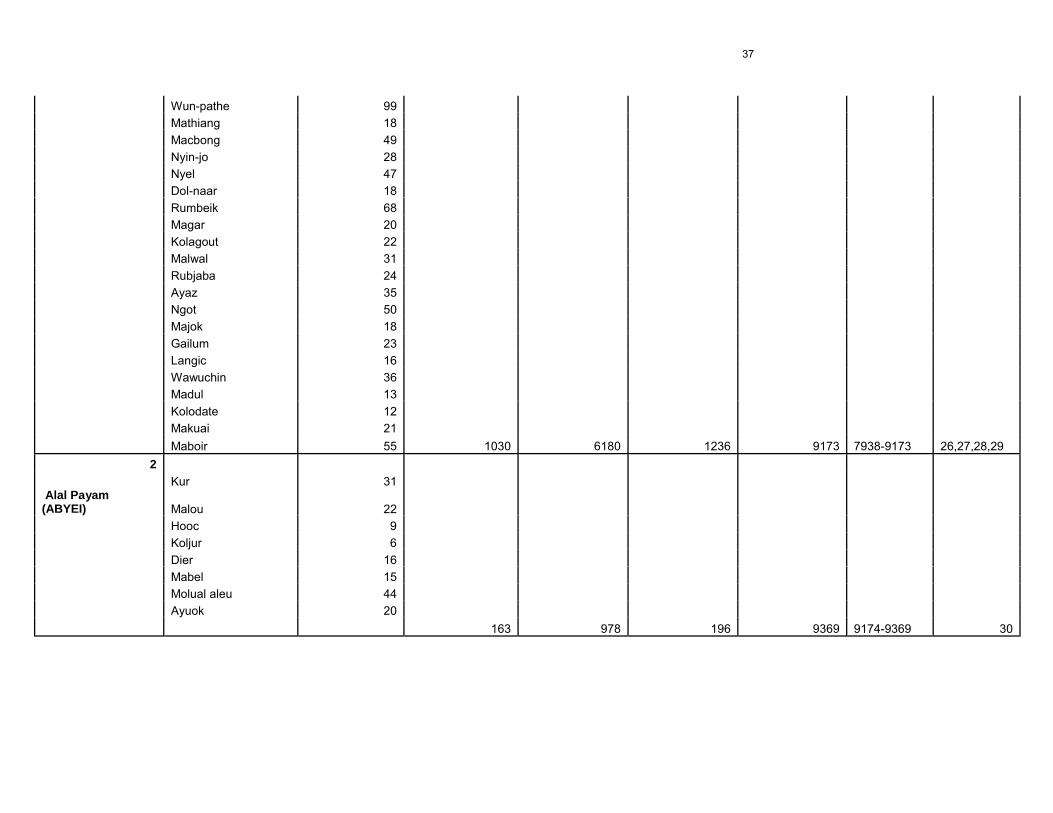
37
Wun-pathe 99 Mathiang 18 Macbong 49 Nyin-jo 28 Nyel 47 Dol-naar 18 Rumbeik 68 Magar 20 Kolagout 22 Malwal 31 Rubjaba 24 Ayaz 35 Ngot 50 Majok 18 Gailum 23 Langic 16 Wawuchin 36 Madul 13 Kolodate 12 Makuai 21 Maboir 55 1030 6180 1236 9173 7938-9173 26,27,28,29
2 Kur 31
Alal Payam(ABYEI) Malou 22 Hooc 9 Koljur 6 Dier 16 Mabel 15 Molual aleu 44 Ayuok 20 163 978 196 9369 9174-9369 30

38
.VII.3. Anthropometric Survey Questionnaire
DATE: CLUSTER No:VILLAGE: TEAM No:
N°. Family N°.
Status
(1)
Age
MthsGender M/F
WeightKg
Height Cm
SittingHeightcm(2)
OedemaY/N
MUACmm
MeaslesC/M/N
(3)
12345678910111213141516171819202122232425262728293031
(1) Status: 1=Resident, 2=Displaced (because of fighting, length < 6 months), 3=Family temporarilyresident in village (cattle camp, water point, visiting family…)
(2) Sitting Height is optional. To apply for ACF-USA survey. This data is for research (3) Measles*: C=according to EPI card, M=according to mother, N=not immunized against measles

39
.VII.4. Retrospective Mortality Survey Questionnaire
DATE: CLUSTER No:VILLAGE: TEAM No:
Today 3 months ago Deaths Nb MigrantsFamily
N°.Nb of < 5
Yearsalive
Nb of >=5 years
alive
Nb of < 5yearsalive
Nb of>= 5
yearsalive
Nb Cause(2)
AgeNb
Births arrivedin theperiod
left inthe
period
Status(1)
123456789101112131415161718192021222324252627282930
(1) Status: 1=Resident, 2=Displaced (because of fighting, length < 6 months), 3=Family temporarily residentin village (cattle camp, water point, visiting family…)
(2) Cause:1= Diarrhea (watery diarrhea), 2=Bloody diarrhea (Dysentery), 3=Measles, 4=Malaria, 5= TB, 6=Pneumonia, 7=Malnutrition, 8= Kala-azar, 9=Accident (gunshot, snakebite…), 10=Other (write
presumed cause of death)
40
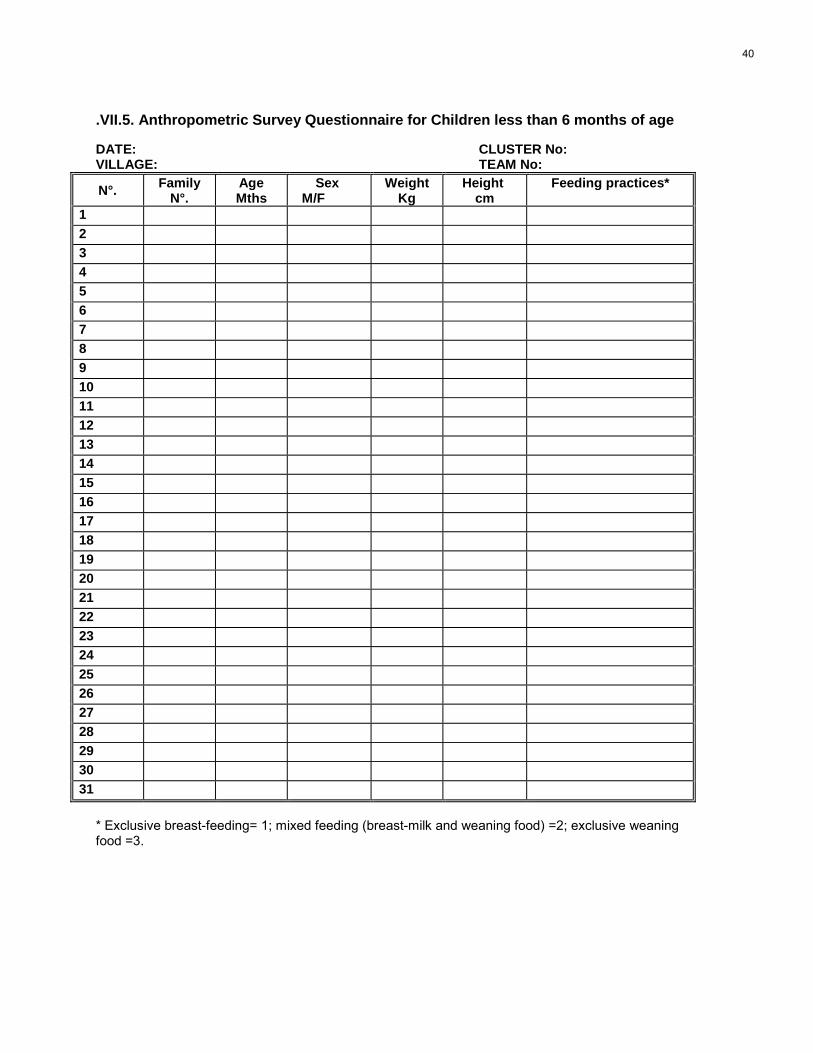
.VII.5. Anthropometric Survey Questionnaire for Children less than 6 months of age
DATE: CLUSTER No:VILLAGE: TEAM No:
N°. FamilyN°.
Age Mths
Sex M/F
WeightKg
Height cm
Feeding practices*
12345678910111213141516171819202122232425262728293031
* Exclusive breast-feeding= 1; mixed feeding (breast-milk and weaning food) =2; exclusive weaningfood =3.

41
.VII.6. Calendar of Events, Twic/Abyei, April 2005MONTHS SEASONS 2000 2001 2002 2003 2004 2005
51 39 27 15 3JANUARYKOL/NYITH
-Cattle move to Toic-Cutting of trees tomake houses
Beginning of TwicOlympicsCommemoration of chiefof Mayiending
Twic Olympics Twic Olympics in Turalei Sighning of peace inNairobi
50 38 26 14 2FEBRUARYAKOLDIT/KOL Cleaning of dura
Twic Olympics
NPA lefrt Akak Antenov bombing inWunrok
Long drought and cattlediedAgreement betweenMurhalin and DinkaGoal begins itsoperations
Peolple killed in Akochduring Twic Olympicsand Akoch raised tolevel 4
49 37 25 13 1MARCHAKOCTHEI Clearing of ground for
cultivationDigging of wells
SPLA captured Gogrial Bombing of AbyeiLau Nuer came andlooted Dinnka cattle inAweng payam.
John Garang came toTwicHeavy rain killed manycowsBig conference in Abyei
Twic Olympics in PanyokpayamMeeting betweenMisseriah and Dinka
48 36 24 12APRILADUONG
Preparation of landLack of water
Eye disease, burningof grass
Murhalin came and killedmany people in Aweng
Naivasha peaceagreement
Children enslaved byarabs returned to Twic
59 47 35 23 11MAYALEKBOR
Start of cultivationCattle come back from
ToicBeginning of rain.
1st ever WFP drop inTwic(Macokgar)
Fightitng between GOSand SPLM in GogrialGos recapture
Heavy rains and floodsin Twic
Twic conference held inTuralei
58 46 34 22 10JUNEAKOLDIT
CultivatingRains
Start of weeding
Bishop Macram Marxwas chased away fromAbyei.
John Garang came toTwic and Abyei
57 45 33 21 9JULYBILDIT
Continue weedingRain
Hunger gapmosquito, malaria
Death of executive chiefof Mayiending
56 44 32 20 8AUGUSTBILTHEI Hunger gap
Cattle kept in luaksMosquito/malaria
All executive chiefs ofTwic and Abyei went toNew SiteFloods kill people inAbyei
55 43 31 19 7SEPTEMBERLAL
Start of harvest ofsorghum
2nd cultivation ofsorghum in Abyei
54 42 30 18 6OCTOBERHORBARKLEI
FishingMulching
Initiation marksCircumsision of boys
NOVEMBERKONPIU
Start of mudding ofhouses
Circumsision of boysRemoval of lower
teeth
53 41 29 17 5

42
52 40 28 16 4DECEMBERNYIETH
Harvesting of 2nd cropand winnowing of 1st
crop
Bishop Macram marxopened his mission inturalei for both Abyei andTwic.
HIV/AIDS world daycelebrations

43
.VII.7. Food and non-food items and prices in the Twic and Abyei markets
Price (Sd)Item QuantityTwic Abyei
FOODSorghum 1kg 600 600Rice 1kg 500 300Sorghum seed 1kg 750 500Sugar 1kg 300 300Vegetable oil 325Fish (sardines) 250gms 800 50Salt/spices 1kg 100 100Groundnuts 1.5kg 200 200Sphaggetti 300gms - 300Wheat flour 1kg - 300Yeast 500gms - 700Lentils 1kg 500 400Okra 500 -Tea leaves 500gms 500 500Onions 3.7kg 200 200Coffee 50gms - 50sdSoda 300ml 300 200Tobbacco 3-5kg 3000 -Simsim 250gms 50 50Jam 450gms - 400Tomato paste 420gms 500 400Milk powder 50gms 150 -Cow 1 20000 15000-30000Goat 1 2000 3500-6000
NON FOOD ITEMSCharcoal 1 sack 1500 1500Firewood 1 bundle 100 100Bar soap 1 bar 50 50Battery “D” 1 pair 250 250
The exchange rate in the market is: 1 dollar = 250sd