sources of ground water contamination and napl · sources of ground water contamination and napl...
TRANSCRIPT

Sources of Ground Water Contamination and NAPL
April 10, 2012
Presenter: Jeffrey Farrell – PS&S
2
General Intent
• This section of the guidance addresses:
– Saturated Zone contamination/sources;– Unsaturated Zone contamination/sources; &– Free Phase Non-Aqueous Phase Liquid
(NAPL) or Residual NAPL when Present in either the saturated or unsaturated zones.

3
Triggers for Ground Water Investigations
• N.J.A.C. 7:26E – 4.4(a) identifies 4-triggers:1. GW w/contaminant above GW Remediation Standard;2. Soil w/in 2-feet of GW/Bedrock w/contaminant above
applicable Soil Remediation Standard (SRS);3. Soil w/in the AOC w/contaminant above SRS and no
plans to remediate or remove; and4. Contaminant w/water solubility>100mg/L @ 20˚-25˚C
Soils (between contaminant(s) and saturated zone) are <15% silt and/or clay; OR
Any part of AOC w/in 2,000 feet of public supply well.
4
If NAPL Identified• Reminder- N.J.A.C.7:26E 1-12(a) & (b)
(a) As a first priority … 1.Identify … any interim remedial measures
(IRM) necessary to remove, contain, or stabilize a source of
contamination to prevent contaminant migration and exposure to receptors; and
(b) … follow the Department's LNAPL Free Product Interim Remedial Measures guidance (Regulatory/Mandatory Time Frames Apply)

5
Delineation Process and Source Identification
• Assess known Hydrogeologic Framework;• Create/Update Conceptual Site Model;• Delineate Contaminant Extent:
Soil Impacts,Dissolved Constituents,Address NAPL.

6
Source Identification
• Unsaturated Zone SourcesSoil constituents leaching into GWAssess/Develop Site Specific IGW SRS
Default Values (very conservative!)Soil Water Partition EquationSPLP (with spreadsheet)Seasonal Soil Compartment Model (SESOIL)SESOIL/AT123D
7
Source Identification
• Saturated Zone SourcesConstituents leaching into GWNAPL or Residual NAPLSource Zone “non-NAPL” layers

8
Source Detection Methods
• Method Success Depends On:Geology/Lithology;Degree of Consolidation;Depth to Groundwater; andNAPL Composition

9
Source Detection Methods
• Soil Gas Surveys Screen For:LNAPL Plumes,DNAPL Release Location,Dissolved constituent source areas
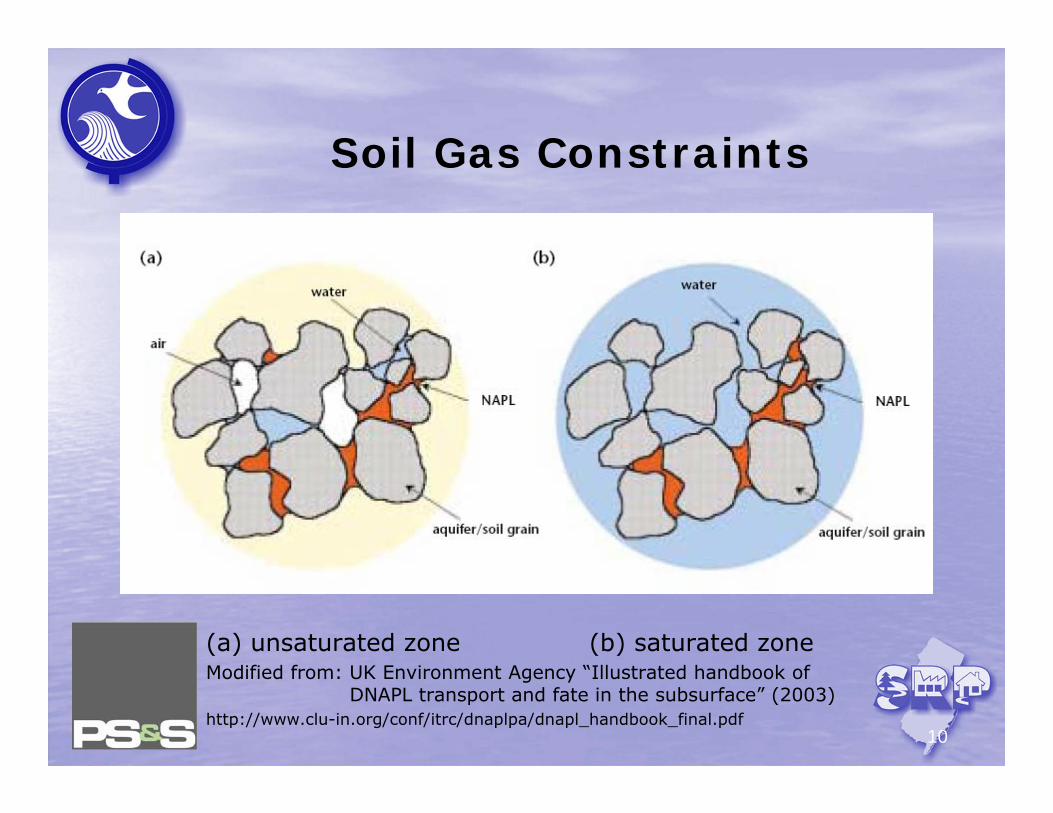
• Constraints for Soil Gas Surveys:Low Permeability soils,Saturated Soils
10
Soil Gas Constraints
(a) unsaturated zone (b) saturated zoneModified from: UK Environment Agency “Illustrated handbook of
DNAPL transport and fate in the subsurface” (2003) http://www.clu-in.org/conf/itrc/dnaplpa/dnapl_handbook_final.pdf

11
Source Detection Methods
• Direct Push TechniquesMembrane Interface Probes (MIPs - both)Cone Penetrometer (both NAPL types)
Laser induced Fluorescence - LNAPL

12
Source Detection Methods
• Geophysical TechniquesAcousticElectrical ResistanceElectromagnetic
• Geophysical Constraints: Very Specialized/ExpensiveProvides Indirect EvidenceRequires Confirmatory Techniques
13
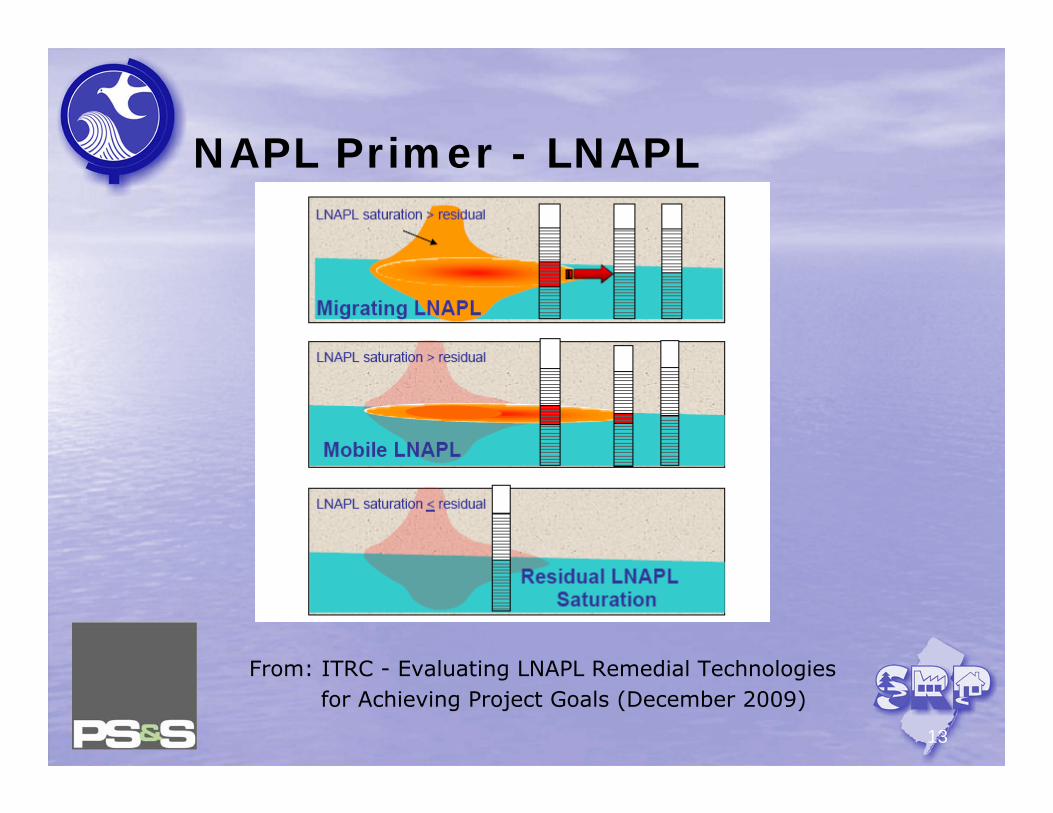
NAPL Primer - LNAPL
From: ITRC - Evaluating LNAPL Remedial Technologiesfor Achieving Project Goals (December 2009)

14
NAPL Primer - DNAPL
From: EPA - Assessment and Delineation of DNAPL SourceZones at Hazardous Waste Sites (2009)

15
NAPL Primer - DNAPL
From: ITRC – An Introduction to Characterizing Sites Contaminated with DNAPLs (September 2003)

16
NAPL Source Comparison
(a) unsaturated zone (b) saturated zoneModified from: UK Environment Agency “Illustrated handbook of
DNAPL transport and fate in the subsurface” (2003) http://www.clu-in.org/conf/itrc/dnaplpa/dnapl_handbook_final.pdf

17
NAPL Source Delineation
• Delineation is an Iterative Process Evaluate what you Know Develop or Modify your Conceptual Model Collect Additional Data Repeat until done

18
NAPL Source Delineation
• Use outside-in approach• Start delineation at the expected “clean”
zone and find a clean perimeter;• Move in to “dirty” zones;• As data is known, refine.

19
TWP-15
Site Location Map
New Bldg “A”
TWP-01
0 40
feet
TWP-11
TWP-02TWP-05
TWP-09
TWP-06
TWP-04
TWP-03
TWP-08
TWP-07
TWP-10
OldBldg “A” Footprint
TWP-13
TWP-12
TWP-14
Lovely Lane

20
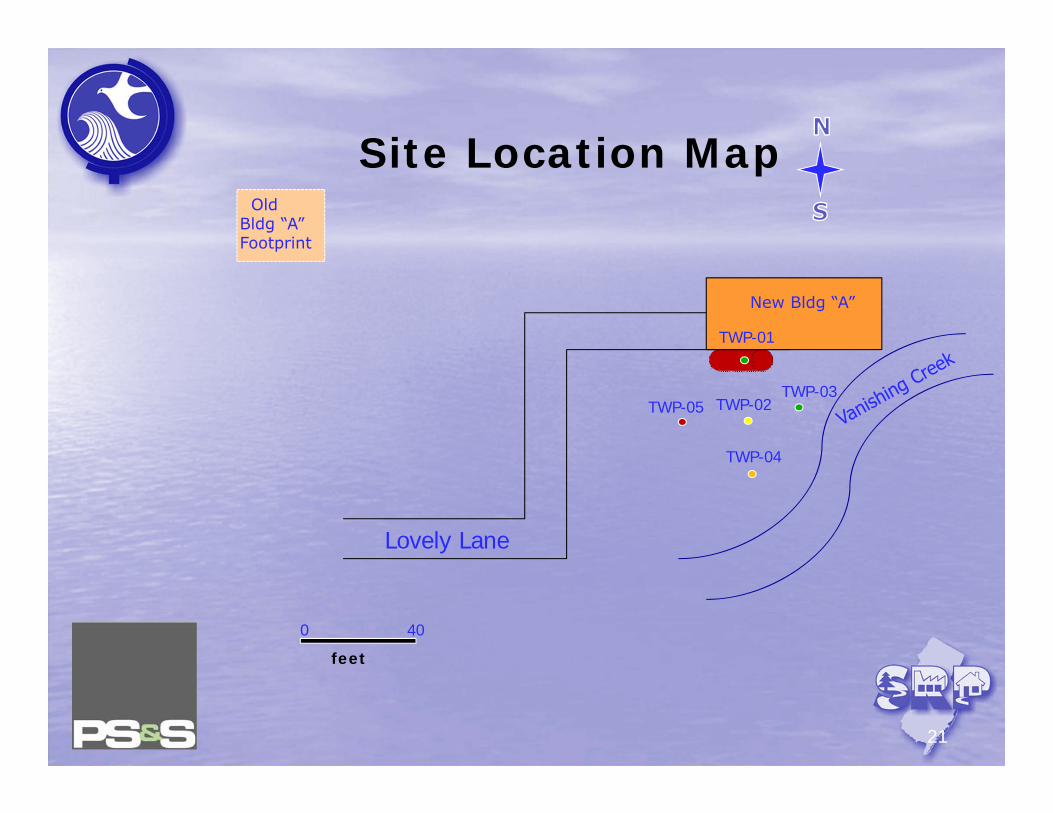
Site Location Map
New Bldg “A”
TWP-01
0 40
feet
TWP-02
OldBldg “A” Footprint
Lovely Lane
21
Site Location Map
New Bldg “A”
TWP-01
0 40
feet
TWP-02TWP-05
TWP-04
TWP-03
OldBldg “A” Footprint
Lovely Lane

22
Site Location Map
New Bldg “A”
TWP-01
0 40
feet
TWP-02TWP-05
TWP-06
TWP-04
TWP-03
TWP-08
TWP-07
OldBldg “A” Footprint
Lovely Lane

23
Site Location Map
New Bldg “A”
TWP-01
0 40
feet
TWP-11
TWP-02TWP-05
TWP-09
TWP-06
TWP-04
TWP-03
TWP-08
TWP-07
TWP-10
OldBldg “A” Footprint
Lovely Lane

24
Site Location Map
New Bldg “A”
TWP-01
0 40
feet
TWP-11
TWP-02TWP-05
TWP-09
TWP-06
TWP-04
TWP-03
TWP-08
TWP-07
TWP-10
TWP-13
TWP-12
TWP-14Old
Bldg “A” Footprint
Lovely Lane

25
Site Location Map
New Bldg “A”
TWP-01
0 40
feet
TWP-11
TWP-02TWP-05
TWP-09
TWP-06
TWP-04
TWP-03
TWP-08
TWP-07
TWP-10
TWP-13
TWP-12
TWP-14Old
Bldg “A” Footprint
Lovely Lane
26
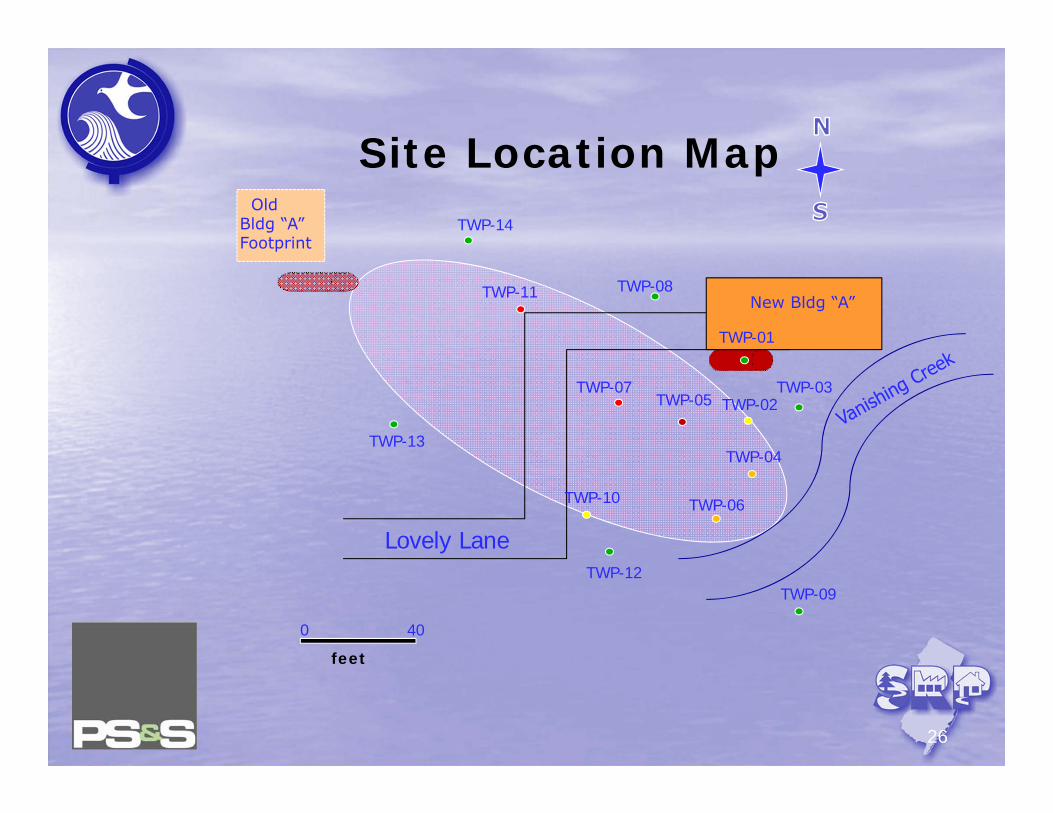
Site Location Map
New Bldg “A”
TWP-01
0 40
feet
TWP-11
TWP-02TWP-05
TWP-09
TWP-06
TWP-04
TWP-03
TWP-08
TWP-07
TWP-10
TWP-13
TWP-12
TWP-14Old
Bldg “A” Footprint
Lovely Lane

27
NAPL Detection
So you have completed GW delineation of the dissolved phase. What questions should you ask? Does my data indicate that a NAPL
source exists?

28
NAPL Detection
• Review Field Data (N.J.A.C. 7:26E 3.6(a); 7:26E 4.4(g))
Soil Screening Results during Well Installation:• Visual Observations;• FID/PID;• Hydrophobic Dyes;• Ultraviolet Fluoresence
29
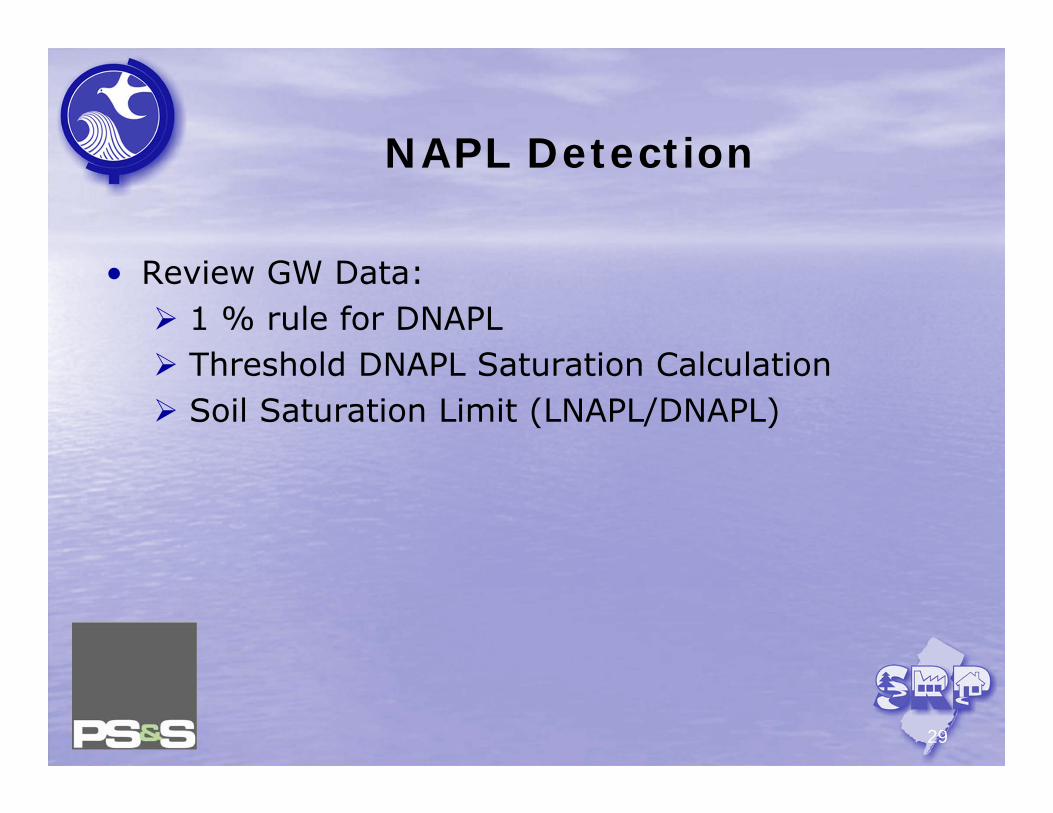
NAPL Detection
• Review GW Data: 1 % rule for DNAPL Threshold DNAPL Saturation Calculation Soil Saturation Limit (LNAPL/DNAPL)

30
1% Solubility Rule
• Tetrachloroethylene (PCE) has an approximate pure phase solubility of 150 mg/L and an effective solubility of approximately 133 mg/L.
• 1% of the effective solubility = 1.33 mg/L or 1,330 ug/L (1,330 ppb).
• GW concentration of PCE ≥ 1,330 ppb infers that DNAPL may be present.

31
Site Location Map
New Bldg “A”
TWP-01
0 40
feet
TWP-11
TWP-02TWP-05
TWP-09
TWP-06
TWP-04
TWP-03
TWP-08
TWP-07
TWP-10
TWP-13
TWP-12
TWP-14Old
Bldg “A” Footprint
Lovely Lane
TWP-15
32
Conclusion
• There are many tools available to identify source and delineate impacts
• Understanding the tools and picking the right one will save time/$$
• References, including the Guidance Documents, are resources to help you –use them!