some thoughts on asset prices march 2018 · some thoughts on asset prices ... when we discuss and...
TRANSCRIPT

Some Thoughts on Asset Prices March 2018
This time last year we outlined some thoughts on Australian house prices and noted the
premium at which dwellings in this country traded relative to historical averages. In this
paper we position this analysis within the context of global asset prices.
The issue of high asset prices is not isolated to Sydney houses. Other global cities have
experienced similar price appreciation and most asset classes – with the notable exception
of listed equities – are trading well above historic norms.
Figure 1: Current Valuation Multiples Relative to Post 1990 Averages
Source: Bloomberg, AMP, ABS, RBA, S&P Capital IQ, Merlon Analysis
Forecasting a widespread correction in asset prices is highly speculative in our view.
Similarly, while there is a loose correlation between market wide valuation multiples and
subsequent returns, we think forecasting long term returns is equally futile.
That said, it is clear to us that assets prices have benefitted from low interest rates and that
asset prices are vulnerable if expectations of low and stable inflation turn out to be wrong.
Of course, we could be worrying about nothing in which case listed equity valuations will
probably catch up to other assets. Either way, we think a portfolio tilt towards listed equities
is sensible in the current environment.
19%
52%
69%
22%
31%
15%22%
-2% 0%
44%36%
Australian Property Fixed Income Equities
Analyst: Hamish Carlisle
Most asset classes are expensive relative to post 1990 averages…
A tilt towards listed equities is sensible in the current environment…

Some Thoughts on Asset Prices, March 2018
Page | 2
Figure 2: S&P 500 Valuation Multiples & Subsequent 10 Year Returns
Source: Robert Schiller, Bloomberg, Merlon Analysis, * 8 years & 2 months to February 2018
Interest Rates & Inflation – A Long Term Perspective
A key driver of currently high valuation multiples appears to be the complacency among
many investors that interest rates will remain low for an extended period of time. The
corollary of this is that inflation expectations will remain low and stable for an extended
period of time. This is because perceived certainty about inflation creates perceived
certainty about a bond’s real return, making the bond a less risky investment.
Figure 3: Bond Yields
Source: Bloomberg, Merlon Analysis
Much of our value investing philosophy at a stock level is premised on the behavioural
tendency of investors to over-extrapolate short term trends too far into the future and ignore
the lessons of longer term historical periods. Investors come up with new rules for the new
world and are quick to dismiss tried and tested valuation frameworks.
1900
1910
1920
1930
1920
1950
1960
1970
1980
1990
2000
2010*
-10%
-5%
0%
5%
10%
15%
20%
5 10 15 20 25
10
Ye
ar A
nn
ual
ise
d R
eal
Re
turn
Price to Trend Earnings Ratio at Start of Period
CurrentPE
0
5
10
15
20
Jan
-80
Jan
-82
Jan
-84
Jan
-86
Jan
-88
Jan
-90
Jan
-92
Jan
-94
Jan
-96
Jan
-98
Jan
-00
Jan
-02
Jan
-04
Jan
-06
Jan
-08
Jan
-10
Jan
-12
Jan
-14
Jan
-16
Jan
-18
US 10 Year Treasury Yield AU 10 Year Treasury Yield
Forecasting long term returns and market timing is difficult…
Investors tend to over-extrapolate short term trends too far into the future…
Global growth is accelerating…

Some Thoughts on Asset Prices, March 2018
Page | 3
This is an example of what psychologists call the “availability heuristic”, or our tendency to
heavily weigh our judgements towards more recent information, making new opinions
biased toward that latest news.
When we discuss and consider individual company investments at Merlon we always view
current conditions within the context of the long term. This is always at least 10 years but
preferably longer, particularly when it comes to macroeconomic conditions. This helps us
avoid falling into the trap of placing too much weight on current conditions.
In the case of inflation, there are centuries of data to consider. What we would note is that
high and volatile inflation is the norm and the current environment is highly unusual.
Figure 4: Global Inflation
Source: Carmen M. Reinhart & Kenneth S. Rogoff (2009), OECD, Merlon Analysis
There have been many reasons postulated as to why such conditions might prove
sustainable:
• Dr Philip Lowe, Governor of the RBA recently commented that officials were still
trying to figure out what the new “normal” level of interest rates might be, because
wages growth and inflation were not behaving as they have in the past.”;
• Central banks have postulated that increased life expectancy and an aging
population put downward pressure on real interest rates as people build up higher
savings;
• Others have suggested that technology means most economies would struggle at
times to achieve sustainable inflation rates of 2% or more over the medium run.
Stepping back from some of the miniature, history shows how difficult it is for the world to
escape periods of high and volatile inflation. The underlying cause is debatable and
arguably academic. Having said that, weak institutional structures and a problematic
political system, have always made monetary stimulus and external borrowing tempting
devices for governments to employ to avoid hard decisions about spending and taxing.
Current OECDAverage
It is unprecedented for the world to escape periods of high and volatile inflation…
Monetary stimulus and external borrowing have always been tempting devices… … to avoid hard decisions about spending and taxing

Some Thoughts on Asset Prices, March 2018
Page | 4
Current Inflationary Pressures
Turning to the current environment, it is worth noting that a number of factors that have
served to depress inflation in recent years appear to be receding. First, global economic
growth is synchronised and accelerating. In particular, business confidence is improving
which would typically be associated with higher demand for labour and capital goods. This
lift in demand may well flow through to higher prices.
Figure 5: Business Confidence
Source: OECD, Merlon Analysis
Second, there have two critical cyclical factors that have dulled CPI growth in the US in
recent periods being the falling oil price and the strong US dollar. Both these trends have
reversed. Additional deflationary impacts have also been felt from owners equivalent rent,
health and communications. Again, a normalisation of these components will lead to a
notable pick up in the rate of growth of the CPI.
Figure 6: Transitory Factors impacting the US CPI
90
92
94
96
98
100
102
104
1980
1981
1983
1985
1987
1989
1991
1992
1994
1996
1998
2000
2002
2003
2005
2007
2009
2011
2013
2014
2016
JPN CHN USA DEU
-60%
-40%
-20%
0%
20%
40%
60%
80%
100%
1980
1981
1983
1985
1987
1989
1991
1992
1994
1996
1998
2000
2002
2003
2005
2007
2009
2011
2013
2014
2016
WTI USD TWI
Global growth is accelerating…
Transitory factors that have dulled inflation are fading…
Some Thoughts on Asset Prices, March 2018
Page | 5
Source: Federal Reserve, Merlon Analysis
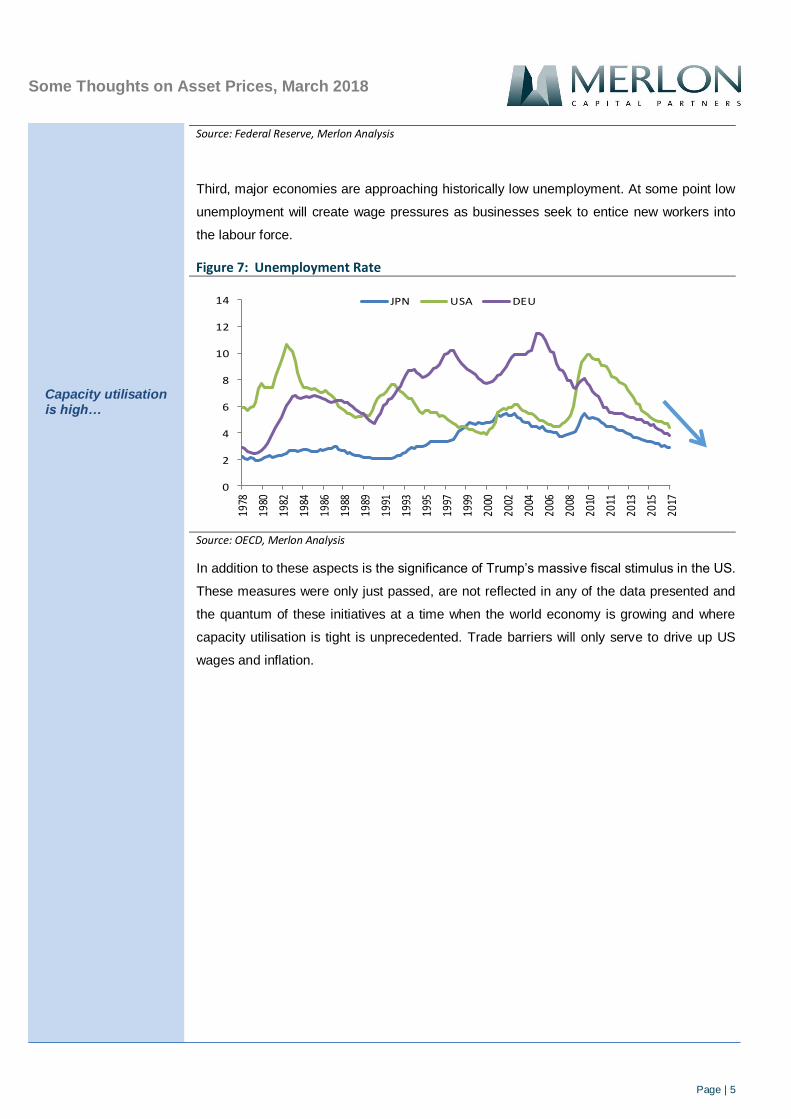
Third, major economies are approaching historically low unemployment. At some point low
unemployment will create wage pressures as businesses seek to entice new workers into
the labour force.
Figure 7: Unemployment Rate
Source: OECD, Merlon Analysis
In addition to these aspects is the significance of Trump’s massive fiscal stimulus in the US.
These measures were only just passed, are not reflected in any of the data presented and
the quantum of these initiatives at a time when the world economy is growing and where
capacity utilisation is tight is unprecedented. Trade barriers will only serve to drive up US
wages and inflation.
0
2
4
6
8
10
12
14
1978
1980
1982
1984
1986
1988
1989
1991
1993
1995
1997
1999
2000
2002
2004
2006
2008
2010
2011
2013
2015
2017
JPN USA DEU
Capacity utilisation is high…

Some Thoughts on Asset Prices, March 2018
Page | 6
Commercial Property could be More Expensive than Residential
While there has been much focus on residential property in recent years, the rapid increase
in commercial property prices has been less well publicised. We note that while residential
property is passing hands at a price-to-rent ratio that is approximately 20% above its post
1990 average, commercial property is trading at around a 30% premium.
Figure 8: Price-to-Rent Ratios
Source: ABS, Bloomberg, AMP, Merlon Analysis
This commercial property price inflation has been most conspicuous in the “industrial”
category. This is particularly concerning to us given the lower lead times in adding supply in
this category and the often enormous incentives provided to new tenants, particularly
during economic downturns.
Figure 9: Price-to-Rent Ratios
Source: Bloomberg, AMP, Merlon Analysis
A final point to note about residential house prices is that Australia – and Sydney in
particular – is not that unusual when compared to other global cities with geographical
constraints to growth. In short, booming asset prices are a global phenomenon. If we go
down, we may all go down together.
0
10
20
30
40
0
5
10
15
20
25
Jan
-80
Jan
-82
Jan
-84
Jan
-86
Jan
-88
Jan
-90
Jan
-92
Jan
-94
Jan
-96
Jan
-98
Jan
-00
Jan
-02
Jan
-04
Jan
-06
Jan
-08
Jan
-10
Jan
-12
Jan
-14
Jan
-16
Jan
-18
Commercial Property (LHS) Residential Property (RHS)
0
5
10
15
20
25
Jan
-80
Jan
-82
Jan
-84
Jan
-86
Jan
-88
Jan
-90
Jan
-92
Jan
-94
Jan
-96
Jan
-98
Jan
-00
Jan
-02
Jan
-04
Jan
-06
Jan
-08
Jan
-10
Jan
-12
Jan
-14
Jan
-16
Jan
-18
Composite Office Retail Industrial
Relative to recent history, commercial property is more expensive than residential property…
Industrial property prices are particularly concerning…
Some Thoughts on Asset Prices, March 2018
Page | 7
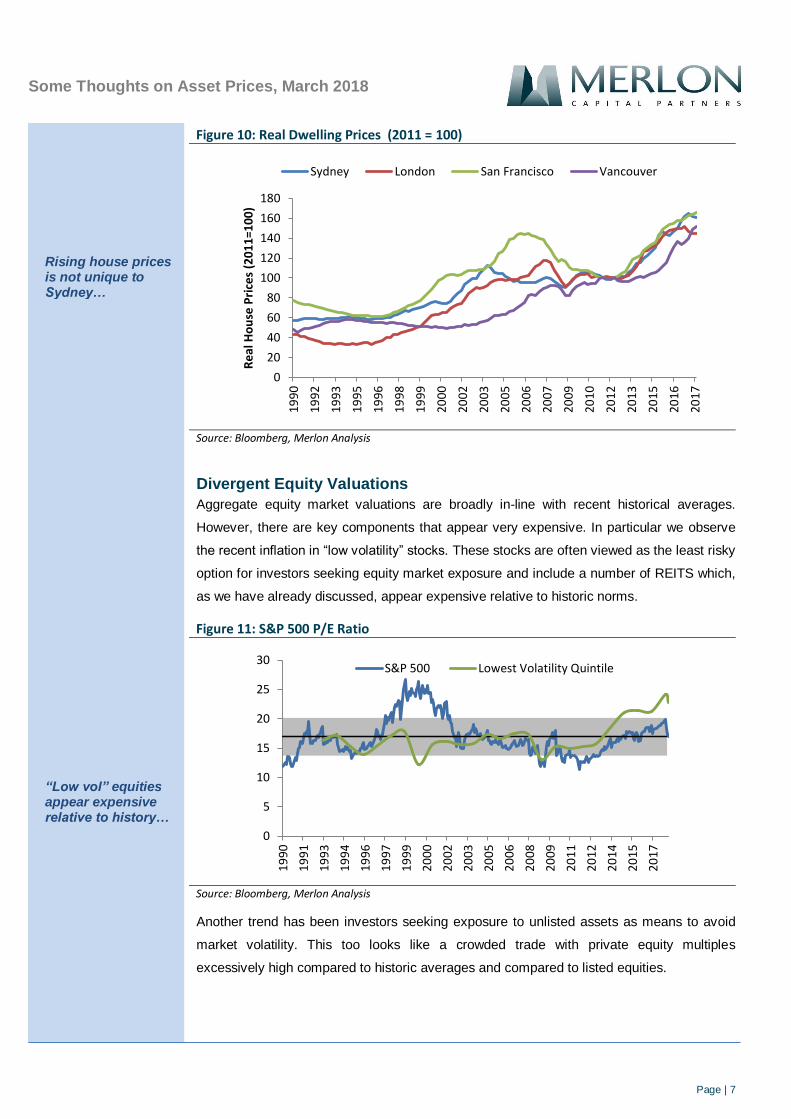
Figure 10: Real Dwelling Prices (2011 = 100)
Source: Bloomberg, Merlon Analysis
Divergent Equity Valuations
Aggregate equity market valuations are broadly in-line with recent historical averages.
However, there are key components that appear very expensive. In particular we observe
the recent inflation in “low volatility” stocks. These stocks are often viewed as the least risky
option for investors seeking equity market exposure and include a number of REITS which,
as we have already discussed, appear expensive relative to historic norms.
Figure 11: S&P 500 P/E Ratio
Source: Bloomberg, Merlon Analysis
Another trend has been investors seeking exposure to unlisted assets as means to avoid
market volatility. This too looks like a crowded trade with private equity multiples
excessively high compared to historic averages and compared to listed equities.
0
20
40
60
80
100
120
140
160
180
19
90
19
92
19
93
19
95
19
96
19
98
19
99
20
00
20
02
20
03
20
05
20
06
20
07
20
09
20
10
20
12
20
13
20
15
20
16
20
17
Re
al H
ou
se P
rice
s (2
01
1=1
00
)
Sydney London San Francisco Vancouver
“Low vol” equities appear expensive relative to history…
0
5
10
15
20
25
30
19
90
19
91
19
93
19
94
19
96
19
97
19
99
20
00
20
02
20
03
20
05
20
06
20
08
20
09
20
11
20
12
20
14
20
15
20
17
S&P 500 Lowest Volatility Quintile
Rising house prices is not unique to Sydney…

Some Thoughts on Asset Prices, March 2018
Page | 8
Figure 12: Average EBITDA Purchase Price Multiple for US LBO Transactions
Source: S&P Capital IQ, LSE Research, Merlon Analysis
This trend is arguably symptomatic of cheap funding with credit spreads at cyclically
depressed levels.
Figure 13: US High Yield Credit Spread – 10 Year
Source: Barclays, Merlon Analysis
0
2
4
6
8
10
12
19
80
19
82
19
84
19
86
19
88
19
90
19
92
19
94
19
96
19
98
20
00
20
02
20
04
20
06
20
08
20
10
20
12
20
14
20
16
Q2
17
0
5
10
15
20
25
Jan
-87
Jan
-89
Jan
-91
Jan
-93
Jan
-95
Jan
-97
Jan
-99
Jan
-01
Jan
-03
Jan
-05
Jan
-07
Jan
-09
Jan
-11
Jan
-13
Jan
-15
Jan
-17
As do private equity transactions…
And corporate debt…

Some Thoughts on Asset Prices, March 2018
Page | 9
Merlon Perspective
Since we founded Merlon in 2010 we have consistently valued businesses on the basis of
sustainable cash flows discounted at sustainable interest rates and sustainable risk
premiums. We do not subscribe to the view that inflation is permanently lower than it has
been in the past but even if we did we would not be positioning the portfolio differently as
we think it would imply the parts of the Australian equity market to which our portfolio is
exposed are absurdly undervalued compared to bonds, property and so-called “low vol”
equities.
Our approach has increasingly positioned us away from many of the sectors that have
benefitted from falling interest rates which has created a short-term headwind for our
investors. We think this will reverse in time, at least in a relative sense.