solar development in the philippines - the lantau grouplantaugroup.com/files/ppt_pgen16s_sf.pdf ·...
TRANSCRIPT

The Lantau Group
Solar Development in the Philippines22nd September
The Lantau Group
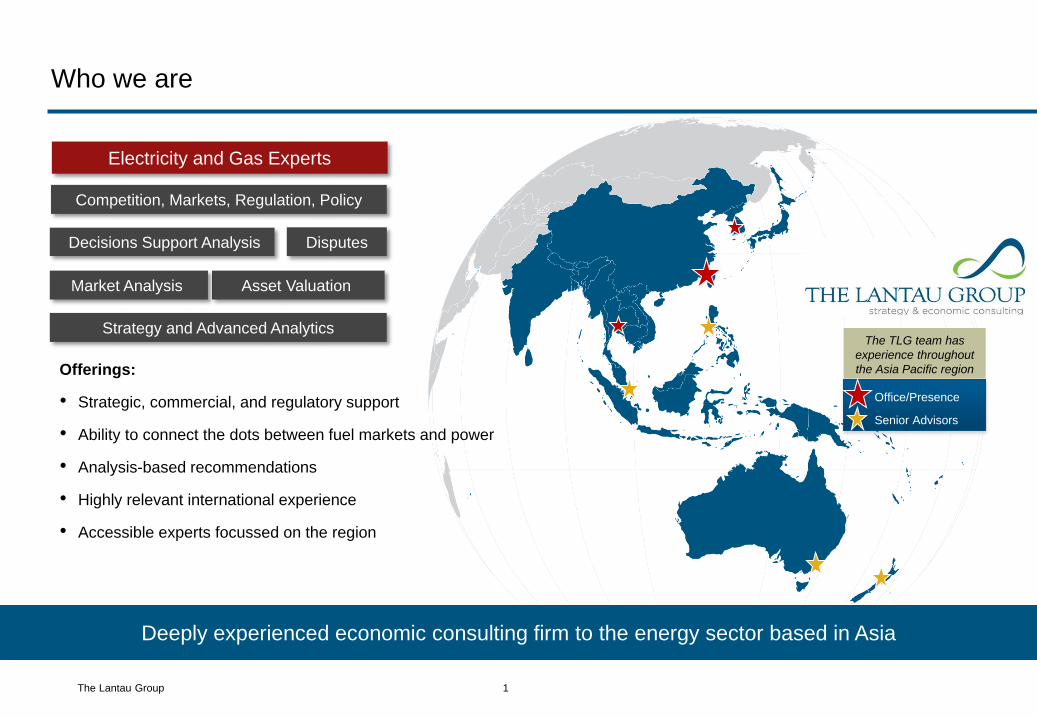
Deeply experienced economic consulting firm to the energy sector based in Asia
Who we are
Decisions Support Analysis
Asset Valuation
Strategy and Advanced Analytics
Competition, Markets, Regulation, Policy
Disputes
Market Analysis
Electricity and Gas Experts
The TLG team has
experience throughout
the Asia Pacific region
Office/Presence
Senior Advisors
Offerings:
• Strategic, commercial, and regulatory support
• Ability to connect the dots between fuel markets and power
• Analysis-based recommendations
• Highly relevant international experience
• Accessible experts focussed on the region
1
The Lantau Group
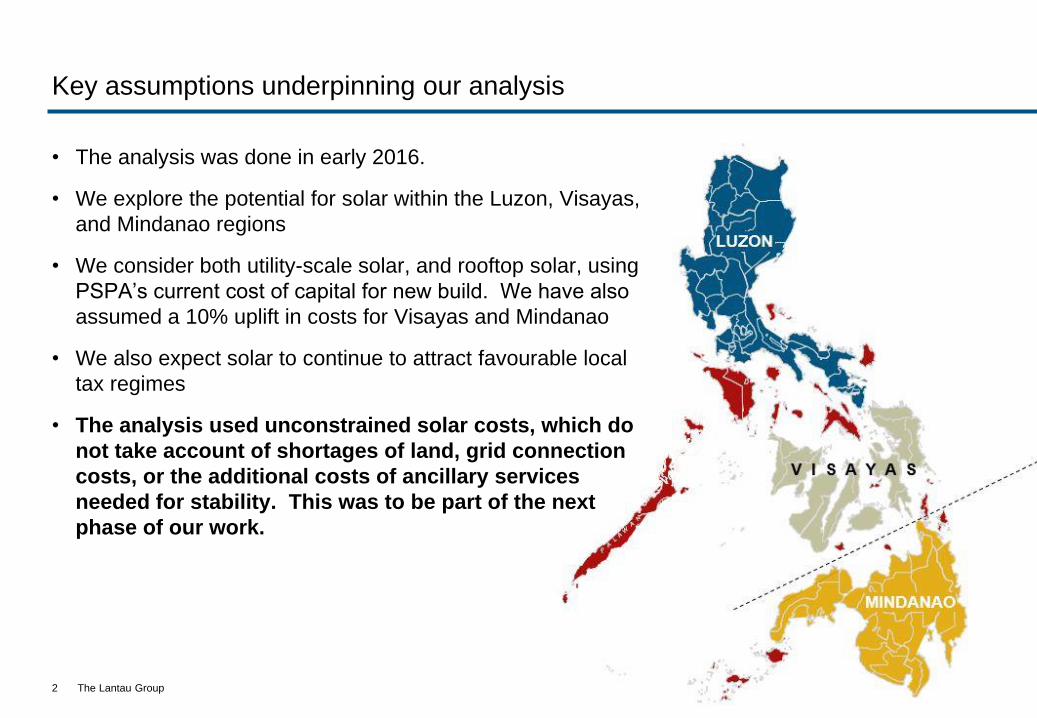
Key assumptions underpinning our analysis
• The analysis was done in early 2016.
• We explore the potential for solar within the Luzon, Visayas,
and Mindanao regions
• We consider both utility-scale solar, and rooftop solar, using
PSPA’s current cost of capital for new build. We have also
assumed a 10% uplift in costs for Visayas and Mindanao
• We also expect solar to continue to attract favourable local
tax regimes
• The analysis used unconstrained solar costs, which do
not take account of shortages of land, grid connection
costs, or the additional costs of ancillary services
needed for stability. This was to be part of the next
phase of our work.
2
The Lantau Group
0
1
2
3
4
5
6
7
8
9
10
20
30
40
50
60
70
80
90
100
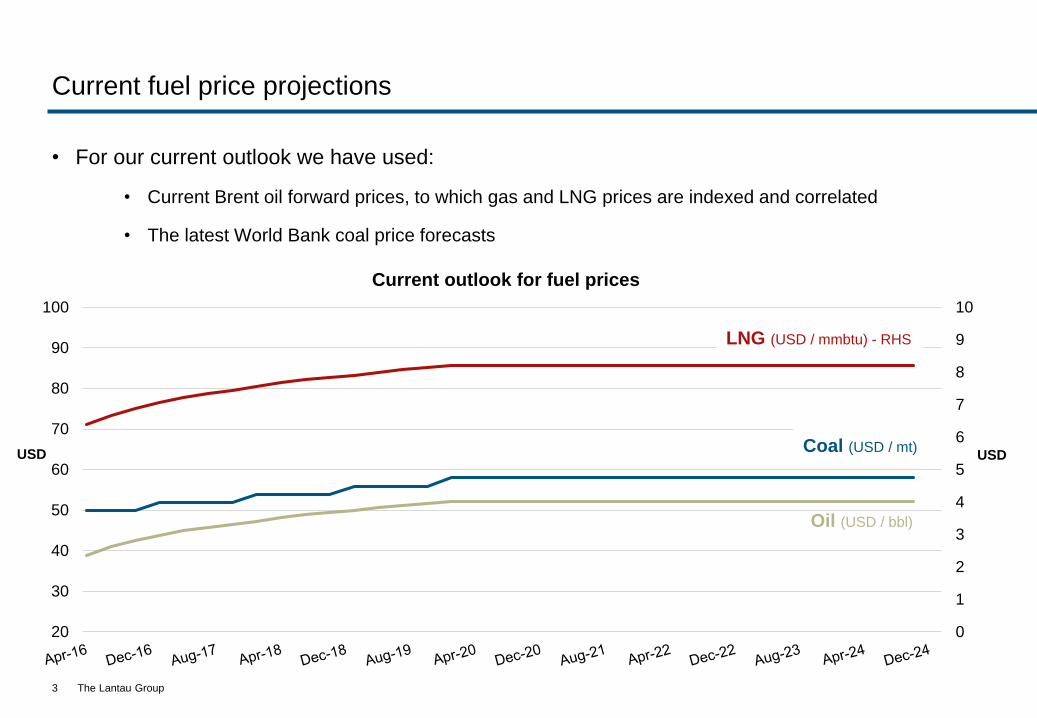
Current outlook for fuel prices
Current fuel price projections
• For our current outlook we have used:
• Current Brent oil forward prices, to which gas and LNG prices are indexed and correlated
• The latest World Bank coal price forecasts
3
USDUSD
LNG (USD / mmbtu) - RHS
Coal (USD / mt)
Oil (USD / bbl)

The Lantau Group
The demand outlook in the Philippines is supported by relatively robust
economic fundamentals with the potential for growth to accelerate
• Our assessment of macroeconomic growth and sectoral trends, alongside DOE projections,
paints a relatively strong picture for demand growth
4
Power demand in the Philippines remains relatively low compared to neighbouring nations, yet with
potential for demand growth to accelerate given the lower energy intensity per $ of GDP
(5) 0 5 10 15 20
Japan
New Zealand
Australia
Hong Kong
Singapore
Philippines
Thailand
Korea, Rep.
Myanmar
Malaysia
Indonesia
China
Vietnam
Percent
Electricity consumption annual growth
(1991-2013)
2011
1990
2005
1990
0
500
1,000
1,500
2,000
2,500
0 1 2 3 4 5 6 7
GDP per capita (2005 PPP US$)
PhilippinesIndonesiaThailandVietnamMalaysia
kWh consumption per capitaTotal consumption per capita vs. GDP per capita (1980-2013)

The Lantau Group
Our independent analysis is underpinned by sophisticated modelling of the
Philippine market, through which we are able to explore different scenarios
• QUAFU is an integrated generation dispatch modelling tool that incorporates state-of-the-art
optimisation theory grounded in proven techniques
5
The Lantau Group
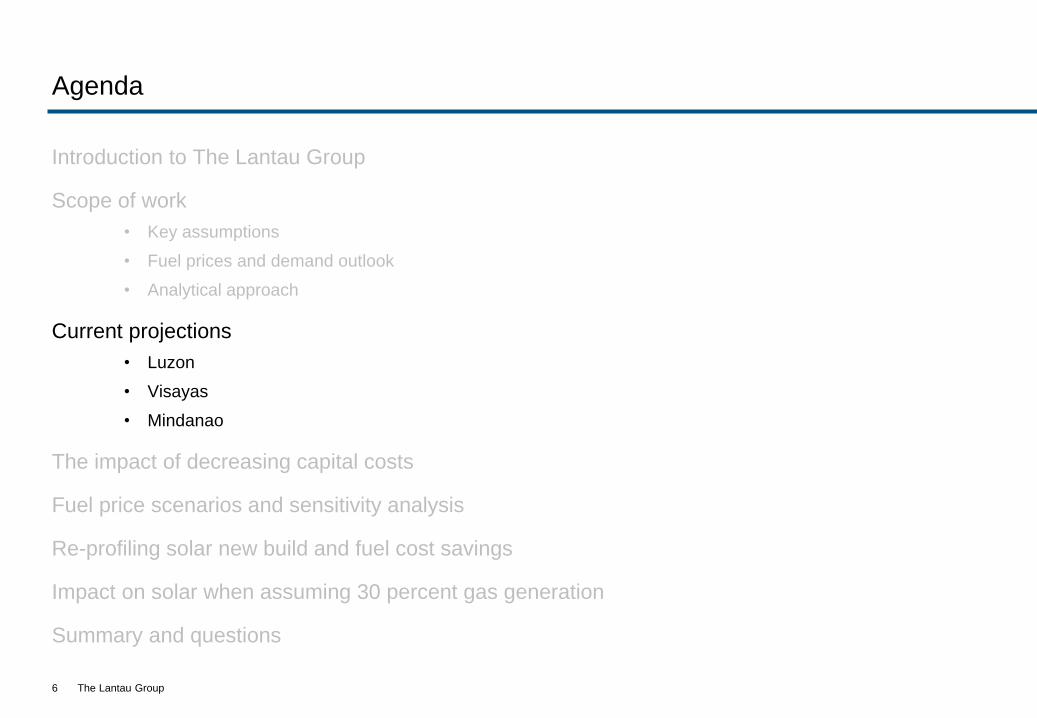
Agenda
Introduction to The Lantau Group
Scope of work
• Key assumptions
• Fuel prices and demand outlook
• Analytical approach
Current projections
• Luzon
• Visayas
• Mindanao
The impact of decreasing capital costs
Fuel price scenarios and sensitivity analysis
Re-profiling solar new build and fuel cost savings
Impact on solar when assuming 30 percent gas generation
Summary and questions
6

The Lantau Group
0
500
1,000
1,500
2,000
2,500
3,000
3,500
4,000
0
250
500
750
1,000
1,250
1,500
1,750 PHP / MWh
Cap
acit
y a
dd
itio
ns (
MW
)
Committed Biofuel
Committed Coal
Committed Natural Gas
Committed Solar
Generic Coal
Generic Natural Gas
Generic Solar
Time-weighted Price(Luzon)
With capital costs for solar remaining at today’s levels the new build outlook for
Luzon is dominated by coal and solar
• In Luzon, an excess of committed generation coming online between 2016-2020 (largely coal and gas) suppresses
WESM prices through to around 2022
• We hit a turning point in 2023 following the expiry of ToP gas contracts from Malampaya, which sees existing
CCGT plant price off more expensive gas ( LNG) and operate more in a mid-merit / peaking role.
• The resultant increase in prices then begins to incentivise new build, in particular for coal and solar
7
Projected average price
Expiry of Malampaya gas ToP contracts: thereafter gas
generation drops from 20 TWh to around 11 TWh per year
Projected average price
(Luzon)

The Lantau Group
However the fundamental outlook in Visayas is markedly different
• In Visayas, the amount of new solar capacity that could enter the market economically is naturally much lower,
with around 400 MW projected between 2016 – 2017
• The longer-term outlook for new build (across all fuels) is suppressed by strong capacity margins of between
0.9 GW and 1.5 GW above peak demand through to 2025
8
0
500
1,000
1,500
2,000
2,500
3,000
0
100
200
300
400
500
600
700
800
PHP / MWh
Cap
acit
y a
dd
itio
ns (
MW
)
Committed Coal
Committed Natural Gas
Committed Solar
Generic Coal
Generic Natural Gas
Generic Solar
Time-weighted Price(Visayas)
Projected
average price
Committed coal and solar coming
online equates to 80% of Visayas’
peak demand in 2016-2018
Projected average price
(Visayas)

The Lantau Group
With a similar picture in Mindanao
• Similar to Visayas, prices in Mindanao are not supportive of any new build in the short to
medium-term
9
0
1,000
2,000
3,000
4,000
5,000
6,000
7,000
8,000
9,000
10,000
11,000
0
100
200
300
400
500
600
700
800
900
1,000
1,100
PHP / MWh
Cap
acit
y ad
dit
ion
s (M
W)
Committed Coal
Committed Hydro
Generic Coal
Generic Oil
Generic Solar
Time-weighted Price(Mindanao)
Committed coal coming online
equates to 80% of Mindanao’s
peak demand in 2016-2017
Projected
average price
Projected average price
(Mindanao)
The Lantau Group
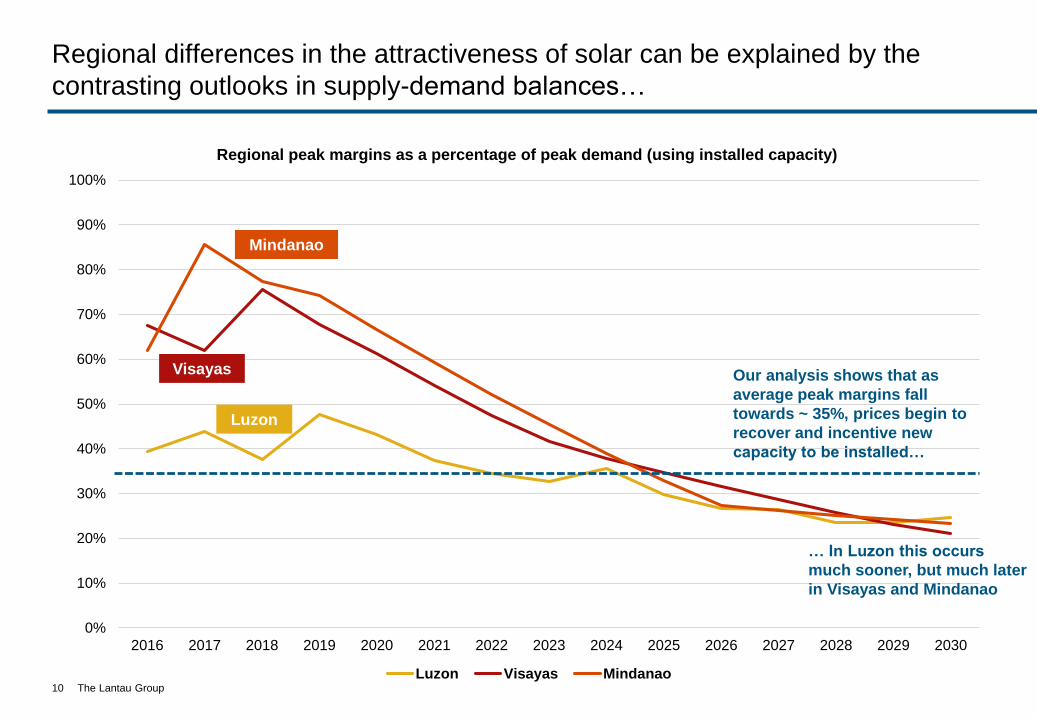
Regional differences in the attractiveness of solar can be explained by the
contrasting outlooks in supply-demand balances…
10
0%
10%
20%
30%
40%
50%
60%
70%
80%
90%
100%
2016 2017 2018 2019 2020 2021 2022 2023 2024 2025 2026 2027 2028 2029 2030
Regional peak margins as a percentage of peak demand (using installed capacity)
Luzon Visayas Mindanao
Luzon
Visayas
Mindanao
Our analysis shows that as
average peak margins fall
towards ~ 35%, prices begin to
recover and incentive new
capacity to be installed…
… In Luzon this occurs
much sooner, but much later
in Visayas and Mindanao
The Lantau Group
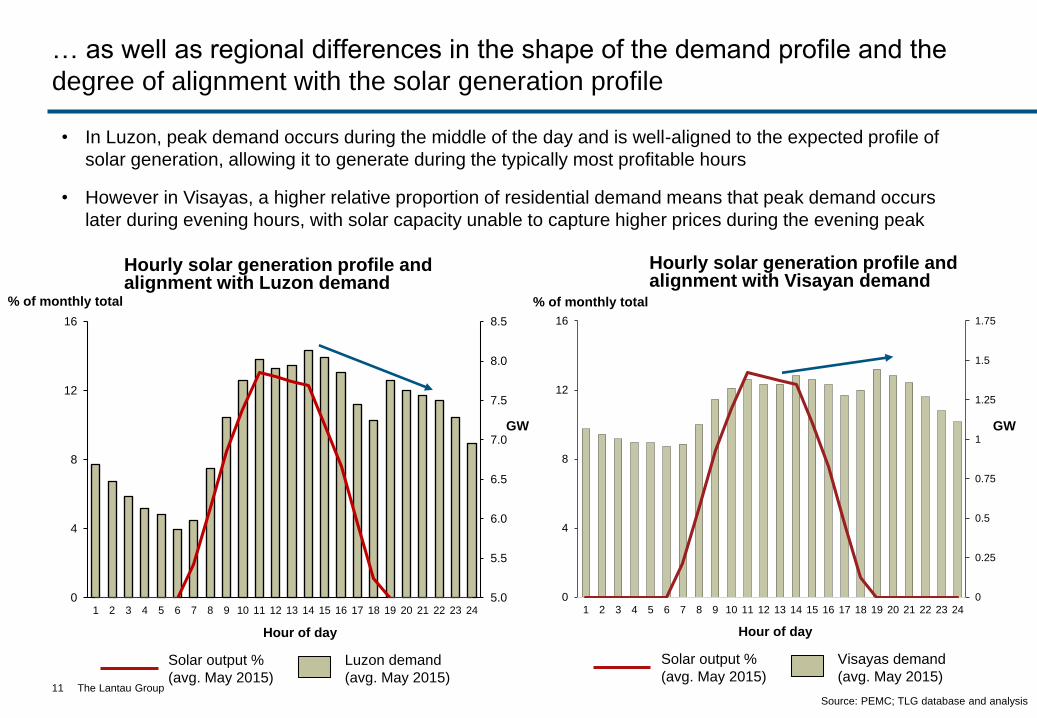
… as well as regional differences in the shape of the demand profile and the
degree of alignment with the solar generation profile
11
GW
Source: PEMC; TLG database and analysis
Solar output %
(avg. May 2015)
Luzon demand
(avg. May 2015)
% of monthly total
Hour of day
Hourly solar generation profile and alignment with Luzon demand
5.0
5.5
6.0
6.5
7.0
7.5
8.0
8.5
0
4
8
12
16
1 2 3 4 5 6 7 8 9 10 11 12 13 14 15 16 17 18 19 20 21 22 23 24
• In Luzon, peak demand occurs during the middle of the day and is well-aligned to the expected profile of
solar generation, allowing it to generate during the typically most profitable hours
• However in Visayas, a higher relative proportion of residential demand means that peak demand occurs
later during evening hours, with solar capacity unable to capture higher prices during the evening peak
GW
Hourly solar generation profile and alignment with Visayan demand
0
0.25
0.5
0.75
1
1.25
1.5
1.75
0
4
8
12
16
1 2 3 4 5 6 7 8 9 10 11 12 13 14 15 16 17 18 19 20 21 22 23 24
% of monthly total
Solar output %
(avg. May 2015)
Visayas demand
(avg. May 2015)
Hour of day
The Lantau Group
Agenda
Introduction to The Lantau Group
Scope of work
• Key assumptions
• Fuel prices and demand outlook
• Analytical approach
Current projections
• Luzon
• Visayas
• Mindanao
The impact of decreasing capital costs
Fuel price scenarios and sensitivity analysis
Re-profiling solar new build and fuel cost savings
Impact on solar when assuming 30 percent gas generation
Summary and questions
12

The Lantau Group
In reality the cost of new solar is highly likely to continue to fall
• Solar costs have been on a clear downward trajectory for the last 8 – 10 years, and are expected
to continue to fall, albeit at a more gradual rate
• We have prudently assumed costs fall by 1.5% pa. until 2025, and 0.75% pa. thereafter
• Solar costs fall 1.5% pa. until
• By 2030
13
2016 2020 2025 2030
2016 current costs (PSPA)US $2,290 / kW (rooftop)
US $1,400 / KW (utility-scale)
2030 projected costsUS $1,925 / kW (rooftop)
US $1,177 / KW (utility-scale)
The Lantau Group
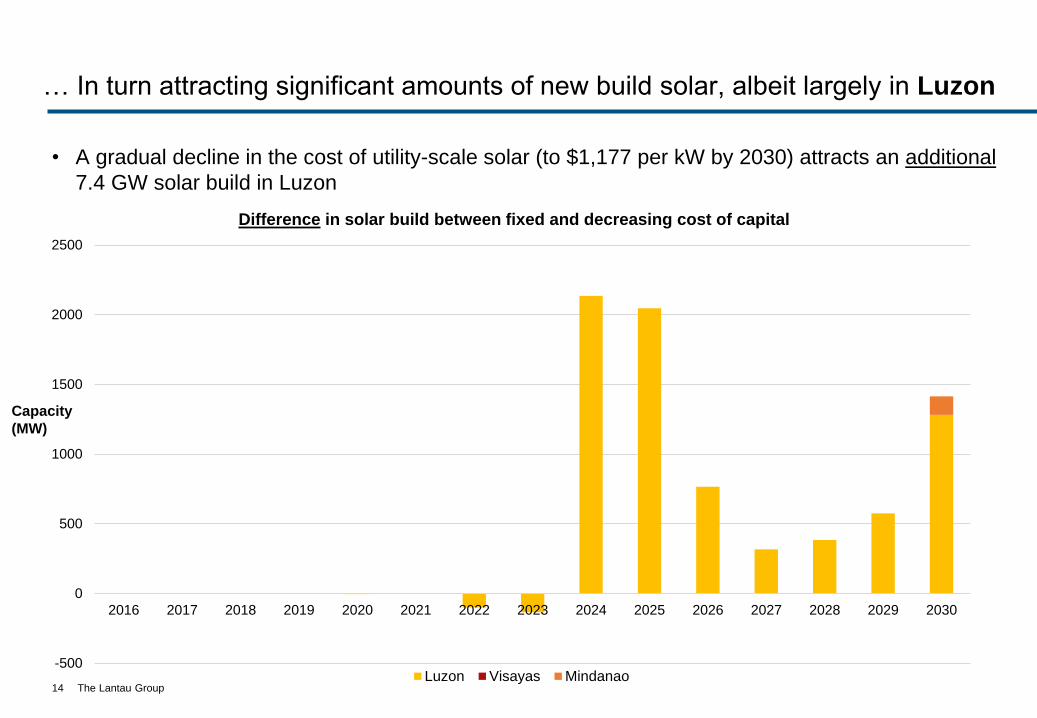
… In turn attracting significant amounts of new build solar, albeit largely in Luzon
• A gradual decline in the cost of utility-scale solar (to $1,177 per kW by 2030) attracts an additional
7.4 GW solar build in Luzon
14
-500
0
500
1000
1500
2000
2500
2016 2017 2018 2019 2020 2021 2022 2023 2024 2025 2026 2027 2028 2029 2030
Difference in solar build between fixed and decreasing cost of capital
Luzon Visayas Mindanao
Capacity
(MW)
The Lantau Group
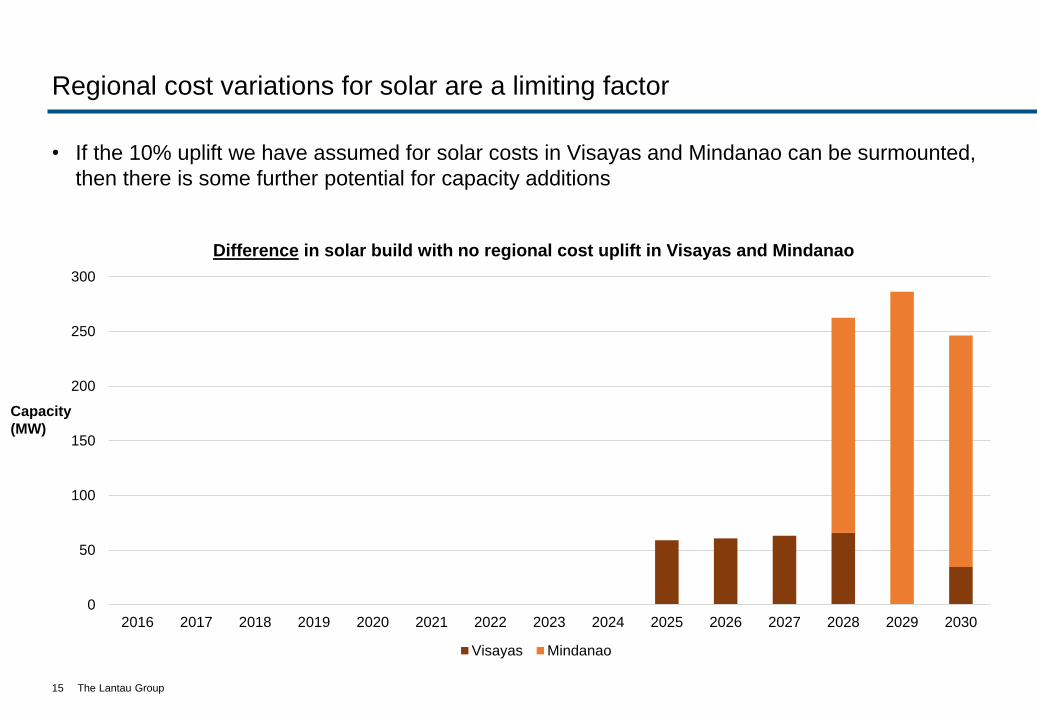
Regional cost variations for solar are a limiting factor
• If the 10% uplift we have assumed for solar costs in Visayas and Mindanao can be surmounted,
then there is some further potential for capacity additions
15
0
50
100
150
200
250
300
2016 2017 2018 2019 2020 2021 2022 2023 2024 2025 2026 2027 2028 2029 2030
Difference in solar build with no regional cost uplift in Visayas and Mindanao
Visayas Mindanao
Capacity
(MW)

The Lantau Group
Understanding the sensitivity of solar build to future fuel price dynamics is key
• We modelled a set of fuel price scenarios based around different oil price projections to 2020
16
‘Flat-Lining’ – based on current prices remaining static
‘High Fuel 2’ – based on a rise in oil prices to $85
‘High Fuel 1’ – based on a rise in oil prices to $70
‘Current Outlook’ – based on current and implied price forecasts
‘Low Fuel’ – based on a fall in oil prices to $20 by 2020
‘High Fuel 3’ – based on a rise in oil prices to $100
0
10
20
30
40
50
60
70
80
90
100
Fuel price scenarios used in this analysis
Brent
crude
(US / bbl)
The prices above are nominal and
adjusted to real terms in our modelling

The Lantau Group
In Luzon, utility-scale solar is well placed to capitalise on increasing fuel
prices, whilst also showing a high level of resilience to falling oil prices
17
-
2,000
4,000
6,000
8,000
10,000
12,000
14,000
16,000
2016 2017 2018 2019 2020 2021 2022 2023 2024 2025 2026 2027 2028 2029 2030
Cumulative solar build in Luzon (from 2016)
High Fuel 3 High Fuel 2 High Fuel 1 Current Outlook Flat-Lining Low Fuel
Cumulative
capacity
build (MW)
+ 4 GW
capacity
When oil prices fall below $28 we
start to see a pronounced
decrease in solar, as it becomes
displaced by new CCGT gas plant
and an increase in generation at
existing gas plant
In the most bullish scenario, solar
displaces around 16 TWh of gas
generation between 2020-2025,
rising to 40 TWh between 2026-2030
Current outlook

The Lantau Group
Rising fuel prices significantly benefit solar build, which sees a significant
increase in generation almost entirely at the expense of existing gas-fired plant
18
-10
-8
-6
-4
-2
0
2
4
6
8
10
2016 2017 2018 2019 2020 2021 2022 2023 2024 2025 2026 2027 2028 2029 2030
Change in generation mix (TWh) in Luzon between ‘Current Outlook’ and ‘High Fuel 3’ scenario
Natural Gas Coal Solar
TWh
generation
• Again, the expiry of ToP contracts from Malampaya marks a clear turning point, and thereafter
gas plant shifts further up the merit order curve

The Lantau Group
-
100
200
300
400
500
600
2016 2017 2018 2019 2020 2021 2022 2023 2024 2025 2026 2027 2028 2029 2030
Cumulative solar build in Visayas (from 2016)
High Fuel 3 High Fuel 2 High Fuel 1 Current Outlook Flat-Lining Low Fuel
In Visayas, a bearish supply-demand outlook persists with only small increases
19
Cumulative
MW
+ 150
MW

The Lantau Group
-
200
400
600
800
1,000
1,200
1,400
1,600
1,800
2,000
2016 2017 2018 2019 2020 2021 2022 2023 2024 2025 2026 2027 2028 2029 2030
Cumulative solar build in Mindanao (from 2016)
High Fuel 3 High Fuel 2 High Fuel 1 Current Outlook Flat-Lining Low Fuel
Whilst in Mindanao, solar is sensitive to rising fuel prices over the longer term
20
Cumulative
MW
+ 1.6
GW
• From 2024 rising fuel prices begin to support the economic build of solar, displacing what would
otherwise be new oil-fired plant additions

The Lantau Group
A recovery in the energy complex over the medium-term would provide a
unique window for Philippine industry to capitalise on the present situation
• History has shown oil prices tend to follow strong cyclical patterns, and we appear to have seen
a recent bottoming-out of oil prices
• In each of our scenarios where we forecast a rise in oil prices, the new build of solar becomes
increasingly attractive as thermal generation spreads are squeezed and new build is deterred
21
0
2
4
6
8
10
12
14
16
18
20
US
D/G
J,
20
14 r
eal te
rms
Note: Crude price 1970-1979 Saudi Arabian Light, 1979-present Brent
Source: TLG analysis
Oil price
When comparing the current
outlook for fuel prices with the
most bullish scenario, we see
an additional 5.8 GW of new
solar across Luzon, Visayas
and Mindanao by 2030
(assuming decreasing solar
costs)

The Lantau Group
Whilst staying ahead of the investment cycle of conventional generation is critical
• When oil prices are juxtaposed with fuel spreads, clear ‘windows’ exist for conventional new
build projects to be developed and come online
• Thus it is vital for solar new build to get ahead of the next window, displacing the next wave of
conventional new build that would ultimately subdue future power prices
22
Note: Crude price 1970-1979 Saudi Arabian Light, 1979-present Brent; Coal price Newcastle
Source: World Bank; TLG analysis
Coal price
Oil price
0
2
4
6
8
10
12
14
16
18
20
‘Coal window’ ‘Coal window’
US
D/G
J,
20
14 r
eal te
rm
‘Gas window’ ‘Gas window?’
Will gas or
solar win
the coming
round?

The Lantau Group
• In practice it may be unrealistic or impractical for industry to install the significant amounts of
new solar capacity within such a narrow timeframe
There may be opportunities to accelerate the addition of capacity, thereby
allowing the industry to scale and avoid future supply bottlenecks
23
Smoothing of solar capacity additions in Luzon, assuming a ‘High Fuel 3’ scenario and decreasing solar costs)
2024-2025 new build
capped at 2 GW, with
excess built early
Projected
average price
0
500
1,000
1,500
2,000
2,500
3,000
3,500
4,000
4,500
5,000
0
250
500
750
1,000
1,250
1,500
1,750
2,000
2,250
2,500
2016 2017 2018 2019 2020 2021 2022 2023 2024 2025 2026 2027 2028 2029 2030
PHP / MWh
MW
Generic Coal
Committed Natural Gas
Committed Biofuel
Committed Coal
Generic Solar
Committed Solar
Load-weighted Price (Luzon)
Price (without early build)

The Lantau Group
• When taking into account the amount of conventional, fossil fuel generation that is displaced by
bringing forward solar new build, fuel cost savings amount to around 5%
Additionally, accelerating the new build of solar achieves wider benefits by
reducing fuel costs and ultimately the burden on consumers
24
Projected fuel
cost savings
US
D $
m (
2014 r
ea
l te
rms)
-
1,000
2,000
3,000
4,000
5,000
6,000
2016 2017 2018 2019 2020 2021 2022 2023 2024 2025 2026 2027 2028 2029 2030
Projected fuel costs
'High Fuel 3' scenario 'High Fuel 3' scenario with early build of solar in Luzon
The Lantau Group
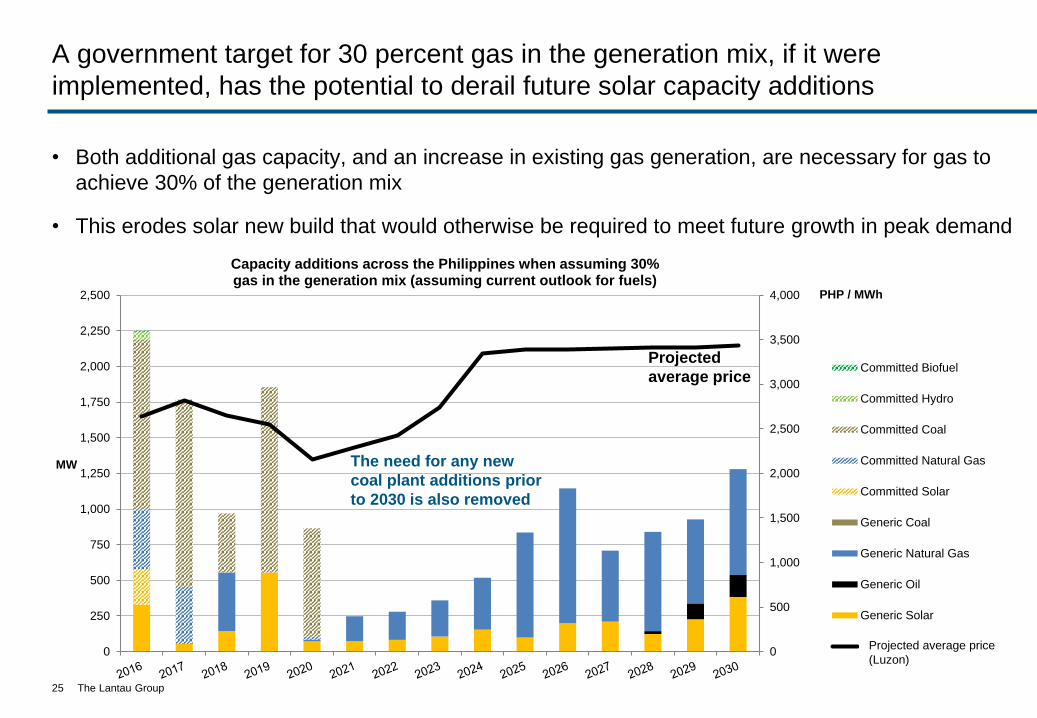
• Both additional gas capacity, and an increase in existing gas generation, are necessary for gas to
achieve 30% of the generation mix
• This erodes solar new build that would otherwise be required to meet future growth in peak demand
A government target for 30 percent gas in the generation mix, if it were
implemented, has the potential to derail future solar capacity additions
25
0
500
1,000
1,500
2,000
2,500
3,000
3,500
4,000
0
250
500
750
1,000
1,250
1,500
1,750
2,000
2,250
2,500 PHP / MWh
MW
Capacity additions across the Philippines when assuming 30%gas in the generation mix (assuming current outlook for fuels)
Committed Biofuel
Committed Hydro
Committed Coal
Committed Natural Gas
Committed Solar
Generic Coal
Generic Natural Gas
Generic Oil
Generic Solar
Time-weighted Price (Luzon)Projected average price
(Luzon)
Projected
average price
The need for any new
coal plant additions prior
to 2030 is also removed

The Lantau Group
A government target for 30 percent gas in the generation mix, if it were
implemented, has the potential to derail future solar capacity additions
26
-
1,000
2,000
3,000
4,000
5,000
6,000
7,000
8,000
9,000
10,000
11,000
2016 2017 2018 2019 2020 2021 2022 2023 2024 2025 2026 2027 2028 2029 2030
CumulativeMW
Cumulative new build of solar across the Philippines when comparing30% gas in the generation mix with our current outlook
Total solar build (No Min Gas) Total solar build (30% Min Gas Share)
- 7.5
GW
The Lantau Group27
Thank You.
We look forward to continue playing a key role in the
development of solar generation in the Philippines.
4602-4606 Tower 1, Metroplaza
223 Hing Fong Road
Kwai Fong, Hong Kong
Tel: +852 2521 5501
www.lantaugroup.com