lng infrastructure in philippines - the lantau group · the lantau group how does the changing fuel...
TRANSCRIPT

The Lantau Group
LNG Infrastructure in Philippines Sarah Fairhurst
The Lantau Group
What drives LNG Infrastructure?
• Economic Drivers
– The use of LNG is cheaper than some alternative fuel
• Environmental Drivers
– The use of LNG reduces emissions or other harmful outcomes
• Government Policy
– Government gives incentives or defines policy that makes LNG more attractive than other options
1

The Lantau Group
So what has changed on these in the past year?
• Economic Drivers
– Changes in the oil price are significant since the conference last year. Will this drive more LNG in
Philippines?
– Advancement of new gas-fired projects (San Gabriel phase 2 & Avion) and coal fired projects have
progressed
• Environmental Drivers
– Expansion of quotas for Renewable Energy
– No change in coal taxation; no overt moves to a “carbon tax”
• Government Policy
– No change
– Gas Master Plan, while completed, has not been published
2
The rest of the presentation will focus mainly on economic drivers

The Lantau Group
40
50
60
70
80
90
100
110
120
Da
ily B
ren
t p
ric
e, U
SD
/ba
rre
l
Jan '14 Feb Mar Apr May Jun Jul Aug Sep Oct Nov Dec '14 Jan '15 Feb
Asian LNG prices are linked to oil prices.
Brent has dropped by half from the high level in H1 2014
3 Source: ICE, Reuters, GS Global Investment Research and TLG analysis
ISIS attacked
Iraq
Price stabilized at
$100-110/barrel in
H1 2014 as Saudi
Arabia proactively
balanced the crude
market
Libya ports
re-opened
US air-
strike
on Iraq
started
1st sanction on
Russia
Saudi cut Oct
OSP priced
Saudi cut
Nov OSP
priced
Crude production in Iraq and Russia are not disrupted
while Libya supply returned despite of political turmoil

The Lantau Group
This is reflected in the spot price of LNG over the last 18 months
4
0
5
10
15
20
25
8/14/13 11/22/13 3/2/14 6/10/14 9/18/14 12/27/14 4/6/15
Daily JKM Spot Prices, $/MMBtu
Time period during which
modelling for Gas Master
Plan was carried out

The Lantau Group
But LNG is not the only fuel to have changed price. Coal prices have also
softened gradually since early 2011
5
0
20
40
60
80
100
120
140
160
180
09 08 07 06 05 04 03 02 01 16 15 14 13 12 11 2000 10
US$/MT or bbl
Source: World Bank; Macquarie
Oil (Brent)
Coal
(Newcastle)
Coal and oil monthly prices (2000-Feb 2015)
0
2
4
6
8
10
12
14
16
18
20
20
30
40
50
60
70
80
90
100
Australian Coal Prices ($/Tonne)
Asian Spot LNG prices ($/MMBtu)
Since the start of the Master Plan process

The Lantau Group
0
20
40
60
80
100
120
140
2000 2001 2003 2004 2006 2007 2009 2011 2012 2014 2015 2017 2019 2020
End 2009 future price
US$/barrel
Forward price in June 2014
End 2008 future prices
15th September 2014
Forward price on 20th Feb 2014
31th October 2014
In addition, we should not forget that the longer term has not changed as much
as the short term
• Forward price curves in recent years have been quite consistent
6
Brent forward curve
Source: ICE
Dated Brent
($/barrel)
2013 (historical) 109
2014 (historical) 99
2015 (forecast) 55
2016 (forecast) 65
2017 (forecast) 70
2018 (forecast) 75
2019 (forecast) 80
2020 (forecast) 80
The market thinks that oil (and thus LNG) prices will rise again in the medium
term
The Lantau Group
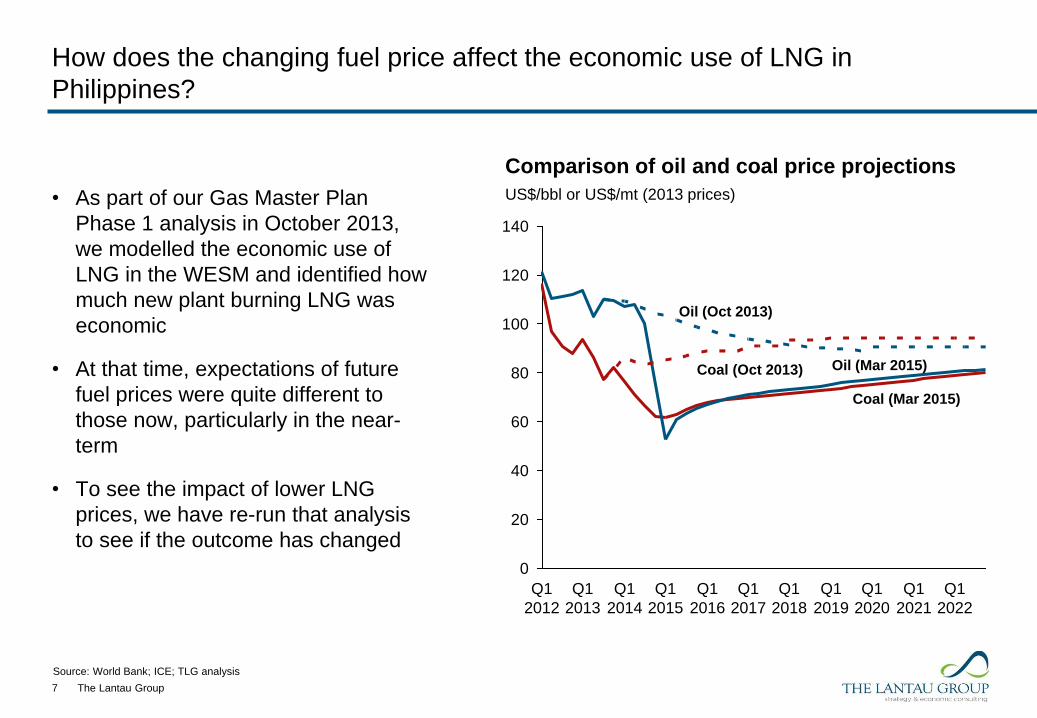
How does the changing fuel price affect the economic use of LNG in
Philippines?
• As part of our Gas Master Plan
Phase 1 analysis in October 2013,
we modelled the economic use of
LNG in the WESM and identified how
much new plant burning LNG was
economic
• At that time, expectations of future
fuel prices were quite different to
those now, particularly in the near-
term
• To see the impact of lower LNG
prices, we have re-run that analysis
to see if the outcome has changed
7
0
20
40
60
80
100
120
140
Q1
2014
Q1
2015
Q1
2013
Q1
2012
Q1
2016
Q1
2017
Q1
2018
Q1
2020
Q1
2021
Q1
2019
Q1
2022
US$/bbl or US$/mt (2013 prices)
Comparison of oil and coal price projections
Oil (Oct 2013)
Coal (Oct 2013) Oil (Mar 2015)
Coal (Mar 2015)
Source: World Bank; ICE; TLG analysis
The Lantau Group
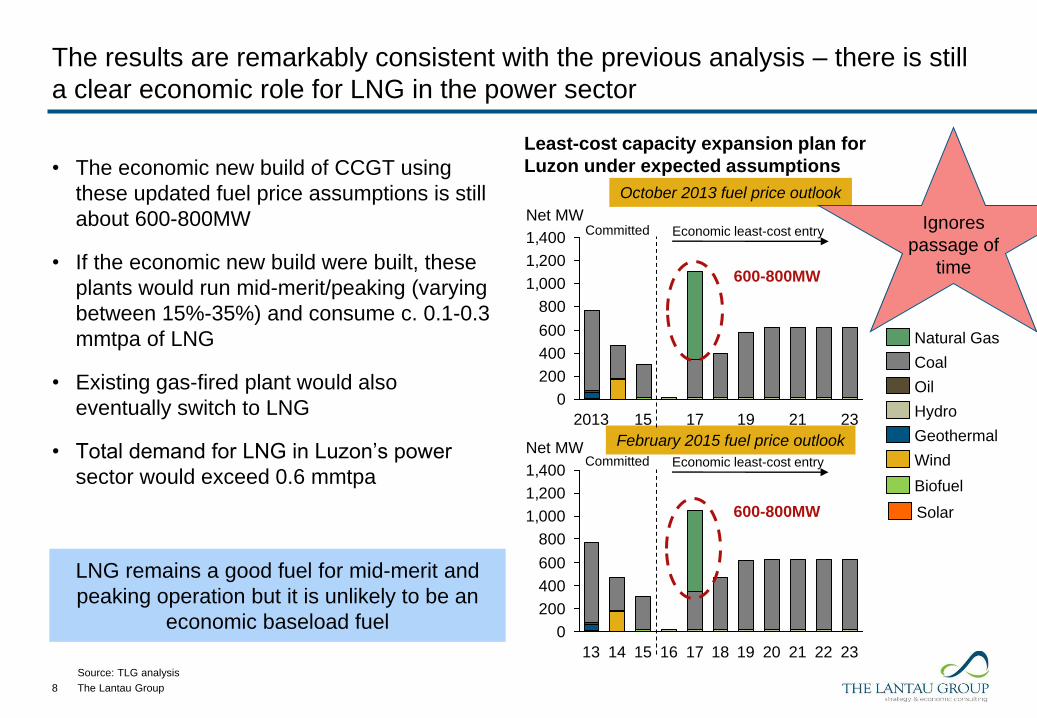
LNG remains a good fuel for mid-merit and
peaking operation but it is unlikely to be an
economic baseload fuel
• The economic new build of CCGT using
these updated fuel price assumptions is still
about 600-800MW
• If the economic new build were built, these
plants would run mid-merit/peaking (varying
between 15%-35%) and consume c. 0.1-0.3
mmtpa of LNG
• Existing gas-fired plant would also
eventually switch to LNG
• Total demand for LNG in Luzon’s power
sector would exceed 0.6 mmtpa
8
The results are remarkably consistent with the previous analysis – there is still
a clear economic role for LNG in the power sector
Least-cost capacity expansion plan for
Luzon under expected assumptions
0
200
400
600
800
1,000
1,200
1,400
23 21 18 20 22 14 16 19 17 15 13
Net MW
October 2013 fuel price outlook
February 2015 fuel price outlook
Natural Gas
Biofuel
Wind
Geothermal
Hydro
Oil
Coal
Solar 600-800MW
Economic least-cost entry Committed
0
200
400
600
800
1,000
1,200
1,400
19 17 15 2013 23 21
Net MW Economic least-cost entry Committed
600-800MW
Source: TLG analysis
Ignores
passage of
time

The Lantau Group
Taking into account the passage of time, other developments also affect the
need for more gas-fired capacity and ultimately more LNG demand
9
Least-cost capacity expansion plan for
Luzon under expected assumptions
0
200
400
600
800
1,000
1,200
1,400
19 17 15 2013 23 21
Net MW Economic least-cost entry Committed
0
200
400
600
800
1,000
1,200
1,400
15 14 13 23 22 21 20 19 18 17 16
Net MW
October 2013 outlook
Natural Gas
Biofuel
Wind
Geothermal
Hydro
Oil
Coal
Solar
• Option to use Malampaya gas supports more
gas-fired capacity
– As anticipated but not then certain, FirstGen’s San
Gabriel phase 2 and Avion have since achieved
financing and are under construction
– They plan to eventually use Malampaya gas and
ultimately LNG
– Changing the way Malampaya gas is used supports the
entry of more gas-fired capacity and ultimately more
LNG
• Additional renewable impacts on system
– Significantly more solar and wind capacity appears likely
in response to Government policies increasing total
available capacity
– More intermittent generation may require more flexible
plant in the system to respond to times when solar and
wind are unavailable
• Reduced incentives to build peaking capacity
– Lower offer price cap and new secondary price
cap decrease the incentives to build new gas-
fired capacity
600-800MW
Economic least-cost entry Committed
February 2015 outlook
400-600MW
Source: TLG analysis
500MW

The Lantau Group
Key factors that could affect economics of LNG remain uncertain
• Malampaya supplies after expiry of current GSPAs and SC38
– Quantities
– Pricing
– Degree of flexibility
• WESM offer price cap, secondary price cap and other market interventions
– Provide lower incentives for investors by seemingly reducing ability to make required returns on investment
– We are already seeing various potential investors pulling out of the market
• Regulatory framework for contracting with power offtakers
– ERC rules still under development
– Uncertainty over long-term direction of retail market (no gentailers?)
• Demand growth
– Economic expectations falling below Government targets?
10

The Lantau Group
The good news is that new LNG supplies should push down spot LNG prices in
Asia….
11
2015 2016
3.6 Mtpa PNG T1
3.6 Mtpa PNG T2
5 Mtpa Australia Gorgon T1
5 Mtpa Gorgon T2
5 Mtpa GorgonT3
4.25 Mtpa Australia (Curtis) T1
2017
4.25 Mtpa Curtis T2
7.8 Mtpa Australia Gladstone T1,2
2.1 Mtpa Indonesia Donggi-Senoro
4.5 Mtpa Australia APLNG T1
2014
= coal seam gas projects
9 Mtpa Sabine Pass LNG
train 1 and 2 from US
9 Mtpa Sabine Pass LNG train 3 and 4

The Lantau Group
…the bad news is that lower oil and LNG prices mean that some projects have
now been delayed or cancelled
For example:
• Petronas has delayed making a final investment decision on plans to export liquefied natural gas
from British Columbia
• BG Group said it was delaying a decision on the Louisiana LNG project
• Shell has cancelled plans for the Arrow LNG project in Queensland, Australia
• Woodside has delayed the investment decision on the Browse floating LNG project off Western
Australia. The Chevron-operated Gorgon project in Western Australia is also running late.
– Cost over runs are also plaguing Australian LNG projects, making new projects less certain
12
Most of these cite low LNG prices as the cause of the delay or cancellation

The Lantau Group
In summary, the message remains substantially the same as last year, despite
the large global changes in prices
• LNG is economic in the Philippines for mid-merit operation
• The volume of LNG required is modest
• There remain challenges in bringing LNG into the Philippines and incentivising the
market to build and burn the economic quantity of LNG
13

The Lantau Group
Thank You
Contact
Sarah Fairhurst [email protected]
By phone +852 2521 5501 (office)
By mail 4602-4606 Tower 1, Metroplaza
223 Hing Fong Road,
Kwai Fong, Hong Kong
Online www.lantaugroup.com
Rigour
Value
Insight
Energy Power Utilities
14

The Lantau Group
We cover the Asia Pacific region
15
End user price projections
Transmission development
Energy policy issues
Electricity and gas pricing to multiple industrial facilities
Generation opportunities (all fuel types)
Policy and regulatory developments
Retail contracting and power price
projections
Generation opportunity development
Capacity contracting
Energy price projections and impacts
Market design
Energy Market Review)
Power sector review
Gas pricing and demand
Electricity and gas pricing to multiple sites
Energy price projections
Tariff benchmarking
Natural gas entry opportunity
Energy price projections (electricity
and gas)
Regulatory developments
Tariff benchmarking and design