soils, nutrients and fertilizers part i
TRANSCRIPT

Tonight’s hosts
Pat McGlynnFlathead County Extension Agent
[email protected], 758-5554
Clain JonesMSU Extension Soil Fertility [email protected], 994-6076

Soil Fertility and Testing
Winter Soil Fertility Series: Week 1
Jan 6, 2021
Clain Jones, Extension Soil Fertility Specialist406-994-6076, [email protected]
Photo by K. Olson-Rutz

Today’s topics
• Soil properties and how they affect plant nutrients
• How to read a soil test• The limitations of soil properties you can
influence• 4Rs of Fertilization

Soil Quality vs Soil Health
Soil Quality = properties that change little, if at all, with land use management practices, often found on a traditional soil test• Texture• Cation Exchange Capacity
Soil Health = dynamic properties which may be subjective to measure• Aggregation• Microbial activity• Tilth• Nutrient availability• Water holding capacity• CompactionWhere do SOM and soil
pH belong?
On both lists

Mineral ~ 48%
Air ~ 25%
Water ~ 25%
Organic matter ~ 2%
Average Soil Composition
TexturepHCation Exchange Capacity (CEC)Organic matter (SOM)• small in % volume• controls >90% of function
Soil properties that affect soil nutrients and plant health

What to look for on a soil test report? Factors affecting plant health and production
Factor Values of concern Impact/considerNutrient content Nutrient dependent Too little = hungry plants, too much =
contaminate water, burn plants
Soil organicmatter
≤ 1 (%) Minimize bare soil, increase N, add legumes
> 3 (%) N credit
Soil pH
< 5 Al toxicity
< 6 Poor seedling establishment and legume nodulation
> 8.3 Nutrients tied up, likely high Na
Soluble salts (EC) > 4 (mmhos/cm) Too saline, water stress, nutrient
imbalance
Soil texture and CEC Water and nutrient holding capacity
Factor Values of concern Impact/considerNutrient content Nutrient dependent Too little = hungry plants, too much =
contaminate water, burn plants
Soil organicmatter
≤ 1 (%) Minimize bare soil, increase N, add legumes
> 3 (%) N credit
Factor Values of concern Impact/considerNutrient content Nutrient dependent Too little = hungry plants, too much =
contaminate water, burn plants
Soil organicmatter
≤ 1 (%) Minimize bare soil, increase N, add legumes
> 3 (%) N credit
Soil pH
< 5 Al toxicity
< 6 Poor seedling establishment and legume nodulation
> 8.3 Nutrients tied up, likely high Na

Particle and pore size
Water and
nutrient holding capacity
Sand: large pore space, low surface area = low water or nutrient holding capacity
Clay: small pore space, large surface area, often negative charge on surface = holds water and nutrients tight
Soil texture
Ideal is loam to clay loam
approx. equal parts of sand,
silt, clay
Mason jar test instructions athttp://landresources.montana.edu/soilfertility/documents/PDF/SoilTextureJarTest.pdf

Mason jar texture test Fill a straight sided jar 1/3 with soil
Add water until almost full
Add 1 tsp dishwasher soap or water softener (why?)
Shake and let settle
Mark sand depth at 1 min.
Mark silt depth after 2-6 hours (or by color/texture change with clay at 24 hr)
Calculate clay by difference (or measure at 24 hours)
http://landresources.montana.edu/soilfertility/documents/PDF/SoilTextureJarTest.pdf

Using the soil texture triangle Textural
triangle for the tactile

DrainageInfiltration
Water holding capacity
Aeration CEC
Sand excellent poor excellent low
Silt good good good medium
Clay poor excellent poor high
Texture Effects on Soil Properties
Soils with large surface areas, such as clay and organic matter, have more cation exchange capacity and surface area and therefore are generally more fertile.

loamy sandCEC ≈ 10
-
clayCEC ≈ 40 -
-
-
-
SOMCEC ≈ 200 -
-
-
--
--
-
- -
- -
------
-
-
Cation Exchange Capacity CEC the parking spaces for nutrients in the soil• CEC is the total neg. charge on a soil
(meq/100g)
• A high CEC soil (> 15) has the capacity to attract and hold nutrients with positive charges, e.g. K+, Zn+2, NH4
+
• Large surface area (clay, SOM) ≈ larger CEC ≈ generally more fertile.
• What else might high CEC soils hold onto?
• CEC of mineral soil is hard to change but can slowly change SOM
Herbicides
1 Tbsp sand has surface area of a kitchen table
1 Tbsp has surface area of a football field

What does SOM do for soil?
SOM = Soil organic matter
Hudson 1994
• Increases water holding capacity which helps nutrients move from soil to plant roots and should increase yield
• As decomposes it releases nutrients bound in OM structure

Small increases in SOM lead to potentially large improvement in soil structure
Fisher et al., 2007Australia, irrigated, variety of soil types
Aggregate stabilityWater infiltrationRoot growthReduced water
and wind erosion

Guesses on how long to increase soil organic matter (SOM) from 1.4 to 1.5%?
Changing SOM?
• A long time. MSU study, CRP increased SOM from 1.4% to 1.5% in 10 years in top foot.
• Fallow, especially tilled – loses SOM!
• Hay, or heavily grazed pasture maybe maintaining, likely losing SOM
Engel et al. 2017
1. 2 years2. 10 years3. 20 years4. 50 years
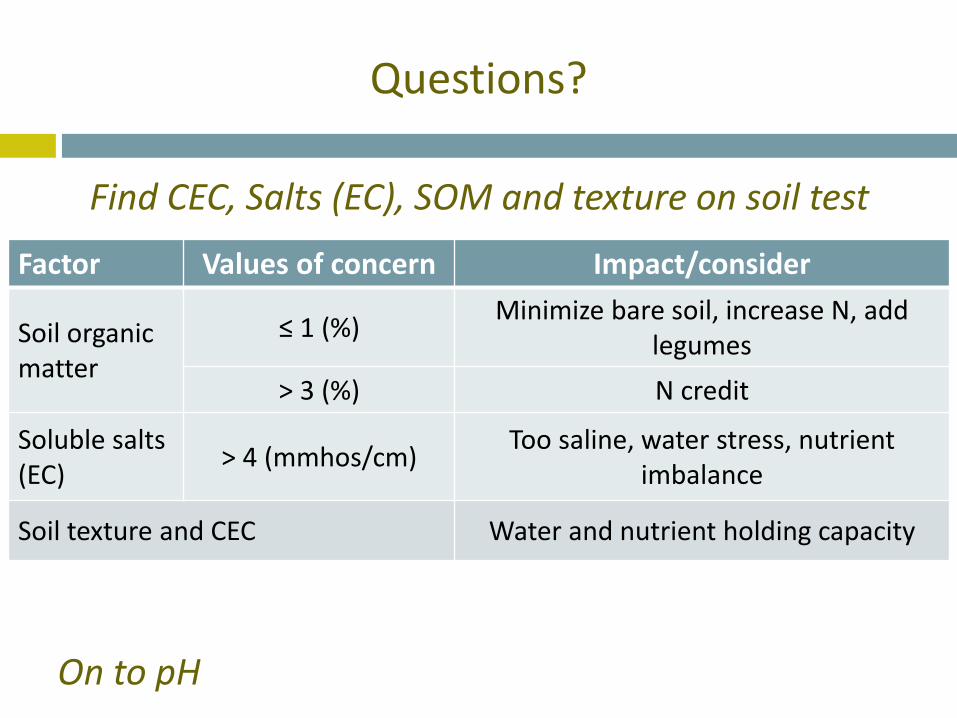
Questions?
Find CEC, Salts (EC), SOM and texture on soil test
Factor Values of concern Impact/consider
Soil organicmatter
≤ 1 (%) Minimize bare soil, increase N, add legumes
> 3 (%) N credit
Soluble salts (EC) > 4 (mmhos/cm) Too saline, water stress, nutrient
imbalance
Soil texture and CEC Water and nutrient holding capacity
On to pH

pH affects soil nutrient availability
High pH, alkaline calcareous soils –may limit P, Fe, Mn, B, Cu, Zn, plant can’t get them
Low pH, acidic soils – may limit N, and eventually Ca, Mg, K, Mo because they don’t stick tight and can leach away (Fe) or form minerals (P), Al toxicity
Troeh and Wegner, 2013

What were historical surface horizon pH values in Montana?
No data
Map courtesy of Bill Drummond, MT NRCS

Soil acidification: MT counties with at least one field with pH < 5.5
40% of 20 random locations in Chouteau County have pH < 5.5 in top 2”
Jan 2020Symbol is not on location of field(s)

Soil pH distribution north central MT, 2018
Results show 6.5% of soils had a pH < 6.2
AgVise Lab, ND, 7130 samples; Reeves and Liebig 2016, Mandan, ND

Reeves and Liebig 2016, Mandan, ND
Soil sampling for pH1. Field pH test on soil/water
slurry of top 3” or send to lab. Why not the standard 6”?
2. Test 3-6” if might till.
3. Avoid compositing samples from different slope areas.

Is this a real issue or us looking for more work?
Image courtesy Scott Powell
Safflower field near Big Sandy, 2018 pH 4.3 – 4.5 in bare areas

Crop losses from low pH are due to:
• Crops’ tolerance varies with species and variety
Crop Min pHAlfalfa 5.7Barley 5.3Pea 5.5Wheat 5.1-5.4
• pH < 5.2 Al toxicity• pH < 6.0 limited N-fixing nodules on legumes• pH < 6.0 increase in Ceph. stripe disease• Change in herbicide efficacy and persistence
More about this in February 10 session

Questions?
On to soil nutrients

For sustainable, healthy production
INPUTS OUTPUTS
NUTRIENTS
Mineral soil/organic matter
FertilizerManure
N-fixation by legumes
Harvest
Erosion
Runoff
Leaching
Escape to atmosphere
In many ag systems, outputs > inputs = mining the soil for nutrientsLoss of soil productivity leads to financial loss
Inputs should = OutputsMinimize erosion, runoff and leaching losses from the system
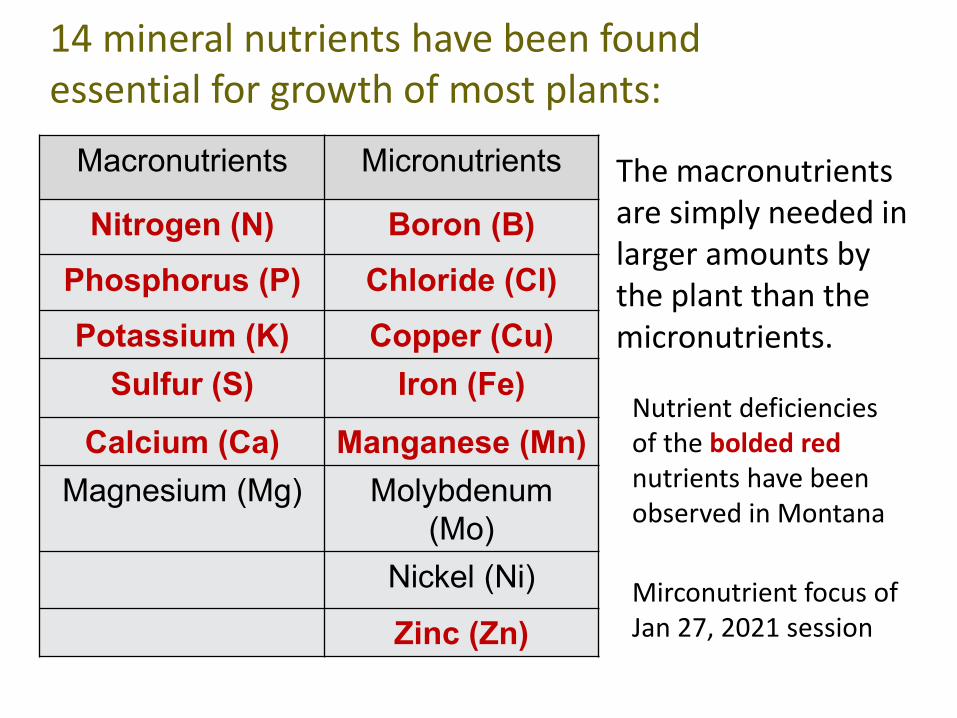
14 mineral nutrients have been found essential for growth of most plants:
Macronutrients Micronutrients
Nitrogen (N) Boron (B)Phosphorus (P) Chloride (Cl)Potassium (K) Copper (Cu)
Sulfur (S) Iron (Fe)
Calcium (Ca) Manganese (Mn)Magnesium (Mg) Molybdenum
(Mo)Nickel (Ni)
Zinc (Zn)
The macronutrients are simply needed in larger amounts by the plant than the micronutrients.
Nutrient deficiencies of the bolded rednutrients have been observed in Montana
Mirconutrient focus of Jan 27, 2021 session

Nitrogen is most commonly lacking nutrient and greatest fertilizer expense
NH4+
NH3 NO3-
N2 or N2OGas
Deni
trifi
catio
n
Vola
tiliza
tion
Plan
t Upt
ake
Leac
hing
Clay or OM
Exchange
FixationHarvest
Organic material
Runoff
N will be discussed on Jan 13 and 20

Phosphorus is next nutrient most commonly added in MT fields
Exchange
Harvest
Organic material
Erosion & Runoff
Fe or Al oxide/clay
Soil Solution
Mineral
Movement of P is largely througherosion/runoff,NOT leaching. Why?
P binds strongly to soil
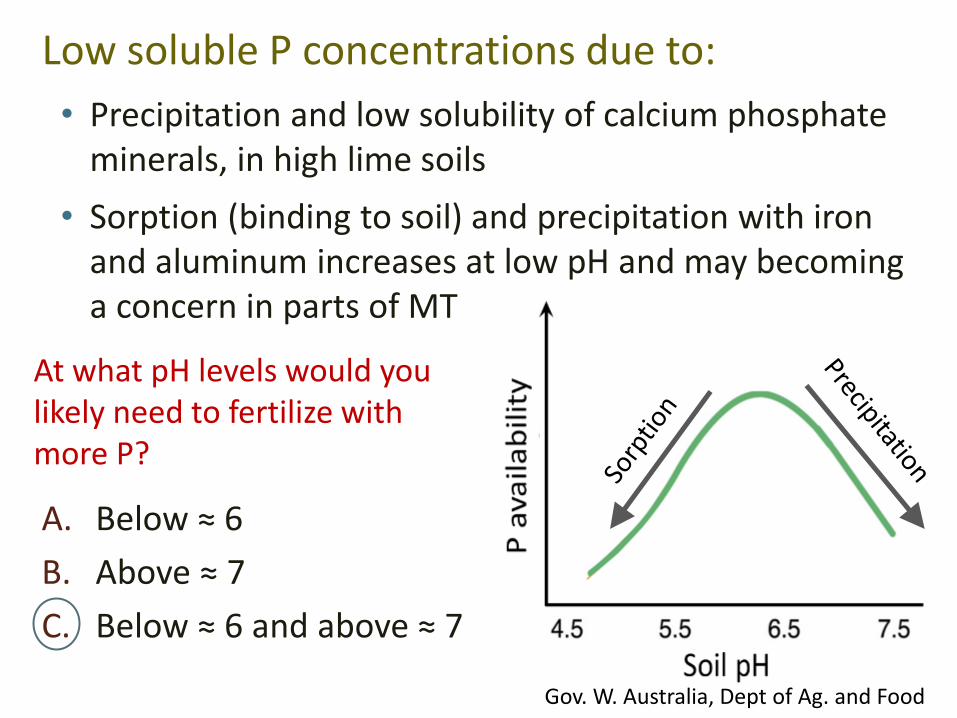
At what pH levels would you likely need to fertilize with more P?
A. Below ≈ 6B. Above ≈ 7C. Below ≈ 6 and above ≈ 7
Gov. W. Australia, Dept of Ag. and Food
Low soluble P concentrations due to:• Precipitation and low solubility of calcium phosphate
minerals, in high lime soils• Sorption (binding to soil) and precipitation with iron
and aluminum increases at low pH and may becoming a concern in parts of MT

Questions?
On to soil testing and fertilizer rate calculations

Questions to ask before you add fertilizer1. Which elements do I need? (e.g. N, P, K, S, Zn)2. 4R Stewardship, the right:
• Rate• Source• Time• Placement • (Rotation)
3. Will I get a return ($ or environmental) on my investment?
How do I know what to add to my soil???

• To help calculate fertilizer rates• To identify nutrient deficiency or
imbalance• Can increase yield and/or save on
fertilizer costs, and decrease environmental risks
• Best done in early spring, but not when soil is wet, therefore in our climate perhaps best done in late fall
• See MT200702AG and MT200803AG for instructions
• Home kits are not ideal. See our Soil Scoop on testing kits vs lab results
Soil test: a first step to wise use of fertilizer $

https://landresources.montana.edu/soilfertility/soilscoop/index.html
How to soil test and what to do before you send the sample to the lab
Use our Soil Scoops on soil testing
• Getting a good sample
• Once you have the sample check list

Example soil test report
• Ideally an actual number, rather than a rating (low, medium, high, very high or deficient, sufficient) is provided.
• Drawback of soil test kits is usually rating only, no numbers• Sometimes a recommendation is provided. Is yours based on DESIRED CROP
yield goal? and MT GUIDELINES?
Location: Sample date:
Desired crop
Prior crop
Nitrate-N
ppm lb/ac Depth (in)
Forage 2 4 0-6
Wheat
FallowCereal
Legume?
12 0-615 6-249 24-36
Ideal Crop dependent
Location: Sample date:
Desired crop
Prior crop
Nitrate-N Pppm
ppm lb/ac Depth (in) Bray Olsen
Forage 2 4 0-6 13 5
Wheat
FallowCereal
Legume?
12 0-6
14 915 6-249 24-36
Ideal Crop dependent 20-40 16 - 30
Location: Sample date:
Desired crop
Prior crop
Nitrate-N Pppm
K ppmppm lb/ac Depth
(in) Bray Olsen
Forage 2 4 0-6 13 5 161
Wheat
FallowCereal
Legume?
12 0-6
14 9 35315 6-249 24-36
Ideal Crop dependent 20-40 16 - 30 250 - 500

Online MSU soil fertility guideline calculatorhttp://www.sarc.montana.edu/php/soiltest/

How much fertilizer P (in lb P2O5/ac) for above wheat crop?
P calculations
CropP (ppm)
pHM3 Bray1 Olsen
Wheat 37 14 4 6.5Ideal 61-90 20-40 16-30 6-7.5
• Bray works in pH < 7.3 • Olsen works pH > 6 • Mehlich-3 over broad rangeIn calcareous soils [(Mehlich P/2.05) – 14] = Olsen P
Table 18 (subset). P fertilizer guidelines based on soil analysis (EB0161)
Crop
Olsen P soil test level (ppm)0 4 8 12 16*
P fertilizer rate (lb P2O5 /acre)W Winter 55 50 45 40 35
* With P>16 ppm consider using crop removal rates (EB0161 Table 21) as P fertilization guideline.
MSU guidelines are based on OLSEN P. Type of P soil test to use is based on soil pH.
Look at your soil test:Soil pH?P test type?P soil test level?Recommendation?

Summary
• Understanding soil properties guides proper fertilization
• Soil tests, the online calculator and MSU Extension publications are important tools to calculate fertilizer rates, maximize plant heath, protect environment
• The right rate, source, placement and timing leads to optimal fertilizer use and plant health
• Observe and adjust to your specific conditions

Check your jar’s silt level. Use the soil texture triangle
Textural triangle for the tactile
Note: silt should be measured at 6 hours, but who is going to be awake at that hour??

Resources
On soil fertility website under Extension Publicationshttp://landresources.montana.edu/soilfertility/
Soil Sampling Strategies (MT200803AG)
Interpretation of Soil Test Reports for Agriculture (MT200702AG)
Developing Fertilizer Recommendations for Agriculture (MT200703AG)
Soil Sampling and Laboratory Selection (4449-1) http://landresources.montana.edu/NM/
The Soil Scoop http://landresources.montana.edu/soilfertility/soilscoop.html

Photo by Ann Ronning
This presentation and more information on soil fertility is available at http://landresources.montana.edu/soilfertility
Thank you! Questions?
Please help us improve this seminar series by completing the short evaluation; link provided in chat box soon.Future sessions
Jan 13: N fundamentalsJan 20: N specifics by crop typeJan 27: MicronutrientsFeb 3: Forage Nutrient MgtFeb 10: Sustainable Nutrient MgtFeb 13: Cover crops