soil & water conservation club iowa water center at iowa ...in the area of soil and water. the...
TRANSCRIPT

Soil & Water Conservation ClubIowa Water Center at Iowa State University
Soil & Water 2
Letter from the Soil & Water Conservation Club President
The Soil and Water Conservation Club is delighted to bring you Getting into Soil and Water 2010. This publication is our way of reach-ing individuals with similar interests, and keeps many up to date on what is currently happening in the area of soil and water. The Iowa State Soil and Water Conservation Club is fortunate to be located in one of the most productive agricul-tural regions in the world. With this privilege we feel it is a priority to be the voice of soil and water conservation on the Iowa State University campus.
Our club consists of many unique individual talents and backgrounds which make the club interesting and very diverse. It is everyone’s duty to maintain soil and water quality and these individuals have risen to the challenge and put forth their time and efforts for the betterment of society with time spent in this years’ Skunk River Navy project, collaborating efforts with the Iowa SWCS, or in presenting the ground water flow model. Whether it’s at the Iowa State Capital or in an elementary school, this year we have been given the opportunity to make a difference by promoting the conservation of soil and water.
A big thank you goes out to everyone who has donated their time and efforts this year to increase awareness of the quality of our soil and water, especially to the publication contributors, committee members, and Rachel Unger who is our Vice President and publication editor. The success of the ISU Soil and Water Conservation Club would not be possible without help from its members and our advisors Dr. Rick Cruse and Brad Miller. It has been a great year and an excel-lent experience with a wonderful group of people.
Sincerely,Richard C. KannSWCC President 2008-2009
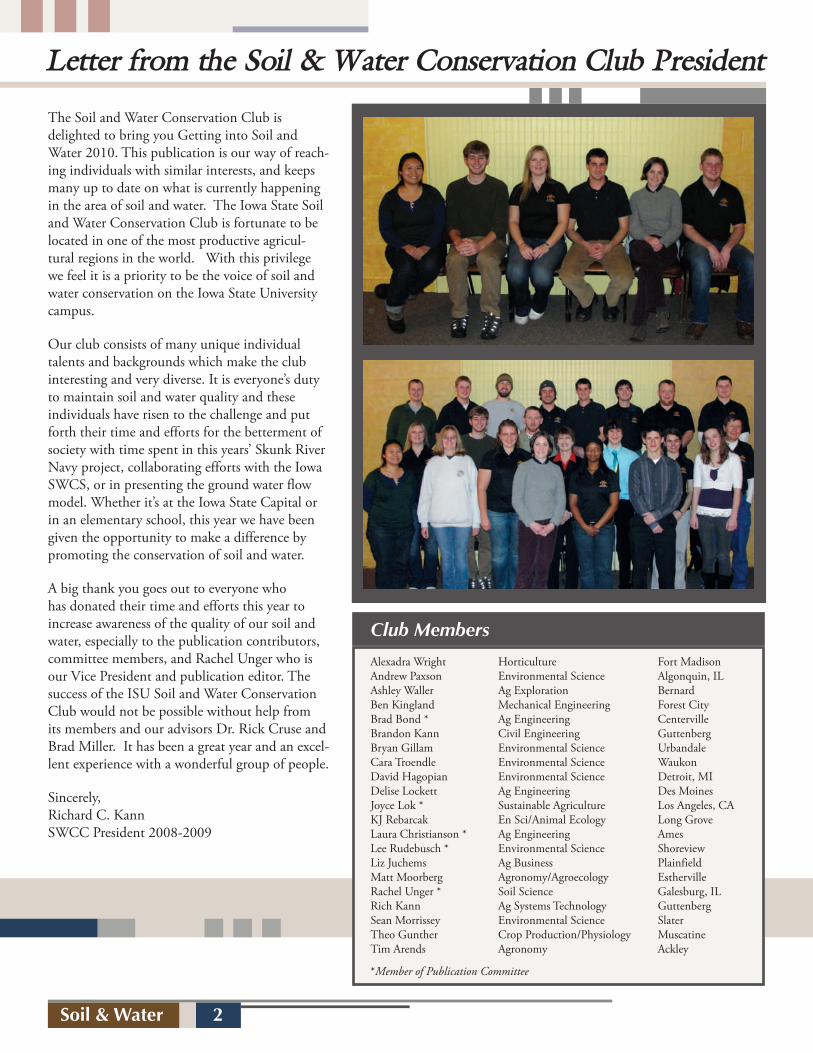
Alexadra Wright Horticulture Fort MadisonAndrew Paxson Environmental Science Algonquin, ILAshley Waller Ag Exploration BernardBen Kingland Mechanical Engineering Forest City Brad Bond * Ag Engineering Centerville Brandon Kann Civil Engineering GuttenbergBryan Gillam Environmental Science Urbandale Cara Troendle Environmental Science Waukon David Hagopian Environmental Science Detroit, MI Delise Lockett Ag Engineering Des Moines Joyce Lok * Sustainable Agriculture Los Angeles, CA KJ Rebarcak En Sci/Animal Ecology Long Grove Laura Christianson * Ag Engineering AmesLee Rudebusch * Environmental Science Shoreview Liz Juchems Ag Business PlainfieldMatt Moorberg Agronomy/Agroecology Estherville Rachel Unger * Soil Science Galesburg, ILRich Kann Ag Systems Technology GuttenbergSean Morrissey Environmental Science Slater Theo Gunther Crop Production/Physiology Muscatine Tim Arends Agronomy Ackley
*Member of Publication Committee
Club Members

Soil & Water 3
4 Soil Erosion: How Much Is Tolerable? A Letter from the Iowa Water CenterRick Cruse, Hillary Olson
5 Healthy Land, Healthy EconomiesBill Northey
6 Soil Erosion in IowaThomas E. Fenton
9 Let’s Get the Soil Out of the WaterKendall Lamkey
10 My Carreer in Soil and Water ResearchW.E. Larson
13 Iowa’s Water and Land Legacy Amendment – Historic Moment for Iowa’s Environment on the Ballot November 2010Sean McMahon, State Director, The Nature Conservancy in Iowa
14 Soil as a History BookBradley Miller
16 The Floods of 2008 – Preventable Tragedy or True Calamity?Brian Gelder
18 Charles Darwin: Early Soil Scientist?Jessica Veenstra
20 Nature’s Ecology as a Model to Heal the LandFrancis Thicke
22 BioChar: What’s All the Excitement About?Rachel Unger
Table of
23 The View from My Office Joyce Swartzendruber
24 Getting to the Root of the Matter: Soil and Water Jeri Neal
26 Iowa Conservation Progress and Future Challenges Rick Robinson
28 TMDLs: Water Quality Master Plans or Paperwork Exercises? Jack Riessen
34 Mixed Annual-perennial Systems for Enhancing Water Quality, Flow Regulation, and Other Ecosystem Services from Agricultural Landscapes in the Midwest
Heidi Asbjornsen and Matt Helmers
36 Water Quality and Runoff Control Issues with Open Feedlots Brad Bond, Robert Burns, Lara Moody
38 Quantifying Sediment Sources to the Suspended Load of a Stream Using Radioisotopes
Christopher Wilson, Thanos Papanicolaou, Roger Kuhnle
42 Natural Resource Conservation Measures in Connection With Low-Carbon Energy Production: Some Challenges and Opportunities Facing the European Union
Zsolt Gemesi, Andras Molnar
44 Riparian Buffers: A Targeted Approach for Improving Environmental Quality
Tom Isenhart, Richard Schultz
Contents
The suggested format for citing an article from this publication is:
Author. 2010. Title of Article. Page(s) of Article. In Rachel Unger (ed.) Getting Into Soil and Water: 2010. Iowa Water Center, Ames, IA.
Rachel UngerEditor

Soil & Water 4
Rick Cruse, DirectorHillary Olson, Program Coordinator
Welcome to the second annual “Getting into Soil and Water” presented by the Iowa State University Soil and Water Conserva-tion Club and the Iowa Water Center. The central topic for this issue is erosion. Soil is one of Iowa’s most important, if not the most important, natural resource. It is a major component of our economy because it provides a source of food, feed, fiber, and bioenergy feedstocks for Iowa, the U.S. and the world. Soil stores carbon in its organic matter, which reduces atmospheric carbon dioxide concentra-tions helping to mitigate climate change. Another important function is to decom-pose manure, waste products and cycle nutrients from organic materials. Soil also filters and stores water for crop growth. It is also the source for the largest water qual-ity impairment in the Midwest - sediment.
This publication celebrates the soil resource and discusses issues affecting the quality of soils. We wish to thank the authors for their voluntary contributions. If you have any ideas for future articles or ways to improve our publication, please contact me at [email protected] or 515-294-7850. We welcome any and all feedback. Our goal is to improve with each sequential publica-tion. See you again in 2011.
Is there really such a thing as a tolerable amount of soil loss? If there is, upon what should this value be based? Many government program payments made to farmers are based on farmers develop-ing and implementing a conservation
plan that would limit their soil erosion to an ‘institutionalized’ soil erosion rate considered tolerable. To many, this value is simply known as ‘T.’
The tolerable soil loss rate, ‘T’, varies between soils and depends on various factors including depth to bedrock. ‘T’ typically ranges from 1 ton of soil loss (for very shallow soil materials) to 5 tons of soil loss per acre per year. Relatively few soils have the lower ‘T’ value, while the majority of soils have an assigned ‘T’ value of 5 tons of soil loss per acre per year. In principle ‘T’ is the soil loss rate for which productivity will be maintained indefinitely and is under-stood to be the sustainable soil loss rate.
Upon what is the value of ‘T’ based? Is this value reasonable? And is this value scientifically defendable? It seems the first reference to an acceptable soil loss rate comes from a research paper authored by Dewight Smith, published in 1941 in the journal Agricultural En-gineering. Smith (1941) reported that unpublished research indicated fertil-ity seemed to be maintained with four tons of soil lost per acre per year, while fertility seemed to decline with five tons per acre per year on plots near Bethany, Missouri. Since that time, numerous interpretations and apparent misinter-pretations of this work have lead many to believe that soil formation rates approximate 5 tons per acre per year. In other words, because the original publi-cation suggested that soil fertility could be maintained with about 5 tons of soil loss per acre per year or a little less, it has been interpreted that this must be the soil formation rate.
More recently, studies specifically ad-dressing soil renewal or formation rates found soils form at rates much less than
5 tons per acre per year. Montgomery (2007) and Alexander et al., (1988) sug-gest soil formation rates are much closer to 0.5 tons per acre per year. This poses an interesting dilemma for soil scien-tists, agencies, and law makers who have traditionally used the larger ‘T’ value as
a basis for sustainability claims and as a basis for making government payments to farmers. Should we as a country promote practices that result in soil erosion rates that exceed renewal rates by a factor of 10 in many situations? Re-alistically, designing farm management plans to limit soil erosion to the best science-based soil renewal rate (0.5 tons/acre/year) would be extremely difficult. However, feeding a rapidly growing population with degraded soils may be beyond difficult. It may be impossible.
References
Alexander, E.B. 1988. Rates of soil for-mation: Implications for soil-loss tolerance. Soil Sci. 145:37-45
Montgomery, David R. 2007. Soil ero-sion and agricultural sustainability. Proc. Nat. Acad. Sci. 104:13268-13272.
Smith, Dwight D. 1941. Interpreta-tion of soil conservation data for field use. Agric. Eng. Pp. 171 – 173.
Soil Erosion: How Much Is Tolerable?A Letter from the Iowa Water Center
Is there really such a thing as a tolerable amount of soil loss?

Soil & Water 5
Bill NortheyIowa Secretary of Agriculture
Most Iowans do not understand the important role agricul-ture plays in our state’s economy, nor do they always appreci-ate what an important economic driver it is.
Ninety-one percent of Iowa’s land is privately owned and 86 percent of the state’s land is in agricultural production. Agri-culture impacts all Iowans, and what farmers do on the land is crucial to our quality of life.
For example, one analysis of the 2007 Census of Agri-culture by the Coalition to Support Iowa’s Farmers, with the help of an Iowa State University extension economist, showed that agriculture is responsible for adding $72.1 billion to the state’s economy, or 27 percent of the state’s total. It also showed that agriculture and ag-related industries directly and indirectly employ one of every six Iowans, or 17 percent of the state’s workforce
I think it is important to share this message with the state’s residents, both rural and urban.
I also think it is important that we communicate that while farmers know their job is to produce food to feed the world, they understand that protecting the state’s soil and water goes hand in hand with growing crops. If our state’s high quality
topsoil erodes or our waterways are polluted, our productivity is put in jeopardy which in turn threatens our quality of life.
So, farmers take conservation seriously. As a result, Iowa leads the nation with 524,667 acres enrolled in the continuous Conservation Reserve Program (CRP). In addition, through the state cost share program more than $400 million have been invested, including $200 million by farmers themselves, to install terraces, grass waterways, buffer strips and other conservation practices that help protect our state’s soil and water quality.
Conservation on the land-scape benefits all of us. Just over the last year the Iowa Department of Agriculture and Land Stewardship’s Di-vision of Soil Conservation has worked with farmers to install conservation prac-tices that have benefited
40,266 acres. These practices will reduce soil loss by 307,000 tons per year, which over a 10 year period is enough to cover all four lanes of Interstate 35 from Missouri to Minnesota ap-proximately 2 feet deep.
This year we celebrated the 70th anniversary of the Iowa law that started our statewide conservation efforts. Iowa passed a law in 1939 to establish a state agency and the means for soil and water conservation districts to organize. This legislation declared it the policy of the State of Iowa to: preserve soil and water; protect the state’s tax base; and promote health, safety and public welfare of people of Iowa.
The severe erosion during the “Dust Bowl” years of the 1930s brought about the first efforts to prevent soil erosion, which has helped protect our soil and water resources. In 1936, the Iowa Agricultural Experiment Station reported that one-fourth of the state’s original fertile topsoil had been lost.
A great deal has been accomplished in the past 70 years, but I think we can all agree we still have a lot of work to do.
Bill Northey is serving his first term as Secretary of Agriculture. Northey is a fourth-generation corn and soybean farmer from Spirit Lake, Iowa. His priorities as Secretary of Agriculture are expanding opportunities in renewable energy, encouraging conser-vation and stewardship, and telling the story of Iowa agriculture. To learn more visit www.IowaAgriculture.gov.
Healthy Land, Healthy Economies
Agriculture plays a major role in Iowa’s economy.
Agriculture and ag-related industries directly and indirectly employ one of every six Iowans, or 17 percent of the state’s workforce.

Soil & Water 6
Soil Erosion in IowaThomas E. FentonProfessor Emeritus, Agronomy Department, Iowa State University
Soil erosion involves the detachment and movement of soil particles. The process of erosion is usually classified as natural (geologic) or accelerated. Natural or geologic erosion has been important in shaping the landscapes of Iowa. The Iowan Erosion Surface in northeastern and northwestern Iowa, the Des Moines Lobe, and the slopes on all landscapes (the most spectacular of which are in the loess hills of western Iowa) have all been sculpted by natu-ral erosion. Landscapes and soils are evaluated in terms of their natural ero-sion history - stone lines, buried soils, geomorphic surfaces, loess deposition etc., are tools used to help understand natural erosion history. A stone line, marking the erosion surface in north-eastern Iowa, is shown in Figure 1.
Accelerated erosion is largely the result of human activity including tillage,
grazing, and cutting of timber. It is the most pressing environmental and sus-tainability problem in Iowa today. The agents of accelerated erosion are wind and water. Wind erosion is usually dom-inant in drier climates and water the dominant agent in higher precipitation areas. Soil erosion gained national atten-tion in the 1930’s with the soil blowing (Dust Bowl) in the Great Plains of the Central United States. The Soil Erosion Service was formed in response to that problem and today the responsibility for the soil conservation programs at the federal level are borne by the Natural Resources Conservation Service with cooperation from various state agencies. In Iowa the cooperating state agency is the Department of Soil Conservation in the Iowa Department of Agriculture and Land Stewardship.
Both wind and water erosion consist of three processes-detachment, trans-portation, and deposition. With water erosion detachment is caused by the impact of falling raindrops. Stable soil
aggregates (strong soil structure) will have greater resistance to the impact of the raindrops than less stable aggregates. Residue cover on the soil surface lessens the probability that the raindrop will impact the soil aggregates directly and thus helps control erosion. However, when the soil particles are dispersed, they move and may plug soil pores which reduces infiltration. This creates runoff to transport the soil particles. Eventually they are deposited and are considered to be eroded even though they may have moved only a short dis-tance down slope. There is an interac-tion of many factors that determine the amount of soil eroded and these factors have been combined in an equation called the Universal Soil Loss Equation (USLE) (Wischmeier and Smith, 1965)
A = RKLSCP
where A is the average annual soil loss in tons per acre per year, R is the rainfall factor, K is the soil erodibility factor, L and S are the length and gradient of the slope, C is the cropping and manage-ment factor, and P is the conservation practice factor. This equation is used in connection with the T value or soil loss tolerance which is defined as, “the maxi-mum average annual soil loss that will allow continuous cropping and main-tain soil productivity without requiring additional management inputs” (SSSA, 2008). A secondary definition from the same source is “the maximum soil ero-sion loss that is offset by the theoretical maximum rate of soil development that will maintain an equilibrium between soil losses and gains.” Many of Iowa’s deeper soils have T values of 5 tons per acre per year but other soils that have limiting profile features may have values less than 5.
Figure 1. Stoneline marking erosion surface in northeastern Iowa.

Soil & Water 7
The USLE has been revised over time and the current ver-sion is known as RUSLE2. It is a software model that predicts long-term average annual erosion by water.
The 1993 National Resource Inventory (USDA NRI, 2003) showed that Iowa had approximately 25,511,100 acres of cropland. More than 88% of these acres were used for corn and soybean production in 2008 (USDA, 2008). The soil loss attributed to water erosion on Iowa cropland averaged about 5 tons/acre/year. Wind erosion accounted for another 0.4 tons/acre/year. There are about 18.6 million acres of prime farmland (73% of the cropland) in Iowa and by definition should have minimal erosion problems. Thus, the majority of the soil loss is coming from about 27% of the cropland.
In recent years, more attention has been concentrated on the off-site effects of field derived sediments and materi-als adsorbed to them. They eventually move into waterways resulting in sedimentation of streams and degradation of the environment. Recent data on the quality of Iowa’s lakes and streams indicate the importance of these off-site effects. Aver-age soil loss values indicate that the present concept of T may be close to being met in Iowa. However, these values may not be adequate to protect the inherent productivity of our soils since the effects of erosion have been masked by management practices such as use of nitrogen fertilizer. The masking effect and the off-site concerns suggest that the concept of T may need to be expanded or revised to include more than what is currently present in the definitions.
In Iowa, the effects of erosion are shown in soil surveys which are available for all counties in the state. A soil map unit shows the soil, slope group, and erosion phase. For example the symbols,120C2, stands for Tama silty clay loam, 5-9% slope, moderately eroded. Erosion phases are defined as follows:
These differences are shown in Figure 2. Figure 3 shows the effects of sheet erosion which is the major cause of the changes in soil morphology shown in Figure 2. In addition to the change in appearance of eroded soils, properties also
change. The most obvious change is the loss of organic matter as indicated by the loss of dark color. Additional changes due to erosion are higher clay content, loss of structure, slower infiltration rates, decreased nutrient supply and overall physical degradation of the soil that contribute to a less
favorable germination and rooting environment. All these factors result in decreased productivity of the soil. Figure 4 shows an ephemeral gully forming in the main channel with rills on the surrounding slopes. Figure 5 shows gully formation in western Iowa.
All these forms of erosion are controllable with proper land use and/or selection of suitable conservation practices. Soil conservation should be of interest to everyone. There is a need for increased awareness on the part of land managers and the general public of the consequences of soil erosion and its effects, not only on soil productivity, but also on the quality of the environment.
Figure 2. Morphology of slight, moderate, and severe erosion phases in Clarion soil, north-central Iowa.
Thus, the majority of the soil loss is coming from about 27% of the cropland.
Symbol Erosion Phase Definition
None None or slight More than 7 inches of A or A plus E horizon remaining
2 Moderate
3 to 7 inches of A or A plus E horizon remaining. Some of the AB and B horizons are mixed with the surface layer in those soils that have been tilled.
3 Severe
Less than 3 inches of A or A plus E horizon remaining. Some of the surface layer consists of the AP and or B horizons in those soils that have been tilled.

Soil & Water 8
Figure 4. Ephemeral gully erosion in eastern Iowa.
Figure 5. Gully erosion in western Iowa.
Figure 3. Sheet erosion in north-central Iowa.
References
Soil Science Society of America. 2008. Glossary of Soil Science Terms. Madison, WI.
https://www.soils.org/sssagloss/
USDA. 2008. Iowa Agricultural Statistical Service. United States Department of Agriculture.
USDA NRI. 2003. National Resource Inventory – State Land Use and Soil Erosion Results Tables. http://www.nrcs.usda.gov/technical/NRI/2003 statereports/all.html, reviewed February 6, 2009.
Wischmeier, W.H. and D.D. Smith. 1965. Predicting Rainfall-Erosion Losses from Cropland East of the Rocky Mountains. USDA Agric. Handbook No. 537.
Soil & Water 9
Kendall LamkeyProfessor and Chair of the Agronomy Department,Iowa State University
While visiting the exhibit Dig It! The Secrets of Soil at the Smithsonian National Museum of Natural History during a recent trip to Washington, D.C. I learned a number of ways soil is involved in our daily lives that even I as an agronomist did not know. The exhibit, sponsored by the Soil Science So-ciety of America and others, does an outstanding job relating our personal and global relationship to soils.
I was surprised to find out the primary source of phosphorous in the Amazon rain forest is dust storms in the Sahara desert. I was impressed by the sheer diversity and quantity of life found in the soil. And I discovered the impact soil has on something that seems as simple as building a house. The exhibit also touched on the role of soil in climate change, a topic of world-wide public interest.
Soil interacts with our climate in many ways, but one of the most important is its role in the carbon cycle as the largest terrestrial reserve of carbon on the planet. How we humans interact with our soil directly impacts how much carbon in the soil enters the atmosphere as carbon dioxide. Iowa soils contain only 50 percent as much carbon today as compared to when they were first plowed 150 years ago. Cropping and drainage systems, tillage, rainfall, temperature and other fac-tors all contribute to a reduction in soil organic matter.
The amount of soil carbon is largely in the hands of humans. If soil carbon continues to decrease, the bountiful harvests Iowa has enjoyed will become increasingly costly to sustain. Further decreases in soil carbon will force Iowa farmers to increase external inputs into the cropping system to maintain production levels.
But to increase soil carbon our society will have to change its priorities and habits. We will have to change our cropping systems, tillage practices and drainage systems.
This means becoming more intentional about the mix of annual and perennial crops planted in Iowa. Recent studies at Iowa State University show putting as little as 10 percent of our row crop landscape into perennials could reduce erosion by 80 percent – even in flood years like 2008. The planting of perennials, coupled with changes in our cropping system like
cover crops, perennial ground covers and increased use of re-duced or no tillage practices, will not only result in decreased erosion but also will have a huge impact on the carbon bal-ance in Iowa’s soil. This all would result in the added benefit of increasing the quality of life for all Iowans through cleaner water and a more diverse landscape.
It does not mean, however, that we need to sacrifice produc-tion of crops and the livestock and poultry that depend on them for feed, or even ethanol and biodiesel. It means we will have to increase corn and soybean production on the remain-
ing 90 percent of the acres through better agronomics – genetics, fertil-izer management, pest control, and how these factors interact with our weather. It means we will have to better integrate our crop and livestock and poultry systems. It means we never leave our soils bare through the winter.
I believe that Iowa should lead the way in making soil health our number one priority. We can start by adopting zero tolerance for soil particulates in our streams, rivers and lakes. Soil is the number one water pollutant in our state (http://www.iowadnr.gov/water/nonpoint/nps1.html). The Natu-ral Resources Conservation Service’s 2003 Annual National Resource Inventory (http://www.nrcs.usda.gov/technical/NRI/2003/SoilErosion-mrb.pdf ) shows Iowa with 128,581 tons per year of water erosion making Iowa number one in the nation for soil erosion by water. By making significant changes in our production systems Iowa can lead the nation in crop and livestock production and lead the nation in clean water.
Let’s make this our top priority and reward those who take the initiative. The future of Iowa depends on it. More impor-tantly, the future of agriculture depends on it. Because Iowa is agriculture.
Reprinted with permission from STORIES in Agriculture and Life Sciences Spring 2009.
Dig It! The Secrets of Soil
Learn more at...www.ag.iastate.edu/stories (http://forces.si.edu/soils/).The exhibit will be on display at the Durham Museum in Omaha, NE from October 2 through December 26, 2010.
Let’s Get the Soil Out of the Water
Putting as little as 10 percent of our row crop landscape
into perennials could reduce erosion by 80 percent.
Soil & Water 10
My Career in Soil and Water ResearchW. E. LarsonProfessor Emeritus, Department of Soil, Water, and Climate, University of Minnesota
During my 63-year career in Soil Science, many advance-ments have been made in the use and protection of our soil and water resources. Occasionally, I like to reminisce about the changes and improvements. I often marvel at the tremen-dous accomplishments in agricultural production during the last half century. But I also realize that our efforts to protect the natural resources and environment from degradation have lagged. Following are some of advancements in which I was involved. They are:
• Precision Agriculture• Soil Tillage and Erosion Control • Crop Residue Removal for Bio-energy• Soil Nutrient Management• Water Quality• Soil Quality
Precision Agriculture
The principle of Precision Agriculture was first used on a national basis in the 1930’s. It was a great step forward in soil and natural resource use and conservation.
The US Soil Conservation Service (SCS, now the Natural Resources Conservation Service) was established in 1935 with Dr. H. H. Bennett, a noted Pedologist, as the first Chief. The SCS was charged with making soil management and conser-vation plans for cooperating farmers. Dr. Bennett ruled that plans could not be prepared without a detailed soil survey giving consideration to soil and landscape features. This was a first on a national basis. It was the start of what is now called Precision Agriculture. I was fascinated at how the soil planners could take my soil surveys and fit contouring, ter-racing, grassed waterways and crop sequences into the diverse soils and rolling landscapes. This was all new technology to the Midwest at that time. Much of that technology has now been replaced by better tillage and the principles of Precision Agriculture.
Starting in the 1970’s soil surveys were being digitized for rapid recall and use. Advancements in interpretation of soil surveys followed and a program was developed at the Univer-sity of Minnesota called “Farming by Soil.” It was advocated that soil maps which included pertinent information could
be mounted in a computer and fed into machines that altered management as the machine moved over the field. Dr. Pierre Robert and I at the University of Minnesota published one of the early papers on this concept (Larson and Robert, 1991).
While the early planning using the information in modern soil surveys led the way, it was soon recognized that other soil features must also be considered. Primarily this included soil chemical information including nutrient availability. Con-siderable research has now been conducted to monitor soil features on-the-go.
Soil Tillage and Conservation
Development of Conservation Tillage in the past several decades has reduced soil erosion by about 50% on Midwest cropland and significantly reduced sediment in water bodies.
Concern for the damages from soil erosion came to the fore-front during the drought period of the 1930’s. The emphasis on damages from water runoff and erosion stimulated a great deal of research on new tillage practices. Prior to 1950 tillage for row crops started with moldboard plowing and usually was followed by one or two secondary tillage operations. This left the land bare of surface residues and micro-roughness, inviting both water and wind erosion. Researchers and farm-ers alike went to work to develop practices that leave the soil surface partially covered with residues. Alternative practices included maintaining roughness on the soil surface. New practices included mulch-tillage, strip-tillage, plow-plant
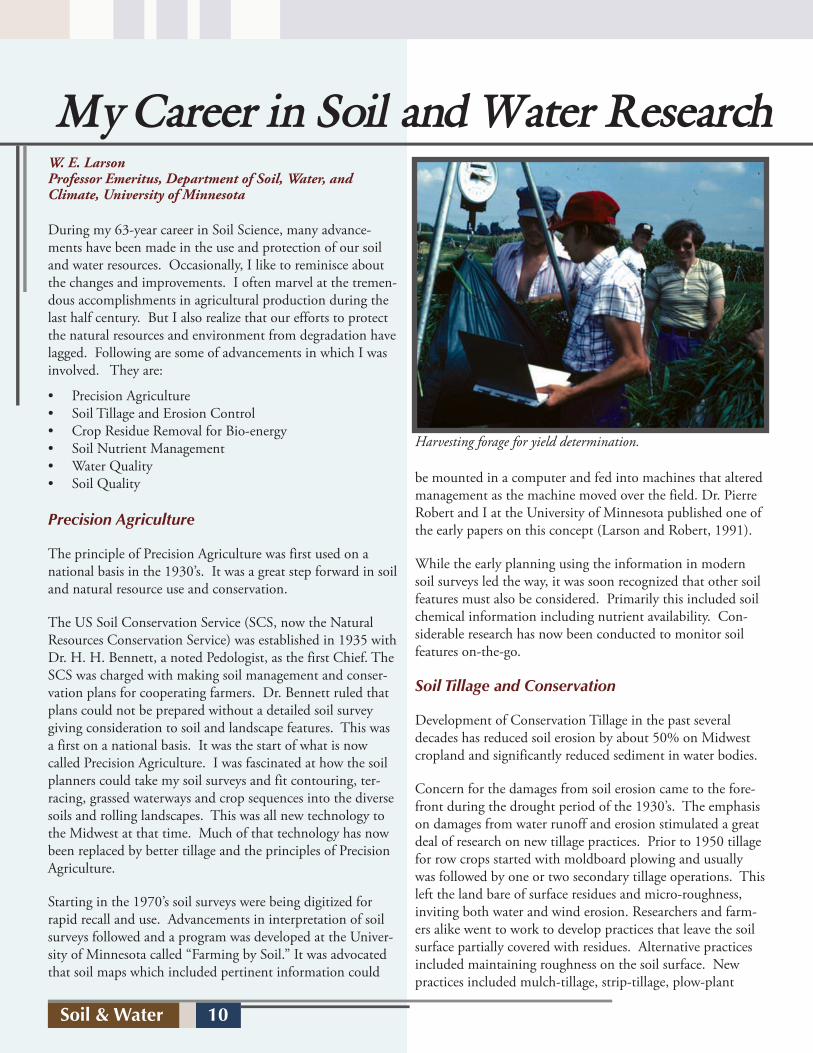
Harvesting forage for yield determination.
Soil & Water 11
tillage, wheel-track tillage, ridge-tillage, and conservation till-age. Today the most popular term is conservation tillage and is often defined as tillage that leaves at least 30% of the soil surface covered with crop residue. My colleagues and I spent many days demonstrating the new tillage practices at field days in Iowa. They were always well received.
Establishment of the SCS provided leadership for combat-ing sediment production and transport. In the 1930’s, SCS established a number of Erosion Experiment Stations includ-ing one at Clarinda, Iowa. In addition, runoff plots were established by Iowa State University at Beacons-field, Independence, and Castana, Iowa. The work was led by G. M. Brown-ing who tabulated the results and prepared a guide for estimating ero-sion from most soil and crop conditions in Iowa. I led the group in Iowa in the 1950’s and 60’s.
The result from the runoff plots in Iowa and across the nation resulted in development of the Universal Soil Loss Equation (USLE) and subsequent improvements. The various models for estimating erosion were a major breakthrough in soil man-agement. The research continues.
Crop Residue Removal for Bio-Energy
As the price of petroleum-based energy rapidly advanced in the 1970’s, interest in bio-energy increased. At that time corn residues were often mentioned as a major feed source, but concern for maintaining soil and water resources immediately surfaced. My colleagues and I published a series of papers on how much residue could be removed without unacceptable erosion. Cooperative efforts with scientists in South Caro-lina, Kansas, Oregon, and Minnesota gave these papers a na-tional perspective. As petroleum prices fell in the late 1980’s and 1990’s, interest in residue removal diminished, only to reemerge in the last decade.
Soil Nutrient Management
In the decade before WWII a scientist at Iowa State Univer-sity is sometimes quoted as saying, “The curse of fertilizers will never cross the Mississippi River.” It was commonly be-lieved that fertilizers “poisoned” the soil. Never-the-less, the widespread use of chemical fertilizers in Iowa and the Mid-west exploded after World War II. Around the time of WWII (1939 – 1945) a common amount of fertilizer used was 100 pounds of 10-10-10 per acre. Fertilizer use increased by
about 12 fold from 1950 to 2000. Cheaper fertilizers became available from advances made in manufacturing technology, particularly in the case of nitrogen.
Field research by Iowa State Faculty after WWII demon-strated the tremendous increases in yield from fertilizers particularly in corn and small grains. These field trials and accompanying laboratory analysis quickly dispelled the myths about use of fertilizers. Soil testing to determine the need and appropriate amounts of fertilizer is now wide-spread. When I was a graduate student at ISU, I helped with what seemed
like hundreds of fertilizer experiments in Iowa. At that time the field fertil-izer research was led by Dr. L. B. Nelson.
Water Quality
The quality of our sur-face waters first became a national concern in the 1930’s because of high
sediment contents brought about by the extreme erosion and drought. It was addressed through attempts at erosion control on cropland.
With the dramatic increase in the use of mineral fertilizer in the 1950’s, plant nutrients in water, both surface and un-derground, emerged as a major national concern. The large hypoxic zone in the Gulf of Mexico has been related to the use of fertilizers in the Midwest. This is being addressed by emphasis on use of more exact amounts of fertilizer to meet the needs of crops, and better placement and timing of appli-cation. The concept of Precision Agriculture is an important break through.
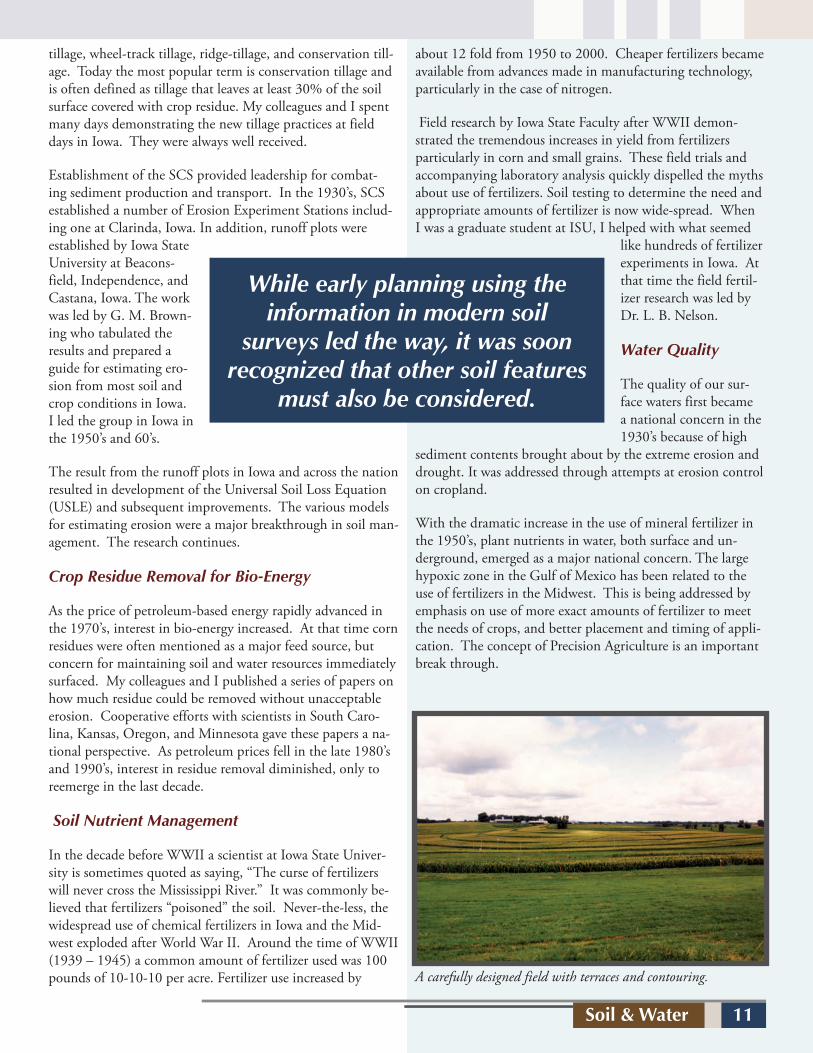
A carefully designed field with terraces and contouring.
While early planning using the information in modern soil
surveys led the way, it was soon recognized that other soil features
must also be considered.
Soil & Water 12
be used?” A quantitative assessment of soil’s value to meet the long-term needs of the nation is an important issue and needs serious thought. Dr. F. J. Pierce and I published one of the early papers on an approach to quantify changes in the quality of soil (Larson and Pierce).
Closing
I like the definition, “The soil is that thin mantle of earth that stands between all humanity and mass starvation.” Agricultural products must increase dramatically in the future to meet the demands of ever increasing world population. This includes food and fiber, energy, and chemicals.
When I was a graduate student at Iowa State University, a pro-fessor from the east coast told me, “I would love to work in the Midwest today because things are changing rapidly. Fertilizers are just now coming in and other changes are also coming. It would be great to help in the development.” I think a similar statement could be made today. Things are changing. It is a great time to be a Soil Scientist. We must consider all facets of the production system to insure that our resources will be available long into the future. Dr. Philip Robertson in a lecture at the University of Minnesota likened the plan to a flower head with a number of prominent petals, each important. The petals include desired production, soil quality, water quality, air quality, soil and water conservation, plant preservation, and other facets. All petals must be fully developed for the flower to maximize its beauty. Likewise we must consider all facets of natural resources in developing a truly sustainable system.
Vitae
BS University of Nebraska, 1944MS U of NE, 1946PhD Iowa State University, 1949Assistant Professor, ISU, 1949 Research Soil Scientist, ARS, Montana State University,1950-54 Research Soil Scientist, ARS and Associate Professor, ISU, 1954-67 Senior Fulbright Scholar, CSIRO, Adelaide Australia 1965-66 Research Soil Scientist, ARS, and Professor, U of MN 1967-82Professor and Head, Department of Soils, U of MN 1982-89.Professor Emeritus, U of MN, 1989-present
References
Larson, W. E. and F. J. Pierce, Conservation and Enhancement of Soil Quality. In Evaluation for sustainable land management in the developing world. Vol.2. IBSRAM Proc. 12(2). Int. Board for Soil Res. and Management, Bangkok, Thailand
Larson, W. E. and P. C. Robert. 1991. Farming by Soil. In Soil Management for Sustainability, ed. R. Lal and F. J. Pierce. Ankeny,Iowa: Soil and Water Conservation Society
In the early 1970’s, much discussion concerned water con-tamination from municipal wastes in domestic waters both from sewage effluent and sludge. In Minnesota, we worked on ways to apply the wastes on land in an environmentally safe manner for crop production. Our research along with others was used by the US Environmental Protection Agency to set national guidelines. The cooperative effort by scientists at a number of locations in developing the guidelines was a model for others to follow.
Soil Quality
The 1977 Soil and Water Resources Conservation Act or the RCA Act passed by Congress stimulated much discussion about the effects of erosion and related management practices on the long-term ability of the nation to meet its needs. I was asked many times, “What is the monetary cost of a ton of soil erosion?” When considering the cost of soil erosion two perspectives need consideration. The first is the on-site costs related to plant production and the loss of soil carbon, and the second is off-site damages caused by the eroded soil.
While most of us intuitively knew that erosion was costly, we were at a loss to come up with a quantitative number. We were embarrassed by this, and resolved to address the ques-tion in our research. Many approaches were proposed but no consensus has been agreed upon by scientists. Much of the debate revolved around the question, “For what will the soil
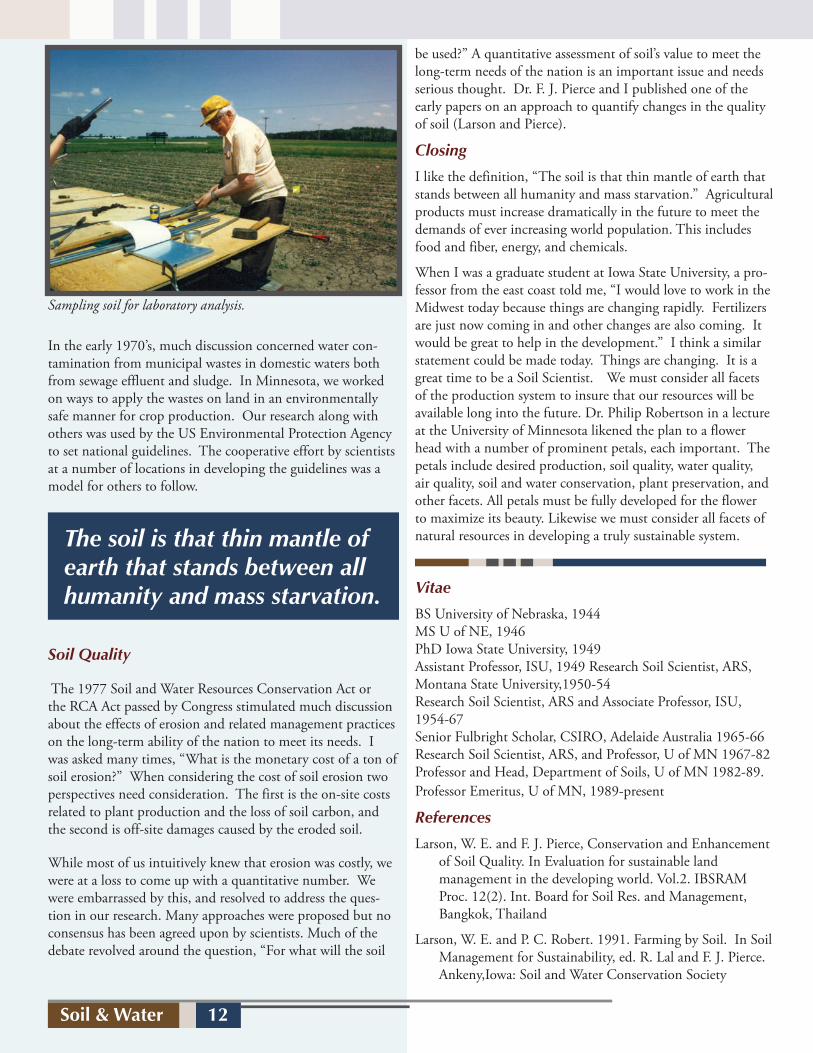
Sampling soil for laboratory analysis.
The soil is that thin mantle of earth that stands between all humanity and mass starvation.

Soil & Water 13
Sean McMahonState Director,The Nature Conservancy in Iowa
Iowa voters will have a historic oppor-tunity on November 2, 2010 to vote for Iowa’s Water and Land Legacy consti-tutional amendment. �e amendment would, for the �rst time in Iowa’s his-tory, establish a constitutionally protect-ed trust fund to preserve Iowa’s natural resources and outdoor recreational opportunities. Nobody will dispute the fact that Iowa’s distinct character and our quality of life are directly tied to our state’s natural resources. Iowa’s parks and lakes receive more than 25 million visits each year, and our fertile soil provides the backbone to our economy.
Simply put, protecting Iowa’s water and soil is at the heart of this amend-ment. Speci�cally, the amendment will create the Natural Resources and Outdoor Recreation Trust Fund which will provide a permanent, reliable and accountable revenue source to improve water quality and natural areas in Iowa. �is includes �sh and wildlife habitat, parks and trails, in addition to aiding in conservation of agricultural soils and restoring wetlands to protect against future �ooding.
In 2008 and 2009, more than 90 percent of Iowa’s state legislators overwhelmingly approved legislation that would establish the constitution-ally protected Natural Resources and Outdoor Recreation Trust Fund. Why? Because Republicans and Democrats alike understand the need to protect our natural resources. Recent data from the Iowa Department of Natural Resources shows that 53% of Iowa’s water sources rate “poor,” and Iowa currently loses an average of �ve tons of soil per acre each year due to erosion. Funding to
protect our natural resources remains at near historic lows. As of today, Iowa ranks 47th out of 50 states in funding for conservation, despite the fact that more than 27,000 Iowa jobs are supported by outdoor recreation.
�e stakes for Iowa’s natural resources on November 2, 2010 are incredibly high, and future generations of Iowans are counting on passage of Iowa’s Water and Land Legacy Amendment. We must act now. By passing this amendment in November, we can prevent the permanent loss of land, water and wildlife and retain Iowa’s quality of life and natural beauty so our children, grandchildren, and great-grandchildren can enjoy the state the same way we do. �e good news is, by cleaning up our water supply and conserving Iowa’s soils, we have the opportunity to actually leave the state to future generations better than we found it.
A vote for Iowa’s Water and Land Legacy Amendment is a vote for the creation of the Trust Fund – not a vote for a tax increase. Revenue for the Trust Fund will come from allocating 3/8ths of one cent from sales tax revenue the next time the Iowa legislature raises the state sales tax. �is funding recommen-dation was based on over three years of research and studies conducted by a legislative advisory committee. �e
advisory committee concluded that those funds, in addition to annual state budget allocations, would meet current needs. Once created, the Trust Fund will be managed responsibly, including open, public competition for funding, mandatory audits and citizen committee oversight.
Investing in clean water and Iowa’s other natural resources provides quality of life opportunities close to home where Iowans can enjoy and appreciate healthy activities, natural areas and Iowa’s beauty. Enhancing and developing more competitive outdoor “destinations” will attract visitors and businesses to the state and create jobs here at home.
In 2008, voters in Minnesota passed a similar Amendment with 56 percent of the vote. More than 30 years ago, Missouri provided constitutionally protected funding for its conservation programs and later reauthorized this funding after 20 years of progress.
Now is the time to start investing in Iowa’s natural resources. We have a proud history of farming, biking along the Heritage Trail, hiking the Loess Hills, �shing in Big Creek, and teach-ing our sons and daughters to appreci-ate whitetails. We must protect and enhance these opportunities to preserve our state’s rich legacy. Several states and communities across the country are tak-ing proactive measures to preserve their natural surroundings. �e quality and condition of our natural resources is the responsibility of all Iowans.
For more information contact Rosalyn Lehman, campaign coordinator for Iowa’s Water and Land Legacy, [email protected]; 515-202-7720.
Iowa’s Water and Land Legacy AmendmentHistoric Moment for Iowa’s Environment on the Ballot November 2010
Protecting Iowa’s water and soil is at the heart of this amendment. We must act now.
Soil & Water 14
Soil as a History BookBradley MillerUndergraduate Coordinator, Agronomy Department,Iowa State University
Soil is one of the most influential components of our environment. It is a complex mixture of physical, chemi-cal, and biological processes providing innumerable ecosystem services. The properties of our soil today support our way of life. It filters our water, contains our wastes, and is the substrate for the production of our food. Combined with a good climate, the convergence of the right soil properties here in Iowa has given its citizens the opportunity to be net exporters of food and feed. That opportunity gives Iowans the ability to feed themselves and prosper economi-cally through the sale of excess goods. Yet this opportunity is heavily predi-cated on the resource of good soil.
As we seek to value soil, it is helpful to understand how it came to be. An early lesson that soil scientists learn is that soil is created as a product of five soil formation factors: climate, organisms, relief, parent material, and time. This is often summarized in the equation Soil = Cl*O*R*P*T. This relationship between a soil’s properties today and its history allows us to infer the conditions that gave us the soil we have today. In this way, soil is like a history book im-printed with the environmental condi-tions that shaped it.
Appreciating Soil’s Past
In the case of Iowa’s soils, the organisms that gave us the thick, black layer of soil was developed from prairie grasses and wetlands. Many of us have heard about how Iowa was once covered by prairie and how the plants’ deep roots put
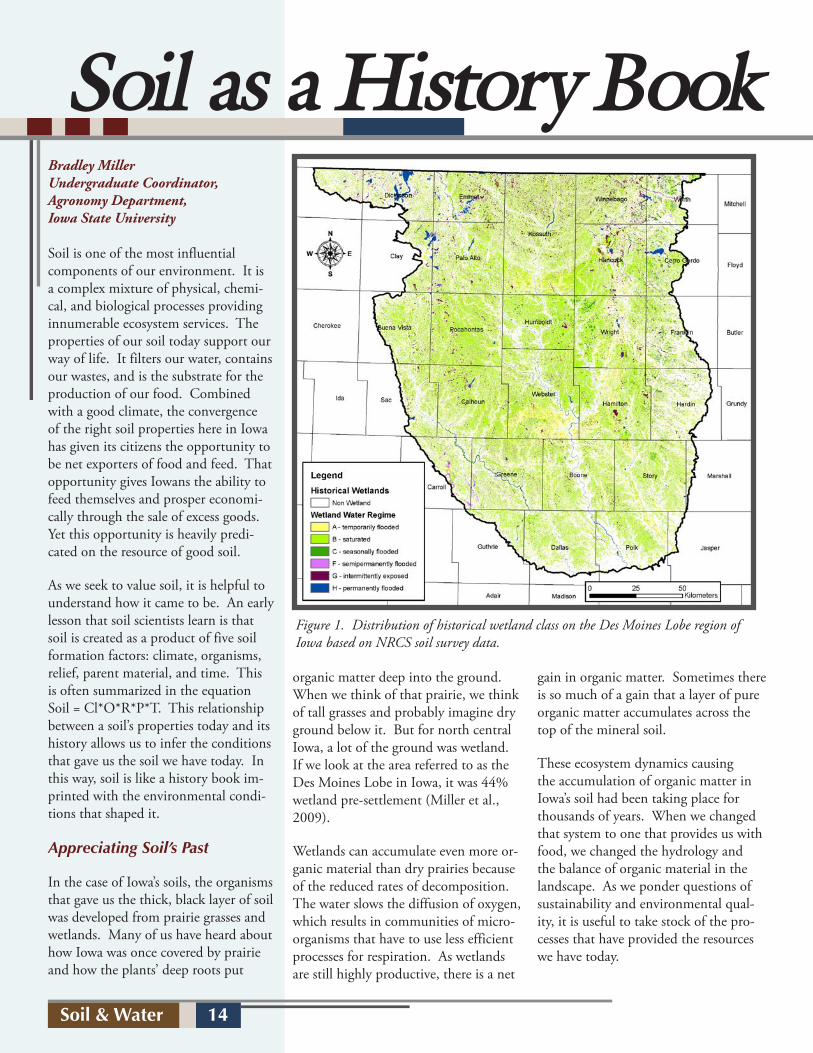
organic matter deep into the ground. When we think of that prairie, we think of tall grasses and probably imagine dry ground below it. But for north central Iowa, a lot of the ground was wetland. If we look at the area referred to as the Des Moines Lobe in Iowa, it was 44% wetland pre-settlement (Miller et al., 2009).
Wetlands can accumulate even more or-ganic material than dry prairies because of the reduced rates of decomposition. The water slows the diffusion of oxygen, which results in communities of micro-organisms that have to use less efficient processes for respiration. As wetlands are still highly productive, there is a net
gain in organic matter. Sometimes there is so much of a gain that a layer of pure organic matter accumulates across the top of the mineral soil.
These ecosystem dynamics causing the accumulation of organic matter in Iowa’s soil had been taking place for thousands of years. When we changed that system to one that provides us with food, we changed the hydrology and the balance of organic material in the landscape. As we ponder questions of sustainability and environmental qual-ity, it is useful to take stock of the pro-cesses that have provided the resources we have today.
Figure 1. Distribution of historical wetland class on the Des Moines Lobe region of Iowa based on NRCS soil survey data.
Soil & Water 15
Implications for the Future
There are various goals people have for the future of our land-scape. In some locations we may want to restore wetlands and in others we may want to manage the soil for continued productivity. For either of these goals, a soil’s history can tell us a lot.
As we work to restore wetlands for wildlife habitat, we should keep in mind the distribution of wetland types. When people think of wetlands, they often picture some open water in the middle surrounded by areas of reeds and cattails. In this im-age of a wetland there is water standing above ground. How-ever, more than 80% of the wetlands on the Des Moines Lobe were the type that would be classified as either temporarily flooded or saturated (figure 1). These kinds of wetlands rarely have water ponding above the top of the soil. The water only fills the pores of the soil, but that condition is sufficient to suppress the availability of oxygen in the soil. The saturated soil would have vegetation specially adapted to these condi-tions. There has been a bias in wetland restoration projects for the more romantic permanent wetlands. If the goal is truly ecosystem restoration, the hydrological environment that provides the right conditions for the spectrum of wetland plant species should be replicated as much as possible.
An interesting question that comes out of using soil as a history book is “How long will a soil reflect the previous environment?” We enjoy the benefits that are the legacy from prairie-wetland ecosystems. Despite our dependence on these soil properties, we continue to pay little attention to them. The stores of organic matter are so vast it is hard for us to imagine it ever being depleted. Perhaps this helps to explain why rates of soil erosion remain high, even though many of us are aware of the problems associated with soil erosion. At the same time, plowing fields promotes the conversion of organic matter into carbon dioxide gas. To some extent these pro-cesses are natural and necessary. But we need to do more to balance our carbon budget. This includes reducing the loss of organic matter and increasing the amount of organic matter that gets put back into the soil. For the continued prosperity of the people of Iowa, it is time for us to pay more attention to this resource. Iowa is in a unique situation to provide food security, but like any form of security it will require vigilant maintenance.
Given the wealth of services and information that soil pro-vides people, it is surprising that so relatively few people have taken much time to study it. The next time you have a chance, take a class about soil and see what new things it will show you about the world you live in.
References
Miller, B.A., W.G. Crumpton, A.G. van der Valk. 2009. Spatial distribution of historical wetland classes on the Des Moines Lobe, Iowa. Wetlands. 29(4):1146-1152.
As we ponder questions of sustainability and environmental quality, it is useful to take stock of the processes that have provided the resources we have today.
Soil & Water 16
Brian GelderPost-Doctoral Researcher, Center for Sustainable Environmental Technology, Iowa State University
The floods of 2008 ravaged northeast-ern Iowa and resulted in billions of dollars of damaged property and lost productivity. The floods crippled the infrastructure of Mason City, Cedar Rapids, and Iowa City, submerged over 1000 city blocks in Cedar Rapids alone, and wiped previous flood peaks from the record books. The large area impacted, the fact that the floods of 1993 are still fresh in the memory of many Iowans, and the fact that the Des Moines River flood peaks in 2008 were nearly as high as 1993 likely led to questions about whether the floods of 2008 were a manmade disaster caused by human alterations of the hydrologic cycle or a true natural disaster. To many it seems that large 100 and 500 year floods are occurring with a frequency greater than would be expected by their recurrence interval. To determine if anthropogenic impacts are causing changes in the hydrologic cycle we will analyze both model runs of the Iowa Daily Erosion Project for 2008 for land cover impacts on runoff and research into anthropogenic changes in stream channel storage.
The Iowa Daily Erosion Project (IDEP) is a mechanistic simulation of hillslope hydrologic and erosion processes at thousands of locations around the state enabling us to estimate erosion, runoff, and soil moisture at the township level. This information and details on the methodology used is available to the
public at http://wepp.mesonet.agron.iastate.edu. IDEP shows the stage be-ing set for the floods of 2008 in early April with a large snowstorm in eastern Iowa. Significant rainfall (greater than 0.10”) in the Cedar River watershed then occurred on April 17, 18, 24, and 25, May 6, 10, 11, 23, 25, 29, and 30, and June 3, 4, 5, 7, 8, 11, and 12. Each rain event fell on increasingly saturated soils due to relatively short periods of
dry weather between each storm, result-ing in increasing large runoff fractions. This conclusion is verified by IDEP soil moisture totals that increase over the April to June timeframe. When viewing the soil moisture totals, keep in mind that the loess derived soils in east central Iowa have a greater soil moisture hold-ing capacity and consequently higher maximum soil moisture percentage totals than the soils of the Des Moines lobe or Northeast Iowa.
Much conjecture focused on the suppo-sition that current agricultural practices increased the runoff fraction when compared to native land cover, resulting in larger runoff volumes. To determine whether this could be true we compared IDEP runoff estimates with both cur-rent crop cover and native cover. The model results did not support this claim as runoff volumes in the watersheds of interest did not show appreciable differ-ences in runoff volume or fraction. For the intense rainfall period from May 29 to June 15, the difference in total state-
wide runoff was less than two percent with native cover having slightly more predicted runoff than current cover. In the Iowa and Cedar River watersheds native cover actually had even more runoff, about 15 percent more than current cover. The increase with native cover may seem counter-intuitive; how-ever it can be explained by the greater moisture storage capacity of tilled soils due to higher porosity and larger surface
depressions. Figures 1 and 2 illustrate this result with slightly higher run-off predictions for native cover on June 8, indicat-ing that land cover was not the primary cause of the floods of 2008.
The exoneration of land cover changes from causing the floods of 2008 does not mean that humans did not alter flood extent or duration. Humans have changed the time of concentration and floodplain storage capacity through stream straightening and siltation. Re-search into the effects of these changes on post-settlement alluvium deposition in the South Fork of the Iowa River by Mark Tomer and others at the USDA ARS National Laboratory for Agricul-ture and the Environment has shown that upland erosion has significantly altered the river channel by delivering greater than 10.2 x 10^6 tons of sedi-ment to the channel, or roughly 69.8 tons/ac of eroded sediment from the uplands. Humans have also straightened the river channel, reducing its length by approximately 10%. Cumulatively, these changes removed approximately 4300 acre feet of floodplain storage, es-sentially making every storm seem 0.45” bigger than it actually is and exacerbat-ing any flooding that occurs. Although these changes were documented in the
Preventable Tragedy or True Calamity?The Floods of 2008
IDEP shows the state being set for the floods of 2008 in early April with a large snowstorm in eastern Iowa.

Soil & Water 17
South Fork of the Iowa River, erosion and channel straightening in the Win-nebago and Cedar Rivers likely had similar effects, exacerbating the floods.
The effects of another large change to the hydrologic system, drainage of prairie potholes and other wetlands, is largely un-researched. It has been well documented that tile drainage increases crop yields significantly, which has resulted in the installation of a large drainage network, however the exact extent and size of these systems is not well known and thus impacts are dif-ficult to quantify. It is likely that they did exacerbate the flood peak; however definitive answers will have to wait until high accuracy LiDAR topography helps better define the hydrologic system as it currently exists.
Thus it appears that human develop-ment is at least partially responsible for increased flooding in 2008. Land cover changes probably did not increase flood volumes, but stream straightening and sediment likely did. Assessing the impact of tile drainage is much more difficult, but it also probably increased flood peak severity by decreasing time of concentration. However, our impacts on the hydrologic cycle need not be one sided. Removal of sediment and channel restoration could restore some, if not most, of the lost channel storage. The completion of Iowa’s LiDAR dataset should also allow better estimation of the true impact of drainage on Iowa’s hydrology. Assessment of these impacts will dovetail with current research into installation of constructed wetlands at strategic points in a watershed. This, along with channel cleaning, could temporarily store water from tile drains, reduce flood peaks, and move our hydrologic system back to its long term equilibrium.
Figure 1. Runoff predictions for June 8, 2008 with actual land cover.
Figure 2. Runoff predictions for June 8, 2008 with native (prairie grass) cover.

Soil & Water 18
Jessica VeenstraPhD candidate, Agronomy Department, Iowa State University
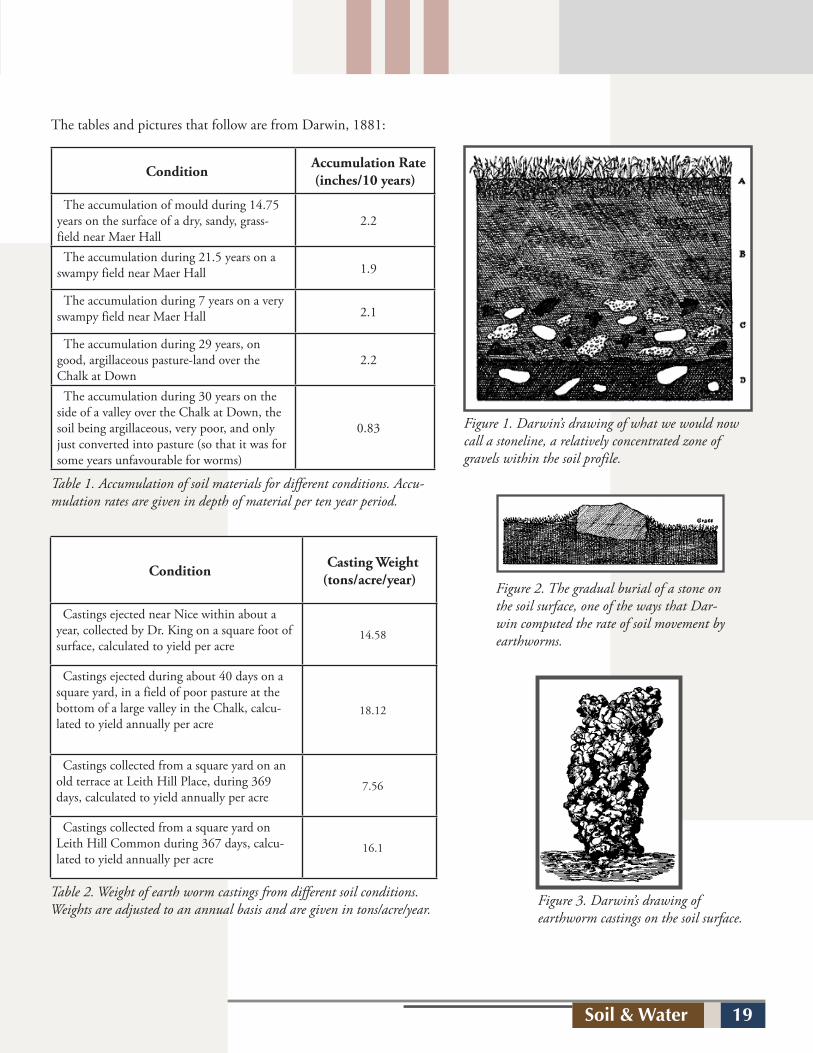
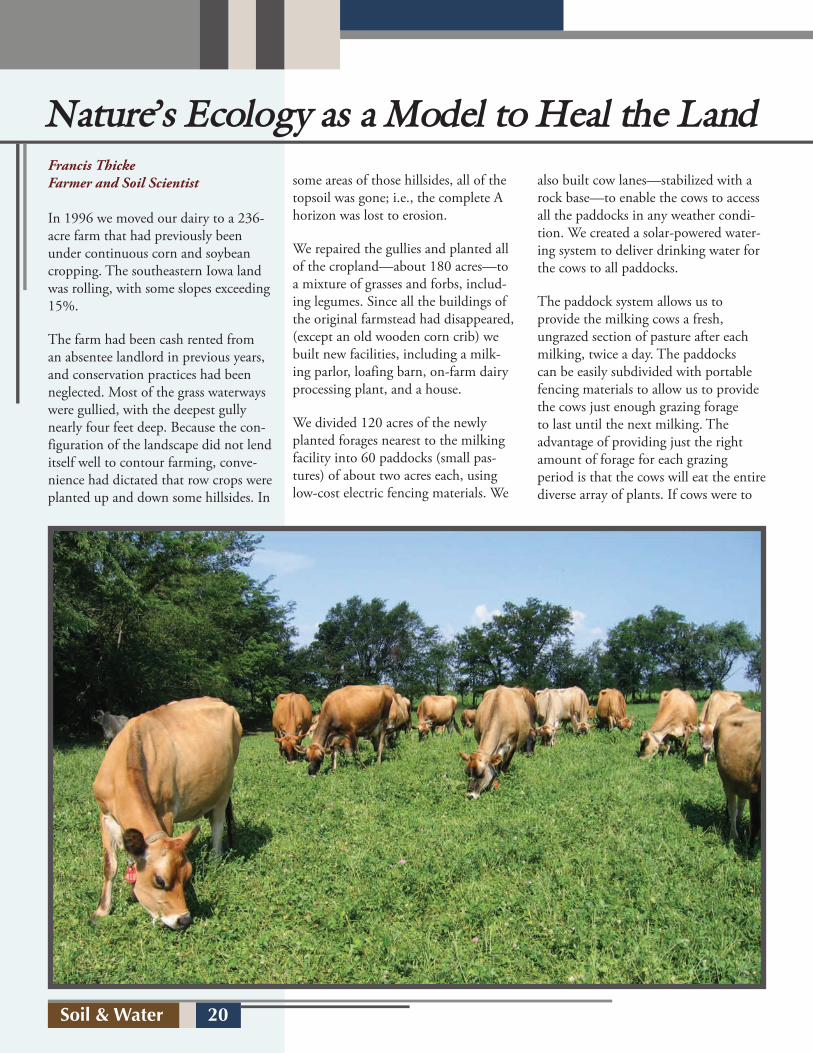
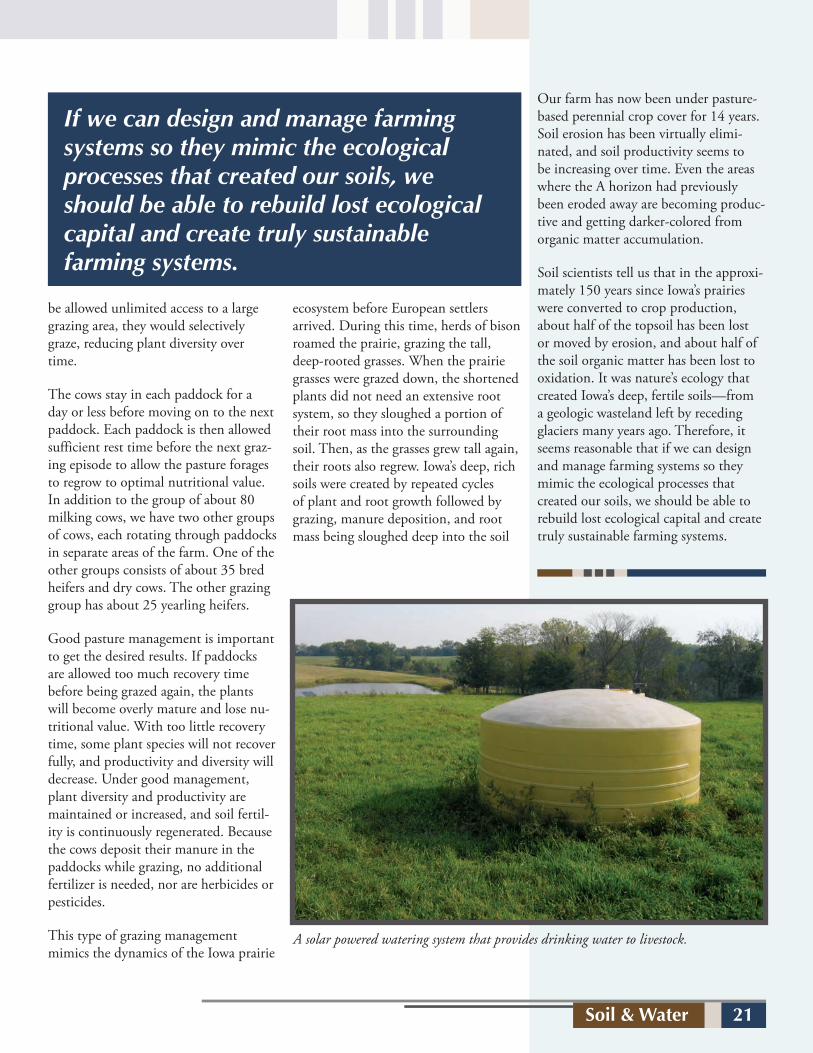
In 1838, twenty-one years before Charles Darwin published On the Origin of Species, he published an article with a similar sounding title: On the Origin of Mould. “Vegetable mould” was a British term at the time for soft, loose earth, especially rich in organic matter, what we call “topsoil” today. In this article, he reported some observations of the gradual burying of stones and cinders that had been spread on a field 10-15 years before (Figure 1). He attributed this gradual upbuilding of soil to the digestive action
of earthworms. Earthworms consume small soil particles and organic matter and excrete this material as casts on the soil surface, gradually mixing and moving soil. By ingesting and casting, worms are gradually burying larger particles that they cannot ingest (Figure 3). The data he presents in this paper represent some of the first attempts to quantify soil formation rates, an idea that soil scientists still struggle to quantify today. Nearly forty years later he synthesized his early reflections on soil formation in his book The Formation of Vegetable Mould Through the Actions of Worms. Tables 1 and 2 summarize his findings.
Darwin may have contributed to soil science, but his legacy is certainly the theory of evolution. If he was living and working today, in our never-ending attempts to subdivide and compartmen-talize science, we might be tempted to categorize him as a biologist or evo-lutionary ecologist. His publications, however, spanned a whole range of disciplines within his sixty-year career. Topics included: British entomology, the structure and function of coral reefs, geological observations of volcanic islands, zoology, botany, animal and hu-man behavior and emotions, movement in plants, distribution of boulders and movement by glaciers.
Charles Darwin was not just a biologist or an ecologist, rather he was an acute observer of the natural world, a naturalist. John Dewey wrote these words about observation and science long after Darwin’s death:
We have three approaches at our disposal: the observation of nature, reflection, and experimentation. Ob-servation serves to assemble the data, reflection to synthesise them and experimentation to test the results of the synthesis. The observation of nature must be assiduous, just as reflection must be profound, and ex-perimentation accurate. These three approaches are rarely found together, which explains why creative geniuses are so rare.
Darwin had an extraordinary affinity for all three approaches. Current science with its focus on testing treatments, ran-
domized split plot designs and p-values is too narrowly focused on the third approach, experimentation. Experimen-tation is important and useful, but we could use some reminding of the power of the integration of the three approach-es. By focusing our efforts so narrowly, burrowing so deeply into our disciplines and subdisciplines and rarely surfacing, we are missing opportunities for grand synthesis. Because Darwin dabbled in the disciplines and carefully observed nature, he was part of the grand syn-thesis. Let Darwin’s contributions to science remind us to observe nature and reflect, to spend some time, not as soil scientists or hydrologists, but as natural-ists carefully observing the world.
References
Brown, Janet. 2002. Charles Darwin: The Power of Place. Volume II of a biography. New York. Alfred A. Knopf
Darwin, Charles. 1838. On the formation of mould. [Read 1 Nov. 1837] Proceedings of the Geological Society of London 2: 574-576.
Darwin, Charles. 1844. On the origin of mould. Gardeners’ Chronicle no. 14 (6 April): 218.
Darwin, Charles. 1881. The formation of vegetable mould, through the action of worms. London: John Murray
Let Darwin’s contributions to science remind us to observe nature and reflect as naturalists carefully observing the world.
Charles Darwin:Early Soil Scientist?
Soil & Water 19
Figure 3. Darwin’s drawing of earthworm castings on the soil surface.
Figure 1. Darwin’s drawing of what we would now call a stoneline, a relatively concentrated zone of gravels within the soil profile.
Figure 2. The gradual burial of a stone on the soil surface, one of the ways that Dar-win computed the rate of soil movement by earthworms.
Condition Accumulation Rate (inches/10 years)
The accumulation of mould during 14.75 years on the surface of a dry, sandy, grass-field near Maer Hall
2.2
The accumulation during 21.5 years on a swampy field near Maer Hall 1.9
The accumulation during 7 years on a very swampy field near Maer Hall 2.1
The accumulation during 29 years, on good, argillaceous pasture-land over the Chalk at Down
2.2
The accumulation during 30 years on the side of a valley over the Chalk at Down, the soil being argillaceous, very poor, and only just converted into pasture (so that it was for some years unfavourable for worms)
0.83
Table 1. Accumulation of soil materials for different conditions. Accu-mulation rates are given in depth of material per ten year period.
The tables and pictures that follow are from Darwin, 1881:
Condition Casting Weight (tons/acre/year)
Castings ejected near Nice within about a year, collected by Dr. King on a square foot of surface, calculated to yield per acre
14.58
Castings ejected during about 40 days on a square yard, in a field of poor pasture at the bottom of a large valley in the Chalk, calcu-lated to yield annually per acre
18.12
Castings collected from a square yard on an old terrace at Leith Hill Place, during 369 days, calculated to yield annually per acre
7.56
Castings collected from a square yard on Leith Hill Common during 367 days, calcu-lated to yield annually per acre
16.1
Table 2. Weight of earth worm castings from different soil conditions. Weights are adjusted to an annual basis and are given in tons/acre/year.
Soil & Water 20
Francis ThickeFarmer and Soil Scientist
In 1996 we moved our dairy to a 236-acre farm that had previously been under continuous corn and soybean cropping. The southeastern Iowa land was rolling, with some slopes exceeding 15%.
The farm had been cash rented from an absentee landlord in previous years, and conservation practices had been neglected. Most of the grass waterways were gullied, with the deepest gully nearly four feet deep. Because the con-figuration of the landscape did not lend itself well to contour farming, conve-nience had dictated that row crops were planted up and down some hillsides. In
some areas of those hillsides, all of the topsoil was gone; i.e., the complete A horizon was lost to erosion.
We repaired the gullies and planted all of the cropland—about 180 acres—to a mixture of grasses and forbs, includ-ing legumes. Since all the buildings of the original farmstead had disappeared, (except an old wooden corn crib) we built new facilities, including a milk-ing parlor, loafing barn, on-farm dairy processing plant, and a house.
We divided 120 acres of the newly planted forages nearest to the milking facility into 60 paddocks (small pas-tures) of about two acres each, using low-cost electric fencing materials. We
also built cow lanes—stabilized with a rock base—to enable the cows to access all the paddocks in any weather condi-tion. We created a solar-powered water-ing system to deliver drinking water for the cows to all paddocks.
The paddock system allows us to provide the milking cows a fresh, ungrazed section of pasture after each milking, twice a day. The paddocks can be easily subdivided with portable fencing materials to allow us to provide the cows just enough grazing forage to last until the next milking. The advantage of providing just the right amount of forage for each grazing period is that the cows will eat the entire diverse array of plants. If cows were to
Nature’s Ecology as a Model to Heal the Land
Soil & Water 21
be allowed unlimited access to a large grazing area, they would selectively graze, reducing plant diversity over time.
The cows stay in each paddock for a day or less before moving on to the next paddock. Each paddock is then allowed sufficient rest time before the next graz-ing episode to allow the pasture forages to regrow to optimal nutritional value. In addition to the group of about 80 milking cows, we have two other groups of cows, each rotating through paddocks in separate areas of the farm. One of the other groups consists of about 35 bred heifers and dry cows. The other grazing group has about 25 yearling heifers.
Good pasture management is important to get the desired results. If paddocks are allowed too much recovery time before being grazed again, the plants will become overly mature and lose nu-tritional value. With too little recovery time, some plant species will not recover fully, and productivity and diversity will decrease. Under good management, plant diversity and productivity are maintained or increased, and soil fertil-ity is continuously regenerated. Because the cows deposit their manure in the paddocks while grazing, no additional fertilizer is needed, nor are herbicides or pesticides.
This type of grazing management mimics the dynamics of the Iowa prairie
ecosystem before European settlers arrived. During this time, herds of bison roamed the prairie, grazing the tall, deep-rooted grasses. When the prairie grasses were grazed down, the shortened plants did not need an extensive root system, so they sloughed a portion of their root mass into the surrounding soil. Then, as the grasses grew tall again, their roots also regrew. Iowa’s deep, rich soils were created by repeated cycles of plant and root growth followed by grazing, manure deposition, and root mass being sloughed deep into the soil
If we can design and manage farming systems so they mimic the ecological processes that created our soils, we should be able to rebuild lost ecological capital and create truly sustainable farming systems.
Our farm has now been under pasture-based perennial crop cover for 14 years. Soil erosion has been virtually elimi-nated, and soil productivity seems to be increasing over time. Even the areas where the A horizon had previously been eroded away are becoming produc-tive and getting darker-colored from organic matter accumulation.
Soil scientists tell us that in the approxi-mately 150 years since Iowa’s prairies were converted to crop production, about half of the topsoil has been lost or moved by erosion, and about half of the soil organic matter has been lost to oxidation. It was nature’s ecology that created Iowa’s deep, fertile soils—from a geologic wasteland left by receding glaciers many years ago. Therefore, it seems reasonable that if we can design and manage farming systems so they mimic the ecological processes that created our soils, we should be able to rebuild lost ecological capital and create truly sustainable farming systems.
A solar powered watering system that provides drinking water to livestock.

Soil & Water 22
already have relatively large amounts of organic carbon, such as Iowa soils, would not likely be beneficial to crop production. On the other hand, adding carbon to highly weathered soils with little organic carbon, like in the south-ern US and Amazon River Basin, would likely be beneficial.
How are we using that idea today?
Organic carbon plays an important role in the soil. It has the potential to influ-ence soil physical characteristics and chemical processes (DeLuca et al., 2006; Glaser et al., 2001). It has also been shown to affect soil productivity, qual-ity, fertility, and nutrient cycling, which all affect crop production (Skjemstad et al., 2002; Lal, 2004). There is the idea that adding organic carbon to the soil will play a role in increasing carbon sequestration in the soil. Soil is known
to be a large carbon sink. Over time agronomic practices, such as plowing, have been shown to reduce organic carbon in the soil and decrease the soils’ carbon sink.
Why might it be important?
Carbon sequestration may be a partial solution to the increasing concern over global climate change. Sequestering carbon implies trapping atmospheric
CO2 into long-lived pools in the soil for storage so it is not immediately reemit-ted (Lal, 2004). It has been established that using biochar for sequestration represents long term storage of the car-bon (Lehmann et al., 2006; Glaser et al. 2001; Lehmann, 2007). There is hope that a carbon credit market may soon be available and farmers can sell the carbon credits they receive for applying biochar.
The potential of biochar
Removal of biomass from fields for bio-char, bio-oil and syngas production may create problems. One serious problem that is currently being studied is how the biomass removal will impact ero-sion from rain and wind. The biomass provides protection for the soil and with its removal, this protection is also re-moved. There is also concern about the nutrients that are typically recycled into the soil from decomposition. When the biomass is removed from the field, so
are the nutrients. It is thought that applying biochar back to the field will offset the nutri-ent loss. There is no research currently available to support that idea.
There are potential problems and concerns that have been raised, but biochar also has the potential to be benefi-
cial. Research is being done to get an understanding of what is really going on when biochar is applied to the soil, but there are still many questions left to be answered.
Biochar: What’s All The Excitement About?Rachel Unger, PhD candidateRandy Killorn, Professor, Agronomy Department, Iowa State University
What is biochar?
Biochar, bio-oil and syngas are co-prod-ucts of a process called pyrolysis. Pyroly-sis occurs in a reactor that heats biomass to high temperatures (450 -1000 °C) under conditions of low amounts of oxygen. Biomass can be anything from agricultural residue to wood. In Iowa, the main biomasses being studied are corn stalks and switchgrass. Bio-oil and syngas are currently being studied as fuel and energy alternatives. Bio-char is a charcoal-like material that is high in stable biological carbon and has some additional nutrients including phospho-rus and potassium. Biochar is currently being studied as a soil amendment.
A brief history of biochar
Biochar is a new spin on an old idea. Soils discovered in the Amazon River Basin, known as Terra Preta de Indio, have been determined to have higher lev-els of charcoal (black carbon) which can be up to 70 times higher than the surrounding soils, are more productive than surrounding soils and have been around for hundreds to thousands of years (Mann, 2002; Glaser et al., 2001 and 2002; Lehmann, 2007). Iowa soils also have a relatively large amount of organic car-bon, which contribute to the dark color. This carbon has been attributed to prai-rie fires of the past. It is thought that adding carbon to the soil will increase soil fertility and carbon sequestration. However, it should be considered where the addition of carbon will be the most beneficial. Adding carbon to soils that
Over time agronomic practices, such as plowing, have been shown to reduce organic carbon in the soil and decrease the soils’ carbon sink.

Soil & Water 23
Works Cited
DeLuca, T.H., MacKenzie, M.D., Gundale, M.J., Holben, W.E. 2006. Wildfire-Produced Charcoal Directly Influences Nitrogen Cycling in Ponderosa Pine Forests. Soil Science Society of America Journal 70: 448-453.
Glaser, B., Haumaier, L., Guggenberger, G., Zech, W. 2001. The ‘Terra Preta’ phenomenon: a model for sustainable agriculture in the humid tropics. Naturwissenschaften 88: 37-41.
Glaser, B., Lehmann, J., Zech, W. 2002. Ameliorating physical and chemical properties of highly weathered soils in the tropics with charcoal – a review. Biol Fertil Soils 35: 219-230.
Lal, R. 2004. Soil Carbon Sequestration Impacts on Global Climate Change and Food Security. Science 304: 1623-1627.
Lehmann, J., Gaunt, J., Rondon, M. 2006. Bio-char sequestration in terrestrial ecosystems – a review. Mitigation and Adaption Strategies for Global Change 11: 403-427.
Lehmann, J. 2007. Bio-energy in the black. Frontiers in Ecology and the Environment 5, doi: 10.1890/060133.
Mann, C. C. 2002. The Real Dirt on Rainforest Fertility. Science 297: 920-923.
Skjemstad, J. O., Reicosky, D. C., Wilts, A. R., McGowan, J. A. 2002. Charcoal Caron in U.S. Agricultural Soils. Soil Science Society of America Jounral 66: 1249-1255.
Joyce Swartzendruber State Conservationist, USDA-NRCS, Bozeman, MontanaFounding member of the ISU SWCC
�e view from my window has changed frequently since I left Iowa State University behind. �is morning I see the snow-capped peaks of the Bridger Mountains from my fourth �oor o�ce of Natural Resources Conservation Service in the federal building in Boze-man, Montana. In Fairbanks, Alaska I used to watch moose wander through our lot and see the sun come up at 11 a.m. �ere were some not-so-nice views, too, of used car lots and railroad tracks, and even some o�ces that didn’t have windows. But the beauty of my career, and the Agronomy degree that carried me through it, has been that this isn’t an o�ce job.
�e landscapes, soils, crops, livestock, and wildlife that drive and dictate my work with NRCS have changed for me with every move: from Iowa to Fairbanks, Boise, Columbus, Bangor, and Bozeman. As I drove through the country and visited farmers and ranch-ers in each state where I have worked, I learn more about how our natural systems and our agricultural systems co-exist. �e common denominator has always been the people. Our mission at NRCS is helping people make the right decisions for their own operation and in concert with the natural world around them.
I “discovered” soil conservation as a ca-reer in a newspaper ad in the Washing-ton Evening Journal in 1977. �is was a giant leap for a young o�ce manager in the Kalona Sales Barn, but I took the opportunity and found that being a soil conservation technician was a good �t with my rural background and concern for the environment.
�at foot-in-the-door introduced me to many professionals in the Soil Conser-vation Service (SCS), and they encour-aged me to join the Soil Conservation Society of America (SCSA) and also to return to college to pursue a profes-sional position with SCS. I applied for the John Williams Scholarship from SCSA, and I went to the society’s annual conference in New Orleans to accept it. �ere were student groups there that impressed me, and that was the impetus to form an ISU chapter as I worked toward my BS in Agronomy.
�e “mother ship” of the SWCS in Ankeny, IA was very helpful. �ey knew of two other SCSA student members at ISU, Dan Chargo in Political Science and Stephanie Wald in Environmental Science. �e three of us charged ahead, and with the help of Dr. Don Wysocki we started the ISU Chapter of SWCS in 1983. It was a small group, but we became active in the community with projects such as soil testing for local gardeners. We brought speakers in to address our group, and once we met jointly with the ISU Agronomy Club. When I graduated in 1984 I was pretty worried that the SWCS club might die, and that’s why I always get a little teary-eyed and excited when I run into more ISU students at the SWCS conferences.
Twenty-�ve years have passed since I left ISU and many things have changed. �e name of the SCS has changed to the NRCS. �e �fty-year olds are taking over Facebook, and I’m lost without my blackberry. But as long as humans are managing our land and water resources we will need conservationists to un-derstand the systems and guide the decision-makers. It’s great to know that there’s still a group back at ISU that has a passion for conservation and is inspir-ing new generations of professionals to provide that expertise. �anks for keep-ing the �res burning.
The View from my Office...
Soil & Water 24
Jeri Neal Ecological Systems Research Program Leader,Leopold Center for Sustainable Agriculture
The Leopold Center for Sustainable Agriculture (LCSA) of 2010 inhabits a world where humans manage to ignore their roots in both soil and water: “... the Latin name for man, homo, [is] derived from humus, the stuff of life in the soil.” Water comprises from 75 percent of the human mass at birth to 55-60 percent as adults, and is a major component in every cell of the human body.The link to soil and water should be obvious. Croplands are the foundation of not only Iowa agriculture, but as Sir Albert Howard tells us, “Fertil-ity of the soil is the future of civilization.” L.R. Brown notes in ‘Eroding the Base of Civiliza-tion,’ “they [croplands] are the foundation of civilization itself. When we lose soil we lose centuries of process.” But even Brown limits his analysis to land conversion and topsoil erosion, a thin analysis given our growing knowledge of the connections of the health of the land to the very health of the people living on the land on which we all live. “The whole problem of health, in soil, plant, animal and man is one great subject.” (Sir Albert How-ard).
As a culture, have we systematically blinded ourselves to the elements of soil and water that underpin our existence? It seems so. There is much evidence that several ecologi-cal stressors are perhaps to the point of triggering cultural collapse. And even though the structure for the founding of the LCSA arrived under the auspices of the highly innovative 1987 Iowa Groundwater Protection Act (see sidebar: History) we still ineffectively joust with what Wes Jackson of the Land Institute would call the ‘problems IN agriculture,’ rather than
addressing the ‘problems OF agriculture.’ This distinction is important because it implies two drastically different modes of investment and action. In the one case, we deplete our energy and resources in an endless stream of treating symp-toms IN agriculture. In the alternative case we invest in the discovery and address of root causes to eliminate the problems OF agriculture.
The Leopold Center is tasked with addressing root causes and solutions associated with production agriculture. Our true legacy is to our namesake Aldo Leopold, to put marching feet under his visionary thinking around biotic communities and biotic ethics. Leopold defined “land” as not merely “soil” but “energy flowing through a circuit of soils, plants, and animals.” He further challenged us to accept ourselves as ‘part and parcel, not separate from the
biotic community.’ Regarding our use of the land, and recall-ing his expanded definition, he observed,
“We abuse land because we regard it as a commodity belong-ing to us. When we see land as a community to which we belong, we may begin to use it with love and respect.”
Abusing? Are we abusing the land and by definition, our-selves? Tough questions, but looking behind the crop yields to soil and water, Iowa has a multitude of impaired waters, sig-nificant soil erosion, and science suggesting that our primary agricultural practices are degrading the soil and its function. The Land Institute’s Wes Jackson has observed of our miles of uniform Midwest monocultures, ‘if you’re not aware of what’s behind it you can live with the illusion that nothing is wrong.’ Is modern agriculture exempt from the laws of ecology? Is civilization? Leopold would have said not, and his ideas chal-lenge us to understand the relationships between ecological
Getting to the Root of the Matter: Soil and Water
As a culture, have we systematically blinded ourselves to the elements of soil and water that underpin our existence?

Soil & Water 25
diversity and cultural diversity in the creation, maintenance and perpetuation of human and land health. In this he saw, as do we, a future with
(1) valuable roles to be played by both the scientist and the general public, and
“On the contrary, the Ph.D. may become as callous as an un-dertaker to the mysteries at which he officiates. . . . The weeds in a city lot convey the same lesson as the redwoods; the farm-er may see in his cow-pasture what may not be vouchsafed to the scientist adventuring the South Seas. Perception, in short, cannot be purchased with either learned degrees or dollars.”
(2) a rethinking of the relationships among ecology, ethics and economics in a manner that places ecological context central to enterprise.
History
“...The marvelous advances in technique made during recent decades are improvements in the pump, rather than the well. Acre for acre, they have barely sufficed to offset the sinking level of fertility.” – Aldo Leopold
What is the Leopold Center for Sustainable Agriculture?
The Leopold Center for Sustainable Agriculture (LCSA), located at Iowa State University, is dedicated to developing sustainable agricultural systems through sound research and then sharing those findings with Iowa farmers. Established in 1987 by the landmark Iowa Groundwater Protection Act, the Center receives state funding from general appropriations and a portion of state fees assessed on nitrogen fertilizer and pesticide registration.
The Leopold Center has a three-fold mission: (1) to identify and reduce adverse environmental and socioeconomic im-pacts of agricultural practices, (2) develop profitable farming systems that conserve natural resources, and (3) develop, in association with the Iowa Cooperative Extension System, an educational framework to inform the public of new findings.
The Center takes its mission from the land ethic of Aldo Leo-pold. Paul Johnson, an Iowa farmer and one of the authors of the Iowa Groundwater Protection Act said, “Today people ask who Aldo Leopold was and why a Center at Iowa State was named after him. Those questions and the answers are an important and fundamental part of the process [in developing the Center].” Aldo Leopold emphasized the land and people’s
relationship with it. In the 1940s, he was concerned about the trend toward land use practices that degraded the natural environment and turned people into users of the land rather than cohabitants with other living systems. Johnson felt that naming the Center after Leopold not only honored Leopold’s great contribution to the preservation of the environment and ultimately the “sustainability” of the United States and its natural resources, but also rooted the philosophy of the Center in Leopold’s holistic approach to solving the problems of the land.
The Center operates three research programs: ecological systems and research, marketing and food systems, and policy. It supports a number of special projects, working groups and value chains. The Center also sponsors seminars, conferences, and events along with a wide range of publications and educa-tion/outreach materials. The information gleaned from the research and activities is shared with agricultural communities and partners to both encourage and catalyze voluntary changes in farming systems. A 17-member advisory board counsels the director on funding of research proposals, policies and pro-cedures, budget development and program review. Members represent Iowa State University, University of Iowa, University of Northern Iowa, private colleges and universities, the Iowa Department of Agriculture and Land Stewardship, the Iowa Department of Natural Resources, the State Soil Conservation Committee, Iowa Farm Bureau Federation, Practical Farmers of Iowa, Agribusiness Association of Iowa and the Iowa Farm-ers Union.
“Many historical events, hitherto explained solely in terms of human enterprise were actually biotic interactions between people and land. The characteristics of the land determined the facts quite as potently as the characteristics of the men who lived on it.”
Leopold explicitly linked cultural diversity, biodiversity and ecosystem function through a biotic pyramid, “beginning with the… soil... with each successive layer depending on those below it for food and other services.” He further com-ments “There is value in any experience that reminds us of our dependency on the soil-plant-animal-man food chain, and of the fundamental organization of the biota.”
We at the Leopold Center believe he has the right of it.
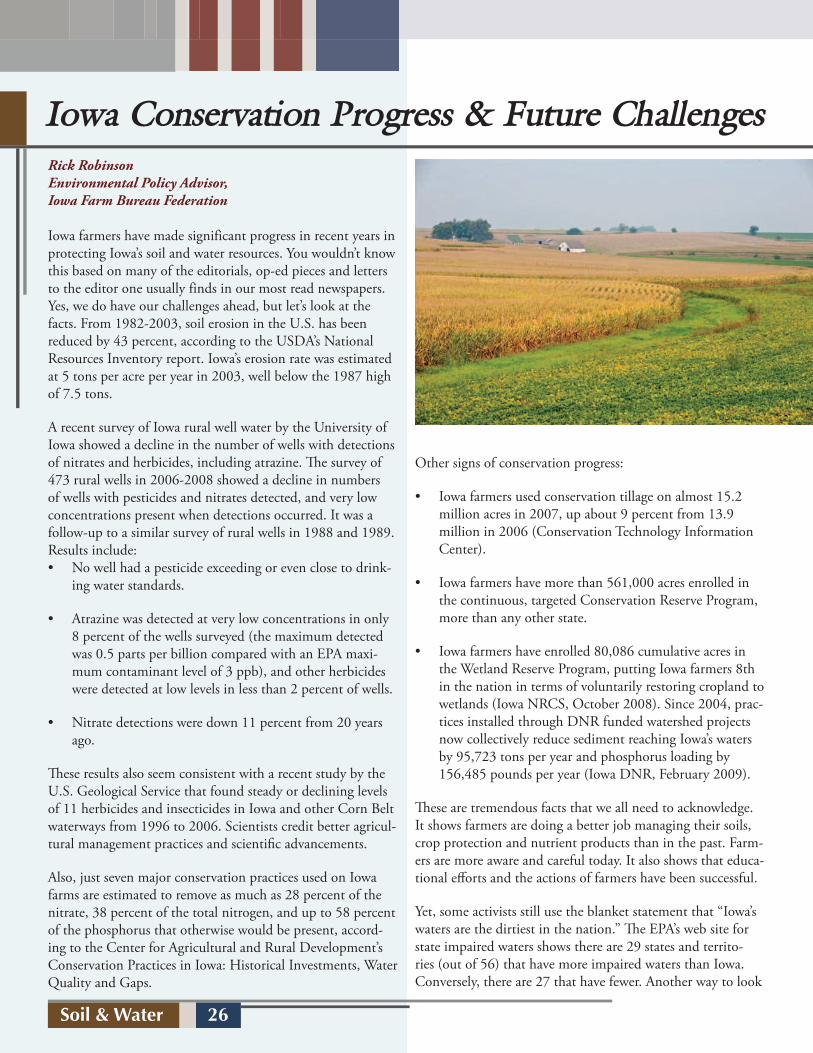
Soil & Water 26
Rick RobinsonEnvironmental Policy Advisor,Iowa Farm Bureau Federation
Iowa farmers have made significant progress in recent years in protecting Iowa’s soil and water resources. You wouldn’t know this based on many of the editorials, op-ed pieces and letters to the editor one usually finds in our most read newspapers. Yes, we do have our challenges ahead, but let’s look at the facts. From 1982-2003, soil erosion in the U.S. has been reduced by 43 percent, according to the USDA’s National Resources Inventory report. Iowa’s erosion rate was estimated at 5 tons per acre per year in 2003, well below the 1987 high of 7.5 tons.
A recent survey of Iowa rural well water by the University of Iowa showed a decline in the number of wells with detections of nitrates and herbicides, including atrazine. �e survey of 473 rural wells in 2006-2008 showed a decline in numbers of wells with pesticides and nitrates detected, and very low concentrations present when detections occurred. It was a follow-up to a similar survey of rural wells in 1988 and 1989. Results include:• No well had a pesticide exceeding or even close to drink-
ing water standards.
• Atrazine was detected at very low concentrations in only 8 percent of the wells surveyed (the maximum detected was 0.5 parts per billion compared with an EPA maxi-mum contaminant level of 3 ppb), and other herbicides were detected at low levels in less than 2 percent of wells.
• Nitrate detections were down 11 percent from 20 years ago.
�ese results also seem consistent with a recent study by the U.S. Geological Service that found steady or declining levels of 11 herbicides and insecticides in Iowa and other Corn Belt waterways from 1996 to 2006. Scientists credit better agricul-tural management practices and scienti�c advancements.
Also, just seven major conservation practices used on Iowa farms are estimated to remove as much as 28 percent of the nitrate, 38 percent of the total nitrogen, and up to 58 percent of the phosphorus that otherwise would be present, accord-ing to the Center for Agricultural and Rural Development’s Conservation Practices in Iowa: Historical Investments, Water Quality and Gaps.
Other signs of conservation progress:
• Iowa farmers used conservation tillage on almost 15.2 million acres in 2007, up about 9 percent from 13.9 million in 2006 (Conservation Technology Information Center).
• Iowa farmers have more than 561,000 acres enrolled in the continuous, targeted Conservation Reserve Program, more than any other state.
• Iowa farmers have enrolled 80,086 cumulative acres in the Wetland Reserve Program, putting Iowa farmers 8th in the nation in terms of voluntarily restoring cropland to wetlands (Iowa NRCS, October 2008). Since 2004, prac-tices installed through DNR funded watershed projects now collectively reduce sediment reaching Iowa’s waters by 95,723 tons per year and phosphorus loading by 156,485 pounds per year (Iowa DNR, February 2009).
�ese are tremendous facts that we all need to acknowledge. It shows farmers are doing a better job managing their soils, crop protection and nutrient products than in the past. Farm-ers are more aware and careful today. It also shows that educa-tional e�orts and the actions of farmers have been successful.
Yet, some activists still use the blanket statement that “Iowa’s waters are the dirtiest in the nation.” �e EPA’s web site for state impaired waters shows there are 29 states and territo-ries (out of 56) that have more impaired waters than Iowa. Conversely, there are 27 that have fewer. Another way to look
Iowa Conservation Progress & Future Challenges
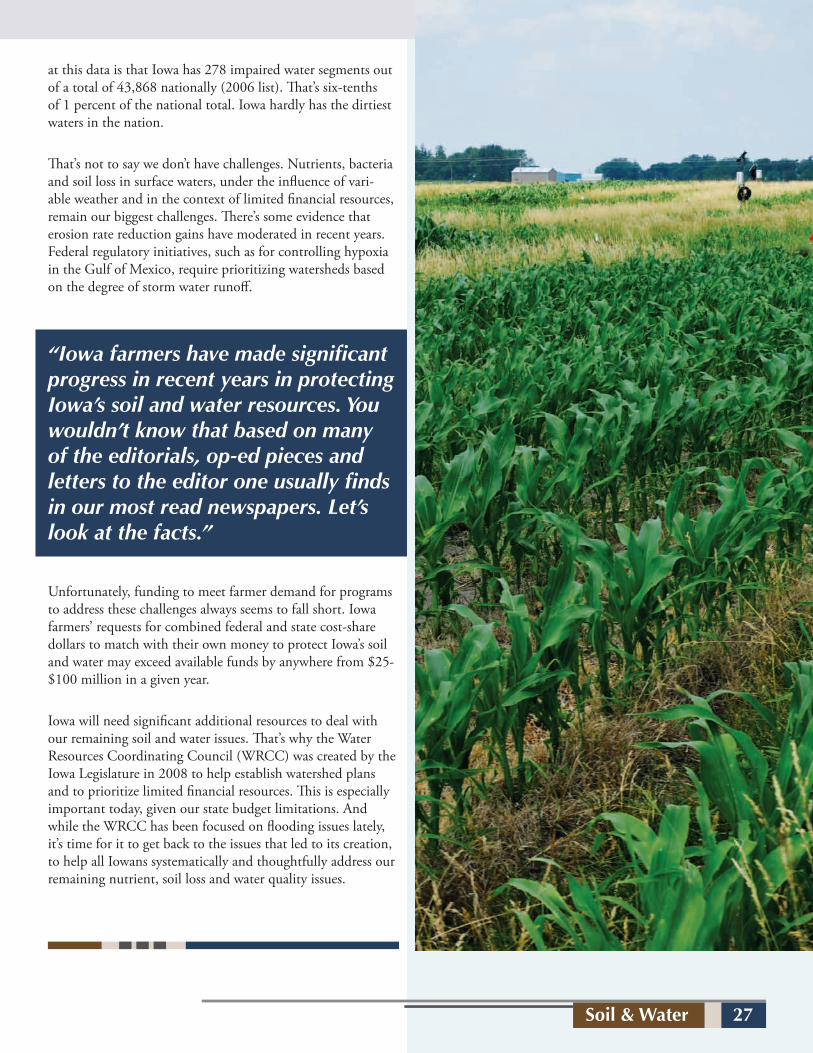
Soil & Water 27
at this data is that Iowa has 278 impaired water segments out of a total of 43,868 nationally (2006 list). �at’s six-tenths of 1 percent of the national total. Iowa hardly has the dirtiest waters in the nation.
�at’s not to say we don’t have challenges. Nutrients, bacteria and soil loss in surface waters, under the in�uence of vari-able weather and in the context of limited �nancial resources, remain our biggest challenges. �ere’s some evidence that erosion rate reduction gains have moderated in recent years. Federal regulatory initiatives, such as for controlling hypoxia in the Gulf of Mexico, require prioritizing watersheds based on the degree of storm water runo�.
Unfortunately, funding to meet farmer demand for programs to address these challenges always seems to fall short. Iowa farmers’ requests for combined federal and state cost-share dollars to match with their own money to protect Iowa’s soil and water may exceed available funds by anywhere from $25-$100 million in a given year.
Iowa will need signi�cant additional resources to deal with our remaining soil and water issues. �at’s why the Water Resources Coordinating Council (WRCC) was created by the Iowa Legislature in 2008 to help establish watershed plans and to prioritize limited �nancial resources. �is is especially important today, given our state budget limitations. And while the WRCC has been focused on �ooding issues lately, it’s time for it to get back to the issues that led to its creation, to help all Iowans systematically and thoughtfully address our remaining nutrient, soil loss and water quality issues.
“Iowa farmers have made significant progress in recent years in protecting Iowa’s soil and water resources. You wouldn’t know that based on many of the editorials, op-ed pieces and letters to the editor one usually finds in our most read newspapers. Let’s look at the facts.”

Soil & Water 28
Jack RiessenLicensed Professional Engineer in Civil Engineering, Iowa Department of Natural Resources (retired)
Most soil and water professionals have at least heard of a TMDL. Yet, not many know what it stands for (total maximum daily load) or really understand when and why a TMDL is required and what it’s supposed to accomplish. And opinions vary on their usefulness to solve water quality problems for those who are familiar with TMDLs. TMDLs, in concept, are master plans for maintaining and im-proving water quality but in practice are sometimes little more than paperwork exercises to satisfy a legal requirement. The real issue is whether TMDLs are the appropriate tool to address water quality problems that are largely due to nonpoint sources of pollution like agri-cultural runoff. There is little legislative history on this particular requirement but it is unlikely Congress ever envisioned TMDLs being what they have become today.
The requirement for TMDLs comes from one subsection of the federal Clean Water Act – 303(d). But to understand 303(d), you first need to understand two other things the Act requires: 1) technology-based effluent limits for point source discharges and 2) water quality standards.
A regulatory cornerstone of the Clean Water Act is the requirement that all point source dischargers like munici-pal sewage treatment plants obtain a discharge permit and meet technology-based effluent limits. Technology-based
limits are based on the degree of pollut-ant removal achievable with a reasonable level of treatment technology. Discharge permits for municipal sewage treatment plants, for instance, must at a minimum contain limitations on the amount and concentrations of various substances that can be discharged that are consis-tent with standard secondary treatment.
The Act also requires states to adopt state water quality standards to protect the “fishable, swimmable, drinkable” uses of their waterbodies. Water quality standards consist of two main compo-nents: (1) use designations – what a wa-terbody is used for or could be used for with a reasonable level of improvement
and (2) criteria to protect those uses. Such uses and criteria must be approved by the EPA before they are effective for the purposes outlined in the Act. If monitoring data show that a particular waterbody does not meet all relevant criteria, that waterbody is considered “impaired.”
It was realized the Act’s technology-based pollution control requirement for point sources would not, by itself, address all pollution problems. New point sources in a watershed could, for example, increase the total load of pollutants discharged to a river and lead to its impairment even if all the point sources met the technology-based treatment requirements. Section 303(d)
was intended to address the need for more stringent or additional pollution controls to meet a state’s water quality standards. Among other things, 303(d) requires the following:
• States are to identify the waterbodies where technology-based point source controls alone will not be enough to achieve state water quality standards. This list is known as the 303(d) list of impaired waters.
• For each of the listed waters, a total maximum daily load (TMDL) is to be calculated for the pollutant (or pollut-ants) causing the impairment if the EPA has identified the pollutant as being
suitable for TMDL calcula-tion. Such loads must be established at a level neces-sary to achieve water quality standards and must account for seasonal variations and a margin of safety. “Pollutant” is broadly defined in the Act and includes virtually any-
thing that might be discharged to a wa-terbody including rock and sand, heat, biological materials, and sewage sludge as well as all municipal and agricultural “waste.” Although the Act gives the EPA the discretion to say TMDL calculations are not appropriate for some pollutants, the EPA in 1978 simply said all pollut-ants are suitable for TMDL calculation.
The EPA is also required to approve a state’s list of impaired waters and the resulting TMDLs. If either the list or TMDLs are disapproved, the EPA has a legal duty to develop a new list or to redo the TMDL.
The control of point source discharges was the primary objective of Congress
TMDLs: Water Quality Master Plans or Paperwork Exercises?
It is unlikely Congress ever envisioned TMDLs being what
they have become today.

Soil & Water 29
in 1972 when 303(d) was adopted. That explains the use of the term “maximum daily load” versus other, more generic, terms like “total load” as discharge per-mits for point sources typically contain daily load limits. From that early ‘70s perspective focusing on point source controls, TMDLs appear to make sense as a rational, science-based approach to improving water quality above and beyond what technology-based controls alone could achieve.
Assume, for instance, that monitoring data for a river shows that copper levels often exceed the applicable copper crite-rion, that most of the copper is coming from industrial and municipal discharg-ers in the river’s watershed, and that the required technology-based effluent limits aren’t stringent enough to achieve the criterion. This river would then be placed on the list of impaired waters. As a first step, the required TMDL calcula-tions would determine how much of the copper load is coming from the munici-pal and industrial sources versus natural, background sources as well as nonpoint sources like agricultural runoff.
Accounting for the variability of any natural and nonpoint sources of copper and incorporating an appropriate mar-gin of safety, the total maximum daily load of copper that could be discharged from all point sources in the watershed would be determined to insure the cop-per criterion would not be exceeded. This total maximum daily load would then be apportioned among the vari-ous point source dischargers and their discharge permits modified to reflect the maximum daily load of copper that each could discharge. The TMDL would set a legally-enforceable cap on the total amount of copper that could be dis-charged to this river on any given day from all point sources in the watershed. If the TMDL did not reserve some of the maximum daily load for potential new dischargers, no new point source discharges of copper could be allowed.
A lesser-known provision of 303(d) also says that, in addition to TMDLs for impaired waters, states “shall” establish TMDLs for all pollutants for all waters although it doesn’t require EPA approval for these “non-impaired” TMDLs. A state’s TMDLs would then collectively establish what might be considered a master pollutant loading plan for every waterbody, impaired or not.
The Clean Water Act’s technology-based regulatory provisions successfully brought the most significant point sources of pollution under control in a relatively short time but it became in-creasingly evident that nonpoint sources of pollutants, as well non-pollutant factors like flow and habitat, were also causing water quality problems and would have to be addressed to further improve water quality. Most states had ignored 303(d) for a variety of reasons but environmental interest groups saw 303(d) as a legal tool that could be used to accelerate the pace of water quality improvement and began challenging the EPA in court.
The EPA felt its authority under 303(d) was limited to approving or disapprov-ing lists of impaired waters and TM-DLs; that it had no legal authority to force states to do them and submit them for review and approval. This changed when a federal appellate court in 1984 opined that a state’s continued failure to submit lists and TMDLs amounted to a “constructive submittal” of no lists or TMDLs which then triggered the EPA’s responsibility to do them. Simi-lar lawsuits across the nation followed with the federal courts typically setting a schedule to do the required TMDLs. States found themselves in the position of either preparing the lists and TMDLs themselves or deferring to the EPA and having to live with the EPA’s results.
The initial round of lawsuits involved states’ failure to prepare lists of impaired waters and to do the required TMDLs. More recent lawsuits have challenged various other aspects of the listing and TMDL calculation process including whether waterbodies only affected by nonpoint sources of pollutants had to be listed (they do), whether TMDLs had

Soil & Water 30
to be expressed as maximum daily loads versus other expressions like average annual loads (one federal appeals court said yes, another no), as well as the technical merits of individual TMDLs (allegations of “arbitrary and capricious” TMDLs not based on good science). It is unlikely that TMDL-related lawsuits will diminish any time in the near future.
Over 37,000 TMDLs have been completed nationwide according to the EPA’s TMDL website. Fifty one percent of those TMDLs have involved waterbodies where the sources of the pollutants causing the impairment are nonpoint sources, 44% involve a combination of nonpoint and point sources and 5% involve only point sources. Although TMDLs were originally envisioned as a way of setting a cap on point source discharges of some pollutants to a waterbody, it is clear TMDLs are now seen as a tool to address needed reductions in nonpoint sources of pollutants as well. The question is whether TMDLs are the appropriate tool to achieve those reduc-tions. Or, are nonpoint source TMDLs the equivalent of trying to shove a square peg into a round hole?
Consider the following:
• The Clean Water Act provides no enforcement mechanism to insure any nonpoint source load reductions will be achieved. Needed load reductions from point sources must be reflected in their permit limits, which are en-forceable. The Act does not, however, provide any similar enforcement au-thority over nonpoint sources. This is not a significant problem where point source discharges are the predominant cause of impairment but in waterbod-ies where nonpoint sources are the primary concern, TMDLs are, from a legal standpoint, toothless tigers and can only be used to guide voluntary actions.
• The 303(d) listing process creates a black-and-white (impaired v. non-impaired) situation when in fact water quality is varying shades of grey. Some “impaired” waters may actually have better overall water quality than those not listed but cleanup actions and funds are increasingly only focused on the waters on the impaired list.
• Nonpoint source loads are diffuse and highly variable and even the very best nonpoint source loading models used in TMDL development still have a high degree of uncertainty. Unlike most point source loads which can be modeled as near-steady-state loads, nonpoint loads vary considerably from
day to day, month to month, and even year to year. This presents a very signif-icant challenge in attempting to accu-rately model this spatial and temporal variability. Adding to the uncertainty is that the input and monitoring data needed to develop, calibrate and verify these models is often limited or not available and gross assumptions must be made.
• TMDLs work best with conservative pollutants. A conservative pollutant is one that is not materially affected by natural processes and whose concen-tration is only reduced by dilution. The loading, fate and transport of con-servative pollutants can be accurately modeled by mass balance equations, a fundamental concept of TMDLs. In reality, however, few pollutants are truly conservative. Unionized am-monia, for instance, is highly toxic to most aquatic life and most states have ammonia criteria for this reason. But ammonia is just one phase of the
nitrogen cycle that includes non-toxic and low-toxicity forms like organic nitrogen, nitrate and ammonium. A TMDL for an ammonia-impaired wa-terbody would likely have to consider all forms of nitrogen (total nitrogen) loading, not just ammonia loads, as well account for in-stream processing like organic uptake, mineralization, nitrification and denitrification to be accurate; a very, very difficult task.
• Many nonpoint source related impair-ments are for things like low dissolved oxygen levels, nutrient enrichment and poor biological integrity versus a spe-cific pollutant, making it much more difficult to determine what pollutant
or pollutants, if any, are responsible for the impair-ment.
• TMDLs are usually done on a piecemeal, patch-work basis. TMDLs ide-ally would be done on a comprehensive, basin-wide
basis, which may have been what Con-gress anticipated in passing 303(d). But in practice TMDLs are widely dispersed and involve watersheds varying from a few hundred acres to thousands of square miles. The result-ing patchwork of TMDLs makes it much more difficult to do basin-wide, comprehensive water quality planning as envisioned by 303(d).
TMDLs often bring to light a more fundamental and troubling issue: whether a state’s water quality standards are reasonable. One pundit compared a TMDL to an elaborate house built on a crumbling foundation, the crumbling foundation being flawed water quality standards. Many TMDLs have indi-cated that very significant reductions in nonpoint source loads of various pollut-ants would be needed to meet criteria, sometimes in excess of 90 percent. If the TMDLs are accurate, this raises concerns whether such criteria could ever be met under any land use scenario,
Are nonpoint source TMDLs the equivalent of trying to shove a square peg into a round hole?
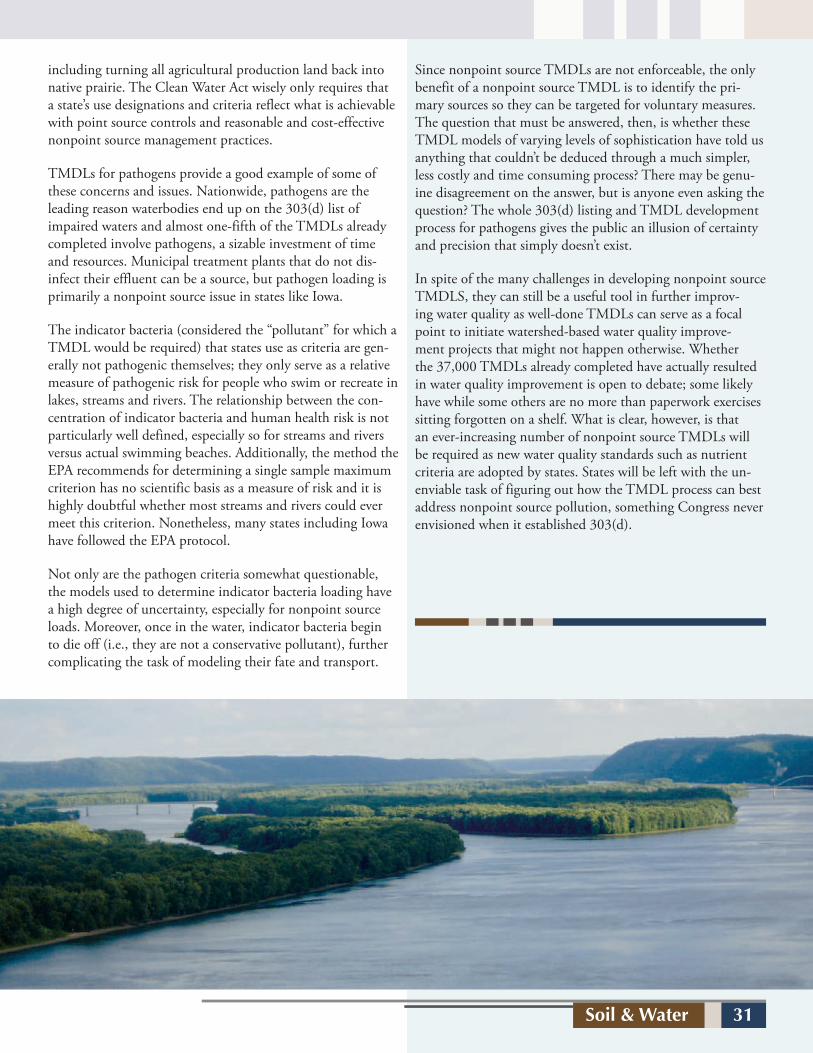
Soil & Water 31
including turning all agricultural production land back into native prairie. The Clean Water Act wisely only requires that a state’s use designations and criteria reflect what is achievable with point source controls and reasonable and cost-effective nonpoint source management practices.
TMDLs for pathogens provide a good example of some of these concerns and issues. Nationwide, pathogens are the leading reason waterbodies end up on the 303(d) list of impaired waters and almost one-fifth of the TMDLs already completed involve pathogens, a sizable investment of time and resources. Municipal treatment plants that do not dis-infect their effluent can be a source, but pathogen loading is primarily a nonpoint source issue in states like Iowa.
The indicator bacteria (considered the “pollutant” for which a TMDL would be required) that states use as criteria are gen-erally not pathogenic themselves; they only serve as a relative measure of pathogenic risk for people who swim or recreate in lakes, streams and rivers. The relationship between the con-centration of indicator bacteria and human health risk is not particularly well defined, especially so for streams and rivers versus actual swimming beaches. Additionally, the method the EPA recommends for determining a single sample maximum criterion has no scientific basis as a measure of risk and it is highly doubtful whether most streams and rivers could ever meet this criterion. Nonetheless, many states including Iowa have followed the EPA protocol.
Not only are the pathogen criteria somewhat questionable, the models used to determine indicator bacteria loading have a high degree of uncertainty, especially for nonpoint source loads. Moreover, once in the water, indicator bacteria begin to die off (i.e., they are not a conservative pollutant), further complicating the task of modeling their fate and transport.
Since nonpoint source TMDLs are not enforceable, the only benefit of a nonpoint source TMDL is to identify the pri-mary sources so they can be targeted for voluntary measures. The question that must be answered, then, is whether these TMDL models of varying levels of sophistication have told us anything that couldn’t be deduced through a much simpler, less costly and time consuming process? There may be genu-ine disagreement on the answer, but is anyone even asking the question? The whole 303(d) listing and TMDL development process for pathogens gives the public an illusion of certainty and precision that simply doesn’t exist.
In spite of the many challenges in developing nonpoint source TMDLS, they can still be a useful tool in further improv-ing water quality as well-done TMDLs can serve as a focal point to initiate watershed-based water quality improve-ment projects that might not happen otherwise. Whether the 37,000 TMDLs already completed have actually resulted in water quality improvement is open to debate; some likely have while some others are no more than paperwork exercises sitting forgotten on a shelf. What is clear, however, is that an ever-increasing number of nonpoint source TMDLs will be required as new water quality standards such as nutrient criteria are adopted by states. States will be left with the un-enviable task of figuring out how the TMDL process can best address nonpoint source pollution, something Congress never envisioned when it established 303(d).
Soil & Water 32
On behalf of the Iowa Chapter of the Soil and Water Conservation Society I would like to congratulate the ISU Soil and Water Conservation Club on this great publication “Getting into Soil and Water.” This is becoming a must read for everyone interested in our natural resources.
If you want to learn more about soil and water conservation or wish to become more involved in protecting our resources, please visit our web site at: www.iaswcs.org and become a member today.
Kevin McCallIowa SWCS President
Iowa Chapter
To foster the science and the art of soil, water, and related natural resource management to achieve sustainability.
Extension educates.
From curiosity to positive life change.
www.extension.iastate.edu
photo courtesy Jerry DeWitt

Soil & Water 33
A t l a n t i c
I n d i a n
O c e a n
O c e a n
A r c t i c O c e a nA r c t i c O c e a n
P a c i f i c
O c e a n
R U S S I A
R U S S I A
FINLAND
AUSTRIA
ITALY
SPAIN
SWEDEN
NORWAY
GERMANY
FRANCE
PORTUGAL
HUNGARY
ROMANIA
BULGARIA
TURKEY
DENMARK
POLAND
BELARUS
UKRAINECZECH
SLOVAKIA
GREECE
CYPRUSNORTH CYPRUS
NETH.
BELGIUM
IRELAND
YUGOSLAVIA
ALBANIA
MOLDOVA
LITHUANIA
LATVIA
ESTONIA
LUX.
BOSNIAAND
HERZ.
CROATIASLOVENIA
SWITZ.
MACEDONIA
GREENLAND
ICELAND
U. S. A.
CANADA
MEXICO THE BAHAMAS
CUBA
PANAMA
EL SALVADORGUATEMALA
BELIZEHONDURAS
NICARAGUA
COSTA RICA
JAMAICAHAITI
DOM. REP.
ARGENTINA
BOLIVIA
COLOMBIA
VENEZUELA
PERU
BRAZIL
FRENCH GUIANASURINAME
GUYANA
CHILE
ECUADOR
PARAGUAY
URUGUAY
FALKLAND ISLANDS
SOUTH GEORGIA ISLAND
KENYA
ETHIOPIA
ERITREA
SUDAN
EGYPT
NIGER
MAURITANIA
MALI
NIGERIA
SOMALIA
NAMIBIA
LIBYA
CHAD
SOUTH AFRICA
TANZANIA
Dem. Rep.of Congo
ANGOLA
ANGOLA
ALGERIA
MADAGASCAR
MOZAMBIQUE
BOTSWANA
ZAMBIA
GABON
CENTRAL AFRICANREPUBLIC
TUNISIA
MOROCCO
UGANDA
SWAZILAND
LESOTHO
MALAWI
BURUNDI
RWANDA
TOGO
BENINGHANA
COTED'IVOIRE
LIBERIA
SIERRA LEONE
GUINEABURKINA FASO
GAMBIA
CAMEROON
SAO TOME & PRINCIPE
ZIMBABWE
CONGO
EQUATORIAL GUINEA
WESTERNSAHARA
(occupied by Morocco)
DJIBOUTI
SENEGAL
GUINEA BISSAU
CanaryIslands
Azores
Cape Verde
JORDAN
ISRAEL
LEBANON
ARMENIAAZERBAIJAN
GEORGIA KYRGYZSTAN
TAJIKISTAN
KUWAIT
QATAR
U. A. E.
YEMEN
SYRIA
IRAQIRAN
OMAN
SAUDI ARABIA
AFGHANISTAN
PAKISTAN
INDIA
CHINA
KAZAKHSTAN
TURKMENISTAN
UZBEKISTAN
CHINA
MYANMAR
THAILAND
CAMBODIA
NEPALBHUTAN
VIETNAM
SRI LANKA
LAOS
BANGLADESH
PAPUANEW GUINEA
BRUNEI
SINGAPORE
PHILIPPINES
TAIWAN
MALAYSIA
I N D O N E S I A
JAPAN
MONGOLIA
SOUTH KOREA
NORTH KOREA
AUSTRALIA
NEW ZEALAND
U. K.
NEW CALEDONIA
FIJI
PALAU
VANUATU
SOLOMONISLANDS
GUAMMARSHALLISLANDS
MICRONESIA
TONGA
SAMOAISLANDS
FRENCHPOLYNESIA
KIRIBATI
EAST TIMOR
P a c i f i cP a c i f i c
AUSTRIA
ITALY
SPAIN
NORWAY
GERMANY
FRANCEFRANCEHUNGARYHUNGARYHUNGARY
DENMARK
POLANDPOLAND
CZECHCZECHSLOVAKIASLOVAKIA
NETH.
BELGIUMBELGIUM
YUGOSLAVIAYUGOSLAVIA
ALBANIAALBANIAALBANIA
LUX.LUX.
BOSNIABOSNIABOSNIAAND
HERZ.
CROATIACROATIACROATIACROATIASLOVENIASLOVENIA
SWITZ.SWITZ.
MACEDONIAMACEDONIAMACEDONIA
FALKLAND ISLANDSFALKLAND ISLANDS
SOUTH GEORGIA ISLANDSOUTH GEORGIA ISLAND
NIGERMALI
NIGERIA
NAMIBIANAMIBIA
LIBYA
CHADCHAD
SOUTH AFRICASOUTH AFRICA
Dem. Rep.Dem. Rep.of Congoof Congo
ANGOLAANGOLAANGOLA
ANGOLA
ALGERIA
GABON
CENTRAL AFRICANCENTRAL AFRICANREPUBLICREPUBLIC
TUNISIATUNISIATUNISIA
MOROCCO
TOGOTOGOTOGO
BENINGHANA
BURKINA FASO
CAMEROON
SAO TOME & PRINCIPESAO TOME & PRINCIPESAO TOME & PRINCIPESAO TOME & PRINCIPESAO TOME & PRINCIPE CONGO
EQUATORIAL GUINEAEQUATORIAL GUINEA
NEW ZEALANDNEW ZEALAND
U. K.
NEW CALEDONIANEW CALEDONIA
FIJIFIJIVANUATUVANUATU
SOLOMONSOLOMONISLANDS
MARSHALLISLANDS
MICRONESIA
SWEDENSWEDEN
P a c i f i c
FIJI
TONGA
SAMOAISLANDS
A t l a n t i cA t l a n t i c
O c e a nO c e a n
SPAINSPAINPORTUGALPORTUGAL
IRELANDIRELAND
THE BAHAMAS
CUBA
PANAMA
BELIZEHONDURAS
NICARAGUA
COSTA RICA
JAMAICAHAITI
DOM. REP.
ARGENTINA
BOLIVIABOLIVIA
COLOMBIACOLOMBIACOLOMBIA
VENEZUELAVENEZUELAVENEZUELAVENEZUELAVENEZUELA
PERUPERU
BRAZILBRAZIL
FRENCH GUIANAFRENCH GUIANASURINAME
GUYANA
CHILE
ECUADOR
PARAGUAYPARAGUAY
URUGUAYURUGUAY
MAURITANIA
MOROCCO
COTED'IVOIRE
LIBERIA
SIERRA LEONESIERRA LEONE
GUINEAGUINEAGUINEABURKINA FASO
GAMBIA
SAO TOME & PRINCIPESAO TOME & PRINCIPE
WESTERNSAHARA
(occupied by Morocco)
SENEGAL
GUINEA BISSAU
CanaryCanaryIslands
AzoresAzores
Cape VerdeCape Verde
GREENLAND
ICELAND
CANADA
EL SALVADOREL SALVADOR
BELIZE
COSTA RICACOSTA RICA
ECUADOR
P a c i f i c
O c e a nO c e a n
U. S. A.
MEXICO
GUATEMALA
SAMOAISLANDS
FRENCHPOLYNESIAPOLYNESIA
KIRIBATI
CANADA
EL SALVADORGUATEMALA
Sustainable agriculture systematically addresses many environmental and social concerns of the entire food system. Sustainable agriculture integrates three main goals: environmental stewardship, farm profitability, and prosperous farming communities.
Agronomists manage our plant and soil resources as a sustainable system through all of the interactions that support crop growth including the impacts on the environment and society. Agronomists integrate concepts of soil science, plant science, climatology, and social science.
Developerof sustainablesystems
www.ImAnAgronomist.net
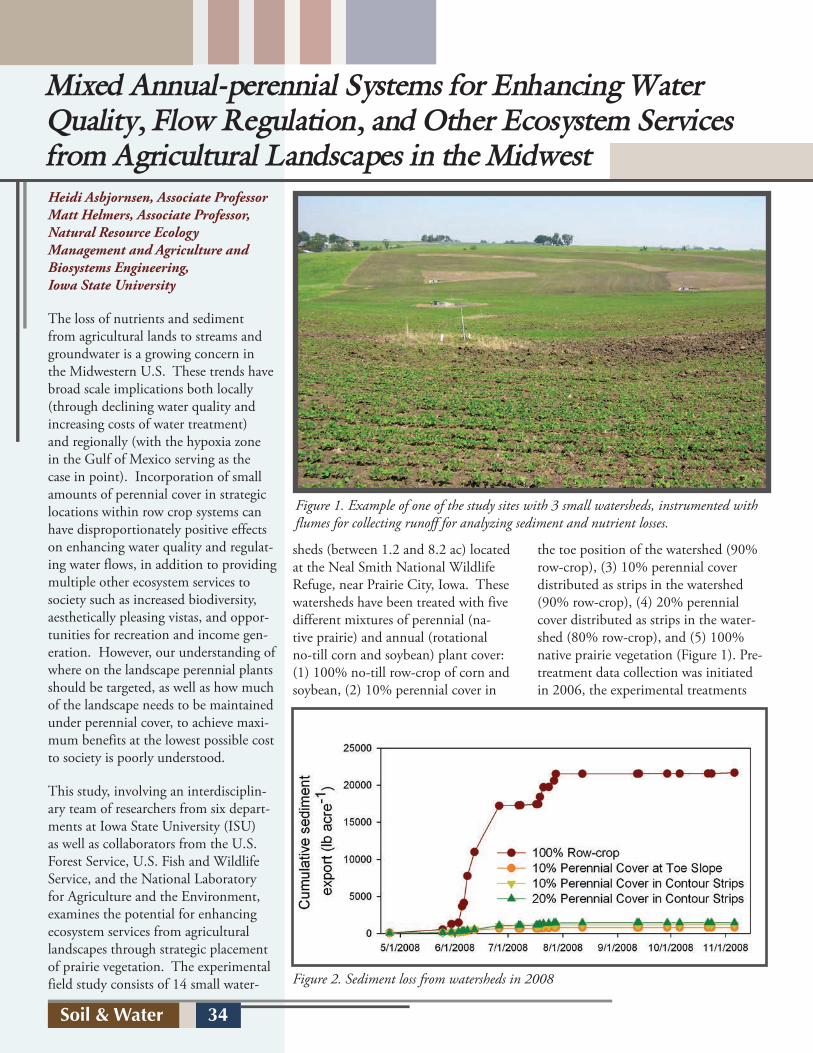
Soil & Water 34
Mixed Annual-perennial Systems for Enhancing Water Quality, Flow Regulation, and Other Ecosystem Services from Agricultural Landscapes in the MidwestHeidi Asbjornsen, Associate ProfessorMatt Helmers, Associate Professor, Natural Resource Ecology Management and Agriculture and Biosystems Engineering,Iowa State University
The loss of nutrients and sediment from agricultural lands to streams and groundwater is a growing concern in the Midwestern U.S. These trends have broad scale implications both locally (through declining water quality and increasing costs of water treatment) and regionally (with the hypoxia zone in the Gulf of Mexico serving as the case in point). Incorporation of small amounts of perennial cover in strategic locations within row crop systems can have disproportionately positive effects on enhancing water quality and regulat-ing water flows, in addition to providing multiple other ecosystem services to society such as increased biodiversity, aesthetically pleasing vistas, and oppor-tunities for recreation and income gen-eration. However, our understanding of where on the landscape perennial plants should be targeted, as well as how much of the landscape needs to be maintained under perennial cover, to achieve maxi-mum benefits at the lowest possible cost to society is poorly understood.
This study, involving an interdisciplin-ary team of researchers from six depart-ments at Iowa State University (ISU) as well as collaborators from the U.S. Forest Service, U.S. Fish and Wildlife Service, and the National Laboratory for Agriculture and the Environment, examines the potential for enhancing ecosystem services from agricultural landscapes through strategic placement of prairie vegetation. The experimental field study consists of 14 small water-
sheds (between 1.2 and 8.2 ac) located at the Neal Smith National Wildlife Refuge, near Prairie City, Iowa. These watersheds have been treated with five different mixtures of perennial (na-tive prairie) and annual (rotational no-till corn and soybean) plant cover: (1) 100% no-till row-crop of corn and soybean, (2) 10% perennial cover in
the toe position of the watershed (90% row-crop), (3) 10% perennial cover distributed as strips in the watershed (90% row-crop), (4) 20% perennial cover distributed as strips in the water-shed (80% row-crop), and (5) 100% native prairie vegetation (Figure 1). Pre-treatment data collection was initiated in 2006, the experimental treatments
Figure 1. Example of one of the study sites with 3 small watersheds, instrumented with flumes for collecting runoff for analyzing sediment and nutrient losses.
Figure 2. Sediment loss from watersheds in 2008

Soil & Water 35
needed to motivate farmers to adopt dif-ferent practices, as well as to what extent society is willing to pay for such changes on the landscape in return for enhanced ecosystem services. Finally, increasing the perennial cover within agricultural landscapes can also provide other eco-system services associated with biodi-versity, such as pest regulation (e.g., by providing habitat for natural predators of the soybean aphid) and bird diversity (potentially important for recreation, ecotourism, and pollination).
We anticipate that future research and monitoring as part of this study over the next 5-10 years will enable us to answer some of these important questions regarding how strategic incorporation of perennial plants into row crop systems can enhance economic, social, and envi-ronmental sustainability of agricultural landscapes in the Midwestern U.S.
were implemented in 2006-7 and three years of post-treatment data have been collected (2007, 2008, 2009).
The results thus far suggest that a rela-tively small amount of perennial cover (10% of the watershed) can achieve dramatic reductions in the loss of sedi-ment and nutrients from the system. For example, in 2008, a year of abnor-mally high rainfall, sediment loss from watersheds supporting 100% row-crop corn was 25 times greater than sediment loss from watersheds supporting 10% of perennial cover in the toe position (Fig-ure 2). These results are most vividly conveyed by visual documentation of the differences in the amount of sedi-ment collected in the flumes located at the bottom of the experimental water-sheds supporting the different treat-ments (Figure 3). Similar patterns were recorded for the loss of total nitrogen and total phosphorus, with the highest losses occurring for the 100% row-crop
treatments, and the lowest losses from the watersheds supporting perennial cover, particularly in the toe position.
The findings from this research thus far suggest that converting relatively small amounts of the landscape (10%) into perennial vegetation can have profound effects on enhancing water quality and hydrologic regulation. However, more long-term data are needed to deter-mine how the movement of sediment, nutrients, carbon, and water through the landscape change in response to different climatic conditions (e.g. 2008 was an extremely wet year), as well as to the development of the prairie plantings over time (currently the plantings are very young and support relatively low species diversity, but with time, the level of species diversity and carbon seques-tration by plants and soils are expected to increase).
Additionally, we need to understand the economic and policy frameworks
Figure 3. Sediment in flumes after 4 inch rain in 2008: (a) watershed with 100% cropland, (b) watershed with 10% perennial vegetation and 90% cropland, and (c) watershed with 100% perennial plants.
(a) (b) (c)

Soil & Water 36
Brad Bond, Master’s StudentRobert Burns, ProfessorLara Moody, Program Manager, Agricultural and Biosystems Engineering Department, Iowa State University
The United States Environmental Protection Agency (USEPA) identified pollution from agricultural land as one of the leading sources of impaired waters of the United States (USEPA, 2000). An impaired water source is considered any body of water not meeting its designated use such as swimming, drinking water supply, or the ability to sustain aquatic life.
Agricultural pollution is a very broad term used to describe many of the environmental impacts in modern farming practices. Common agricultural pollutants are nitrogen and phosphorus, both commonly found in animal waste (ma-nure). Animal manure from feedlots is typically deposited by the animals on the feedlot surface. Manure typically remains on the feedlot until it is mechanically collected and stored in a storage structure until land application. However, rainfall run-off from a feedlot source becomes a potential pollutant when it contacts manure and transports nutrients to local water sources. The main components of manure that impact surface waters are organic matter, nutrients (such as: nitrogen, phos-phorus, ammonia, etc.), and fecal bacteria (USDA, 1992). Each of these components may cause water degradation or impairment depending on the concentration and volume present in a water body.
How do nutrients and organic matter affect water quality?
Organic matter is defined as any material capable of decay-ing into a simpler form. The organic matter located in animal manure consists of undigested feed material the animals did not utilize and convert into energy. When organic matter enters a water source, aerobic micro-organisms begin to con-sume this matter as an energy source. While doing so, these aerobic micro-organisms consume dissolved oxygen within the water and release carbon dioxide. This in turn reduces oxygen in the water that is available to fish and other aquatic life.
Nutrients, such as nitrogen and phosphorus, can enter a water body and create a food source for algae and other aquatic plants to grow. When the plants die, micro-organisms begin
to consume the organic matter (plants), thus following the same process described for organic matter. Some nutrients, such as un-ionized ammonia (NH3), can be toxic to fish and other aquatic life (USDA, 1992).
Water quality is affected by both of these processes by reduc-ing the amount of oxygen available to aquatic animals living within the water source. Degradation of fishing and other recreational activities may result from an increase in nutrients or organic matter.
What options are currently available to control feedlot runoff?
Containment and discharge systems are two basic categories of runoff control systems used for open feedlots. Contain-ment systems collect and hold all of the runoff leaving a feedlot while a discharge system releases runoff typically after performing some sort of treatment (Murphy and Harner, 2001). Depending on federal regulations, certain feedlots may be required to implement a containment system while others can use a discharge system. The type of control system imple-mented is based on the feedlot size and location to nearby water sources.
Current manure management systems for beef feedlot facili-ties consist of a containment basin designed to collect feedlot runoff (effluent) into an earthen or lined storage structure (figure 1). During a rainfall event, effluent travels down the feedlot gradient and collects in the solid settling basin where solids are allowed to settle out of suspension. After adequate time has passed for solid settling, the effluent is released into a detention basin to be stored until field conditions exist for the
Figure 1. Open feedlot with a containment basin system (Lawrence et al., 2006)
Water Quality and Runoff Control Issues with Open Feedlots
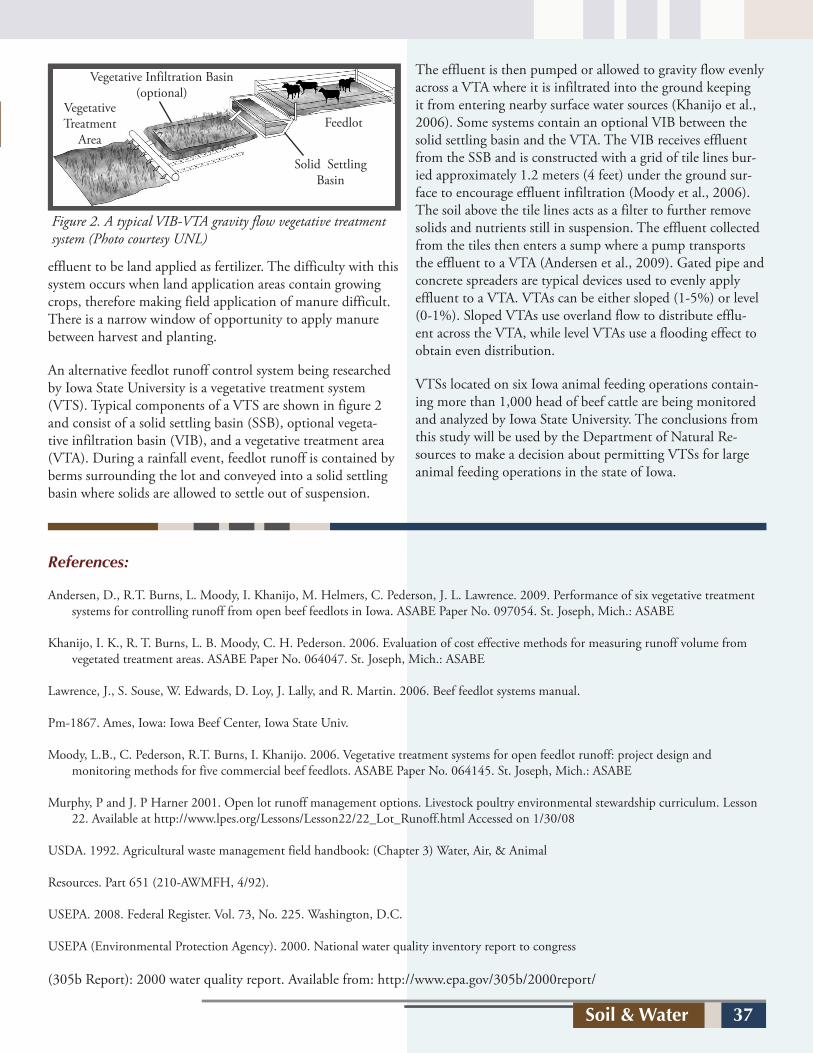
Soil & Water 37
effluent to be land applied as fertilizer. The difficulty with this system occurs when land application areas contain growing crops, therefore making field application of manure difficult. There is a narrow window of opportunity to apply manure between harvest and planting.
An alternative feedlot runoff control system being researched by Iowa State University is a vegetative treatment system (VTS). Typical components of a VTS are shown in figure 2 and consist of a solid settling basin (SSB), optional vegeta-tive infiltration basin (VIB), and a vegetative treatment area (VTA). During a rainfall event, feedlot runoff is contained by berms surrounding the lot and conveyed into a solid settling basin where solids are allowed to settle out of suspension.
The effluent is then pumped or allowed to gravity flow evenly across a VTA where it is infiltrated into the ground keeping it from entering nearby surface water sources (Khanijo et al., 2006). Some systems contain an optional VIB between the solid settling basin and the VTA. The VIB receives effluent from the SSB and is constructed with a grid of tile lines bur-ied approximately 1.2 meters (4 feet) under the ground sur-face to encourage effluent infiltration (Moody et al., 2006). The soil above the tile lines acts as a filter to further remove solids and nutrients still in suspension. The effluent collected from the tiles then enters a sump where a pump transports the effluent to a VTA (Andersen et al., 2009). Gated pipe and concrete spreaders are typical devices used to evenly apply effluent to a VTA. VTAs can be either sloped (1-5%) or level (0-1%). Sloped VTAs use overland flow to distribute efflu-ent across the VTA, while level VTAs use a flooding effect to obtain even distribution.
VTSs located on six Iowa animal feeding operations contain-ing more than 1,000 head of beef cattle are being monitored and analyzed by Iowa State University. The conclusions from this study will be used by the Department of Natural Re-sources to make a decision about permitting VTSs for large animal feeding operations in the state of Iowa.
References:
Andersen, D., R.T. Burns, L. Moody, I. Khanijo, M. Helmers, C. Pederson, J. L. Lawrence. 2009. Performance of six vegetative treatment systems for controlling runoff from open beef feedlots in Iowa. ASABE Paper No. 097054. St. Joseph, Mich.: ASABE
Khanijo, I. K., R. T. Burns, L. B. Moody, C. H. Pederson. 2006. Evaluation of cost effective methods for measuring runoff volume from vegetated treatment areas. ASABE Paper No. 064047. St. Joseph, Mich.: ASABE
Lawrence, J., S. Souse, W. Edwards, D. Loy, J. Lally, and R. Martin. 2006. Beef feedlot systems manual.
Pm-1867. Ames, Iowa: Iowa Beef Center, Iowa State Univ.
Moody, L.B., C. Pederson, R.T. Burns, I. Khanijo. 2006. Vegetative treatment systems for open feedlot runoff: project design and monitoring methods for five commercial beef feedlots. ASABE Paper No. 064145. St. Joseph, Mich.: ASABE
Murphy, P and J. P Harner 2001. Open lot runoff management options. Livestock poultry environmental stewardship curriculum. Lesson 22. Available at http://www.lpes.org/Lessons/Lesson22/22_Lot_Runoff.html Accessed on 1/30/08
USDA. 1992. Agricultural waste management field handbook: (Chapter 3) Water, Air, & Animal
Resources. Part 651 (210-AWMFH, 4/92).
USEPA. 2008. Federal Register. Vol. 73, No. 225. Washington, D.C.
USEPA (Environmental Protection Agency). 2000. National water quality inventory report to congress
(305b Report): 2000 water quality report. Available from: http://www.epa.gov/305b/2000report/
Figure 2. A typical VIB-VTA gravity flow vegetative treatment system (Photo courtesy UNL)
Vegetative Treatment
Area
Solid Settling Basin
Feedlot
Vegetative Infiltration Basin (optional)
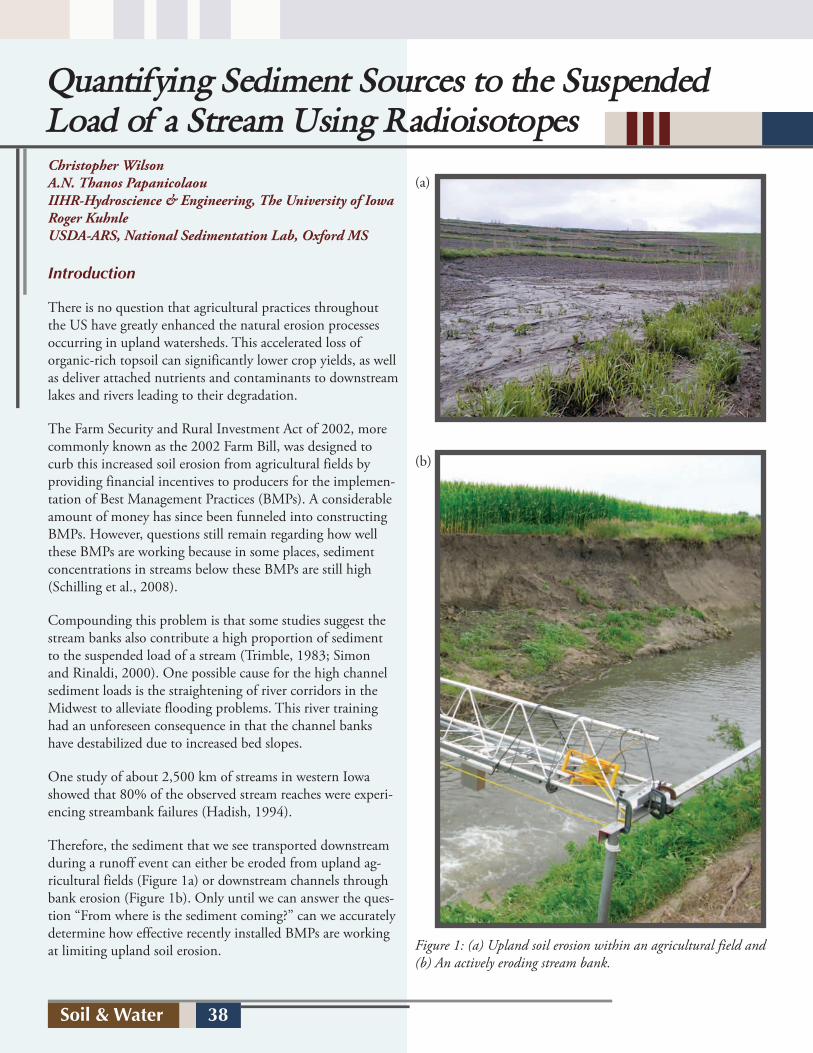
Soil & Water 38
Christopher WilsonA.N. Thanos PapanicolaouIIHR-Hydroscience & Engineering, The University of IowaRoger KuhnleUSDA-ARS, National Sedimentation Lab, Oxford MS
Introduction
There is no question that agricultural practices throughout the US have greatly enhanced the natural erosion processes occurring in upland watersheds. This accelerated loss of organic-rich topsoil can significantly lower crop yields, as well as deliver attached nutrients and contaminants to downstream lakes and rivers leading to their degradation.
The Farm Security and Rural Investment Act of 2002, more commonly known as the 2002 Farm Bill, was designed to curb this increased soil erosion from agricultural fields by providing financial incentives to producers for the implemen-tation of Best Management Practices (BMPs). A considerable amount of money has since been funneled into constructing BMPs. However, questions still remain regarding how well these BMPs are working because in some places, sediment concentrations in streams below these BMPs are still high (Schilling et al., 2008).
Compounding this problem is that some studies suggest the stream banks also contribute a high proportion of sediment to the suspended load of a stream (Trimble, 1983; Simon and Rinaldi, 2000). One possible cause for the high channel sediment loads is the straightening of river corridors in the Midwest to alleviate flooding problems. This river training had an unforeseen consequence in that the channel banks have destabilized due to increased bed slopes.
One study of about 2,500 km of streams in western Iowa showed that 80% of the observed stream reaches were experi-encing streambank failures (Hadish, 1994).
Therefore, the sediment that we see transported downstream during a runoff event can either be eroded from upland ag-ricultural fields (Figure 1a) or downstream channels through bank erosion (Figure 1b). Only until we can answer the ques-tion “From where is the sediment coming?” can we accurately determine how effective recently installed BMPs are working at limiting upland soil erosion.
Quantifying Sediment Sources to the Suspended Load of a Stream Using Radioisotopes
Figure 1: (a) Upland soil erosion within an agricultural field and (b) An actively eroding stream bank.
(a)
(b)

Soil & Water 39
Study Objective
Researchers at the University of Iowa, in conjunction with scientists from the Agricultural Research Service of the US Department of Agriculture have been utilizing an innovative technique designed to quantify the amounts of eroded upland soil and channel-derived sediment in the sediment load of small agricultural streams throughout the US during runoff events using two naturally occurring radioisotopes, beryllium (7Be) and lead (210Pb).
The sediment from both the uplands and the channel must have unique signatures relative to one another in order to quantify their respective contributions to the stream sediment load, which in this case are the activities of 7Be and 210Pb. The suspended sediment in a stream contains a mixture of the eroded upland soils and collapsed bank sediment. The resulting signature of the suspended sediment will reflect the mixture of these two surface areas. A simple two-end member mixing model can determine the relative contribution of each source area to the total fine sediment load.
Theory
The two radioisotopes, 7Be and 210Pb, are delivered to the landscape mainly during rain storms. They quickly and strongly bond to surface soils. Thus, surface soils have rela-tively high amounts of 7Be and 210Pb compared to the entire soil column. The surface soils with attached 7Be and 210Pb are eroded from the landscape as runoff begins and transported through streams. Erosion processes in the uplands, like sheet and rill erosion, remove only thin layers of surface soils, so this eroded soil still has relatively high activities of 7Be and 210Pb (Figure 2).
As the eroded soil is carried downstream, sediment from col-lapsed stream banks is mixed into the flow. This bank sedi-ment will have much lower amounts of 7Be and 210Pb because they receive little amounts from the rain (and thus the radio-isotopes) due to near-vertical slopes (Figure 2).
In addition, stream bank collapse typically removes large volumes of material. The higher amounts of the 7Be and 210Pb at the top of the collapsed bank are diluted by much larger volumes of lower-activity sediment from deeper in the chan-nel bank.
Suspended sediment is a mixture of surface soils and bank sediment and has an intermediate signature relative to these two sources (Figure 2). Relatively higher amounts of the radioisotopes suggest a large proportion of recently eroded surface soils. Lower amounts in the suspended sediment sug-gest significant dilution by bank material.
Results
This innovative sediment sourcing method has been utilized in different sized watersheds throughout the US (Table 1) for various magnitude rain events to test its widespread applica-bility. Despite differences in the multiple study areas, certain common findings were identified, demonstrating the robust-ness of the technique.
In order to use this technique (Wilson et al., 2008), 7Be and 210Pb were measured in upland soils from agricultural fields, channel bank sediments, and suspended sediments collected during a runoff event. Sampling included high-resolution soil profiles from agricultural fields and deeper cores from stream banks (Figure 3a). Suspended sediment samples were collect-ed at regular intervals during the storm event from a bridge over the stream (Figure 3b). Sampling during the storm event also included collection of the rain that fell to determine the radioactive tag applied to the different sediments. Gamma spectroscopy was used to determine the activities of 7Be and 210Pb in all samples.
The activities of the two radioisotopes were then plotted relative to one another on a graph (Figure 4a). The average
Figure 2: Schematic displaying relative contributions of eroded upland soils and channel sediments to the stream load.

Soil & Water 40
values of 7Be and 210Pb in the eroded upland soils plotted significantly higher than corresponding values from the bank sediments, which gave us our two-end members. The 7Be and 210Pb values of the suspended sediment fell along a mixing line, represented by the solid black line, between the average signatures of the upland soils and the bank material. The po-sitions where the suspended sediment fall on the mixing line determined the relative contributions from the upland and the channel to the stream sediment load at that time, which were translated into the pie charts in Figure 4b.
In almost all cases, the stream sediment at the beginning of the storm event contained a high proportion of the eroded surface soils, which was the first flush of upland material. The proportion of bank sediment quickly increased as water levels in the stream rose saturating more of the stream banks and flows increased eroding the bank and bed sediment. As the runoff from the uplands ceased and the flow resided, bank collapse began resulting in higher relative proportions of channel sediment.
Figure 3: (a) High-resolution sampling of soil pit in an upland field. (b) Collection of a suspended sediment sample from a bridge.
(a) (b)
Figure 4: (a) Two end-member mixing model used to determine the relative contributions of eroded upland soils and channel sediment during a runoff event. (b) The resulting pie chart depicting these relative loads.
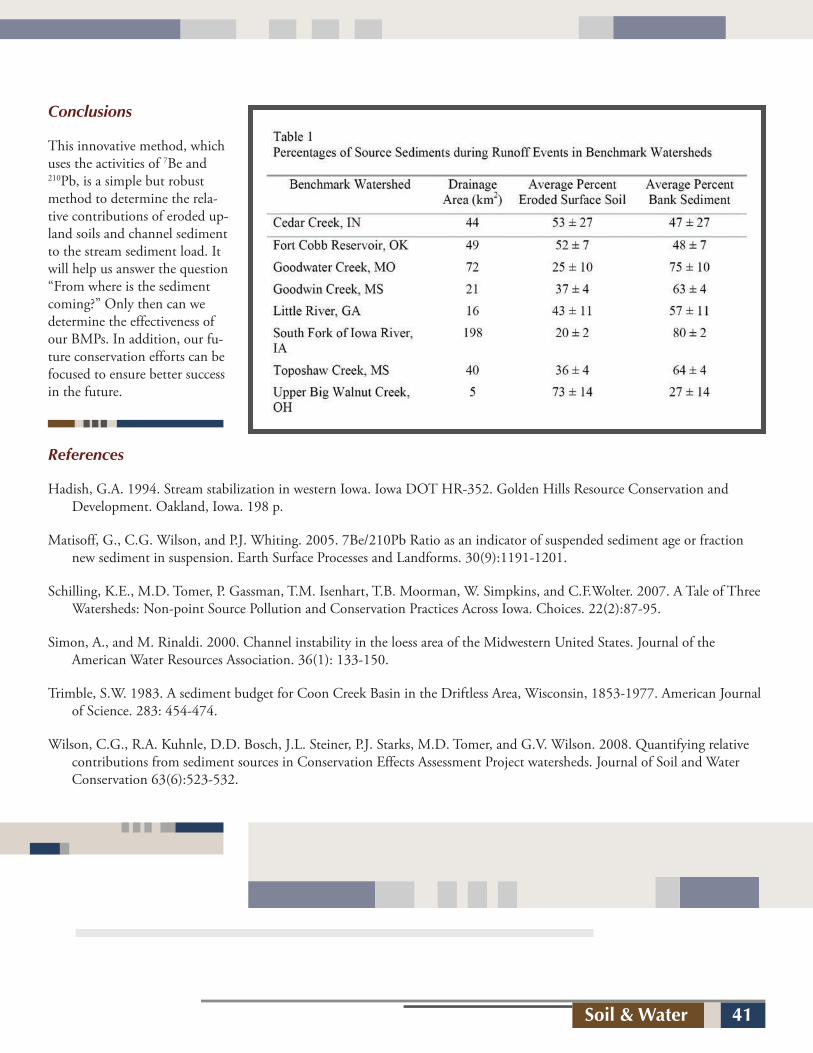
Soil & Water 41
Conclusions
This innovative method, which uses the activities of 7Be and 210Pb, is a simple but robust method to determine the rela-tive contributions of eroded up-land soils and channel sediment to the stream sediment load. It will help us answer the question “From where is the sediment coming?” Only then can we determine the effectiveness of our BMPs. In addition, our fu-ture conservation efforts can be focused to ensure better success in the future.
References
Hadish, G.A. 1994. Stream stabilization in western Iowa. Iowa DOT HR-352. Golden Hills Resource Conservation and Development. Oakland, Iowa. 198 p.
Matisoff, G., C.G. Wilson, and P.J. Whiting. 2005. 7Be/210Pb Ratio as an indicator of suspended sediment age or fraction new sediment in suspension. Earth Surface Processes and Landforms. 30(9):1191-1201.
Schilling, K.E., M.D. Tomer, P. Gassman, T.M. Isenhart, T.B. Moorman, W. Simpkins, and C.F.Wolter. 2007. A Tale of Three Watersheds: Non-point Source Pollution and Conservation Practices Across Iowa. Choices. 22(2):87-95.
Simon, A., and M. Rinaldi. 2000. Channel instability in the loess area of the Midwestern United States. Journal of the American Water Resources Association. 36(1): 133-150.
Trimble, S.W. 1983. A sediment budget for Coon Creek Basin in the Driftless Area, Wisconsin, 1853-1977. American Journal of Science. 283: 454-474.
Wilson, C.G., R.A. Kuhnle, D.D. Bosch, J.L. Steiner, P.J. Starks, M.D. Tomer, and G.V. Wilson. 2008. Quantifying relative contributions from sediment sources in Conservation Effects Assessment Project watersheds. Journal of Soil and Water Conservation 63(6):523-532.

Soil & Water 42
Zsolt Gemesi, International project manager, Regional Develepment Holding Co Ltd., Budapest, Hungary Andras Molnar, Deputy Head of Department, Research Institute of Agriculture Economics, Budapest, Hungary
Successful models of sustainable modern societ-ies are hinged on three key factors: access to and the uninterrupted supply of safe food, clean water and low carbon energy. These are outputs of complex systems involved with a large number of factors. One of the most critical and common links are soil and climate. There are no substi-tutes for either of these inputs. On one hand, agriculture requires productive soils and predict-able climatic conditions. On the other, growing demand for food, feed, fiber and energy from biomass creates incentives for farmers to use their resources in a way to reach their goals, of which profit tends to stand as most important. Such practices may reduce soil fertility and increase water pollution as the amount of crop residue remaining in the fields drop below sustainable levels. Production of outputs or services having little monetary value (either by market or by policy in a form of subsidy) from the agriculture system is less predict-able and less controlled. The market – as the most common framework of organizing the use of scarce resources – is itself a framework, with well known deficiencies called market fail-ures. This calls for intervention in a form of different policy measures, but this might go wrong as well! However, as is the usual case, having imperfect policy in place is worse than hav-ing no policy at all.
The contribution of crop production to greenhouse gas (GHG) emissions is well documented1. The role of livestock in global warming may be much greater than previously thought2. At the same time, the climatic implications i.e. carbon-neutrality of green energy are well demonstrated in numerous studies and life cycle assessments. Given that policy is shifting focus to deriving energy from biorenewables, and as this may create competition for land, there is growing concern about the potential impacts on natural resources. For sustain-ability, these need to be assessed and suitable actions and measures need to be implemented that alleviate the harmful environmental and undesired socio-economic impacts. This paper gives a short overview of soil and water conservation related issues in the European Union (EU) and Hungary that
relate to renewable energy from biomass, and present a miti-gation measure that is currently being examined.
While food security (availability, access, utilization) and access to clean water is not a major problem yet in Europe, it will play an important role in future policy3. Energy is and will re-main a crucial issue. More than 60 percent4 of utilized energy in the European Union (EU) is imported. Various measures are being implemented to decrease the dependency on energy imports. Among these, considerable efforts and resources are dedicated to increase the share of renewable energy, includ-ing energy from agricultural and forestry sources to replace fossil counterparts. Biomass already plays a major role in the existing renewable energy mix. According to the European Commission, renewable energy accounted for 9.1 percent of energy consumed in 2007. Seventy percent of this was from biomass. The targets for the EU5 demand rapid growth in this sector bringing with it increased concerns about soil and water conservation issues. According to a study by the European Environmental Agency6 the bioenergy potential is still largely unexploited and this sector is expected to have the highest growth rates in coming years. If the climate and renewable energy targets are to be met, by 2020 at least 16-17 percent of the EU’s energy needs will be covered by agriculture, including dedicated crops, residues and wastes. If sustainability issues are not addressed, this may not only create unnecessary stress on soil and water resources, but may also reduce the beneficial impact of renewable energy use on climate change.
Natural Resource Conservation Measures in Connection With Low-Carbon Energy Production: Some Challenges and Opportunities Facing the European Union
Soil & Water 43
Thus it will be increasingly important to identify biomass conversion pathways that have comparatively greater environ-mental co-benefits, such as thermochemical conversion. One such process is pyrolysis, which produces bio-oils, combusti-ble gases and biochar from biomass that is rapidly combusted in the absence of oxygen. The oil and gas fraction can be used for power generation or as transport fuel, while the remain-ing biochar is a valuable material that can be applied to soils. Biochar, or pyrolytic char, has unique properties that render it an ideal candidate for biosequestration of atmospheric carbon in soils, and for soil improvement.
The principal argument supporting the application of char-coal as a carbon sink is that of the major carbon sinks shown in Figure 1 (sediments, oceans, fossil deposits, atmosphere, soils ) soil and terrestrial vegetation are those that humans are able to impact in a significant way. By adding charcoal to soils, carbon can be stored with residence time > 100 years7. Modest additions of biochar to soil were found to reduce nitrous oxide (N2O) emissions by up to 80% and completely suppress methane emissions8. The co-benefits to soil fertility are also significant. Numerous studies examined the co-ben-efits of charcoal, including yield effect9, increased availability of nutrients10, and water retention11. As a result less fertilizer is needed, and charcoal also prevents the leaching of nutrients into drains or subsurface water.
In Hungary, the region of sandy dunes between the Danube and Tisza Rivers (Fig.1.) offers the most promising opportuni-ties. This dustbowl area is traditionally known for difficulties with fruit and vegetable production in the past decades. The region could undergo a revival if a complex program includ-ing soil organic matter enrichment via the use of charcoal and irrigation systems, augmented with drainage and canalization are implemented. Supporting policy measures would result in a win-win situation, where sustainable agriculture can flour-ish.
In summary, applying charcoal to agricultural soils is hy-pothesized to have several positive impacts11. It increases the sorption of nutrients, reduces leaching, and improves physical properties through lowering bulk density in clayey soils, while improving water and nutrient retention in sandy soils. The aggregate effect is higher crop yield. The pyrolytic process generates carbon negative energy which can replace petroleum based transportation fuels and also decreases the level of CO2 in the atmosphere by sequestering C in soils. This, if applied in regions afflicted with degraded soils, may add economical and social benefits
Such actions require the concerted efforts of scientists, stake-holders and policy makers on an EU level. A welcome step in this direction is the International Biochar Initiative, which needs additional policy support and stakeholder involvement in European member states.
References:1. Adler, R.P., Del Grosso, S.J., Parton, W.J., 2007. Life-
cycle assessment of net greenhouse gas flux for bioenergy cropping systems. Ecol Apps. (3) 675-691.
2. Goodland, R., Anhang, J., 2009. Livestock and climate change, World Watch Institute. http://www.worldwatch.org/node/6294 (accessed November 25 2009)
3. Mariann Fischer Boel Member of the European Commission Responsible for Agriculture and Rural Development The future of the CAP after 2013 Workshop on “The Future of the Common Agriculture Policy after 2013” at the Committee on Agriculture and Rural Development (EP) Brussels, 10 November 2009 http://europa.eu/rapid/pressReleasesAction.do?reference=SPEECH/09/522&format=HTML&aged=0&language=EN&guiLanguage=en (Accessed November 25 2009)
4. BP Statistical World Review, 2009.5. Directive 2009/28/EC of European Parliament and of the
Council - On the promotion and use of energy from renewable sources. http://eur-lex.europa.eu/LexUriServ/LexUriServ.do?uri=OJ:L:2009:140:0016:0062:EN:PDF (Accessed November 25 2009)
6. EEA. 2006. How much bioenergy can Europe produce without harming the environment? http://www.eea.europa.eu/publications/eea_report_2006_7 (accessed November 25 2009)
7. Cheng, C.H., Lehmann, J., Thies, J.E., Burton, S.A. 2008. Stability of black carbon in soils across a climatic gradient, J. Geophysical Res. 113.
8. Lehmann, J. 2007. Bio-energy in the black. Front Ecol Environ. 5: 381-387.
9. Lehmann, J., J.P. da Silva Jr., C. Steiner, T. Nehls, W. Zech, B. Glaser. 2003. Nutrient availability and leaching in an archaeological Anthrosol and a Ferralsol of the Central Amazon basin: fertilizer, manure and charcoal amendments. Plant & Soil 249:343-355.
10. Steiner, C., W. G. Teixeira, J. Lehmann, T. Nehls, J. Luis, V. d. Macêdo, W.E.H. Blum, W. Zech. 2003. Long term effects of manure, charcoal and mineral fertilization on crop production and fertility on a highly weathered Central Amazonian upland soil. Plant & Soil 291:275-287.
11. Glaser, B., J. Lehmann, and W. Zech. 2002. Ameliorating physical and chemical properties of highly weathered soils in the tropics with charcoal—A review. Biol. Fertil. Soils 35:219–230.
12. Laird, D.A. 2008. The Charcoal Vision: A Win–Win–Win Scenario for Simultaneously Producing Bioenergy, Permanently Sequestering Carbon, while Improving Soil and Water Quality, Agronomy J., 100 178-181 (2008)
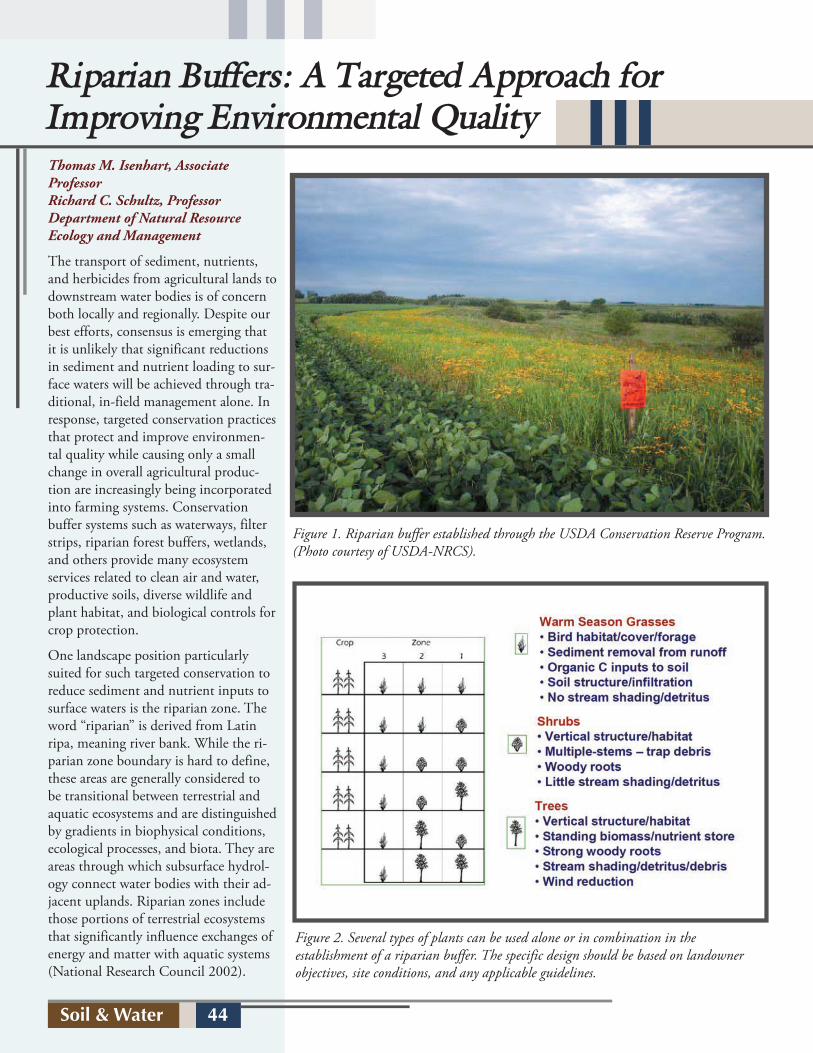
Soil & Water 44
Riparian Buffers: A Targeted Approach for Improving Environmental QualityThomas M. Isenhart, Associate ProfessorRichard C. Schultz, ProfessorDepartment of Natural Resource Ecology and Management
The transport of sediment, nutrients, and herbicides from agricultural lands to downstream water bodies is of concern both locally and regionally. Despite our best efforts, consensus is emerging that it is unlikely that significant reductions in sediment and nutrient loading to sur-face waters will be achieved through tra-ditional, in-field management alone. In response, targeted conservation practices that protect and improve environmen-tal quality while causing only a small change in overall agricultural produc-tion are increasingly being incorporated into farming systems. Conservation buffer systems such as waterways, filter strips, riparian forest buffers, wetlands, and others provide many ecosystem services related to clean air and water, productive soils, diverse wildlife and plant habitat, and biological controls for crop protection.
One landscape position particularly suited for such targeted conservation to reduce sediment and nutrient inputs to surface waters is the riparian zone. The word “riparian” is derived from Latin ripa, meaning river bank. While the ri-parian zone boundary is hard to define, these areas are generally considered to be transitional between terrestrial and aquatic ecosystems and are distinguished by gradients in biophysical conditions, ecological processes, and biota. They are areas through which subsurface hydrol-ogy connect water bodies with their ad-jacent uplands. Riparian zones include those portions of terrestrial ecosystems that significantly influence exchanges of energy and matter with aquatic systems (National Research Council 2002).
Figure 2. Several types of plants can be used alone or in combination in the establishment of a riparian buffer. The specific design should be based on landowner objectives, site conditions, and any applicable guidelines.
Figure 1. Riparian buffer established through the USDA Conservation Reserve Program. (Photo courtesy of USDA-NRCS).

Soil & Water 45
The term riparian buffer is typically used to describe a veg-etated area (a “buffer strip”) near a stream which helps shade and partially protect a stream from the impact of adjacent land uses (Figure 1). With the decline of many aquatic ecosys-tems due to changes in land use, riparian buffers have become a very common conservation practice aimed at reducing pol-lution and increasing water quality. At the start of 2010, Iowa landowners have established over 300,000 acres of riparian buffer practices in the USDA Conservation Reserve Program alone (www.fsa.usda.gov). If stretched end to end, this would be equivalent to a 1.5 mile wide strip of land the length of I-80 across Iowa – a significant investment in conservation!
The best riparian buffer design is one that benefits both the landowner and the environment. Some designs include a zone of trees nearest the stream followed by a zone of grasses adjacent to the crop field. Numerous variations of that design using trees, shrubs, native grasses and forbs or nonnative cool-season grasses may provide better function for riparian forest buffers in specific settings (Figure 2). Flexibility in design can
also be used to produce various market and nonmarket goods. Successful establishment of a buffer requires careful site assess-ment, implementation, and maintenance.
A component of the riparian zone that is often neglected for conservation practice application is stream banks. How-ever, recent research has demonstrated that these areas may be a major source of sediment and phosphorus pollution in streams. Bank erosion is related to the quantity and velocity of stream flow (stream power). Upland conservation prac-tices that reduce soil erosion but do not reduce the quantity or slow the water may not reduce stream power and thereby stream bank erosion. Conservation practices that can stabilize stream banks include bioengineering techniques that use a combination of plants and hard engineering materials (e.g., rock). It also is important to recognize that accumulation of sediment in our river valleys influences stream bank stability and provides a source of sediment for downstream transport.
Properly designed riparian buffers have been shown to effec-tively reduce non-point source pollutant movement to streams and can also remove them from the groundwater, under the right geological setting. Much of the research on riparian buffers in Iowa has been conducted within the Bear Creek National Restoration Demonstration Watershed in Story and Hamilton counties (Figure 3). This project represents one of the longest-term assessments of ecosystem services provided by the incorporation of continuous living cover and peren-nials within an intensively managed agricultural watershed in the Midwest. Since initiation in 1990, this project has grown to include nearly 16 km (10 miles) of riparian buffer with over 12 cooperating landowners. All of the buffers were established under standards required by the state or federal incentive programs utilized by the landowners. Some impor-tant lessons learned from nearly 20 years of research within the Bear Creek Watershed include (Schultz et al. 2004):
1. A 7 m (23 ft) wide native-grass filter can reduce delivery of sediment to the stream from sheet and rill surface runoff by more than 95% and delivery of total nitrogen and phospho-rus by more than 60%.
Figure 3. A change in management or buffer establishment will dramatically alter the look and functioning of a riparian zone in just a few years.
At the start of 2010, Iowa landowners have established over 300,000 acres of riparian buffer practices in the USDA Conservation Reserve Program alone.

Soil & Water 46
2. Water can infiltrate up to five times faster in restored six-year old buffers than in row cropped fields or heavily grazed pastures.
3. Soils in riparian buffers contain up to 66% more total organic carbon in the top 50 cm (1.6 ft) than adjacent crop field soils of the same mapping unit.
4. Riparian buffers have greater than eight times more below ground plant biomass than adjacent crop fields.
5. Buffers show a 2.5 fold increase in soil microbial biomass and a four-fold increase in denitrification in the surface 50 cm of soil when compared to crop field soils of the same mapping unit.
6. Tracer tests and isotope evidence shows that denitrification is the major groundwater nitrate removal mechanism in the buffers. However, the geology below buffers can determine the effectiveness of nutrient removal from shallow groundwa-ter. With a shallow confining layer of till below a loamy root zone buffers can remove up to 90% of the nitrate in ground-water.
7. Buffered stream banks lose as little as 20% of that observed for row cropped or heavily grazed stream banks.
8. Riparian buffers can reach maximum efficiency for sedi-ment removal in as little as 5 years and nutrient removal in as little as 10–15 years after establishment.
9. Riparian buffers provide valuable wildlife habitat and sup-port up to five times as many bird species as row-cropped or heavily grazed riparian areas. It is important to match buffer design and management to species requirements if the objec-tives are to attract specific target species or species groups.
10. To have a significant effect on stream water quality, con-tinuous riparian buffers should be located high in the water-shed.
Research from sites around the world has demonstrated that in the right location, riparian buffers can remove significant amounts of sediment, nutrients, and pesticides from both
surface and subsurface waters. However there are several issues that require additional consideration to enhance the benefits obtained from our conservation investment. These include
• How do we enhance buffer designs to address sediment and nutrients transported in concentrated flow?
• What practices most effectively address stream bed and bank erosion?
• What long-term management is required to maintain buffer effectiveness?
• Are there any harvestable products for landowners that can help offset the opportunity cost from converting cropland to riparian buffers?
In the meantime, riparian buffers remain one of our most effective targeted conservation practices that allow limited conservation dollars to be allocated where they can provide the greatest benefit to water quality.
Literature Cited
National Research Council. 2002. Riparian Areas: Functions and Strategies for Management. National Academies Press. Washington, D.C. 436 pp.
Schultz, R.C., T.M. Isenhart, W.W. Simpkins, and J.P. Colletti. 2004. Riparian forest buffers in agroecosystems – lessons learned from the Bear Creek Watershed, central Iowa, USA. Agroforestry Systems 61-61: 35-50.
Buffered stream banks lose up to 80% less soil than row cropped or heavily grazed stream banks.

Soil & Water 47
The Original GROUNDWATER
FLOW MODELIowa State University Soil and Water Conservation Club
DEMONSTRATES:
Functioning of tile drainage systems Water table fluctuations Leaking landfills and underground storage tanks
Movement of water in artesian wellsNon-point source leaching and well contaminationWater movement through fractured bedrockRiver containment
OVER 700 MODELS SOLD SINCE 1988
Unpacked Model: $450
Pre-packed Model with Thermoformed
Plastic Carrying Case: $540
Shipping not included
PRICES
To place an order, call 515-294-7850, email [email protected], or visit our web page: http://stuorg.iastate.edu/swcc.
Order forms are available online.
http://www.stuorg.iastate.edu/swcc/
If you would like to receive future publications, or to be considered as an author for future article submissions, please contact the Iowa Water Center.
2218 Agronomy HallAmes, Iowa 50011-1010515 [email protected]