soil scientist evaluation - the university of … bingham_soil scientist report...soil scientist...
TRANSCRIPT

SOIL SCIENTIST EVALUATION FINAL
UNC Bingham WWTF Land Application System Receiver Site
Orange County North Carolina
Prepared for:
McKim & Creed, PA
Venture IV Building, Suite 500 1730 Varsity Drive Raleigh, NC 27606
And
North Carolina Division of Water Quality
Aquifer Protection Section North Carolina Division of Water Quality
1617 Mail Service Center Raleigh, NC 27699-1617
Prepared by:
______________________________
Scott J. Frederick, EI, NCLSS April 2011

i
Table of Contents Executive Summary…………………………………………………………………… iv 1.0 Introduction………………………………………………………………………... 1 2.0 Objectives………………………………………………………………………….. 1 3.0 Methodology……………………………………………………………………….. 1 4.0 Site Description…………………………………………………………………...
4.1 Wetlands, Streams, and Groundwater Wells 4.2 Soils Investigation 4.3 Soils Analysis
2
5.0 Hydrology………………………………………………………………………… 5.1 Liquid Loadings
5.2 Wastewater Characterization 5.3 Wastewater Remediation 5.4 Water Budget
6
6.0 Environmental Effects…………………………………………………………….. 9 7.0 Results / Discussion................................................................................................... 10 8.0 References…………………………………………………………………………. 12 Appendix…………………………………………………………………………….…. 13 Appendix A – Maps
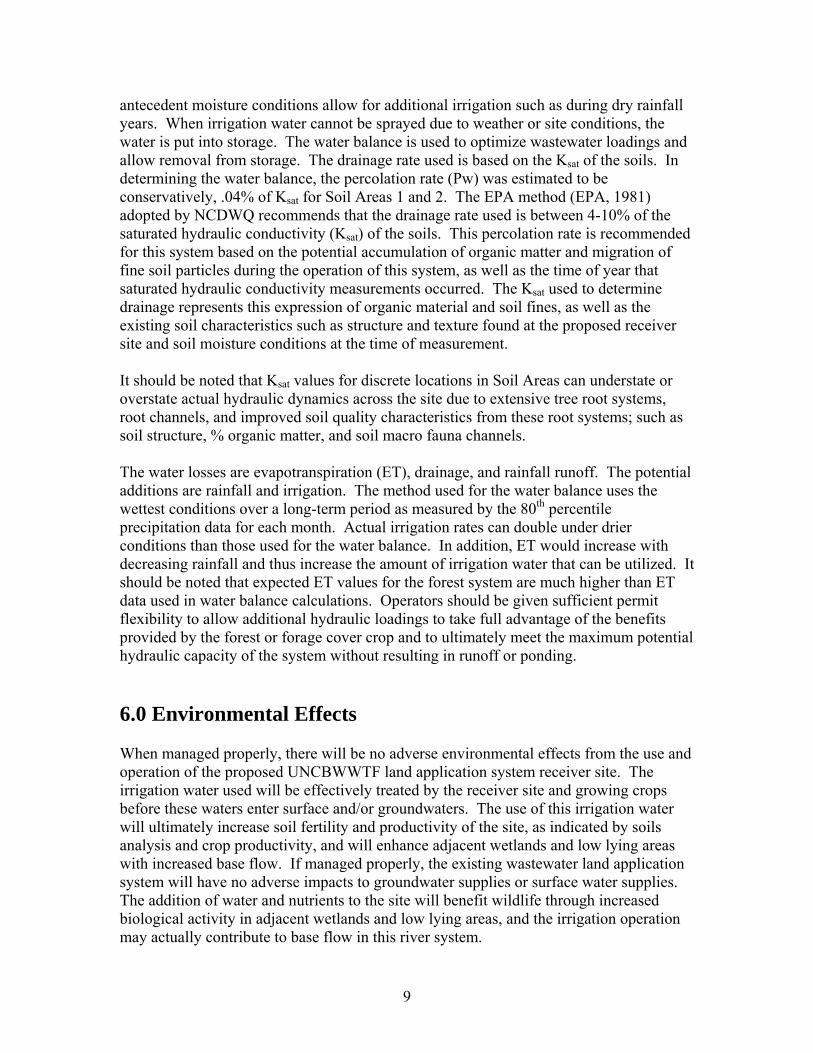
Figure 2: UNCBWWTF Land Application System Receiver Site Investigation Map. Figure 3: UNCBWWTF Land Application System Irrigable Soils Map. Figure 4: UNCBWWTF Land Application System NRCS (USDA)Soils Map.
Appendix B – Saturated Hydraulic Conductivity Data - UNCBWWTF Saturated Hydraulic Conductivity Data Appendix C – Soils Descriptions
- UNCBWWTF Land Application System Soils Descriptions

ii
List of Figures Figure 1: Project Location Map: UNCBWWTF Land Application System
Receiver Site Map, Orange County, North Carolina……… 3 Figure 2: UNCBWWTF Land Application System Receiver Site Investigation
Map…………………………………………………..... Appendix A
Figure 3: UNCBWWTF Land Application System Irrigable Soils
Map…………………………………………………………………... Appendix A
Figure 4: UNCBWWTF Land Application System NRCS (USDA) Soils
Map.............................................................................................. Appendix A

iii
List of Tables Table 1: Soil Areas, Recommended Hydraulic Loading Rates for the
UNCBWWTF Land Application System Receiver Site, Orange County, NC.…………………………….......................................... iv
Table 2: UNCBWWTF Land Application System Receiver Site Soil Areas,
Associated Soils, and Existing Vegetation…………… v Table 3: UNCBWWTF Land Application System Receiver Site Soil Area
Descriptions………………….......................................... 5 Table 4: Composite Soil Analysis of Upland Soils (N=22) at the
UNCBWWTF Land Application System Receiver Site, Orange County, NC (2010)………………………………………………... 6
Table 5: Typical Ranges of Soil Infiltration Rates by Soil Texture and
Slope………………………………………………………………. 6 Table 6: Average Saturated Hydraulic Conductivity (Ksat) Data for the
UNCBWWTF Receiver Site.............................................. 7 Table 7: Soils, Irrigable Areas, and Wastewater Loadings for the
UNCBWWTF Land Application System Receiver Site.............. 10

iv
Executive Summary A soil and site investigation was completed for the UNC Bingham Facility Wastewater Treatment (UNCBWWTF) land application system in Orange County, NC. The purpose of the investigation was to determine the potential of this property to receive secondary treated irrigation water. The soil scientist evaluation was conducted according to mandates set forth by the North Carolina Division of Water Quality (NCDWQ), Aquifer Protection Section and specifically, 15 NCAC 02T .0500. Field investigations were conducted to describe the existing receiver site according to the soils, existing vegetation crop, geologic features, physiographic region, topography, hydrology, wetlands, and landscape position. Water quality data and the most limiting site characteristics were utilized for hydraulic and liquid loading calculations and recommendations. Hydraulic loading recommendations were determined after consideration of site characteristics such as soils, in situ saturated hydraulic conductivity measurements, hydrology, vegetation, landscape position, and any other site limiting factors (Table 1). Loading recommendations are provided in this report for a land application irrigation system on the proposed receiver site and soil areas (Table 2). Hydraulic loadings were calculated based on site specific data and accepted professional guidelines for waste disposal (NCDWQ). Soil fertility was analyzed by a regional agronomic services laboratory (Table 4). Recommendations in this report are provided for the establishment of a forest or forage land application wastewater irrigation system including results from a detailed water balance and hydraulic loading rate analysis (Edwin Andrews & Assoc., PC, 2011). Soil analyses of the proposed irrigation site indicate there are some nutrient deficiencies on the proposed receiving silt loam and sandy loam soils (Table 4). The existing wastewater irrigation constituents will provide supplemental nutrients and a consistent source of water to growing crops, in this case a mixed hardwood forest and/or forage crop system. Table 1: Soil Areas, Recommended Hydraulic Loading Rates for the UNCBWWTF
Land Application System Receiver Site, Orange County, NC. Soil
Area acres1] in/wk2] gpd3]4]5] Seasonal 1 3.56 .157 2,182 Yes 2 2.15 .157 1,318 Yes
Design (SA 1 and SA2)
3,500 gpd 5.71*
3,500 Yes
1] Acreages account for setbacks from waterways, wetlands, streams, property lines, dwellings, and water supply wells for a 3,500 gpd system. 2] Rate based on recommended application rates calculated by a comprehensive Water Balance (Edwin Andrews & Assoc., PC, 2011). 3] Based on a 7 day irrigation week. 4] Recommended maximum hydraulic loading over an entire irrigation year including constraints from storage. 5] Irrigation rate shown is the maximum that should be used in computing receiver site capacity unless or until a higher loading rate is shown to be sustainable based on actual field performance and storage capacity limitations. Use of forest cover crop may result in higher than estimated transpiration and drainage rates. Operators at a minimum need the permit flexibility to apply irrigation water at

v
a rate high enough to sustain plant growth without causing runoff or ponding, which during extended dry periods (drought conditions) could exceed the rates shown in the table. * - Actual irrigable area utilized in Water Balance Report (Edwin Andrews & Assoc., PC, 2011). Table 2: UNCBWWTF Land Application System Receiver Site Soil Areas,
Associated Soils, and Existing Vegetation.
Soil Area Predominant Soil
Series
Existing Vegetation SA-1 Georgeville Grass, Mixed Pine/Hardwood
SA-2 Herndon Grass Approximately 57 acres of uplands with potential to receive municipal wastewater irrigation were evaluated and similar soils were grouped into Soil Areas (SA). Two different soil areas were identified within these areas, each with specific loading rates totaling 5.71 irrigable acres utilizing a secondary treated water source. Soil Areas account for buffers from waters of the State, property lines, as well as other site limitations such as bedrock, shallow soils, depressions, and disturbed areas. It should be noted that final hydraulic loading rates are based off a detailed water balance and in situ saturated hydraulic conductivity measurements. This water balance accounts for storage and other factors (Edwin Andrews & Assoc., PC, 2011) and local rainfall conditions. The receiver site investigated for this evaluation was approved by a nationally and state licensed soil scientist in North Carolina. It should be noted that soil systems are quite variable and the actual system performance and operations can be adjusted during operation to accommodate site variabilities. Hydraulic recommendations are based on site specific data, and attempt to account for these site variabilities. With that understanding, maximum hydraulic and nutrient loadings are given. This report is based on the professional recommendations and judgment of a nationally and North Carolina licensed soil scientist (SWE Group, 2011), and reviewed for incorporation into the permit application submittal to NCDWQ by a North Carolina licensed professional engineer (McKim & Creed 2011). Overall, the Bingham Facility Land Application System is a viable alternative to discharging treated wastewater into nearby surface waters. The irrigation of the treated wastewater will ultimately increase soil fertility and productivity of the cover crop vegetation and will enhance adjacent wetlands and low lying areas with increased base flow. The information contained in this report will aid with management of a land application irrigation system for the Bingham Facility receiver site.

1
1.0 Introduction Under Section 02T .0500 Rules – Waste Not Discharged to Surface Waters set forth by the North Carolina Division of Water Quality, municipalities, and publicly owned treatment works (POTWs) can divert their treated effluent to land application irrigation receiver sites. Land applying wastewater or reclaimed water will provide additional treatment, and is consistent with the total maximum daily load (TMDL) program promoted by federal and state regulatory agencies. Many county governments, municipalities, and industries are facing similar situations with finding alternatives for wastewater and reclaimed water treatment and disposal in nutrient sensitive regions. The proposed receiver site is a viable alternative to a point source discharge for wastewater produced by the UNC Bingham Wastewater Treatment Facility (UNCBWWTF) and will provide an excellent source of irrigation water for growing forage grasses and/or tree crops. 2.0 Objectives The objectives of this report are to describe the existing receiver site according to the soils, vegetation and/or crop cover, geologic features, topography, hydrology, wetlands, and landscape position. Recommendations will be provided for the establishment of a land based irrigation system. In addition, a standard soil fertility analysis will be provided and analyzed with an accompanying Agronomist Report (SWE Group, 2011). 3.0 Methodology Per regulations set forth by the North Carolina Division of Water Quality (NCDWQ) the purpose of this evaluation was to determine the potential and suitability of selected receiver areas to receive treated irrigation water and use this information in the permitting of the facility receiver areas. The soil scientist evaluation was conducted according to 15A NCAC 02T .0504(b). Field investigations were conducted to describe the potential wastewater receiver site according to the soils, existing vegetation / crop, geologic features, topography, hydrology, wetlands, and location. Anticipated wastewater quality data and the most limiting site characteristics were utilized for hydraulic loading calculations and recommendations. Hydraulic loading recommendations were determined after consideration of site characteristics such as soils, hydrology, vegetation, landscape position, and any other site limiting factors. Hydraulic loadings were calculated based on site specific data and NCDWQ guidelines for waste disposal (Water Balance Report: Edwin Andrews & Assoc. 2011). Soil fertility was analyzed by a regional soils analysis laboratory at NCDA (Table 4).

2
4.0 Site Description The UNCBWWTF is located in Orange County near the town of White Cross in the Bingham Township off Orange Chapel Clover Garden Road (SR 1956) (Figure 1). The property consists of several agricultural hay fields currently out of production, adjacent and abutting regenerating and mature pine fringe forest, hardwood forest, and adjacent mature mixed pine and hardwood forest. Existing facility structures occur on the site as well as in entrance road, existing wastewater irrigation system and infrastructure, and a newly constructed expansion wastewater irrigation system, storage lagoon, and irrigation infrastructure. Several intermittent stream, wetland, and floodprone complexes occur on the north and east sides of the receiver site. Several drainages course through the property draining upland areas into Collins Creek, a tributary to the Haw River. The site is located in the Piedmont Physiographic Province in the vicinity of the Haw River that is characterized by rolling topography bisected by narrow perennial and intermittent streams. The soils present on the proposed receiver sites, according to the Orange County Soil Survey (USDA, GIS 2010), are mapped as Georgeville silt loam, Herndon silt loam, as well as lowland loam soils consisting of Chewacla series soils. These mapping units were found on the site in similar locations indicated by the Orange County Soil Survey. Several small ephemeral, intermittent, and perennial drainages extend away from the receiver site connecting water conveyances on and off the site. These drainages were delineated and appropriate setbacks established to calculate irrigable soil areas (Biohabitats, 2010). These drainage areas will be protected from irrigation application with vegetative buffers that will capture and utilize subsurface irrigation water and rainfall runoff. Soils in the upland areas are typical of piedmont Carolina Slate Belt series soils with considerable variability within the catena and within each soil series including depth, color, and texture. Topography is rolling near drainages with slopes ranging from 2 to 6 percent. Shallow soils were found on ridges and areas historically farmed and now in pine forest vegetation. Soils in the lowland areas are typical of floodplain soils with periodic flooding and inundation characteristics, but very well drained adjacent to the water conveyance. The vegetation on the proposed forested land application areas consist of upland pine and hardwoods including: yellow poplar (Liriodendron tulipifera), hickory (Carya sp.), northern red oak (Quercus rubra), white oak (Quercus alba), red maple (Acer rubrum), black cherry (Prunus serotina), black gum (Nyssa sylvatica), sweetgum (Liquidambar styraciflua), sugar maple (Acer saccharum), Loblolly pine (Pinus taeda), Shortleaf pine (Pinus echinata), Virginia pine (Pinus virginiana), sassafras (Sassafras albidum), and other small understory woody species. Vegetation in the fields and open areas consist of a variety of herbaceous grasses, forbs, and broadleaf species. Fields will either be kept


4
open and planted with perennial forage grasses such as coastal Bermuda or fescue, or will be planted with an appropriate tree species selected for the soil, proposed liquid loadings, and landscape position. 4.1 Wetlands, Streams, and Groundwater Wells: A field investigation of the receiver site revealed areas of wetlands and drainage ways that have been delineated to avoid impacts from the irrigation system (Biohabitats, 2010). According to regulations (Section .0500 – Waste not discharged to surface waters) concerning wastewater land application systems using treated effluent, irrigation spray shall not influence within 25 feet of surface waters not classified SA (shellfish waters), including jurisdictional wetlands. Groundwater wells have been located and buffered accordingly. Additional 100 foot Jordan Lake buffers were also included in these setbacks on appropriate surface waters. 4.2 Soils Investigation: A soils investigation was accomplished across the proposed receiver site. A series of 3.5 in. hand auger borings were done across the site to maximum depths ranging from 36 - 84 in. (Appendix A – Figure 2: Site Investigation Map). These borings were done to characterize the depth of each of the horizons, the color of the soil material at each of the various depths, the texture, structure, consistence of the soil material within each of the horizons, and depth to bedrock or other limiting horizon. These augerings were also done to verify the boundaries of mapping units indicated in the USDA soil survey for Orange County, NC (USDA GIS, 2010). Descriptions of the augerings are included in the Appendix (Appendix C: Soils Descriptions) and were utilized to make a field determination of the specific soil mapping unit and subsequent recommended hydraulic and liquid loadings. The USDA Orange County Soil Survey for the site shows two (2) predominant series present within the irrigable soil areas: Georgeville silt loam and Herndon silt loam. Considerable variability in depth, color, and texture was evident across the site depending on landscape position and historical agricultural land use. These variations resulted in subsequent variations in hydraulic loading potentials between the two soil series but not within soil series sampling. Field investigations revealed similar locations for the soil series relative to the NRCS soil survey. The soils described and delineated in the field were separated into different Soil Areas each representing a different proposed hydraulic loading rate. These loading rates were determined in part by detailed soils descriptions including texture, structure, mineralogy, and consistence. In addition these Soil Areas and corresponding potential hydraulic loadings were determined by site topography and site specific saturated hydraulic conductivity (Ksat) measurements. Uplands and lowlands were examined for the potential for land application. Soils in the uplands are typical of piedmont Carolina Slate Belt series soils with silt loam textures, deep soils on side and toe slopes, shallow soils on ridges, and considerable variability across the site. Topography is flat to rolling near drainages with slopes ranging from 2 to

5
6 percent. Potential hydraulic loading rates will be limited by the soil with the lowest Ksat within each proposed Soil Area. The hand auger borings confirmed that the soils mapped on the site according to NRCS (USDA) are present in the proposed receiver areas. The majority of the soils on the proposed receiver site consist of Georgeville and Herndon silt loam soils, with the remainder of the lowlands consisting of Chewacla loam soils. Soil Area 1 (SA1) soils on the receiver site consist of Georgeville silt loam soils. Slopes range from 2-6%. These soils are very deep, well drained, moderately permeable soils that formed in material mostly weathered from fine-grained metavolcanic rocks of the Carolina Slate Belt. Seasonal high water is typically >6 ft. SA1 soils comprise approximately 62% (3.56 ac) of the total receiver site acreage (5.71 ac). Soil Area 2 (SA2) soils on the receiver site consist of Herndon silt loam soils. Slopes range from 2-6%. These soils are very deep, well drained, moderately rapid permeability soils that formed in material mostly weathered from fine-grained metavolcanic rock of the Carolina Slate Belt. Seasonal high water is typically >6 ft, however soil variabilities across the site indicate some seasonal perching conditions closer to the surface, probably indicative of slower permeable inclusions. SA2 soils comprise approximately 37% (2.15 ac) of the total receiver site acreage (5.71). A description of the soil areas including predominant soil series, and existing vegetation is summarized in Table 3. Table 3: UNCBWWTF Land Application System Receiver Site Soil Area
Descriptions.
Soil Area Predominant Soil
Series
Existing Vegetation SA-1 Georgeville Grass, Mixed Pine/Hardwood
SA-2 Herndon Grass 4.3 Soils Analysis: A composite sample of the top 0-12 inches of soil representing the irrigable upland areas was collected and analyzed for nutrient composition by NCDA (Table 4). Soil analyses of the proposed irrigation site indicate that there are nutrient deficiencies, especially nitrogen and phosphorus. This conclusion is based on the potential crop response to particular nutrients if fertilizer is applied to the site. The cation exchange capacity (CEC) and base saturation (BS%) are low as well. The addition of wastewater to the site will improve soil fertility and consequently the growing conditions and productivity of this site. Additional agronomy recommendations are found in the Agronomist Report (SWE Group, 2011)

6
Table 4: Composite Soil Analysis of Uplands (N=22) at the UNCBWWTF
Receiver Site, Orange County, NC (2010)1.
Depth
pH Phosphorus
ppm (Index) 2
Potassium ppm
(Index)
Calcium ppm (%)
Magnesium ppm (%)
CEC 3
BS% 4
Uplands 0-6 in.
4.8 23.4 (19.5) 69.1
(35.4) 211.6 (33.1) 94.3 (14.7) 6.1 50.7
6-12 in. 5.0 4.8 (4.0)
55.0 (28.1)
166.7 (29.8) 100.9 (17.7) 5.4 49.9
1 Laboratory Soil Test Reports (2010). 2 Index values reported by NCDA (2010) http://www.ncagr.com/agronomi/pdffiles/ustr.pdf
3 Cation exchange capacity (meq/100g) – defined as the amount of cations adsorbed on soil-particle surfaces per unit mass of the soil under chemically neutral conditions. 4 Base saturation – defined as the percentage of the CEC occupied by base cations
5.0 Hydrology 5.1 Liquid Loadings The liquid loading limit represents the amount of liquid (in/wk), which can be applied to land receiver sites, including nutrients. These values are represented as the annual, monthly, weekly, and hourly maximum loadings that can be assimilated on a wastewater receiver site. A water balance was calculated for each Soil Area to determine suitable liquid loadings according to the in-situ properties of the site that most influence these loadings. The soils present are generally silt loam soils with slopes ranging from 2-6% on Soil Areas 1 and 2. Wastewater should not be applied at an instantaneous rate exceeding 0.5 in/hr on Soil Area 1 and 2. The maximum instantaneous loading rate was determined utilizing published infiltration rate data for the particular soil and landscape position at the existing wastewater receiver site (Sprinkler Irrigation, 1969). However, these numbers are somewhat conservative given the acceptable range of maximum instantaneous loading rate for these soils and ideal site conditions and can be increased up to 50% under ideal conditions (Table 5). Table 5: Typical Ranges of Soil Infiltration Rates by Soil Texture and Slope. Basic Infiltration Rate (in/hr1) Slope Texture 0-3% 3-9% 9+% Sands 1.0+ 0.7+ 0.5+ loamy sands 0.7-1.5 0.5-1.0 0.4-0.7 sandy loams and fine sandy loams
0.5-1.0 0.4-0.7 0.3-0.5
very fine sandy loam and silt loam
0.3-0.7 0.2-0.5 0.15-0.3

7
sandy clay loam and silty clay loam
0.2-0.4 0.15-0.25 0.1-0.15
clay and silty clay 0.1-0.2 0.1-0.15 <0.1 Source: Sprinkler Irrigation Association, Sprinkler Irrigation (1969) 1. For good vegetative cover, these rates may be 25-50% greater. For poor surface conditions, rates may be as much as 50% less. During the soils investigation, the most restrictive soil horizons were noted to determine the appropriate Soil Areas and to estimate or measure saturated hydraulic conductivity in these restrictive horizons. Saturated hydraulic conductivity (Ksat) values were obtained from 22 sample points across the receiver site using a portable constant head permeameter (CHP) (Table 6). Test locations for soil hydraulic conductivity are shown on the site investigation map in Appendix A. From the site specific data, the Ksats for Soil Areas 1 and 2 were determined to have a geometric mean of 0.04 in/hr and 0.033 in/hr respectively (Appendix B – Saturated Hydraulic Conductivity Data) (Water Balance Report – Edwin Andrews & Assoc., 2011). Due to site variabilities and to improve site operations, the lowest geomean Ksat was selected to represent both soil areas. Therefore, both soil areas will be loaded at the same rate across the site at .033 in/hr (Edwin Andrews and Associates, 2011). These values represented the soil hydraulic characteristics of the irrigable soils and were incorporated into a comprehensive water balance. (Edwin Andrews & Assoc., PC, 2011). It should also be noted that a forested land application system design was selected for a portion of this receiver site to maximize evapotranspiration, and improve soil quality; including structure and vertical and horizontal hydraulic conductivities. Root channels from the tree cover crop effectively improve the hydraulic conductivities of soils found on site above what can typically be calculated from discreet CHP data points and as reflected in the Ksat values used for each soil area in the water balance. Table 6: Average Saturated Hydraulic Conductivity (Ksat) Data for the
UNCBWWTF Receiver Site.
Soil Area Horizon Average Depth
(in.) cm/hr 1 in/hr * 1 Bt 19.8 .08 0.034 2 Bt 19.3 .07 0.033
SA1 & SA2 .033
1.] Based off Ksat data collected across the project site for each Soil Area (Appendix B – Saturated Hydraulic Conductivity Data) (SWE Group, 2010 and Edwin Andrews & Associates, 2010) *Water Balance conducted by Edwin Andrews and Associates, 2011. Depending on zone layout and design it is recommended that some type of automated system be installed to allow efficient use of varying soil areas and irrigable areas. All irrigable soils (Figure 3 – Irrigable Soils Map) should be managed for irrigation according to antecedent rainfall and time of year to minimize ponding and runoff potential.

8
5.2 Wastewater Characterization: The proposed secondary effluent irrigation water can be described as containing varying levels of essential plant nutrients, organic compounds, trace minerals, and potentially phytotoxic compounds. Each of these wastewater constituents are assimilated or transformed on a receiver site through physical, chemical, and biological processes. The irrigation water proposed for application on this system will go through a series of pretreatment stages preparatory to slow rate irrigation on a dedicated receiver site. Additional sampling and monitoring of wastewater and soils on the receiver site is recommended to ensure optimal performance of the proposed irrigation system. Irrigation water should have SAR values ≤ 10 to avoid potential salting problems in the soil. Periodic application of gypsum may be required as a corrective measure if the SAR is consistently above 10. Proposed data from the design facility indicates low levels for N and P in treated effluent. Therefore, supplemental nutrients may be required. 5.3 Wastewater Remediation: Irrigation water will be utilized in several ways on the receiver site. Some water will be lost directly by evaporation of the water from the sprinkler heads. Water will be lost through transpiration by vegetation, evaporation from the vegetation and soils surface, and percolation through the soil profile. Any excess nutrients in the wastewater will be treated through microbial processes, plant uptake, adsorption to soil solids, and biologically mediated chemical transformations (i.e. denitrification). Based on the wastewater analysis, there is little potential for percolation of nutrients below the root zone. 5.4 Water Budget: A water balance was calculated by Edwin Andrews & Assoc., PC based on specific site data and utilized as an aid for system design. This water balance can be represented by: Evapotranspiration + Natural Runoff + Drainage = Precipitation and Irrigation Drainage rate was estimated based on qualitative observations, soil chemical and physical data, and site specific hydraulic conductivity data (Ksat). Long-term precipitation values used in the water balance represent the wet-year for the region (Chapel Hill, NC). Evapotranspiration data was utilized from data determined by the Thornthwaite method for calculating PET, one appropriate method for the Southeastern region. The estimated water balance calculations illustrate the amount of wastewater that can be applied to the receiver site under wet rainfall year conditions, given there are no nutrient limitations. The facility should be designed to handle larger flow volumes when
9
antecedent moisture conditions allow for additional irrigation such as during dry rainfall years. When irrigation water cannot be sprayed due to weather or site conditions, the water is put into storage. The water balance is used to optimize wastewater loadings and allow removal from storage. The drainage rate used is based on the Ksat of the soils. In determining the water balance, the percolation rate (Pw) was estimated to be conservatively, .04% of Ksat for Soil Areas 1 and 2. The EPA method (EPA, 1981) adopted by NCDWQ recommends that the drainage rate used is between 4-10% of the saturated hydraulic conductivity (Ksat) of the soils. This percolation rate is recommended for this system based on the potential accumulation of organic matter and migration of fine soil particles during the operation of this system, as well as the time of year that saturated hydraulic conductivity measurements occurred. The Ksat used to determine drainage represents this expression of organic material and soil fines, as well as the existing soil characteristics such as structure and texture found at the proposed receiver site and soil moisture conditions at the time of measurement. It should be noted that Ksat values for discrete locations in Soil Areas can understate or overstate actual hydraulic dynamics across the site due to extensive tree root systems, root channels, and improved soil quality characteristics from these root systems; such as soil structure, % organic matter, and soil macro fauna channels. The water losses are evapotranspiration (ET), drainage, and rainfall runoff. The potential additions are rainfall and irrigation. The method used for the water balance uses the wettest conditions over a long-term period as measured by the 80th percentile precipitation data for each month. Actual irrigation rates can double under drier conditions than those used for the water balance. In addition, ET would increase with decreasing rainfall and thus increase the amount of irrigation water that can be utilized. It should be noted that expected ET values for the forest system are much higher than ET data used in water balance calculations. Operators should be given sufficient permit flexibility to allow additional hydraulic loadings to take full advantage of the benefits provided by the forest or forage cover crop and to ultimately meet the maximum potential hydraulic capacity of the system without resulting in runoff or ponding. 6.0 Environmental Effects When managed properly, there will be no adverse environmental effects from the use and operation of the proposed UNCBWWTF land application system receiver site. The irrigation water used will be effectively treated by the receiver site and growing crops before these waters enter surface and/or groundwaters. The use of this irrigation water will ultimately increase soil fertility and productivity of the site, as indicated by soils analysis and crop productivity, and will enhance adjacent wetlands and low lying areas with increased base flow. If managed properly, the existing wastewater land application system will have no adverse impacts to groundwater supplies or surface water supplies. The addition of water and nutrients to the site will benefit wildlife through increased biological activity in adjacent wetlands and low lying areas, and the irrigation operation may actually contribute to base flow in this river system.

10
7.0 Results / Discussion The soils investigated at the UNCBWWTF land application system receiver site are suitable for wastewater application. The best soils are deep, well-drained, and have moderate permeabilities. The soils were grouped into two (2) separate soil areas, each with specific loading rates (Table 7). A geometric mean loading rate was utilized using the most conservative soils on site thereby combining all soil areas into one design Soil Area. Table 7: Soils, Irrigable Area, and Recommended Wastewater Loadings for the
UNCBWWTF Land Application System Receiver Site. Soil
Area Predominant
Soils acres1] in/wk2] gpd3]4]5] Seasonal 1 Georgeville 3.56 .157 2,182 Yes 2 Herndon 2.15 .157 1,318 Yes
Design * SA1 & 2 5.71 .157 3,500 Yes 1] Acreages account for setbacks from waterways, wetlands, streams, property lines, dwellings, and water supply wells for a 3,500 gpd system. 2] Rate based on recommended application rates calculated by a comprehensive Water Balance Report (Edwin Andrews & Assoc., PC, 2010) and local wet rainfall year data. 3] Based on a 7 day irrigation week. 4] Recommended hydraulic loading over an entire irrigation year including storage constraints. 5] Irrigation rate shown is the maximum that should be used in computing receiver site capacity unless or until a higher loading rate is shown to be sustainable based on actual field performance and storage capacity limitations. Use of forest cover crop may result in higher than estimated transpiration and drainage rates. Operators at a minimum need the permit flexibility to apply irrigation water at a rate high enough to sustain plant growth without causing runoff or ponding, which during extended dry periods (drought conditions) could exceed the rates shown in the table. * Actual irrigable area utilized in Water Balance Report (Edwin Andrews & Assoc., PC, 2011). Saturated hydraulic conductivity tests were performed to determine the permeability of the most restrictive horizon. These measurements were obtained from selected sample points across the site. These values were used to determine the hydraulic loading capacity of the receiver site. The most restrictive horizon in these soils have saturated hydraulic conductivities ranging from .29 to 0.01 in/hr for all Soil Areas. The most restrictive saturated hydraulic conductivities were determined in the Bt horizons of all Soil Areas. According to the final Water Balance Report (Edwin Andrews & Assoc., PC, 2011) for the selected receiver site, existing soils and vegetation can accept maximum hydraulically limited liquid loadings of 8.2 in/yr applied to Soil Areas 1 and 2 (3,500 gpd). Recommended weekly application is .157 in/wk for both soil areas based on local wet year rainfall data. Actual loadings may be adjusted in the future according to site specific characteristics, system operation, and storage modifications.

11
Overall, the site is a viable option for wastewater application. The irrigation water applied will provide supplemental nutrients and a consistent source of water to growing crops capable of producing large amounts of biomass and providing favorable soil conditions to enhance adsorption and denitrification of phosphorous and nitrogen respectively. With proper site management, hydraulic and nutrient loading management, the site will perform as a means to treat and assimilate wastewater irrigation water and protect surface waters entering the nearby river basins.

12
8.0 References Edwin Andrews & Associates, PA, 2011. Water Balance Report. UNC Bingham
WWTF Land Application System. Orange County, NC. Evans, R.O. 2001-present. North Carolina State University – Biological and Agricultural Engineering Associate Professor and Department Extension Leader, Water Table Management and Water Quality, Raleigh, NC (personal communication). Rubin, A.R. 1978-2004. North Carolina State University – Biological and
Agricultural Engineering Professor and Extension Specialist, Waste Management, Raleigh, NC. (personal communication)
Section .0500 – Waste Not Discharged to Surface Waters, 15A NCAC 02T .0504 (b) - Soils Report. G.S. 143-215.1; 143-215.3(a)(1); Eff. September 1, 2006. Soil, Water, and Environment Group, PLLC, 2011. Agronomist Report. UNC Bingham
WWTF Land Application System. Orange County, NC. United States Department of Agriculture, Soil Conservation Service. Soil Survey of
Orange County, North Carolina. GIS Web Survey, 2010. United States Environmental Protection Agency. 1981. Process Design Manual, Land
Treatment of Municipal Wastewater. Published by USEPA Center for Environmental Research Information. Cincinnati, Ohio 45268.

13
APPENDIX

APPENDIX A
Maps


APPENDIX B
Saturated Hydraulic Conductivity Data

Ksat Data SheetPlot: Ksat-1 Conducted By: SJF
Location: Bingham, road Date: 4/6/10
Weather: sunny Temp: 75
Soil Series/Horizon: Georgeville Source of Water: tap
Plot hd r rs D Hi H/r di dsuri 1-ON 2-ON dsurf df Hf Mri Ti MRf Tf ∆ MR ∆ T V CFQ
(cm3/min) Q (cm3/h) Ksat (cm/h)Ksat
(cm/d) Ksat (in/h) Ksat (in/d)
1/Bt 48 3.0 10 58 15 5 43 33 yes 33 43 15 34.3 10:43:00 32.2 11:13:00 2.1 0:30:00 42 20 1.4 84.0 0.089 2.13 0.03 0.84
48 3.0 10 58 15 5 43 33 yes 33 43 15 32.2 11:13:00 31.0 11:43:00 1.2 0:30:00 24 20 0.8 48.0 0.051 1.22 0.02 0.48
48 3.0 10 58 15 5 43 33 yes 33 43 15 31.0 11:43:00 30.5 12:13:00 0.5 0:30:00 10 20 0.3 20.0 0.021 0.51 0.01 0.20
48 3.0 10 58 15 5 43 33 yes 33 43 15 30.5 12:13:00 29.5 12:43:00 1.0 0:30:00 20 20 0.7 40.0 0.042 1.01 0.02 0.40
48 3.0 10 58 15 5 43 33 yes 33 43 15 29.5 12:43:00 28.5 13:13:00 1.0 0:30:00 20 20 0.7 40.0 0.042 1.01 0.02 0.40
48 3.0 10 58 15 5 43 33 yes 33 43 15 28.5 13:13:00 27.5 13:43:00 1.0 0:30:00 20 20 0.7 40.0 0.042 1.01 0.02 0.40
48 3.0 10 58 15 5 43 33 yes 33 43 15 27.5 13:43:00 26.5 14:13:00 1.0 0:30:00 20 20 0.7 40.0 0.042 1.01 0.02 0.40
0.0423 1.0141 0.0166 0.3993
2/Bc 99 3.0 10 109 15 5 94 84 yes 84 94 15 38.8 11:05:00 37.2 11:50:00 1.6 0:45:00 168 105 3.7 224.0 0.237 5.68 0.09 2.24
99 3.0 10 109 15 5 94 84 yes 84 94 15 37.2 11:50:00 34.2 12:20:00 3.0 0:30:00 315 105 10.5 630.0 0.666 15.97 0.26 6.29
99 3.0 10 109 15 5 94 84 yes 84 94 15 34.2 12:20:00 30.6 12:50:00 3.6 0:30:00 378 105 12.6 756.0 0.799 19.17 0.31 7.55
99 3.0 10 109 15 5 94 84 yes 84 94 15 30.6 12:50:00 27.2 13:20:00 3.4 0:30:00 357 105 11.9 714.0 0.754 18.10 0.30 7.13hd = Hole depth (cm) 0.7321 17.5694 0.2416 5.7992r = Radius of the hole (dia./2) (cm)rs = Distance between reference level and soil surface (cm)D = Distance from the hole bottom to the reference level (hd+rs) (cm)Hi = Initial desired water depth (head) in hole (cm)H/r = Ratio of head to radius of hole (must be ≥ 5)di = Constant-head tube setting, initial d measured in hole (di = D-Hi) (cm) - usually 1 cm less than calculated didsuri = Initial distance from water surface to ground (hd - Hi)1-ON = 3-way valve turned to 1-ON (CF = 20, multiply CF times ∆ MR to obtain volume of flow)2-ON = 3-way valve turned to 2-ON (CF = 105, multiply CF times ∆ MR to obtain volume of flow)dsurf = Final distance from water surface to ground (steady state)df = Final d measured in hole (dsurf + rs) (cm) - should be within 1-2 cm of diHf - Final water depth in hole (Hf = D-df) (cm)MRi = Initial measuring reservoir reading (cm)Ti = Initial time to record measuring reservoir level drop (min.)MRf = Final measuring reservoir reading (cm)Tf = Final time to record measuring reservoir level drop (min.)∆ MR = Change in measuring reservoir level (cm)∆ T = Change in time for measuring reservoir water drop (min.)V = flow volume (cm 3)

Ksat Data SheetPlot: Ksat-2 Conducted By: SJF
Location: Bingham - field/road Date: 4/6/10
Weather: sunny Temp: 75
Soil Series/Horizon: Ge Source of Water: tap
Plot hd r rs D Hi H/r di dsuri 1-ON 2-ON dsurf df Hf Mri Ti MRf Tf ∆ MR ∆ T V CF Q (cm3/min) Q (cm3/h) Ksat (cm/h)Ksat
(cm/d) Ksat (in/h) Ksat (in/d)
1/Bt 43 3.0 10 53 15 5 38 28 yes 28 38 15 36.3 11:06:00 35.4 11:36:00 0.9 0:30:00 18 20 0.6 36.0 0.038 0.91 0.01 0.36
43 3.0 10 53 15 5 38 28 yes 28 38 15 35.4 11:36:00 34.7 12:06:00 0.7 0:30:00 14 20 0.5 28.0 0.030 0.71 0.01 0.28
43 3.0 10 53 15 5 38 28 yes 28 38 15 34.7 12:06:00 34.1 12:36:00 0.6 0:30:00 12 20 0.4 24.0 0.025 0.61 0.01 0.24
43 3.0 10 53 15 5 38 28 yes 28 38 15 34.1 12:36:00 33.5 13:06:00 0.6 0:30:00 12 20 0.4 24.0 0.025 0.61 0.01 0.24
43 3.0 10 53 15 5 38 28 yes 28 38 15 33.5 13:06:00 32.9 13:36:00 0.6 0:30:00 12 20 0.4 24.0 0.025 0.61 0.01 0.24
43 3.0 10 53 15 5 38 28 yes 28 38 15 32.9 13:36:00 32.3 14:06:00 0.6 0:30:00 12 20 0.4 24.0 0.025 0.61 0.01 0.24
0.0254 0.6085 0.0100 0.2396
2/BC 60 3.0 10 70 15 5 55 45 yes 45 55 15 42.9 11:00:00 42.8 11:45:00 0.1 0:45:00 10.5 105 0.2 14.0 0.015 0.35 0.01 0.14
60 3.0 10 70 15 5 55 45 yes 45 55 15 42.8 11:45:00 42.7 12:15:00 0.1 0:30:00 10.5 105 0.3 21.0 0.022 0.53 0.01 0.21
60 3.0 10 70 15 5 55 45 yes 45 55 15 42.7 12:15:00 42.6 12:45:00 0.1 0:30:00 10.5 105 0.4 21.0 0.022 0.53 0.01 0.21
60 3.0 10 70 15 5 55 45 yes 45 55 15 42.6 12:45:00 42.3 13:15:00 0.3 0:30:00 31.5 105 1.1 63.0 0.067 1.60 0.03 0.63
60 3.0 10 70 15 5 55 45 yes 45 55 15 42.3 13:15:00 41.9 13:45:00 0.4 0:30:00 42 105 1.4 84.0 0.089 2.13 0.03 0.84
60 3.0 10 70 15 5 55 45 yes 45 55 15 41.9 13:45:00 24.9 8:57:00 17.0 16:48:00 1785 105 1.8 106.3 0.112 2.69 0.04 1.06
60 3.0 10 70 15 5 55 45 yes 45 55 15 24.9 8:57:00 24.4 9:27:00 0.5 0:30:00 52.5 105 1.8 105.0 0.111 2.66 0.04 1.05
60 3.0 10 70 15 5 55 45 yes 45 55 15 24.4 9:27:00 23.7 10:07:00 0.6 0:40:00 63 105 1.6 94.5 0.100 2.40 0.04 0.94
60 3.0 10 70 15 5 55 45 yes 45 55 15 24.4 10:07:00 23.7 10:37:00 0.6 0:30:00 63 105 2.1 126.0 0.133 3.19 0.05 1.26hd = Hole depth (cm) 0.1122 2.69 0.0442 1.0605r = Radius of the hole (dia./2) (cm)rs = Distance between reference level and soil surface (cm)D = Distance from the hole bottom to the reference level (hd+rs) (cm)Hi = Initial desired water depth (head) in hole (cm)H/r = Ratio of head to radius of hole (must be ≥ 5)di = Constant-head tube setting, initial d measured in hole (di = D-Hi) (cm) - usually 1 cm less than calculated didsuri = Initial distance from water surface to ground (hd - Hi)1-ON = 3-way valve turned to 1-ON (CF = 20, multiply CF times ∆ MR to obtain volume of flow)2-ON = 3-way valve turned to 2-ON (CF = 105, multiply CF times ∆ MR to obtain volume of flow)dsurf = Final distance from water surface to ground (steady state)df = Final d measured in hole (dsurf + rs) (cm) - should be within 1-2 cm of diHf - Final water depth in hole (Hf = D-df) (cm)MRi = Initial measuring reservoir reading (cm)Ti = Initial time to record measuring reservoir level drop (min.)MRf = Final measuring reservoir reading (cm)Tf = Final time to record measuring reservoir level drop (min.)∆ MR = Change in measuring reservoir level (cm)∆ T = Change in time for measuring reservoir water drop (min.)V = flow volume (cm3)

Ksat Data SheetPlot: Ksat 3 Conducted By: SJF
Location: Bingham - front road Date: 4/23/10
Weather: cloudy Temp: 60
Soil Series/Horizon: Ge Source of Water: tap
Plot hd r rs D Hi H/r di dsuri 1-ON 2-ON dsurf df Hf Mri Ti MRf Tf ∆ MR ∆ T V CF Q (cm3/min) Q (cm3/h) Ksat (cm/h) Ksat (cm/d) Ksat (in/h) Ksat (in/d)
1/Bt 52 3.0 10 62 15 5 47 37 yes 37 47 15 42.5 10:18:00 41.6 10:48:00 0.9 0:30:00 94.5 105 3.2 189.0 0.200 4.79 0.08 1.89
52 3.0 10 62 15 5 47 37 yes 37 47 15 41.6 10:48:00 41.0 11:18:00 0.6 0:30:00 63 105 2.1 126.0 0.133 3.19 0.05 1.26
52 3.0 10 62 15 5 47 37 yes 37 47 15 41.0 11:18:00 40.6 11:48:00 0.4 0:30:00 42 105 1.4 84.0 0.089 2.13 0.03 0.84
52 3.0 10 62 15 5 47 37 yes 37 47 15 40.6 11:48:00 40.2 12:18:00 0.4 0:30:00 42 105 1.4 84.0 0.089 2.13 0.03 0.84
52 3.0 10 62 15 5 47 37 yes 37 47 15 40.2 12:18:00 39.6 12:48:00 0.6 0:30:00 63 105 2.1 126.0 0.133 3.19 0.05 1.26
52 3.0 10 62 15 5 47 37 yes 37 47 15 39.6 12:48:00 39.1 13:18:00 0.5 0:30:00 52.5 105 1.8 105.0 0.111 2.66 0.04 1.05
52 3.0 10 62 15 5 47 37 yes 37 47 15 39.1 1:18:00 38.4 1:48:00 0.7 0:30:00 73.5 105 2.5 147.0 0.155 3.73 0.06 1.47
52 3.0 10 62 15 5 47 37 yes 37 47 15 38.4 1:48:00 38.4 2:18:00 0.0 0:30:00 0 105 0.0 0.0 0.000 0.00 0.00 0.00
0.1183 2.8395 0.0466 1.1179hd = Hole depth (cm)r = Radius of the hole (dia./2) (cm)rs = Distance between reference level and soil surface (cm)D = Distance from the hole bottom to the reference level (hd+rs) (cm)Hi = Initial desired water depth (head) in hole (cm)H/r = Ratio of head to radius of hole (must be ≥ 5)di = Constant-head tube setting, initial d measured in hole (di = D-Hi) (cm) - usually 1 cm less than calculated didsuri = Initial distance from water surface to ground (hd - Hi)1-ON = 3-way valve turned to 1-ON (CF = 20, multiply CF times ∆ MR to obtain volume of flow)2-ON = 3-way valve turned to 2-ON (CF = 105, multiply CF times ∆ MR to obtain volume of flow)dsurf = Final distance from water surface to ground (steady state)df = Final d measured in hole (dsurf + rs) (cm) - should be within 1-2 cm of diHf - Final water depth in hole (Hf = D-df) (cm)MRi = Initial measuring reservoir reading (cm)Ti = Initial time to record measuring reservoir level drop (min.)MRf = Final measuring reservoir reading (cm)Tf = Final time to record measuring reservoir level drop (min.)∆ MR = Change in measuring reservoir level (cm)∆ T = Change in time for measuring reservoir water drop (min.)V = flow volume (cm3)

Ksat Data SheetPlot: Ksat-4 Conducted By: SJF
Location: Bingham, road Date: 4/7/10
Weather: sunny Temp: 75
Soil Series/Horizon: Ge (shallow) Source of Water: tap
Plot hd r rs D Hi H/r di dsuri 1-ON 2-ON dsurf df Hf Mri Ti MRf Tf ∆ MR ∆ T V CF Q (cm3/min) Q (cm3/h) Ksat (cm/h) Ksat (cm/d) Ksat (in/h) Ksat (in/d)
1/Bt 47 3.0 10 57 15 5 42 32 yes 32 42 15 36.0 9:40:00 35.5 10:10:00 0.5 0:30:00 52.5 105 1.8 105.0 0.111 2.66 0.04 1.05
47 3.0 10 57 15 5 42 32 yes 32 42 15 35.5 10:10:00 34.9 10:50:00 0.6 0:40:00 63 105 1.6 94.5 0.100 2.40 0.04 0.94
47 3.0 10 57 15 5 42 32 yes 32 42 15 34.9 10:50:00 34.4 11:20:00 0.5 0:30:00 52.5 105 1.8 105.0 0.111 2.66 0.04 1.05
47 3.0 10 57 15 5 42 32 yes 32 42 15 34.4 11:20:00 34.0 11:50:00 0.4 0:30:00 42 105 1.4 84.0 0.089 2.13 0.03 0.84
47 3.0 10 57 15 5 42 32 yes 32 42 15 34.0 11:50:00 33.6 12:20:00 0.4 0:30:00 42 105 1.4 84.0 0.089 2.13 0.03 0.84
47 3.0 10 57 15 5 42 32 yes 32 42 15 33.6 12:20:00 33.2 12:50:00 0.4 0:30:00 42 105 1.4 84.0 0.089 2.13 0.03 0.84
47 3.0 10 57 15 5 42 32 yes 32 42 15 33.2 12:50:00 32.8 13:20:00 0.4 0:30:00 42 105 1.4 84.0 0.089 2.13 0.03 0.84
0.0887 2.1296 0.0349 0.8384hd = Hole depth (cm)r = Radius of the hole (dia./2) (cm)rs = Distance between reference level and soil surface (cm)D = Distance from the hole bottom to the reference level (hd+rs) (cm)Hi = Initial desired water depth (head) in hole (cm)H/r = Ratio of head to radius of hole (must be ≥ 5)di = Constant-head tube setting, initial d measured in hole (di = D-Hi) (cm) - usually 1 cm less than calculated didsuri = Initial distance from water surface to ground (hd - Hi)1-ON = 3-way valve turned to 1-ON (CF = 20, multiply CF times ∆ MR to obtain volume of flow)2-ON = 3-way valve turned to 2-ON (CF = 105, multiply CF times ∆ MR to obtain volume of flow)dsurf = Final distance from water surface to ground (steady state)df = Final d measured in hole (dsurf + rs) (cm) - should be within 1-2 cm of diHf - Final water depth in hole (Hf = D-df) (cm)MRi = Initial measuring reservoir reading (cm)Ti = Initial time to record measuring reservoir level drop (min.)MRf = Final measuring reservoir reading (cm)Tf = Final time to record measuring reservoir level drop (min.)∆ MR = Change in measuring reservoir level (cm)∆ T = Change in time for measuring reservoir water drop (min.)V = flow volume (cm3)

Ksat Data SheetPlot: Ksat-5 Conducted By: SJF
Location: Bingham, road Date: 4/12/10
Weather: sunny Temp: 60
Soil Series/Horizon: yellow brown (Herndon) Source of Water: tap
Plot hd r rs D Hi H/r di dsuri 1-ON 2-ON dsurf df Hf Mri Ti MRf Tf ∆ MR ∆ T V CF Q (cm3/min) Q (cm3/h) Ksat (cm/h) Ksat (cm/d) Ksat (in/h) Ksat (in/d)
1/Bt 40 3.0 10 50 15 5 35 25 yes 25 35 15 46.0 10:00:00 44.5 10:30:00 1.5 0:30:00 157.5 105 5.3 315.0 0.333 7.99 0.13 3.14
40 3.0 10 50 15 5 35 25 yes 25 35 15 44.5 10:30:00 43.4 11:00:00 1.1 0:30:00 115.5 105 3.9 231.0 0.244 5.86 0.10 2.31
40 3.0 10 50 15 5 35 25 yes 25 35 15 43.4 11:00:00 42.3 11:30:00 1.1 0:30:00 115.5 105 3.9 231.0 0.244 5.86 0.10 2.31
40 3.0 10 50 15 5 35 25 yes 25 35 15 42.3 11:30:00 41.6 12:00:00 0.7 0:30:00 73.5 105 2.4 147.0 0.155 3.73 0.06 1.47
40 3.0 10 50 15 5 35 25 yes 25 35 15 38.9 12:20:00 38.0 12:50:00 0.9 0:30:00 94.5 105 3.2 189.0 0.200 4.79 0.08 1.89
40 3.0 10 50 15 5 35 25 yes 25 35 15 38.0 12:50:00 37.3 13:20:00 0.7 0:30:00 73.5 105 2.5 147.0 0.155 3.73 0.06 1.47
40 3.0 10 50 15 5 35 25 yes 25 35 15 37.3 13:20:00 36.6 13:50:00 0.7 0:30:00 73.5 105 2.4 147.0 0.155 3.73 0.06 1.47
40 3.0 10 50 15 5 35 25 yes 25 35 15 36.6 13:50:00 35.9 14:20:00 0.7 0:30:00 73.5 105 2.5 147.0 0.155 3.73 0.06 1.47
0.1553 3.7268 0.0611 1.4673hd = Hole depth (cm)r = Radius of the hole (dia./2) (cm)rs = Distance between reference level and soil surface (cm)D = Distance from the hole bottom to the reference level (hd+rs) (cm)Hi = Initial desired water depth (head) in hole (cm)H/r = Ratio of head to radius of hole (must be ≥ 5)di = Constant-head tube setting, initial d measured in hole (di = D-Hi) (cm) - usually 1 cm less than calculated didsuri = Initial distance from water surface to ground (hd - Hi)1-ON = 3-way valve turned to 1-ON (CF = 20, multiply CF times ∆ MR to obtain volume of flow)2-ON = 3-way valve turned to 2-ON (CF = 105, multiply CF times ∆ MR to obtain volume of flow)dsurf = Final distance from water surface to ground (steady state)df = Final d measured in hole (dsurf + rs) (cm) - should be within 1-2 cm of diHf - Final water depth in hole (Hf = D-df) (cm)MRi = Initial measuring reservoir reading (cm)Ti = Initial time to record measuring reservoir level drop (min.)MRf = Final measuring reservoir reading (cm)Tf = Final time to record measuring reservoir level drop (min.)∆ MR = Change in measuring reservoir level (cm)∆ T = Change in time for measuring reservoir water drop (min.)V = flow volume (cm3)

Ksat Data SheetPlot: Ksat-6 Conducted By: SJF
Location: Bingham, road Date: 4/12/10
Weather: sunny Temp: 60
Soil Series/Horizon: ylw. brn. (Herndon)-swale Source of Water: tap
Plot hd r rs D Hi H/r di dsuri 1-ON 2-ON dsurf df Hf Mri Ti MRf Tf ∆ MR ∆ T V CFQ
(cm3/min) Q (cm3/h) Ksat (cm/h) Ksat (cm/d) Ksat (in/h) Ksat (in/d)
1/Bt 54 3.0 10 64 15 5 49 39 yes 39 49 15 44.3 10:15:00 43.8 10:45:00 0.5 0:30:00 52.5 105 1.8 105.0 0.111 2.66 0.04 1.05
54 3.0 10 64 15 5 49 39 yes 39 49 15 43.8 10:45:00 43.4 11:15:00 0.4 0:30:00 42 105 1.4 84.0 0.089 2.13 0.03 0.84
54 3.0 10 64 15 5 49 39 yes 39 49 15 43.4 11:15:00 43.2 11:45:00 0.2 0:30:00 21 105 0.7 42.0 0.044 1.06 0.02 0.42
54 3.0 10 64 15 5 49 39 yes 39 49 15 43.2 11:45:00 43.0 12:15:00 0.2 0:30:00 21 105 0.7 42.0 0.044 1.06 0.02 0.42
54 3.0 10 64 15 5 49 39 yes 39 49 15 43.0 12:15:00 42.8 12:45:00 0.2 0:30:00 21 105 0.7 42.0 0.044 1.06 0.02 0.42
54 3.0 10 64 15 5 49 39 yes 39 49 15 42.8 12:45:00 42.6 13:15:00 0.2 0:30:00 21 105 0.7 42.0 0.044 1.06 0.02 0.42
0.0444 1.0648 0.0175 0.4192hd = Hole depth (cm)r = Radius of the hole (dia./2) (cm)rs = Distance between reference level and soil surface (cm)D = Distance from the hole bottom to the reference level (hd+rs) (cm)Hi = Initial desired water depth (head) in hole (cm)H/r = Ratio of head to radius of hole (must be ≥ 5)di = Constant-head tube setting, initial d measured in hole (di = D-Hi) (cm) - usually 1 cm less than calculated didsuri = Initial distance from water surface to ground (hd - Hi)1-ON = 3-way valve turned to 1-ON (CF = 20, multiply CF times ∆ MR to obtain volume of flow)2-ON = 3-way valve turned to 2-ON (CF = 105, multiply CF times ∆ MR to obtain volume of flow)dsurf = Final distance from water surface to ground (steady state)df = Final d measured in hole (dsurf + rs) (cm) - should be within 1-2 cm of diHf - Final water depth in hole (Hf = D-df) (cm)MRi = Initial measuring reservoir reading (cm)Ti = Initial time to record measuring reservoir level drop (min.)MRf = Final measuring reservoir reading (cm)Tf = Final time to record measuring reservoir level drop (min.)∆ MR = Change in measuring reservoir level (cm)∆ T = Change in time for measuring reservoir water drop (min.)V = flow volume (cm 3)

Ksat Data SheetPlot: Ksat-7 Conducted By: SJF
Location: Bingham- orad Date: 4/23/10
Weather: Cloudy Temp: 60
Soil Series/Horizon: Ge Source of Water: tap
Plot hd r rs D Hi H/r di dsuri 1-ON 2-ON dsurf df Hf Mri Ti MRf Tf ∆ MR ∆ T V CF Q (cm3/min) Q (cm3/h) Ksat (cm/h)Ksat
(cm/d) Ksat (in/h) Ksat (in/d)
1/Bt 38 3.0 10 48 15 5 33 23 yes 23 33 15 45.9 10:08:00 44.5 10:38:00 1.4 0:30:00 147 105 4.9 294.0 0.311 7.45 0.12 2.93
38 3.0 10 48 15 5 33 23 yes 23 33 15 44.5 10:38:00 43.5 11:08:00 1.0 0:30:00 105 105 3.5 210.0 0.222 5.32 0.09 2.10
38 3.0 10 48 15 5 33 23 yes 23 33 15 43.5 11:08:00 43.1 11:38:00 0.4 0:30:00 42 105 1.4 84.0 0.089 2.13 0.03 0.84
38 3.0 10 48 15 5 33 23 yes 23 33 15 43.1 11:38:00 42.6 12:08:00 0.5 0:30:00 52.5 105 1.8 105.0 0.111 2.66 0.04 1.05
38 3.0 10 48 15 5 33 23 yes 23 33 15 42.6 12:08:00 41.8 12:38:00 0.8 0:30:00 84 105 2.8 168.0 0.177 4.26 0.07 1.68
38 3.0 10 48 15 5 33 23 yes 23 33 15 41.8 12:38:00 41.3 13:08:00 0.5 0:30:00 52.5 105 1.8 105.0 0.111 2.66 0.04 1.05
38 3.0 10 48 15 5 33 23 yes 23 33 15 41.3 1:08:00 40.8 1:38:00 0.5 0:30:00 52.5 105 1.8 105.0 0.111 2.66 0.04 1.05
38 3.0 10 48 15 5 33 23 yes 23 33 15 40.8 1:38:00 40.3 2:08:00 0.5 0:30:00 52.5 105 1.8 105.0 0.111 2.66 0.04 1.05hd = Hole depth (cm) 0.1109 2.66 0.04 1.05r = Radius of the hole (dia./2) (cm)rs = Distance between reference level and soil surface (cm)D = Distance from the hole bottom to the reference level (hd+rs) (cm)Hi = Initial desired water depth (head) in hole (cm)H/r = Ratio of head to radius of hole (must be ≥ 5)di = Constant-head tube setting, initial d measured in hole (di = D-Hi) (cm) - usually 1 cm less than calculated didsuri = Initial distance from water surface to ground (hd - Hi)1-ON = 3-way valve turned to 1-ON (CF = 20, multiply CF times ∆ MR to obtain volume of flow)2-ON = 3-way valve turned to 2-ON (CF = 105, multiply CF times ∆ MR to obtain volume of flow)dsurf = Final distance from water surface to ground (steady state)df = Final d measured in hole (dsurf + rs) (cm) - should be within 1-2 cm of diHf - Final water depth in hole (Hf = D-df) (cm)MRi = Initial measuring reservoir reading (cm)Ti = Initial time to record measuring reservoir level drop (min.)MRf = Final measuring reservoir reading (cm)Tf = Final time to record measuring reservoir level drop (min.)∆ MR = Change in measuring reservoir level (cm)∆ T = Change in time for measuring reservoir water drop (min.)V = flow volume (cm3)

Ksat Data SheetPlot: Ksat-8 Conducted By: SJF
Location: Bingham, New site Date: 4/13/10
Weather: sunny Temp: 65
Soil Series/Horizon: Pacolet Source of Water: tap
Plot hd r rs D Hi H/r di dsuri 1-ON 2-ON dsurf df Hf Mri Ti MRf Tf ∆ MR ∆ T V CF Q (cm3/min) Q (cm3/h) Ksat (cm/h) Ksat (cm/d) Ksat (in/h) Ksat (in/d)
1/Bt 47 3.0 11 58 15 5 43 32 yes 32 43 15 41.1 10:07:00 40.8 10:40:00 0.3 0:33:00 31.5 105 1.0 57.3 0.061 1.45 0.02 0.57
47 3.0 11 58 15 5 43 32 yes 32 43 15 40.8 10:40:00 40.5 11:10:00 0.3 0:30:00 31.5 105 1.0 63.0 0.067 1.60 0.03 0.63
47 3.0 11 58 15 5 43 32 yes 32 43 15 40.5 11:10:00 40.2 11:40:00 0.3 0:30:00 31.5 105 1.0 63.0 0.067 1.60 0.03 0.63
47 3.0 11 58 15 5 43 32 yes 32 43 15 40.2 11:40:00 39.9 12:10:00 0.3 0:30:00 31.5 105 1.1 63.0 0.067 1.60 0.03 0.63
0.0650 1.5609 0.0256 0.6145hd = Hole depth (cm)r = Radius of the hole (dia./2) (cm)rs = Distance between reference level and soil surface (cm)D = Distance from the hole bottom to the reference level (hd+rs) (cm)Hi = Initial desired water depth (head) in hole (cm)H/r = Ratio of head to radius of hole (must be ≥ 5)di = Constant-head tube setting, initial d measured in hole (di = D-Hi) (cm) - usually 1 cm less than calculated didsuri = Initial distance from water surface to ground (hd - Hi)1-ON = 3-way valve turned to 1-ON (CF = 20, multiply CF times ∆ MR to obtain volume of flow)2-ON = 3-way valve turned to 2-ON (CF = 105, multiply CF times ∆ MR to obtain volume of flow)dsurf = Final distance from water surface to ground (steady state)df = Final d measured in hole (dsurf + rs) (cm) - should be within 1-2 cm of diHf - Final water depth in hole (Hf = D-df) (cm)MRi = Initial measuring reservoir reading (cm)Ti = Initial time to record measuring reservoir level drop (min.)MRf = Final measuring reservoir reading (cm)Tf = Final time to record measuring reservoir level drop (min.)∆ MR = Change in measuring reservoir level (cm)∆ T = Change in time for measuring reservoir water drop (min.)V = flow volume (cm3)

Ksat Data SheetPlot: Ksat-9 Conducted By: SJF
Location: Bingham, New site Date: 4/13/10
Weather: sunny Temp: 65
Soil Series/Horizon: Pacolet Source of Water: tap
Plot hd r rs D Hi H/r di dsuri 1-ON 2-ON dsurf df Hf Mri Ti MRf Tf ∆ MR ∆ T V CFQ
(cm3/min) Q (cm3/h) Ksat (cm/h) Ksat (cm/d) Ksat (in/h) Ksat (in/d)
1/Bt 42 3.0 10 52 15 5 37 27 yes 27 37 15 44.0 10:27:00 43.7 11:00:00 0.3 0:33:00 31.5 105 1.0 57.3 0.061 1.45 0.02 0.57
42 3.0 10 52 15 5 37 27 yes 27 37 15 43.7 11:00:00 43.3 11:30:00 0.4 0:30:00 42 105 1.4 84.0 0.089 2.13 0.03 0.84
42 3.0 10 52 15 5 37 27 yes 27 37 15 43.3 11:30:00 42.9 12:00:00 0.4 0:30:00 42 105 1.4 84.0 0.089 2.13 0.03 0.84
42 3.0 10 52 15 5 37 27 yes 27 37 15 42.9 12:00:00 42.5 12:30:00 0.4 0:30:00 42 105 1.4 84.0 0.089 2.13 0.03 0.84
0.0887 2.1296 0.0349 0.8384hd = Hole depth (cm)r = Radius of the hole (dia./2) (cm)rs = Distance between reference level and soil surface (cm)D = Distance from the hole bottom to the reference level (hd+rs) (cm)Hi = Initial desired water depth (head) in hole (cm)H/r = Ratio of head to radius of hole (must be ≥ 5)di = Constant-head tube setting, initial d measured in hole (di = D-Hi) (cm) - usually 1 cm less than calculated didsuri = Initial distance from water surface to ground (hd - Hi)1-ON = 3-way valve turned to 1-ON (CF = 20, multiply CF times ∆ MR to obtain volume of flow)2-ON = 3-way valve turned to 2-ON (CF = 105, multiply CF times ∆ MR to obtain volume of flow)dsurf = Final distance from water surface to ground (steady state)df = Final d measured in hole (dsurf + rs) (cm) - should be within 1-2 cm of diHf - Final water depth in hole (Hf = D-df) (cm)MRi = Initial measuring reservoir reading (cm)Ti = Initial time to record measuring reservoir level drop (min.)MRf = Final measuring reservoir reading (cm)Tf = Final time to record measuring reservoir level drop (min.)∆ MR = Change in measuring reservoir level (cm)∆ T = Change in time for measuring reservoir water drop (min.)V = flow volume (cm 3)

Ksat Data SheetPlot: Ksat-10 Conducted By: SJF
Location: Bingham - new site Date: 4/13/10
Weather: sunny Temp: 65
Soil Series/Horizon: Pacolet Source of Water: tap
Plot hd r rs D Hi H/r di dsuri 1-ON 2-ON dsurf df Hf Mri Ti MRf Tf ∆ MR ∆ T V CFQ
(cm3/min) Q (cm3/h) Ksat (cm/h) Ksat (cm/d) Ksat (in/h) Ksat (in/d)
1/Bt 41 3.0 10 51 15 5 36 26 yes 26 36 15 45.9 10:38:00 44.8 11:15:00 1.1 0:37:00 115.5 105 3.1 187.3 0.198 4.75 0.08 1.87
41 3.0 10 51 15 5 36 26 yes 26 36 15 44.8 11:15:00 44.2 11:45:00 0.6 0:30:00 63 105 2.1 126.0 0.133 3.19 0.05 1.26
41 3.0 10 51 15 5 36 26 yes 26 36 15 44.2 11:45:00 43.9 12:15:00 0.3 0:30:00 31.5 105 1.1 63.0 0.067 1.60 0.03 0.63
41 3.0 10 51 15 5 36 26 yes 26 36 15 43.9 12:15:00 43.6 12:45:00 0.3 0:30:00 31.5 105 1.0 63.0 0.067 1.60 0.03 0.63
41 3.0 10 51 15 5 36 26 yes 26 36 15 43.6 12:45:00 43.3 13:15:00 0.3 0:30:00 31.5 105 1.1 63.0 0.067 1.60 0.03 0.63
0.0666 1.5972 0.0262 0.6288hd = Hole depth (cm)r = Radius of the hole (dia./2) (cm)rs = Distance between reference level and soil surface (cm)D = Distance from the hole bottom to the reference level (hd+rs) (cm)Hi = Initial desired water depth (head) in hole (cm)H/r = Ratio of head to radius of hole (must be ≥ 5)di = Constant-head tube setting, initial d measured in hole (di = D-Hi) (cm) - usually 1 cm less than calculated didsuri = Initial distance from water surface to ground (hd - Hi)1-ON = 3-way valve turned to 1-ON (CF = 20, multiply CF times ∆ MR to obtain volume of flow)2-ON = 3-way valve turned to 2-ON (CF = 105, multiply CF times ∆ MR to obtain volume of flow)dsurf = Final distance from water surface to ground (steady state)df = Final d measured in hole (dsurf + rs) (cm) - should be within 1-2 cm of diHf - Final water depth in hole (Hf = D-df) (cm)MRi = Initial measuring reservoir reading (cm)Ti = Initial time to record measuring reservoir level drop (min.)MRf = Final measuring reservoir reading (cm)Tf = Final time to record measuring reservoir level drop (min.)∆ MR = Change in measuring reservoir level (cm)∆ T = Change in time for measuring reservoir water drop (min.)V = flow volume (cm 3)

Ksat Data SheetPlot: Ksat-11 Conducted By: SJF
Location: behind pump house Date: 4/13/10
Weather: sunny Temp: 65
Soil Series/Horizon: yellow brown transition Source of Water: tap
Plot hd r rs D Hi H/r di dsuri 1-ON 2-ON dsurf df Hf Mri Ti MRf Tf ∆ MR ∆ T V CFQ
(cm3/min) Q (cm3/h) Ksat (cm/h) Ksat (cm/d) Ksat (in/h) Ksat (in/d)
1/Bt or Bc ? 62 3.0 10 72 15 5 57 47 yes 47 57 15 36.7 12:30:00 36.3 13:05:00 0.4 0:35:00 42 105 1.2 72.0 0.076 1.83 0.03 0.72
62 3.0 10 72 15 5 57 47 yes 47 57 15 36.3 13:05:00 36.2 13:35:00 0.1 0:30:00 10.5 105 0.3 21.0 0.022 0.53 0.01 0.21
62 3.0 10 72 15 5 57 47 yes 47 57 15 36.2 13:35:00 36.1 14:05:00 0.1 0:30:00 10.5 105 0.4 21.0 0.022 0.53 0.01 0.21
62 3.0 10 72 15 5 57 47 yes 47 57 15 36.1 14:05:00 36.0 14:35:00 0.1 0:30:00 10.5 105 0.4 21.0 0.022 0.53 0.01 0.21
62 3.0 10 72 15 5 57 47 yes 47 57 15 36.0 14:35:00 35.8 15:05:00 0.2 0:30:00 21 105 0.7 42.0 0.044 1.06 0.02 0.42
62 3.0 10 72 15 5 57 47 yes 47 57 15 35.8 15:05:00 35.7 15:35:00 0.1 0:30:00 10.5 105 0.3 21.0 0.022 0.53 0.01 0.21
0.0266 0.6389 0.0105 0.2515hd = Hole depth (cm)r = Radius of the hole (dia./2) (cm)rs = Distance between reference level and soil surface (cm)D = Distance from the hole bottom to the reference level (hd+rs) (cm)Hi = Initial desired water depth (head) in hole (cm)H/r = Ratio of head to radius of hole (must be ≥ 5)di = Constant-head tube setting, initial d measured in hole (di = D-Hi) (cm) - usually 1 cm less than calculated didsuri = Initial distance from water surface to ground (hd - Hi)1-ON = 3-way valve turned to 1-ON (CF = 20, multiply CF times ∆ MR to obtain volume of flow)2-ON = 3-way valve turned to 2-ON (CF = 105, multiply CF times ∆ MR to obtain volume of flow)dsurf = Final distance from water surface to ground (steady state)df = Final d measured in hole (dsurf + rs) (cm) - should be within 1-2 cm of diHf - Final water depth in hole (Hf = D-df) (cm)MRi = Initial measuring reservoir reading (cm)Ti = Initial time to record measuring reservoir level drop (min.)MRf = Final measuring reservoir reading (cm)Tf = Final time to record measuring reservoir level drop (min.)∆ MR = Change in measuring reservoir level (cm)∆ T = Change in time for measuring reservoir water drop (min.)V = flow volume (cm 3)

Ksat Data SheetPlot: Ksat-12 Conducted By: SJF
Location: behind lagoon Date: 4/13/10
Weather: sunny Temp: 65
Soil Series/Horizon: Bt/Bc yellow brown, transition Source of Water: tap
Plot hd r rs D Hi H/r di dsuri 1-ON 2-ON dsurf df Hf Mri Ti MRf Tf ∆ MR ∆ T V CF Q (cm3/min) Q (cm3/h) Ksat (cm/h) Ksat (cm/d) Ksat (in/h) Ksat (in/d)
1/Bt or Bc? 58 3.0 10 68 15 5 53 43 yes 43 53 15 39.6 12:50:00 39.3 13:20:00 0.3 0:30:00 31.5 105 1.1 63.0 0.067 1.60 0.03 0.63
58 3.0 10 68 15 5 53 43 yes 43 53 15 39.3 1:20:00 39.1 1:50:00 0.2 0:30:00 21 105 0.7 42.0 0.044 1.06 0.02 0.42
58 3.0 10 68 15 5 53 43 yes 43 53 15 39.1 1:50:00 38.8 2:20:00 0.3 0:30:00 31.5 105 1.1 63.0 0.067 1.60 0.03 0.63
58 3.0 10 68 15 5 53 43 yes 43 53 15 38.8 2:20:00 38.4 2:50:00 0.4 0:30:00 42 105 1.4 84.0 0.089 2.13 0.03 0.84
58 3.0 10 68 15 5 53 43 yes 43 53 15 38.4 2:50:00 38.0 3:20:00 0.4 0:30:00 42 105 1.4 84.0 0.089 2.13 0.03 0.84
0.0813 1.9522 0.0320 0.7686hd = Hole depth (cm)r = Radius of the hole (dia./2) (cm)rs = Distance between reference level and soil surface (cm)D = Distance from the hole bottom to the reference level (hd+rs) (cm)Hi = Initial desired water depth (head) in hole (cm)H/r = Ratio of head to radius of hole (must be ≥ 5)di = Constant-head tube setting, initial d measured in hole (di = D-Hi) (cm) - usually 1 cm less than calculated didsuri = Initial distance from water surface to ground (hd - Hi)1-ON = 3-way valve turned to 1-ON (CF = 20, multiply CF times ∆ MR to obtain volume of flow)2-ON = 3-way valve turned to 2-ON (CF = 105, multiply CF times ∆ MR to obtain volume of flow)dsurf = Final distance from water surface to ground (steady state)df = Final d measured in hole (dsurf + rs) (cm) - should be within 1-2 cm of diHf - Final water depth in hole (Hf = D-df) (cm)MRi = Initial measuring reservoir reading (cm)Ti = Initial time to record measuring reservoir level drop (min.)MRf = Final measuring reservoir reading (cm)Tf = Final time to record measuring reservoir level drop (min.)∆ MR = Change in measuring reservoir level (cm)∆ T = Change in time for measuring reservoir water drop (min.)V = flow volume (cm3)

Ksat Data SheetPlot: Ksat-13 Conducted By: SJF
Location: across wetlands Date: 4/13/10
Weather: sunny Temp: 65
Soil Series/Horizon: Bt/Bc yellow brown red mottles Source of Water: tap
Plot hd r rs D Hi H/r di dsuri 1-ON 2-ON dsurf df Hf Mri Ti MRf Tf ∆ MR ∆ T V CF Q (cm3/min) Q (cm3/h) Ksat (cm/h) Ksat (cm/d) Ksat (in/h) Ksat (in/d)
1/ Bt or Bc 41 3.0 12 53 15 5 38 26 yes 26 38 15 40.5 1:40:00 40.1 2:10:00 0.4 0:30:00 42 105 1.4 84.0 0.089 2.13 0.03 0.84
41 3.0 12 53 15 5 38 26 yes 26 38 15 40.1 2:10:00 40.0 2:40:00 0.1 0:30:00 10.5 105 0.4 21.0 0.022 0.53 0.01 0.21
41 3.0 12 53 15 5 38 26 yes 26 38 15 40.0 2:40:00 39.9 3:10:00 0.1 0:30:00 10.5 105 0.4 21.0 0.022 0.53 0.01 0.21
41 3.0 12 53 15 5 38 26 yes 26 38 15 39.9 3:10:00 39.8 3:40:00 0.1 0:30:00 10.5 105 0.4 21.0 0.022 0.53 0.01 0.21
0.0222 0.5324 0.0087 0.2096hd = Hole depth (cm)r = Radius of the hole (dia./2) (cm)rs = Distance between reference level and soil surface (cm)D = Distance from the hole bottom to the reference level (hd+rs) (cm)Hi = Initial desired water depth (head) in hole (cm)H/r = Ratio of head to radius of hole (must be ≥ 5)di = Constant-head tube setting, initial d measured in hole (di = D-Hi) (cm) - usually 1 cm less than calculated didsuri = Initial distance from water surface to ground (hd - Hi)1-ON = 3-way valve turned to 1-ON (CF = 20, multiply CF times ∆ MR to obtain volume of flow)2-ON = 3-way valve turned to 2-ON (CF = 105, multiply CF times ∆ MR to obtain volume of flow)dsurf = Final distance from water surface to ground (steady state)df = Final d measured in hole (dsurf + rs) (cm) - should be within 1-2 cm of diHf - Final water depth in hole (Hf = D-df) (cm)MRi = Initial measuring reservoir reading (cm)Ti = Initial time to record measuring reservoir level drop (min.)MRf = Final measuring reservoir reading (cm)Tf = Final time to record measuring reservoir level drop (min.)∆ MR = Change in measuring reservoir level (cm)∆ T = Change in time for measuring reservoir water drop (min.)V = flow volume (cm3)

Ksat Data SheetPlot: Ksat-14 Conducted By: SJF
Location: Bingham- front road Date: 4/23/10
Weather: cloudy Temp: 60
Soil Series/Horizon: wet silty clay Source of Water: tap
Plot hd r rs D Hi H/r di dsuri 1-ON 2-ON dsurf df Hf Mri Ti MRf Tf ∆ MR ∆ T V CF Q (cm3/min) Q (cm3/h) Ksat (cm/h) Ksat (cm/d) Ksat (in/h) Ksat (in/d)
1/Bt 35 3.0 10 45 15 5 30 20 yes 20 30 15 43.4 10:28:00 43.0 10:58:00 0.4 0:30:00 42 105 1.4 84.0 0.089 2.13 0.03 0.84
35 3.0 10 45 15 5 30 20 yes 20 30 15 43.0 10:58:00 42.6 11:28:00 0.4 0:30:00 42 105 1.4 84.0 0.089 2.13 0.03 0.84
35 3.0 10 45 15 5 30 20 yes 20 30 15 42.6 11:28:00 41.6 12:58:00 1.0 1:30:00 105 105 1.2 70.0 0.074 1.77 0.03 0.70
35 3.0 10 45 15 5 30 20 yes 20 30 15 41.6 12:58:00 41.3 13:28:00 0.3 0:30:00 31.5 105 1.1 63.0 0.067 1.60 0.03 0.63
35 3.0 10 45 15 5 30 20 yes 20 30 15 41.3 1:28:00 41.0 1:58:00 0.3 0:30:00 31.5 105 1.0 63.0 0.067 1.60 0.03 0.63
0.0666 1.5972 0.0262 0.6288hd = Hole depth (cm)r = Radius of the hole (dia./2) (cm)rs = Distance between reference level and soil surface (cm)D = Distance from the hole bottom to the reference level (hd+rs) (cm)Hi = Initial desired water depth (head) in hole (cm)H/r = Ratio of head to radius of hole (must be ≥ 5)di = Constant-head tube setting, initial d measured in hole (di = D-Hi) (cm) - usually 1 cm less than calculated didsuri = Initial distance from water surface to ground (hd - Hi)1-ON = 3-way valve turned to 1-ON (CF = 20, multiply CF times ∆ MR to obtain volume of flow)2-ON = 3-way valve turned to 2-ON (CF = 105, multiply CF times ∆ MR to obtain volume of flow)dsurf = Final distance from water surface to ground (steady state)df = Final d measured in hole (dsurf + rs) (cm) - should be within 1-2 cm of diHf - Final water depth in hole (Hf = D-df) (cm)MRi = Initial measuring reservoir reading (cm)Ti = Initial time to record measuring reservoir level drop (min.)MRf = Final measuring reservoir reading (cm)Tf = Final time to record measuring reservoir level drop (min.)∆ MR = Change in measuring reservoir level (cm)∆ T = Change in time for measuring reservoir water drop (min.)V = flow volume (cm3)

Ksat Data SheetPlot: Ksat-15 Conducted By: SJF
Location: fence Date: 4/27/10
Weather: sunny Temp: 65
Soil Series/Horizon: Ge (shallow) Source of Water: tap
Plot hd r rs D Hi H/r di dsuri 1-ON 2-ON dsurf df Hf Mri Ti MRf Tf ∆ MR ∆ T V CF Q (cm3/min) Q (cm3/h) Ksat (cm/h) Ksat (cm/d) Ksat (in/h) Ksat (in/d)
1/Bt 46 3.0 10 56 15 5 41 31 yes 31 41 15 41.7 11:08:00 38.9 11:38:00 2.8 0:30:00 294 105 9.8 588.0 0.621 14.91 0.24 5.87
46 3.0 10 56 15 5 41 31 yes 31 41 15 38.9 11:38:00 35.8 12:08:00 3.1 0:30:00 325.5 105 10.9 651.0 0.688 16.50 0.27 6.50
46 3.0 10 56 15 5 41 31 yes 31 41 15 35.8 12:08:00 33.5 12:38:00 2.3 0:30:00 241.5 105 8.0 483.0 0.510 12.25 0.20 4.82
46 3.0 10 56 15 5 41 31 yes 31 41 15 33.5 12:38:00 31.3 13:08:00 2.2 0:30:00 231 105 7.7 462.0 0.488 11.71 0.19 4.61
46 3.0 10 56 15 5 41 31 yes 31 41 15 31.3 13:08:00 29.0 13:38:00 2.3 0:30:00 241.5 105 8.1 483.0 0.510 12.25 0.20 4.82
0.5028 12.0678 0.1980 4.7511hd = Hole depth (cm)r = Radius of the hole (dia./2) (cm)rs = Distance between reference level and soil surface (cm)D = Distance from the hole bottom to the reference level (hd+rs) (cm)Hi = Initial desired water depth (head) in hole (cm)H/r = Ratio of head to radius of hole (must be ≥ 5)di = Constant-head tube setting, initial d measured in hole (di = D-Hi) (cm) - usually 1 cm less than calculated didsuri = Initial distance from water surface to ground (hd - Hi)1-ON = 3-way valve turned to 1-ON (CF = 20, multiply CF times ∆ MR to obtain volume of flow)2-ON = 3-way valve turned to 2-ON (CF = 105, multiply CF times ∆ MR to obtain volume of flow)dsurf = Final distance from water surface to ground (steady state)df = Final d measured in hole (dsurf + rs) (cm) - should be within 1-2 cm of diHf - Final water depth in hole (Hf = D-df) (cm)MRi = Initial measuring reservoir reading (cm)Ti = Initial time to record measuring reservoir level drop (min.)MRf = Final measuring reservoir reading (cm)Tf = Final time to record measuring reservoir level drop (min.)∆ MR = Change in measuring reservoir level (cm)∆ T = Change in time for measuring reservoir water drop (min.)V = flow volume (cm3)

Ksat Data SheetPlot: Ksat-16 Conducted By: SJF
Location: W corner 'old site' Date: 4/27/10
Weather: sunny/cloudy Temp: 65
Soil Series/Horizon: Slope/transition yellow brown Source of Water: tap
Plot hd r rs D Hi H/r di dsuri 1-ON 2-ON dsurf df Hf Mri Ti MRf Tf ∆ MR ∆ T V CF Q (cm3/min) Q (cm3/h) Ksat (cm/h) Ksat (cm/d) Ksat (in/h) Ksat (in/d)
1/Bt 50 3.0 10 60 15 5 45 35 yes 35 45 15 43.3 11:28:00 41.5 11:58:00 1.8 0:30:00 189 105 6.3 378.0 0.399 9.58 0.16 3.77
50 3.0 10 60 15 5 45 35 yes 35 45 15 41.5 11:58:00 41.3 12:28:00 0.2 0:30:00 21 105 0.7 42.0 0.044 1.06 0.02 0.42
50 3.0 10 60 15 5 45 35 yes 35 45 15 41.3 12:28:00 40.5 12:58:00 0.8 0:30:00 84 105 2.8 168.0 0.177 4.26 0.07 1.68
50 3.0 10 60 15 5 45 35 yes 35 45 15 40.5 12:58:00 39.7 13:28:00 0.8 0:30:00 84 105 2.8 168.0 0.177 4.26 0.07 1.68
50 3.0 10 60 15 5 45 35 yes 35 45 15 39.7 13:28:00 38.9 13:58:00 0.8 0:30:00 84 105 2.8 168.0 0.177 4.26 0.07 1.68
0.1775 4.2592 0.0699 1.6769hd = Hole depth (cm)r = Radius of the hole (dia./2) (cm)rs = Distance between reference level and soil surface (cm)D = Distance from the hole bottom to the reference level (hd+rs) (cm)Hi = Initial desired water depth (head) in hole (cm)H/r = Ratio of head to radius of hole (must be ≥ 5)di = Constant-head tube setting, initial d measured in hole (di = D-Hi) (cm) - usually 1 cm less than calculated didsuri = Initial distance from water surface to ground (hd - Hi)1-ON = 3-way valve turned to 1-ON (CF = 20, multiply CF times ∆ MR to obtain volume of flow)2-ON = 3-way valve turned to 2-ON (CF = 105, multiply CF times ∆ MR to obtain volume of flow)dsurf = Final distance from water surface to ground (steady state)df = Final d measured in hole (dsurf + rs) (cm) - should be within 1-2 cm of diHf - Final water depth in hole (Hf = D-df) (cm)MRi = Initial measuring reservoir reading (cm)Ti = Initial time to record measuring reservoir level drop (min.)MRf = Final measuring reservoir reading (cm)Tf = Final time to record measuring reservoir level drop (min.)∆ MR = Change in measuring reservoir level (cm)∆ T = Change in time for measuring reservoir water drop (min.)V = flow volume (cm3)

Ksat Data SheetPlot: Ksat-17 Conducted By: SJF
Location: inside fence Date: 4/27/10
Weather: cloudy Temp: 65
Soil Series/Horizon: yellow brown (shallow) Source of Water: tap
Plot hd r rs D Hi H/r di dsuri 1-ON 2-ON dsurf df Hf Mri Ti MRf Tf ∆ MR ∆ T V CF Q (cm3/min) Q (cm3/h) Ksat (cm/h) Ksat (cm/d) Ksat (in/h) Ksat (in/d)
1/Bt 42 3.0 10 52 15 5 37 27 yes 27 37 15 40.9 11:50:00 40.5 12:20:00 0.4 0:30:00 42 105 1.4 84.0 0.089 2.13 0.03 0.84
42 3.0 10 52 15 5 37 27 yes 27 37 15 40.5 12:20:00 40.1 12:50:00 0.4 0:30:00 42 105 1.4 84.0 0.089 2.13 0.03 0.84
42 3.0 10 52 15 5 37 27 yes 27 37 15 40.1 12:50:00 39.7 13:20:00 0.4 0:30:00 42 105 1.4 84.0 0.089 2.13 0.03 0.84
42 3.0 10 52 15 5 37 27 yes 27 37 15 39.7 13:20:00 39.4 13:50:00 0.3 0:30:00 31.5 105 1.1 63.0 0.067 1.60 0.03 0.63
0.0832 1.9965 0.0328 0.7860hd = Hole depth (cm)r = Radius of the hole (dia./2) (cm)rs = Distance between reference level and soil surface (cm)D = Distance from the hole bottom to the reference level (hd+rs) (cm)Hi = Initial desired water depth (head) in hole (cm)H/r = Ratio of head to radius of hole (must be ≥ 5)di = Constant-head tube setting, initial d measured in hole (di = D-Hi) (cm) - usually 1 cm less than calculated didsuri = Initial distance from water surface to ground (hd - Hi)1-ON = 3-way valve turned to 1-ON (CF = 20, multiply CF times ∆ MR to obtain volume of flow)2-ON = 3-way valve turned to 2-ON (CF = 105, multiply CF times ∆ MR to obtain volume of flow)dsurf = Final distance from water surface to ground (steady state)df = Final d measured in hole (dsurf + rs) (cm) - should be within 1-2 cm of diHf - Final water depth in hole (Hf = D-df) (cm)MRi = Initial measuring reservoir reading (cm)Ti = Initial time to record measuring reservoir level drop (min.)MRf = Final measuring reservoir reading (cm)Tf = Final time to record measuring reservoir level drop (min.)∆ MR = Change in measuring reservoir level (cm)∆ T = Change in time for measuring reservoir water drop (min.)V = flow volume (cm3)

Ksat Data SheetPlot: Ksat-18 Conducted By: SJF
Location: Old site Date: 4/27/10
Weather: cloudy Temp: 65
Soil Series/Horizon: Bt Pacolet Source of Water: tap
Plot hd r rs D Hi H/r di dsuri 1-ON 2-ON dsurf df Hf Mri Ti MRf Tf ∆ MR ∆ T V CF Q (cm3/min) Q (cm3/h) Ksat (cm/h) Ksat (cm/d) Ksat (in/h) Ksat (in/d)
1 42 3.0 10 52 15 5 37 27 yes 27 37 15 24.2 2:34:00 23.6 3:04:00 0.6 0:30:00 63 105 2.1 126.0 0.133 3.19 0.05 1.26
42 3.0 10 52 15 5 37 27 yes 27 37 15 23.6 3:04:00 23.0 3:34:00 0.6 0:30:00 63 105 2.1 126.0 0.133 3.19 0.05 1.26
42 3.0 10 52 15 5 37 27 yes 27 37 15 23.0 3:34:00 22.4 4:04:00 0.6 0:30:00 63 105 2.1 126.0 0.133 3.19 0.05 1.26
42 3.0 10 52 15 5 37 27 yes 27 37 15 22.4 4:04:00 21.8 4:34:00 0.6 0:30:00 63 105 2.1 126.0 0.133 3.19 0.05 1.26
0.1331 3.1944 0.0524 1.2576hd = Hole depth (cm)r = Radius of the hole (dia./2) (cm)rs = Distance between reference level and soil surface (cm)D = Distance from the hole bottom to the reference level (hd+rs) (cm)Hi = Initial desired water depth (head) in hole (cm)H/r = Ratio of head to radius of hole (must be ≥ 5)di = Constant-head tube setting, initial d measured in hole (di = D-Hi) (cm) - usually 1 cm less than calculated didsuri = Initial distance from water surface to ground (hd - Hi)1-ON = 3-way valve turned to 1-ON (CF = 20, multiply CF times ∆ MR to obtain volume of flow)2-ON = 3-way valve turned to 2-ON (CF = 105, multiply CF times ∆ MR to obtain volume of flow)dsurf = Final distance from water surface to ground (steady state)df = Final d measured in hole (dsurf + rs) (cm) - should be within 1-2 cm of diHf - Final water depth in hole (Hf = D-df) (cm)MRi = Initial measuring reservoir reading (cm)Ti = Initial time to record measuring reservoir level drop (min.)MRf = Final measuring reservoir reading (cm)Tf = Final time to record measuring reservoir level drop (min.)∆ MR = Change in measuring reservoir level (cm)∆ T = Change in time for measuring reservoir water drop (min.)V = flow volume (cm3)

Ksat Data SheetPlot: Ksat-19 Conducted By: SJF
Location: Grounds Date: 4/27/10
Weather: cloudy Temp: 65
Soil Series/Horizon: Ud Source of Water: tap
Plot hd r rs D Hi H/r di dsuri 1-ON 2-ON dsurf df Hf Mri Ti MRf Tf ∆ MR ∆ T V CF Q (cm3/min) Q (cm3/h) Ksat (cm/h) Ksat (cm/d) Ksat (in/h) Ksat (in/d)
1/Ud 33 3.0 10 43 15 5 28 18 yes 18 28 15 36.7 2:49:00 36.3 3:19:00 0.4 0:30:00 42 105 1.4 84.0 0.089 2.13 0.03 0.84
33 3.0 10 43 15 5 28 18 yes 18 28 15 36.3 3:19:00 36.2 3:49:00 0.1 0:30:00 10.5 105 0.3 21.0 0.022 0.53 0.01 0.21
33 3.0 10 43 15 5 28 18 yes 18 28 15 36.2 3:49:00 36.1 4:19:00 0.1 0:30:00 10.5 105 0.4 21.0 0.022 0.53 0.01 0.21
33 3.0 10 43 15 5 28 18 yes 18 28 15 36.1 4:19:00 36.0 4:49:00 0.1 0:30:00 10.5 105 0.4 21.0 0.022 0.53 0.01 0.21
0.0222 0.5324 0.0087 0.2096hd = Hole depth (cm)r = Radius of the hole (dia./2) (cm)rs = Distance between reference level and soil surface (cm)D = Distance from the hole bottom to the reference level (hd+rs) (cm)Hi = Initial desired water depth (head) in hole (cm)H/r = Ratio of head to radius of hole (must be ≥ 5)di = Constant-head tube setting, initial d measured in hole (di = D-Hi) (cm) - usually 1 cm less than calculated didsuri = Initial distance from water surface to ground (hd - Hi)1-ON = 3-way valve turned to 1-ON (CF = 20, multiply CF times ∆ MR to obtain volume of flow)2-ON = 3-way valve turned to 2-ON (CF = 105, multiply CF times ∆ MR to obtain volume of flow)dsurf = Final distance from water surface to ground (steady state)df = Final d measured in hole (dsurf + rs) (cm) - should be within 1-2 cm of diHf - Final water depth in hole (Hf = D-df) (cm)MRi = Initial measuring reservoir reading (cm)Ti = Initial time to record measuring reservoir level drop (min.)MRf = Final measuring reservoir reading (cm)Tf = Final time to record measuring reservoir level drop (min.)∆ MR = Change in measuring reservoir level (cm)∆ T = Change in time for measuring reservoir water drop (min.)V = flow volume (cm3)

Ksat Data SheetPlot: Ksat-20 Conducted By: SJF
Location: Neighbor fence Date: 4/27/10
Weather: cloudy Temp: 65
Soil Series/Horizon: transition/yellow brown Source of Water: tap
Plot hd r rs D Hi H/r di dsuri 1-ON 2-ON dsurf df Hf Mri Ti MRf Tf ∆ MR ∆ T V CF Q (cm3/min) Q (cm3/h) Ksat (cm/h) Ksat (cm/d) Ksat (in/h) Ksat (in/d)
1/Bt 46 3.0 10 56 15 5 41 31 yes 31 41 15 35.9 3:00:00 35.5 4:00:00 0.4 1:00:00 42 105 0.7 42.0 0.044 1.06 0.02 0.42
46 3.0 10 56 15 5 41 31 yes 31 41 15 34.4 4:00:00 33.9 4:30:00 0.5 0:30:00 52.5 105 1.8 105.0 0.111 2.66 0.04 1.05
46 3.0 10 56 15 5 41 31 yes 31 41 15 33.9 4:30:00 33.4 5:00:00 0.5 0:30:00 52.5 105 1.8 105.0 0.111 2.66 0.04 1.05
0.0887 2.1296 0.0349 0.8384hd = Hole depth (cm)r = Radius of the hole (dia./2) (cm)rs = Distance between reference level and soil surface (cm)D = Distance from the hole bottom to the reference level (hd+rs) (cm)Hi = Initial desired water depth (head) in hole (cm)H/r = Ratio of head to radius of hole (must be ≥ 5)di = Constant-head tube setting, initial d measured in hole (di = D-Hi) (cm) - usually 1 cm less than calculated didsuri = Initial distance from water surface to ground (hd - Hi)1-ON = 3-way valve turned to 1-ON (CF = 20, multiply CF times ∆ MR to obtain volume of flow)2-ON = 3-way valve turned to 2-ON (CF = 105, multiply CF times ∆ MR to obtain volume of flow)dsurf = Final distance from water surface to ground (steady state)df = Final d measured in hole (dsurf + rs) (cm) - should be within 1-2 cm of diHf - Final water depth in hole (Hf = D-df) (cm)MRi = Initial measuring reservoir reading (cm)Ti = Initial time to record measuring reservoir level drop (min.)MRf = Final measuring reservoir reading (cm)Tf = Final time to record measuring reservoir level drop (min.)∆ MR = Change in measuring reservoir level (cm)∆ T = Change in time for measuring reservoir water drop (min.)V = flow volume (cm3)

Saturated Hydraulic Conductivity Data - DRAFT (UNC Bingham)IB* Soil Series Horizon Soil Area Depth (cm) Depth (in) Ksat (cm/hr) Ksat (in/hr) Gpd/ft2 SHWT (in)
New Site1 Ge Bt 1 48.0 18.9 0.04 0.02 0.25 >84 in
1a Ge BC 1 99.0 39.0 0.73 0.29 4.31 >84 in2 Ge Bt 1 43.0 16.9 0.03 0.01 0.15 >84 in
2a Ge BC 1 60.0 23.6 0.11 0.04 0.66 >84 in 16 hr test3 Ge Bt 1 52.0 20.5 0.12 0.05 0.70 >84 in4 Ge (shallow) Bt 1 47.0 18.5 0.09 0.03 0.52 >84 in5 Herndon Bt 2 40.0 15.7 0.16 0.06 0.91 >84 in6 Herndon (swale) Bt 2 54.0 21.3 0.04 0.02 0.26 >84 in7 Ge Bt 1 38.0 15.0 0.11 0.04 0.65 >84 in
14 (new) Herndon (swale) Bt 3 35.0 13.8 0.07 0.03 0.39 ~24-30 inOld Site
8 Ge Bt 1 47.0 18.5 0.07 0.03 0.38 >84 in9 Ge Bt 1 42.0 16.5 0.09 0.03 0.52 >84 in
10 Ge Bt 1 41.0 16.1 0.07 0.03 0.39 >84 in11 Herndon Bt 2 62.0 24.4 0.03 0.01 0.16 >36 in12 Herndon Bt 2 58.0 22.8 0.08 0.03 0.48 >36 in13 Herndon Bt 2 41.0 16.1 0.02 0.01 0.13 >36 in17 Herndon Bt 2 42.0 16.5 0.08 0.03 0.49 >84 in18 Ge Bt 1 42.0 16.5 0.13 0.05 0.78 >84 in
Inside Facility15 Ge (shallow) Bt 1 46.0 18.1 0.50 0.2 3.0 >84 in16 Herndon Bt 2 50.0 19.7 0.18 0.1 1.0 >48 in.19 Ud Ud 4 33.0 13.0 0.02 0.009 0.1 >24 in.20 Herndon Bt 2 46.0 18.1 0.09 0.035 0.5 >36 in.
Avg SA1 19.8Avg SA2 19.3
New SiteGEOMEAN SA1 0.07 0.03 0.39
SA2 0.08 0.03 0.49Old SiteSA1 0.07 0.03 0.43SA2 0.04 0.01 0.21Inside FacilitySA1 0.50 0.20 2.96SA2 0.07 0.03 0.41
SA1 0.11 0.04SA2 0.07 0.03GEOMEAN 0.09 0.03

APPENDIX C
Soils Descriptions UNCBWWTF Land Application System Soils Descriptions

Soil Investigation Data Sheet
Soil Boring: Ksat-1Location: Bingham road Date: 4/6/2010County: Orange Investigator(s): SJFLat./Long.: Elev.:
Parent Material: Slate Drainage (Wetness) Class: wellMoisture Status: moist Slope (%): 2%Classification: Ge Vegetative Cover: fallow fieldAspect: SE Water Table: >7'Landscape Position: side slope S.H.W.T:
Horiz. Depth (in.)Main Colors
(moist) Mottles Texture Grade Class TypeMoist & Wet
Consist.Ped Coatings
Hoizon Boundary Other Remarks
Ap 0-2
10YR 4/6 dark yellowish
brown - silt loam moderate finesubangular blocky friable - - many fine roots, thick root mat
E 2-8
10YR 5/6 yellowish brown - silty clay moderate fine
subangular blocky friable - - few rocks/pebbles
Bt1 8-225YR 4/6 yellowish red - clay moderate medium
subangular blocky
friable/silt firm/slightly sticky plastic - - few fine roots
Bt2 22-385YR 4/6 yellowish red
10YR 7/6 yellow sillty clay moderate medium
subangular blocky
friable/slightly firm - -
BC 38-525YR 4/6 yellowish red
7.5YR 6/8 yellowish red
silty clay loam moderate medium
subangular blocky friable - - ~25% saprolitic, deep profile
C 52-84+
10YR 6/6 brownish yellow
7.5YR 5/8 strong brown
silty clay loam weak fine
subangular blocky friable - - good structure, multi-colored, manganese nodules/hematite
Structure

Soil Investigation Data Sheet
Soil Boring: Ksat-2Location: Bingham road Date: 4/6/2010County: Orange Investigator(s): SJFLat./Long.: Elev.:
Parent Material: Slate Drainage (Wetness) Class: wellMoisture Status: moist Slope (%): 1%Classification: Georgeville Vegetative Cover: fallow fieldAspect: SE Water Table: >7'Landscape Position: side slope S.H.W.T:
Horiz. Depth (in.)Main Colors
(moist) Mottles Texture Grade Class TypeMoist & Wet
Consist.Ped Coatings
Hoizon Boundary Other Remarks
Ap 0-25YR 5/3 red
brown - loam moderate finesubangular blocky friable - - thick root mat, many fine roots
Bt1 2-8 2.5YR 4/8 red7.5YR 6/6 red/yellow
silty clay loam moderate medium
subangular blocky
slightly firm/friable - - disturbed
Bt2 8-22 2.5YR 4/8 red7.5YR 8/6 red/yellow clay moderate medium
subangular blocky
firm, slightly sticky, slightly plastic - - many fine, distinct red yellow mottles
BC 22-402.5YR 6/8 light red
2.5YR 7/3 light reddish brown
silty clay loam moderate fine
subangular blocky friable - - ~35% saprolite
CR 40-567.5YR 6/2 reddish yellow
7.5YR 8/3 pink, 7.5YR 5/8 strong brown, 5YR 4/6 yellowish red
silty clay loam weak fine
subangular blocky friable - - multi-colored
CR2 56-84+multi-colored saprolite -
silty clay loam weak fine
subangular blocky friable - - good structure, mottled, multicolored rock
Structure

Soil Investigation Data Sheet
Soil Boring: Ksat-3Location: Bingham front road Date: 4/23/2010County: Orange Investigator(s): SJFLat./Long.: Elev.:
Parent Material: Slate Drainage (Wetness) Class: wellMoisture Status: moist Slope (%): 3%Classification: Ge Vegetative Cover: fallow fieldAspect: SE Water Table: >84"Landscape Position: side slope S.H.W.T:
Horiz. Depth (in.)Main Colors
(moist) Mottles Texture Grade Class TypeMoist & Wet
Consist.Ped Coatings
Hoizon Boundary Other Remarks
Ap 0-310YR 4/3
brown - sandy loam weak finesubangular blocky friable - - fine roots, trafficked
E 3-8
10YR 5/4 yellowish brownn - sandy loam weak fine
subangular blocky friable - -
Bt1 8-18
10YR 6/6 brownish yellow - sandy clay moderate medium
subangular blocky friable/firm yes - fine roots
Bt2 18-285YR 5/8 ylws. red
10YR 7/6 yellow sandy clay moderate medium
subangular blocky slightly sticky yes -
BC 28-667.5YR 5/6 strong brn
10YR 7/6 yellow
sandy clay loam moderate medium
subangular blocky friable/firm yes - 15-20% saprolite
C 66-84+5YR 5/3 reddish brn
2.5Y 7/6 pale yellow sandy loam weak fine
granular/ subangular blocky fiable - - multicolored rock
Structure

Soil Investigation Data Sheet
Soil Boring: Ksat-4Location: Bingham road Date: 4/7/2010County: Orange Investigator(s): SJFLat./Long.: Elev.:
Parent Material: Slate Drainage (Wetness) Class: wellMoisture Status: moist Slope (%): 3%Classification: Ge (shallow) Vegetative Cover: fallow fieldAspect: East Water Table: >84"Landscape Position: side slope S.H.W.T:
Horiz. Depth (in.)Main Colors
(moist) Mottles Texture Grade Class TypeMoist & Wet
Consist.Ped Coatings
Hoizon Boundary Other Remarks
Ap 0-210YR 4/3
brown - sandy loam weak finesubangular blocky friable - - fine roots
E 2-10
10YR 5/4 yellowish brownn - sandy loam weak fine
subangular blocky friable - - gravelly 10-15% large sb b/k gravel quartz
Bt1 10-22
10YR 6/8 brownish yellow - sandy clay moderate medium
subangular blocky friable/firm yes - some fine roots
Bt2 22-387.5YR 5/6 strong brown
10YR 7/6 yellow 5YR 5/8 yellowish red sandy clay moderate medium
subangular blocky slightly sticky yes -
BC 38-605YR 5/8 yellowish red
10YR 7/6 yellow
sandy clay loam moderate medium
subangular blocky friable/firm yes - 25-30% saprolite
C 60-84+2.5Y 7/6 yellow
2.5Y 7/6 pale yellow sandy loam weak fine
granular/ subangular blocky fiable - - multicolored rock, black Mn fragments
Structure

Soil Investigation Data Sheet
Soil Boring: Ksat-5Location: Bingham road Date: 4/12/2010County: Orange Investigator(s): SJFLat./Long.: Elev.:
Parent Material: Slate Drainage (Wetness) Class: wellMoisture Status: moist Slope (%): 3%Classification: Herndon Vegetative Cover: fallow fieldAspect: East Water Table: >84"Landscape Position: side slope S.H.W.T:
Horiz. Depth (in.)Main Colors
(moist) Mottles Texture Grade Class TypeMoist & Wet
Consist.Ped Coatings
Hoizon Boundary Other Remarks
Ap 0-210YR 4/3
brown - sandy loam weak finesubangular blocky friable - - fine roots, shallow
E 2-10
10YR 5/4 yellowish brownn - silt loam weak fine
subangular blocky friable - -
BE 10-1810YR 5/6 ylws brn - silt loam moderate fine
subangular blocky friable
Bt1 18-265YR 5/8 ylws red
few 10YR 7/6 ylw silty clay moderate medium
subangular blocky friable/firm yes -
Bt2 26-367.5YR 5/6 strong brown
10YR 7/6 yellow 5YR 5/8 yellowish red clay moderate medium
subangular blocky friable yes -
Bt3 36-607.5YR 8/6 reddish ylw silty clay moderate medium
subangular blocky friable yes -
C 60-84+10YR 8/6 yellow
5 YR 5/8 red, 7.5YR 5/8 stng brn silt loam weak fine
granular/ subangular blocky fiable - - multicolored rock, >50% sap
Structure

Soil Investigation Data Sheet
Soil Boring: Ksat-6Location: Bingham road (field) Date: 4/12/2010County: Orange Investigator(s): SJFLat./Long.: Elev.:
Parent Material: Slate Drainage (Wetness) Class: wellMoisture Status: moist Slope (%): 3%Classification: Herndon (swale) Vegetative Cover: fallow fieldAspect: East Water Table: >84"Landscape Position: side slope S.H.W.T:
Horiz. Depth (in.)Main Colors
(moist) Mottles Texture Grade Class TypeMoist & Wet
Consist.Ped Coatings
Hoizon Boundary Other Remarks
Ap 0-210YR 4/3
brown - sandy loam weak finesubangular blocky friable - - fine roots, shallow
E 2-7
10YR 5/4 yellowish brownn - silt loam weak fine
subangular blocky friable - -
BE 7-2010YR 5/6 ylws brn - silt loam moderate fine
subangular blocky friable
Bt1 20-265YR 5/8 ylws red
few 10YR 7/6 ylw silty clay moderate medium
subangular blocky friable/firm yes -
Bt2 26-487.5YR 5/6 strong brown
10YR 7/6 yellow 5YR 5/8 yellowish red clay moderate medium
subangular blocky friable yes -
Bt3 48-6010YR 6/4 light ylws brn silty clay moderate medium
subangular blocky friable yes -
C 60-84+10YR 6/3 pale brn
10YR 8/2 v pal brn silt loam weak fine
granular/ subangular blocky fiable - - crushed rock
Structure

Soil Investigation Data Sheet
Soil Boring: Ksat-7Location: Bingham road Date: 4/23/2010County: Orange Investigator(s): SJFLat./Long.: Elev.:
Parent Material: Slate Drainage (Wetness) Class: wellMoisture Status: moist Slope (%): 3%Classification: Ge Vegetative Cover: fallow fieldAspect: East Water Table: >84"Landscape Position: side slope S.H.W.T:
Horiz. Depth (in.)Main Colors
(moist) Mottles Texture Grade Class TypeMoist & Wet
Consist.Ped Coatings
Hoizon Boundary Other Remarks
Ap 0-310YR 4/3
brown - sandy loam weak finesubangular blocky friable - - fine roots
E 3-10
10YR 5/4 yellowish brownn - sandy loam weak fine
subangular blocky friable - -
Bt1 10-23
10YR 6/8 brownish yellow
5YR 5/8 ylws red sandy clay moderate medium
subangular blocky friable/firm yes -
Bt2 23-387.5YR 5/6 strong brown
10YR 7/6 yellow 5YR 5/8 yellowish red sandy clay moderate medium
subangular blocky slightly sticky yes -
BC 38-525YR 5/8 yellowish red
10YR 7/6 yellow
sandy clay loam moderate medium
subangular blocky friable/firm yes - 15% sap
C 52-84+2.5Y 7/6 yellow
2.5Y 7/6 pale yellow sandy loam weak fine
granular/ subangular blocky fiable - - fine crushed rock
Structure

Soil Investigation Data Sheet
Soil Boring: Ksat-8Location: New Spray Site Date: 4/13/2010County: Orange Investigator(s): SJFLat./Long.: Elev.:
Parent Material: Slate Drainage (Wetness) Class: wellMoisture Status: moist Slope (%): 3%Classification: Ge or Pacolet Vegetative Cover: forestAspect: South Water Table: >84"Landscape Position: side slope S.H.W.T:
Horiz. Depth (in.)Main Colors
(moist) Mottles Texture Grade Class TypeMoist & Wet
Consist.Ped Coatings
Hoizon Boundary Other Remarks
Ap 0-210YR 4/3
brown - sandy loam weak finesubangular blocky friable - - fine roots
E 2-8
10YR 5/4 yellowish brownn
5 YR 5/6 ylws red sandy loam weak fine
subangular blocky friable - - fine and med. roots
Bt1 8-2410YR 5/8 ylws red - sandy clay moderate medium
subangular blocky friable/firm yes - fine and med. roots
Bt2 24-505YR 5/8 ylws red
10YR 7/6 yellow sandy clay moderate medium
subangular blocky slightly sticky yes -
BC 50-765YR 5/8 yellowish red
10YR 7/6 yellow
sandy clay loam moderate medium
subangular blocky friable/firm yes -
C 76-84+ 5 YR 6/1 gray2.5Y 7/6 pale yellow sandy loam weak fine
granular/ subangular blocky fiable - - fine crushed rock
Structure

Soil Investigation Data Sheet
Soil Boring: Ksat-9Location: New Spray Site Date: 4/13/2010County: Orange Investigator(s): SJFLat./Long.: Elev.:
Parent Material: Slate Drainage (Wetness) Class: wellMoisture Status: moist Slope (%): 4%Classification: Ge (shallow) Vegetative Cover: forestAspect: South Water Table: >84"Landscape Position: side slope S.H.W.T:
Horiz. Depth (in.)Main Colors
(moist) Mottles Texture Grade Class TypeMoist & Wet
Consist.Ped Coatings
Hoizon Boundary Other Remarks
Ap 0-410YR 4/3
brown - sandy loam weak finesubangular blocky friable - - fine roots
Bt1 4-185 YR 4/6 ylws red - sandy clay moderate medium
subangular blocky friable/firm yes -
Bt2 18-407.5YR 5/6 strong brown
10YR 7/6 yellow 5YR 5/8 yellowish red, 5 YR 8/1 white sandy clay moderate medium
subangular blocky friable yes - crushed rock fragments
BC 40-78 5YR 7/4 pink
5YR 8/1 white, 7.5YR 5/6
sandy clay loam moderate medium
subangular blocky friable yes - crushed rock fragments, floaters, 25% sap
C 78-84+2.5Y 7/6 yellow
5 YR 8/1 white sandy loam weak fine
granular/ subangular blocky fiable - - crushed rock, small floaters
Structure

Soil Investigation Data Sheet
Soil Boring: Ksat-10Location: New Spray Site Date: 4/13/2010County: Orange Investigator(s): SJFLat./Long.: Elev.:
Parent Material: Slate Drainage (Wetness) Class: wellMoisture Status: moist Slope (%): 4%Classification: Ge Vegetative Cover: forestAspect: SW Water Table: >48" auger refusalLandscape Position: side slope S.H.W.T:
Horiz. Depth (in.)Main Colors
(moist) Mottles Texture Grade Class TypeMoist & Wet
Consist.Ped Coatings
Hoizon Boundary Other Remarks
Ap 0-210YR 4/3
brown - sandy loam weak finesubangular blocky friable - - fine roots
E 2-1310YR 6/3 pale brn
5 YR 5/6 ylws red sandy loam weak fine
subangular blocky friable - - fine and med. roots
Bt1 13-2810YR 5/8 ylws red - sandy clay moderate medium
subangular blocky friable/firm yes - fine and med. roots
Bt2 28-347.5YR 5/6 strong brown
10YR 7/6 yellow 5YR 5/8 yellowish red, 5 YR 8/1 white sandy clay moderate medium
subangular blocky friable yes - crushed rock fragments
BC 34-485YR 5/8 yellowish red
10YR 7/6 yellow
sandy clay loam moderate medium
subangular blocky friable/firm yes -
C 48-84+ 5 YR 6/1 gray2.5Y 7/6 pale yellow sandy loam weak fine
granular/ subangular blocky fiable - - fine crushed rock, auger refusal at 50 in.
Structure

Soil Investigation Data Sheet
Soil Boring: Ksat-11Location: New Spary Site Date: 4/13/2010County: Orange Investigator(s): SJFLat./Long.: Elev.:
Parent Material: Slate Drainage (Wetness) Class: wellMoisture Status: moist Slope (%): 3%Classification: Herndon Vegetative Cover: forestAspect: West Water Table: >36" ? auger refusalLandscape Position: side slope S.H.W.T:
Horiz. Depth (in.)Main Colors
(moist) Mottles Texture Grade Class TypeMoist & Wet
Consist.Ped Coatings
Hoizon Boundary Other Remarks
Ap 0-210YR 4/3
brown - sandy loam weak finesubangular blocky friable - - fine roots, shallow
E 2-1010YR 6/2 lt ylws gray - silt loam weak fine
subangular blocky friable - - fine roots
BE 10-2010YR 7/4 v pale brn - silt loam moderate fine
subangular blocky friable
Bt1 20-3410YR 6/4 lt ylws brn silt loam weak/mod fine/med
subangular blocky friable yes - auger refusal, few quartz rocks
Structure

Soil Investigation Data Sheet
Soil Boring: Ksat-12Location: New Spray Site Date: 4/13/2010County: Orange Investigator(s): SJFLat./Long.: Elev.:
Parent Material: Slate Drainage (Wetness) Class: wellMoisture Status: moist Slope (%): 3%Classification: Herndon Vegetative Cover: forestAspect: West Water Table: >48" auger refusalLandscape Position: side slope S.H.W.T:
Horiz. Depth (in.)Main Colors
(moist) Mottles Texture Grade Class TypeMoist & Wet
Consist.Ped Coatings
Hoizon Boundary Other Remarks
Ap 0-210YR 4/3
brown - sandy loam weak finesubangular blocky friable - - fine roots, shallow
E 2-1010YR 6/2 lt ylws gray - silt loam weak fine
subangular blocky friable - - fine roots
BE 10-1810YR 7/4 v pale brn - silt loam moderate fine
subangular blocky friable
Bt1 18-3410YR 6/4 lt ylws brn
10YR 8/1 white silt loam weak/mod fine/med
subangular blocky friable yes - auger refusal, few quartz rocks
Bt2 34-467.5YR 5/6 strong brown
10YR 7/6 yellow, 10YR 8/1 white clay moderate medium
subangular blocky friable yes -
Bt3 46-50+7.55YR 8/6 reddish ylw silty clay moderate medium
subangular blocky friable yes - auger refusal
Structure

Soil Investigation Data Sheet
Soil Boring: Ksat-13Location: New Spray Site Date: 4/13/2010County: Orange Investigator(s): SJFLat./Long.: Elev.:
Parent Material: Slate Drainage (Wetness) Class: wellMoisture Status: moist Slope (%): 2%Classification: Herndon Vegetative Cover: forestAspect: SW Water Table: ~34" perchedLandscape Position: side slope S.H.W.T:
Horiz. Depth (in.)Main Colors
(moist) Mottles Texture Grade Class TypeMoist & Wet
Consist.Ped Coatings
Hoizon Boundary Other Remarks
Ap 0-210YR 4/3
brown - sandy loam weak finesubangular blocky friable - - fine roots, shallow
E 2-10
10YR 5/4 yellowish brownn - silt loam weak fine
subangular blocky friable - -
BE 10-1810YR 5/6 ylws brn - silt loam moderate fine
subangular blocky friable/sticky
Bt1 18-345YR 5/8 ylws red
few 10YR 7/6 ylw silty clay moderate medium
subangular blocky friable/firm yes - evidence of perched WT at 34 in.
Bt2 34-4510YR 8/2 v pale brn
10YR 7/6 yellow 5YR 5/8 yellowish red clay moderate medium
subangular blocky friable/sticky yes - water movement
Bt3 45-50+10YR 6/6 brns ylw
10YR 7/6 yellow 5YR 5/8 yellowish red, 10YYR 8/1 white silty clay moderate medium
subangular blocky friable yes - auger refusal at 50 in., rock
Structure

Soil Investigation Data Sheet
Soil Boring: Ksat-14Location: Bingham road Date: 4/14/2010County: Orange Investigator(s): SJFLat./Long.: Elev.:
Parent Material: Slate Drainage (Wetness) Class: wellMoisture Status: moist Slope (%): 3%Classification: Herndon Vegetative Cover: fallow fieldAspect: SE Water Table: >48"Landscape Position: side slope S.H.W.T:
Horiz. Depth (in.)Main Colors
(moist) Mottles Texture Grade Class TypeMoist & Wet
Consist.Ped Coatings
Hoizon Boundary Other Remarks
Ap 0-210YR 4/3
brown - sandy loam weak finesubangular blocky friable - - fine grass roots
E 2-6
10YR 5/4 yellowish brownn - silt loam weak fine
subangular blocky friable - - fine roots
BE 6-1810YR 5/6 ylws brn - silt loam moderate fine
subangular blocky friable fine roots
Bt1 18-305YR 5/8 ylws red
few 10YR 7/6 ylw silty clay moderate medium
subangular blocky friable/firm yes -
Bt2 30-387.5YR 5/6 strong brown
10YR 7/6 yellow 5YR 5/8 yellowish red clay moderate medium
subangular blocky friable/firm yes -
Bt3 38-627.55YR 8/6 reddish ylw silty clay moderate medium
subangular blocky friable yes - evd of water movement
C 62-84+10YR 8/6 yellow
5 YR 5/8 red, 7.5YR 5/8 stng brn, 10YR 8/1 white silt loam weak fine
granular/ subangular blocky fiable - - multicolored rock, >50% sap
Structure

Soil Investigation Data Sheet
Soil Boring: Ksat-15Location: Near Old Site Date: 4/27/2010County: Orange Investigator(s): SJFLat./Long.: Elev.:
Parent Material: Slate Drainage (Wetness) Class: wellMoisture Status: moist Slope (%): <1%Classification: Ge (shallow) Vegetative Cover: forestAspect: NE Water Table: >84"Landscape Position: side slope S.H.W.T:
Horiz. Depth (in.)Main Colors
(moist) Mottles Texture Grade Class TypeMoist & Wet
Consist.Ped Coatings
Hoizon Boundary Other Remarks
Ap 0-210YR 4/3
brown - sandy loam weak finesubangular blocky friable - - fine roots, duff
E 2-810YR 5/4 ylws brn - sandy loam weak fine
subangular blocky friable - -
Bt1 8-28
5YR 5/4 reddish brown - sandy clay moderate medium
subangular blocky friable/firm yes - some fine roots, saprolite floaters
Bt2 28-387.5YR 5/6 strong brown
10YR 7/6 yellow 5YR 5/8 yellowish red, 10YR 8/2 v pale brn sandy clay moderate medium
subangular blocky slightly sticky yes -
BC 38-655YR 5/8 yellowish red
10YR 7/6 yellow
sandy clay loam moderate medium
subangular blocky friable/firm yes - 25-30% saprolite
C 65-84+2.5Y 7/6 yellow
2.5Y 7/6 pale yellow sandy loam weak fine
granular/ subangular blocky fiable - - multicolored rock
Structure

Soil Investigation Data Sheet
Soil Boring: Ksat-16Location: Old Site (W corner Date: 4/27/2010County: Orange Investigator(s): SJFLat./Long.: Elev.:
Parent Material: Slate Drainage (Wetness) Class: wellMoisture Status: moist Slope (%): 4-8%Classification: Herndon Vegetative Cover: forestAspect: East Water Table: >84"Landscape Position: side slope transition S.H.W.T:
Horiz. Depth (in.)Main Colors
(moist) Mottles Texture Grade Class TypeMoist & Wet
Consist.Ped Coatings
Hoizon Boundary Other Remarks
Ap 0-310 YR 3/1 v
dk gray - sandy loam weak finesubangular blocky friable - - fine roots, dark, fibrous duff
E 3-82.5Y 7/1 lt gray - silt loam weak fine
subangular blocky friable - - fine roots
BE 8-382.5Y 6/4 lt ylws brn
2.5Y 7/1 lt gray, 2.5Y 8/1 white, charcoal silt loam moderate fine
subangular blocky friable charcoal fragments, disturbed soil
Bt1 38-507.5YR 6/6 reddish ylw
10YR 6/4 lt ylws brn silty clay moderate medium
subangular blocky friable/firm yes -
Bt2 50-742.5YR 7/4 lt reddish brn silty clay moderate medium
subangular blocky friable yes -
Bt3 74-84+7.5YR 5/6 strong brown silty clay moderate medium
subangular blocky friable yes - saprolite fragments
Structure

Soil Investigation Data Sheet
Soil Boring: Ksat-17Location: Old Spray Site Date: 4/27/2010County: Orange Investigator(s): SJFLat./Long.: Elev.:
Parent Material: Slate Drainage (Wetness) Class: wellMoisture Status: moist Slope (%): 6%Classification: Herndon Vegetative Cover: forestedAspect: SE Water Table: >72" auger refusalLandscape Position: side slope S.H.W.T:
Horiz. Depth (in.)Main Colors
(moist) Mottles Texture Grade Class TypeMoist & Wet
Consist.Ped Coatings
Hoizon Boundary Other Remarks
Ap 0-210YR 4/3
brown - sandy loam weak finesubangular blocky friable - - fine roots, shallow
E 2-1010YR 7/6 yellow - silt loam weak fine
subangular blocky friable - - very dry, fine roots
BE 10-2010YR 5/6 ylws brn - silt loam moderate fine
subangular blocky friable very dry
Bt1 20-3010YR 6/4 lt ylws brn silty clay moderate medium
subangular blocky friable/firm yes -
Bt2 30-602.5Y 7/3 pale ylw
2.5Y 8/1 white silty clay moderate medium
subangular blocky friable yes -
Bt3 60-70+2.5Y 6/4 lt ylws brn silty clay moderate medium
subangular blocky friable yes -
Structure

Soil Investigation Data Sheet
Soil Boring: Ksat-18Location: Bingham road Date: 4/27/2010County: Orange Investigator(s): SJFLat./Long.: Elev.:
Parent Material: Slate Drainage (Wetness) Class: wellMoisture Status: moist Slope (%): 3%Classification: Ge (shallow) Vegetative Cover: fallow fieldAspect: East Water Table: >84"Landscape Position: side slope S.H.W.T:
Horiz. Depth (in.)Main Colors
(moist) Mottles Texture Grade Class TypeMoist & Wet
Consist.Ped Coatings
Hoizon Boundary Other Remarks
Ap 0-210YR 4/3
brown - sandy loam weak finesubangular blocky friable - - fine roots
E 2-10
10YR 5/4 yellowish brownn - sandy loam weak fine
subangular blocky friable - - fine and med roots
Bt1 10-365YR 5/8 yellowish red - sandy clay moderate medium
subangular blocky friable/firm yes - some fine roots
Bt2 36-587.5YR 5/6 strong brown
10YR 7/6 yellow 5YR 5/8 yellowish red sandy clay moderate medium
subangular blocky slightly sticky yes -
BC 58-737.5YR 5/6 strong brown
10YR 7/6 yellow
sandy clay loam moderate medium
subangular blocky friable/firm yes - 15-25% saprolite
C 73-84+2.5Y 7/6 yellow
2.5Y 7/4 pale yellow, 7.5YR 5/6 stng brn sandy loam weak fine
granular/ subangular blocky fiable - - multicolored rock, >50% saprolite
Structure

Soil Investigation Data Sheet
Soil Boring: Ksat-19Location: Facility Grounds Date: 4/27/2010County: Orange Investigator(s): SJFLat./Long.: Elev.:
Parent Material: Slate Drainage (Wetness) Class: wellMoisture Status: moist Slope (%): 3%Classification: Ud Ge Vegetative Cover: landscaped areaAspect: South Water Table: <36 in. disturbedLandscape Position: side slope S.H.W.T:
Horiz. Depth (in.)Main Colors
(moist) Mottles Texture Grade Class TypeMoist & Wet
Consist.Ped Coatings
Hoizon Boundary Other Remarks
Ud1 0-25YR 5/8 ylws
red - sandy clay moderate mediumsubangular blocky friable - - fine roots, very disturbed
Ud2 2-142.5Y 6/6 olive ylw
5YR 5/8 ylws red sandy clay moderate medium
subangular blocky friable/firm - - buried roots, debris
Ud3 14-24+10YR 6/3 pale ylw multi colored sandy clay moderate medium
subangular blocky friable/firm yes - some fine roots
Structure

Soil Investigation Data Sheet
Soil Boring: Ksat-20Location: Bingham road Date: 4/27/2010County: Orange Investigator(s): SJFLat./Long.: Elev.:
Parent Material: Slate Drainage (Wetness) Class: wellMoisture Status: moist Slope (%): 3%Classification: Herndon Vegetative Cover: fallow fieldAspect: East Water Table: >60" auger refusal at 5.5 'Landscape Position: side slope S.H.W.T:
Horiz. Depth (in.)Main Colors
(moist) Mottles Texture Grade Class TypeMoist & Wet
Consist.Ped Coatings
Hoizon Boundary Other Remarks
Ap 0-210YR 4/3
brown - sandy loam weak finesubangular blocky friable - - fine roots, med roots, OM
E 2-8
10YR 5/4 yellowish brownn - silt loam moderate medium
subangular blocky friable - -
BE 8-1810YR 5/6 ylws brn - silt loam moderate fine
subangular blocky friable
Bt1 18-2610YR 5/6 ylws brn
few 10YR 7/6 ylw, 5YR 5/6 ylws red silty clay weak/mod medium
subangular blocky friable/firm yes - saprolite floaters
Bt2 26-365YR 5/2 reddish gry
10YR 7/6 yellow 5YR 5/8 yellowish red clay weak/mod medium
subangular blocky friable yes -
BC 36-60+ 5YR 5/1 gry silty clay weak/mod mediumsubangular blocky friable yes - auger refusal at 5.5 ft on soft rock
Structure