soil organic carbon: challenges & opportunities
TRANSCRIPT
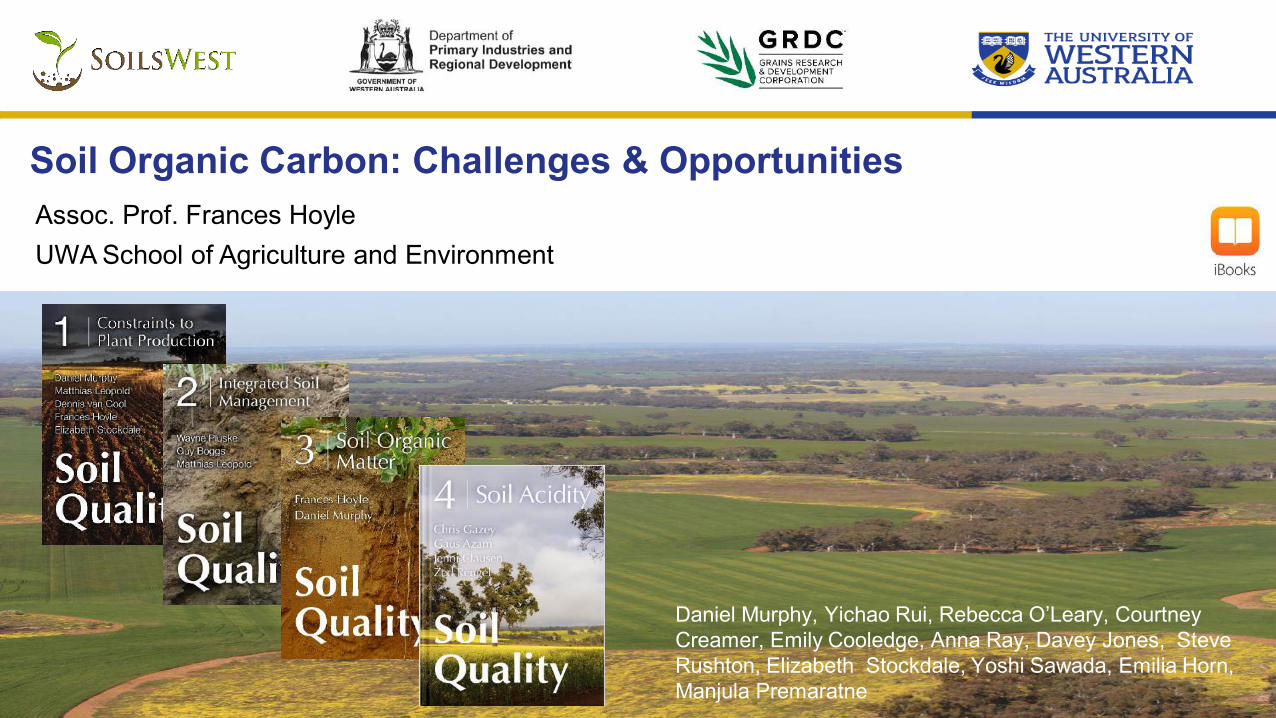
Soil Organic Carbon: Challenges & OpportunitiesAssoc. Prof. Frances Hoyle UWA School of Agriculture and Environment
Daniel Murphy, Yichao Rui, Rebecca O’Leary, Courtney Creamer, Emily Cooledge, Anna Ray, Davey Jones, Steve Rushton, Elizabeth Stockdale, Yoshi Sawada, Emilia Horn, Manjula Premaratne
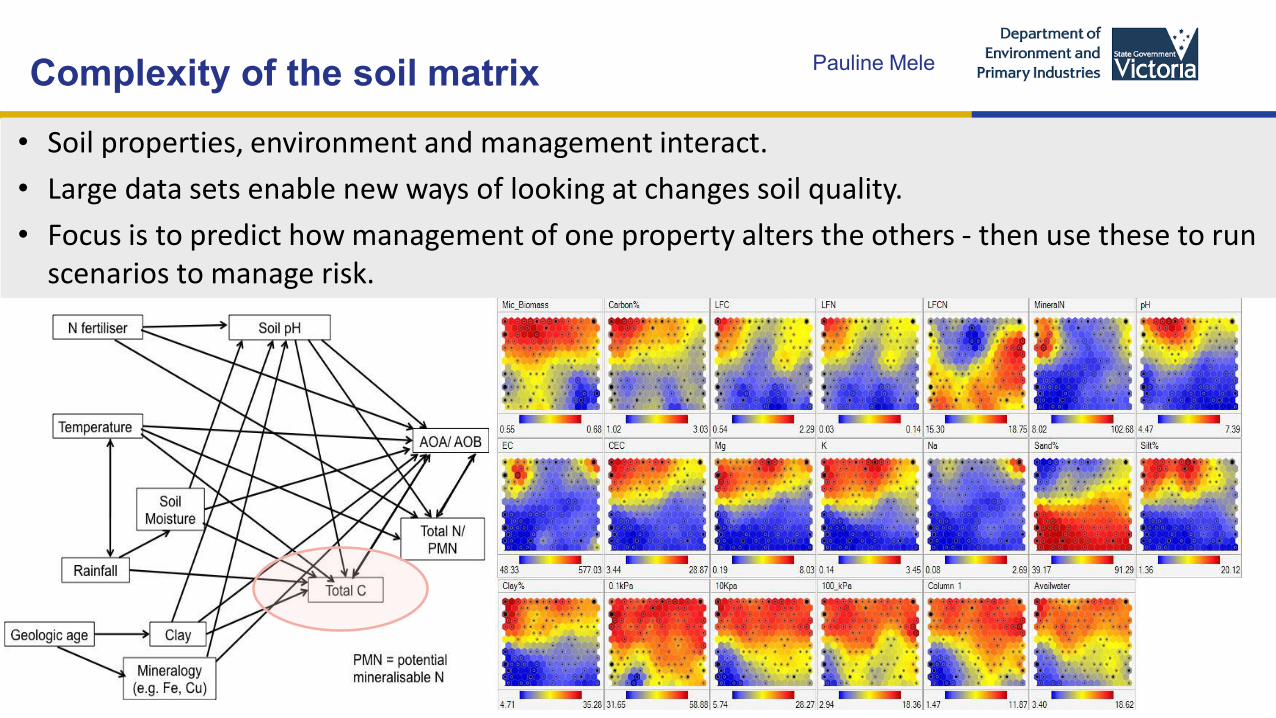
Complexity of the soil matrix
• Soil properties, environment and management interact.• Large data sets enable new ways of looking at changes soil quality. • Focus is to predict how management of one property alters the others - then use these to run
scenarios to manage risk.
Pauline Mele
0%
20%
40%
60%
80%
100%
Tota
l Car
bon
Soil
N s
uppl
y
Dis
ease
pH (0
-10)
pH (1
0-20
)
pH (2
0-30
)
Elec
rical
Con
duct
ivity
Wat
er R
epel
lenc
y
Bulk
Den
sity
RedAmberGreen
Biology PhysicsChemistry
pH
Soil organic matter
Electrical Conduct.
CEC
Water repellence
Clay content
Compaction
Hardsetting
Available H2O
Erosion
Climate AgronomicManagement
Disease
Pathogenic Nematode
Labile organic matter
Microbial biomass
Biological N supply
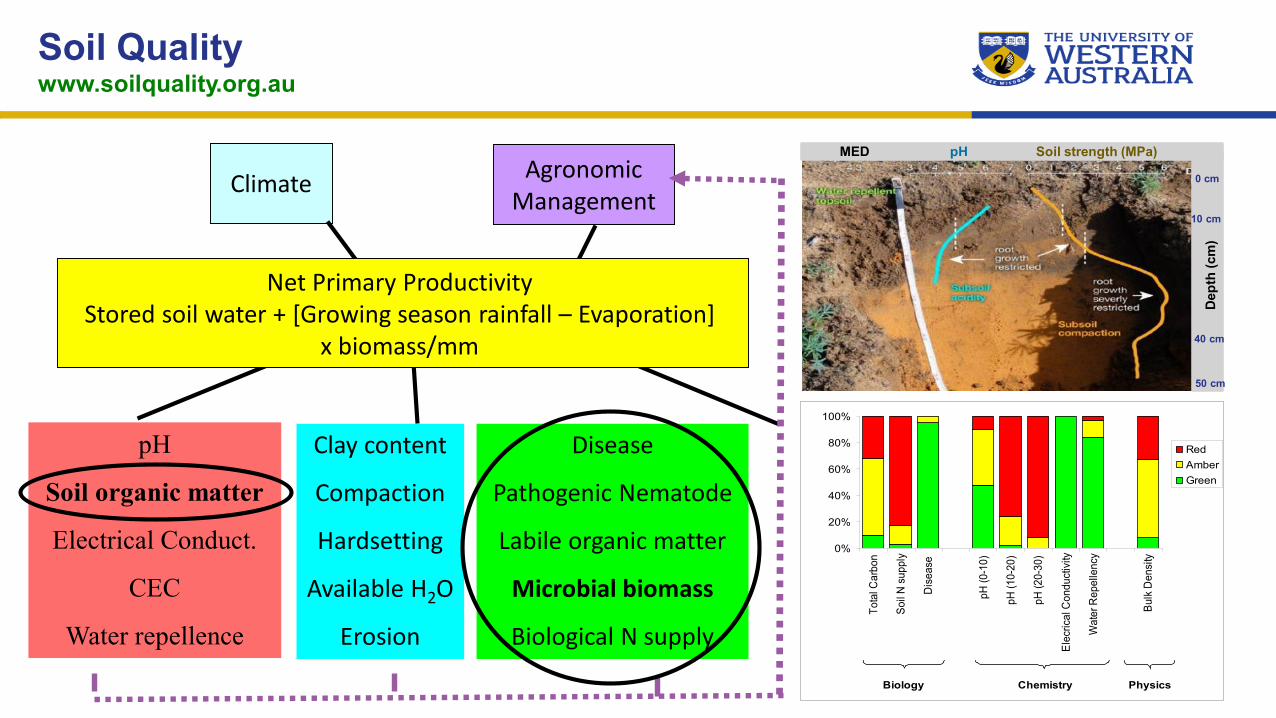
Soil Qualitywww.soilquality.org.au
MED pH Soil strength (MPa)
Dept
h (c
m)
0 cm
10 cm
40 cm
50 cm
Net Primary ProductivityStored soil water + [Growing season rainfall – Evaporation]
x biomass/mm

Soil organic matter0.1 – 10%
Living 15%
Microorganisms75-90%
Mycorrhizae
Denitrifiers
N fixation
Decomposers
Microbial activity
Nutrient Cycling EnzymesAggregate
stabilisation
Diversity
e.g. bacteria and fungi
Resilience
Roots 5-15% Fauna 5-10%
What are the components of SOM?
Contaminantdegradation
= C (58%), O, H, S, N, P, K, Ca, Mg< 2 mm =
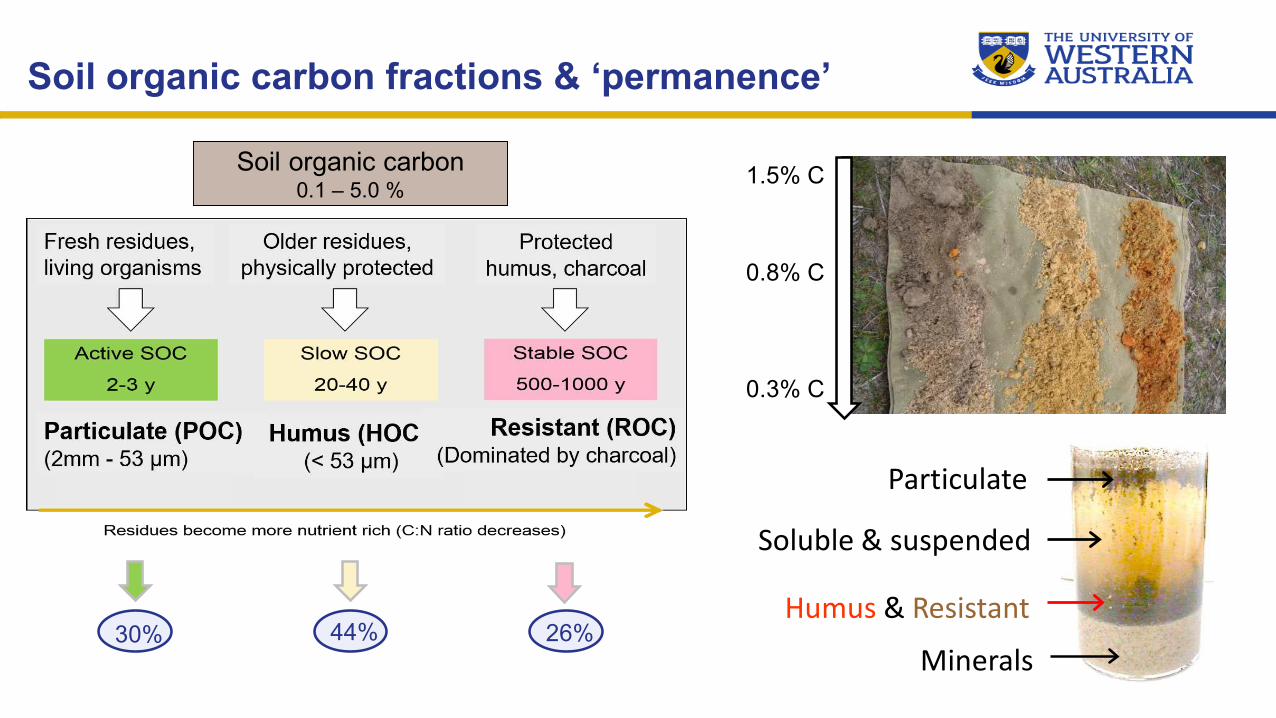
Soil organic carbon fractions & ‘permanence’
Particulate
Soluble & suspended
Humus & Resistant
Minerals
Soil organic carbon0.1 – 5.0 %
26%44%30%
1.5% C
0.8% C
0.3% C
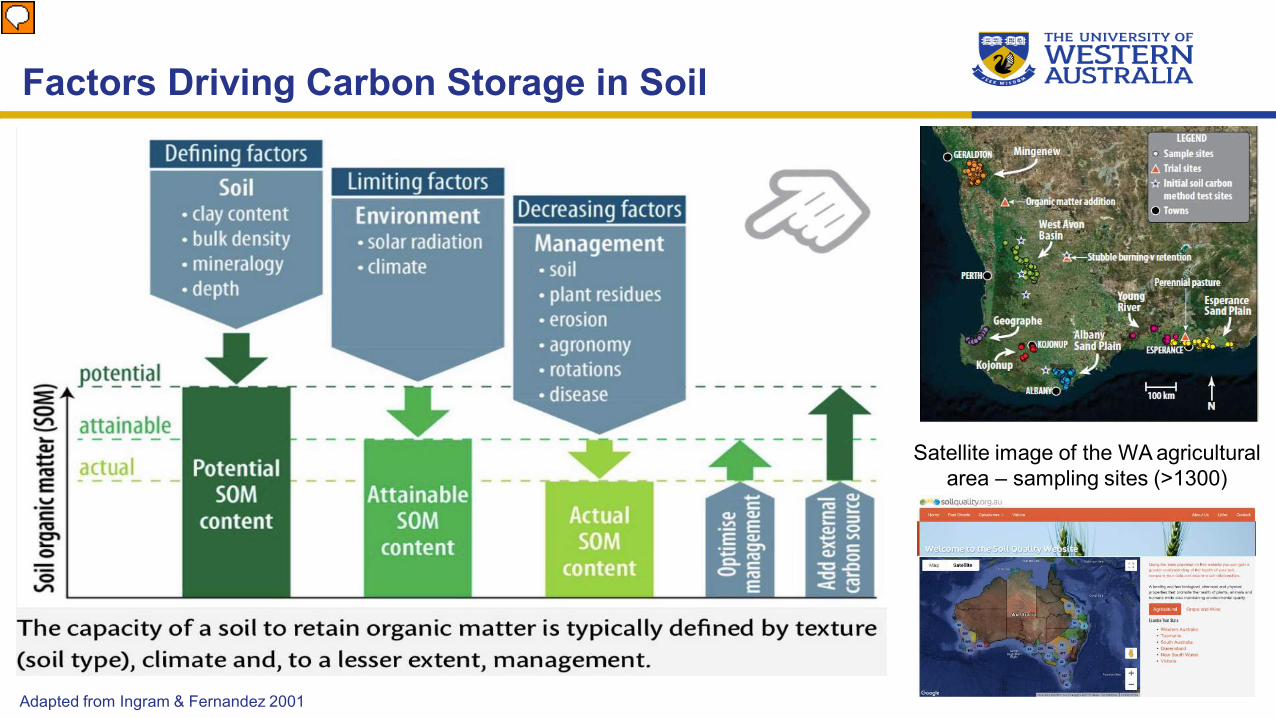
Factors Driving Carbon Storage in Soil
Satellite image of the WA agricultural area – sampling sites (>1300)
Adapted from Ingram & Fernandez 2001
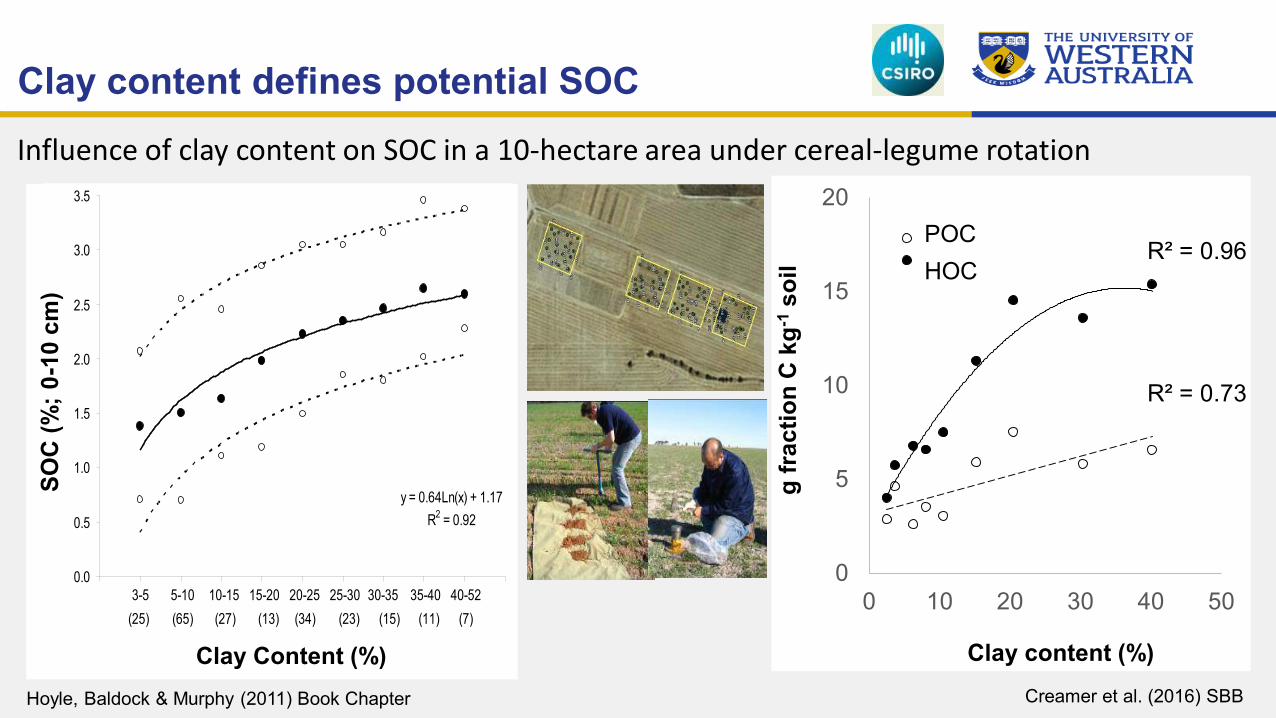
R² = 0.73
R² = 0.96
0
5
10
15
20
0 10 20 30 40 50
g fr
actio
n C
kg-1
soil
Clay content (%)
> 50 µm≤ 50 µm
Creamer et al. (2016) SBB
Clay content defines potential SOC
POCHOC
y = 0.64Ln(x) + 1.17R2 = 0.92
0.0
0.5
1.0
1.5
2.0
2.5
3.0
3.5
Clay content (%)
SO
C (
%)
3-5 30-3510-15 20-25 40-5235-4025-3015-205-10(25) (34)(13)(27)(65) (7)(11)(15)(23)
Influence of clay content on SOC in a 10-hectare area under cereal-legume rotation
SOC
(%; 0
-10
cm)
Clay Content (%)Hoyle, Baldock & Murphy (2011) Book Chapter
P Poulton, Rothamsted Research, UK.
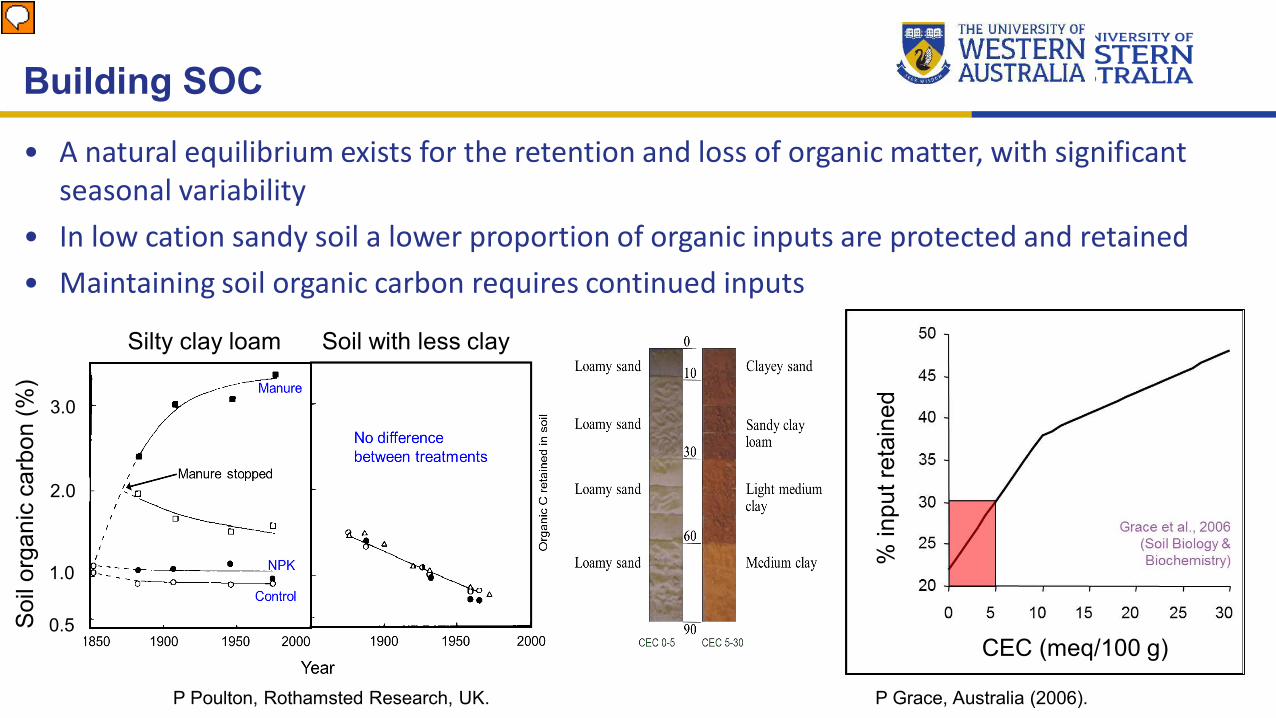
Building SOC
• A natural equilibrium exists for the retention and loss of organic matter, with significant seasonal variability
• In low cation sandy soil a lower proportion of organic inputs are protected and retained• Maintaining soil organic carbon requires continued inputs
P Grace, Australia (2006).
Silty clay loam Soil with less clay
% in
put r
etai
ned
CEC (meq/100 g)0.5
1.0
2.0
3.0
Soil
orga
nic
carb
on (%
)
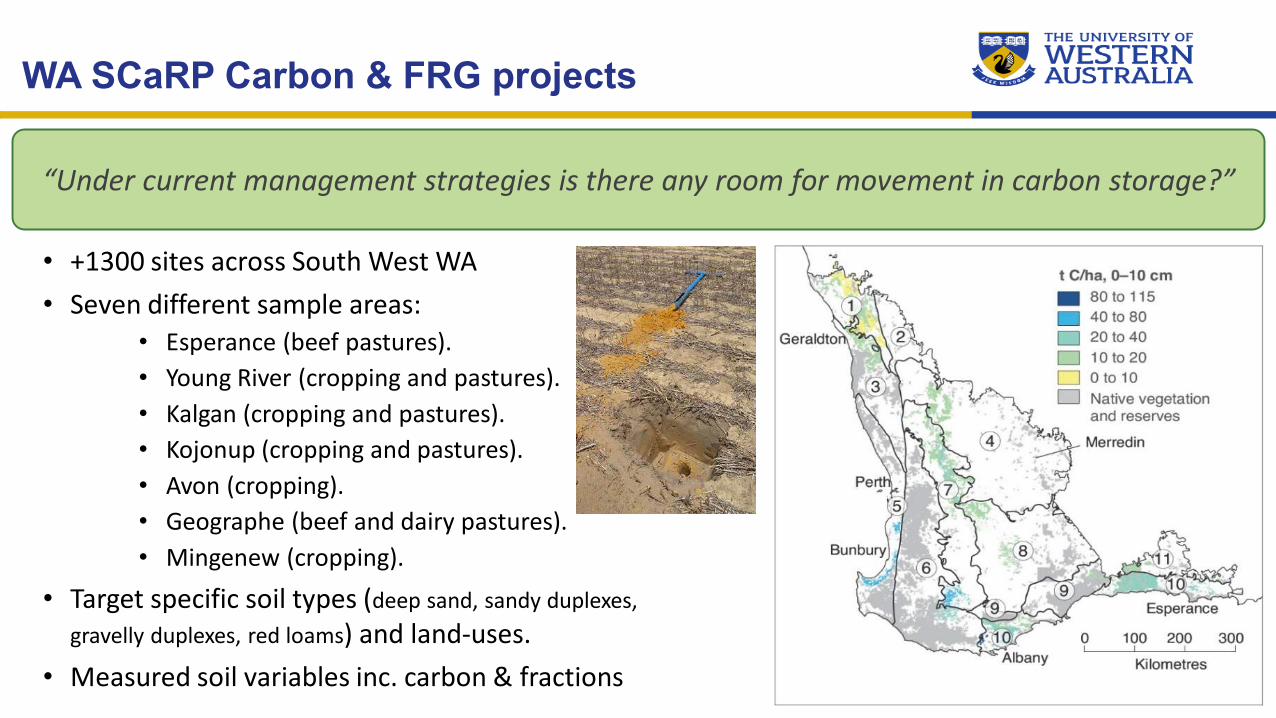
WA SCaRP Carbon & FRG projects
• +1300 sites across South West WA• Seven different sample areas:
• Esperance (beef pastures).• Young River (cropping and pastures).• Kalgan (cropping and pastures).• Kojonup (cropping and pastures).• Avon (cropping).• Geographe (beef and dairy pastures).• Mingenew (cropping).
• Target specific soil types (deep sand, sandy duplexes, gravelly duplexes, red loams) and land-uses.
• Measured soil variables inc. carbon & fractions
“Under current management strategies is there any room for movement in carbon storage?”
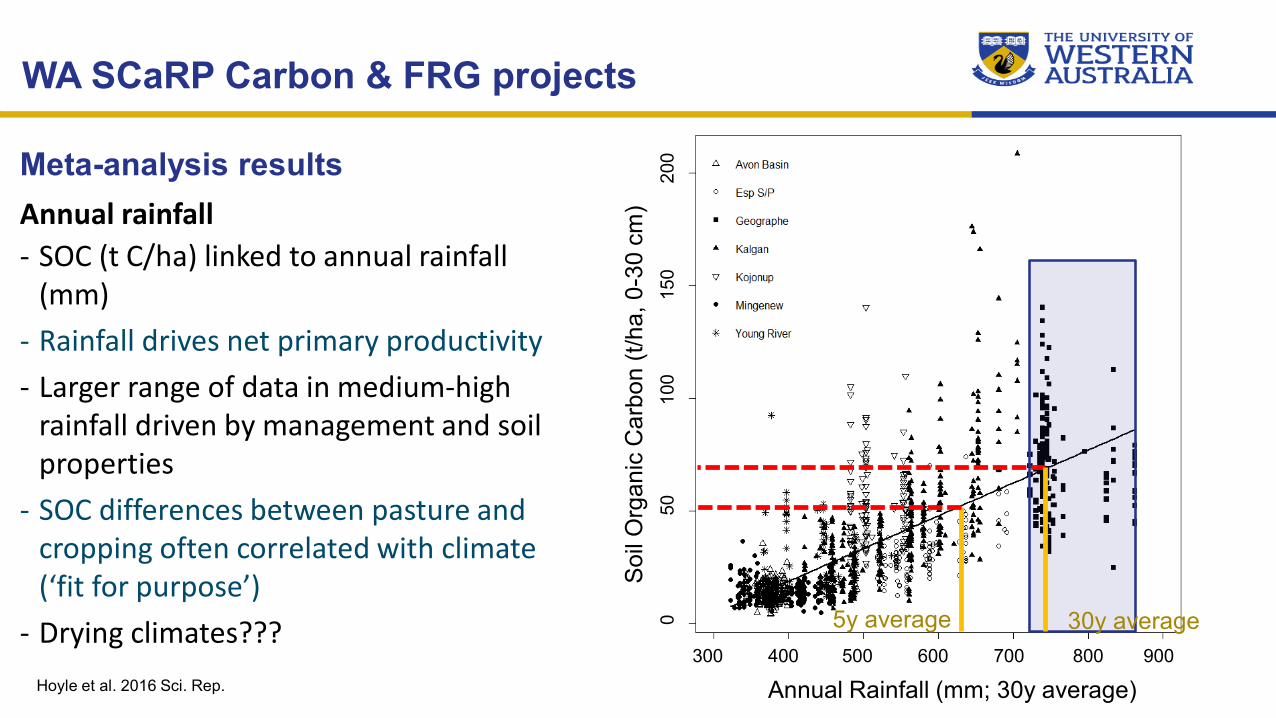
Annual rainfall- SOC (t C/ha) linked to annual rainfall
(mm)- Rainfall drives net primary productivity- Larger range of data in medium-high
rainfall driven by management and soil properties
- SOC differences between pasture and cropping often correlated with climate (‘fit for purpose’)
- Drying climates??? Hoyle et al. 2016 Sci. Rep. Annual average rainfall (mm)
300 400 500 600 700 800 900So
il or
gani
c ca
rbon
(t C
/ha,
0-
30cm
)0
5010
015
020
0Meta-analysis results
Soil
Org
anic
Car
bon
(t/ha
, 0-3
0 cm
)
Annual Rainfall (mm; 30y average)
WA SCaRP Carbon & FRG projects
30y average5y average
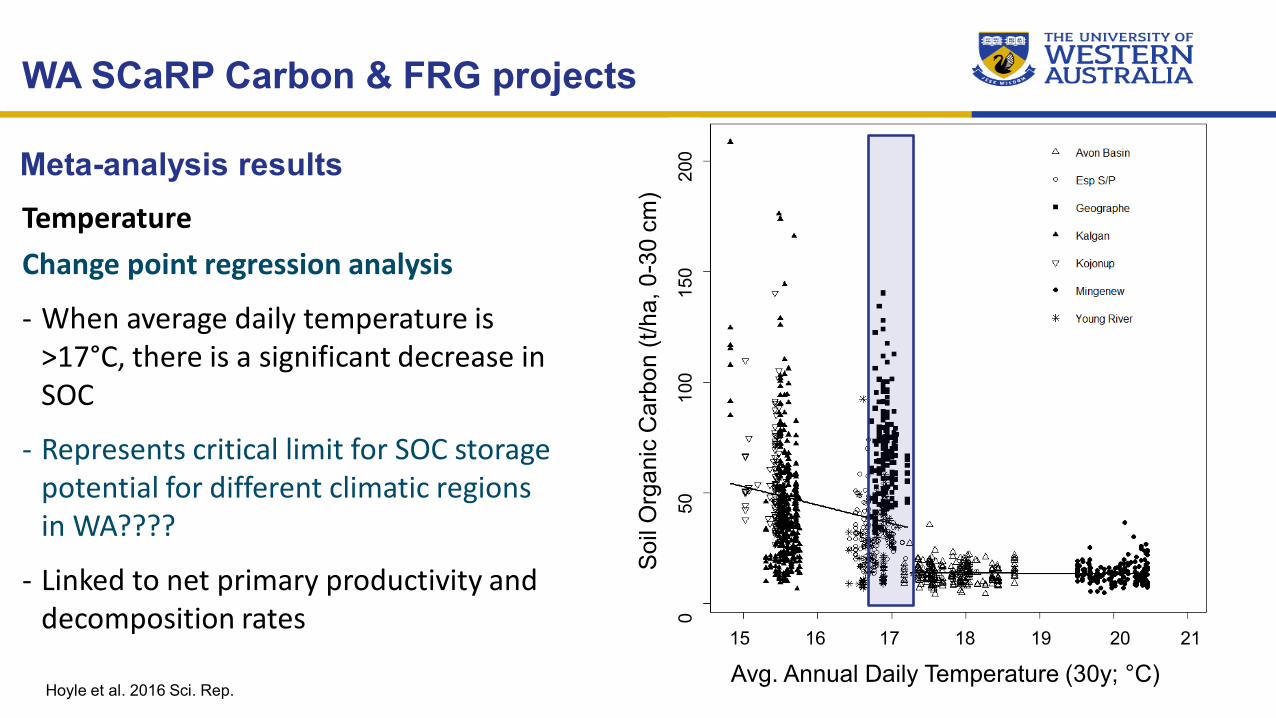
TemperatureChange point regression analysis
- When average daily temperature is >17°C, there is a significant decrease in SOC
- Represents critical limit for SOC storage potential for different climatic regions in WA????
- Linked to net primary productivity and decomposition rates
Annual average daily temperature (30y; °C)So
il or
gani
c ca
rbon
(t C
/ha,
0-3
0cm
)
Hoyle et al. 2016 Sci. Rep.
Soil
Org
anic
Car
bon
(t/ha
, 0-3
0 cm
)Avg. Annual Daily Temperature (30y; °C)15 16 17 18 19 20 21
050
100
150
200Meta-analysis results
WA SCaRP Carbon & FRG projects
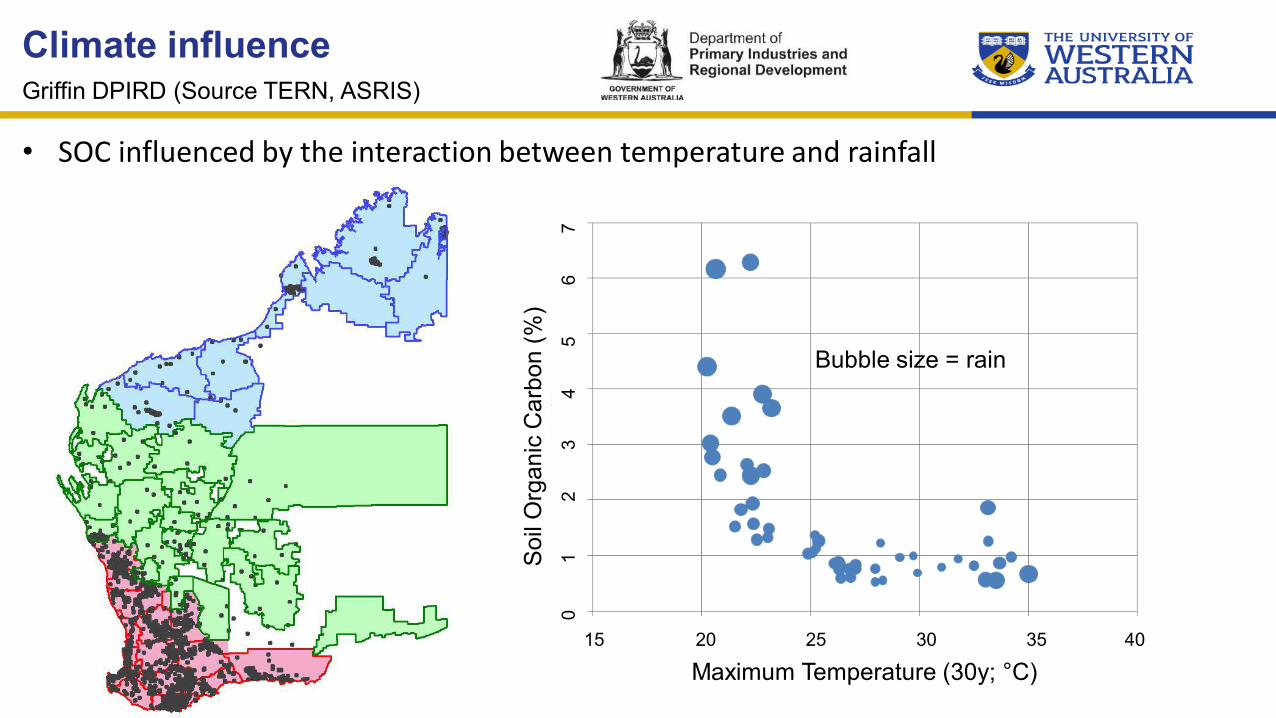
• SOC influenced by the interaction between temperature and rainfall
Bubble size = rain
Griffin DPIRD (Source TERN, ASRIS)
Climate influence
Soil
Org
anic
Car
bon
(%)
0
1
2
3
4
5
6
7
15 20 25 30 35 40
Maximum Temperature (30y; °C)
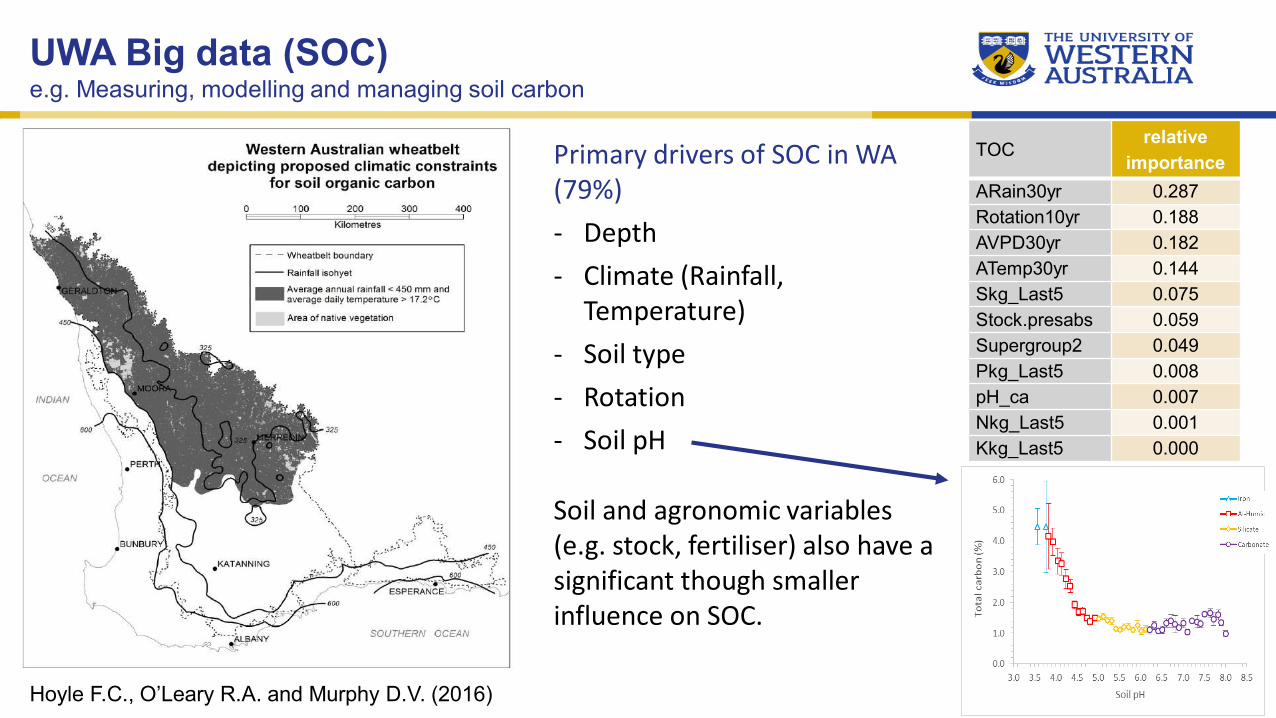
UWA Big data (SOC)e.g. Measuring, modelling and managing soil carbon
Hoyle F.C., O’Leary R.A. and Murphy D.V. (2016)
Primary drivers of SOC in WA (79%) - Depth- Climate (Rainfall,
Temperature)- Soil type - Rotation- Soil pH
Soil and agronomic variables (e.g. stock, fertiliser) also have a significant though smaller influence on SOC.
TOCrelative
importanceARain30yr 0.287Rotation10yr 0.188AVPD30yr 0.182ATemp30yr 0.144Skg_Last5 0.075Stock.presabs 0.059Supergroup2 0.049Pkg_Last5 0.008pH_ca 0.007Nkg_Last5 0.001Kkg_Last5 0.000
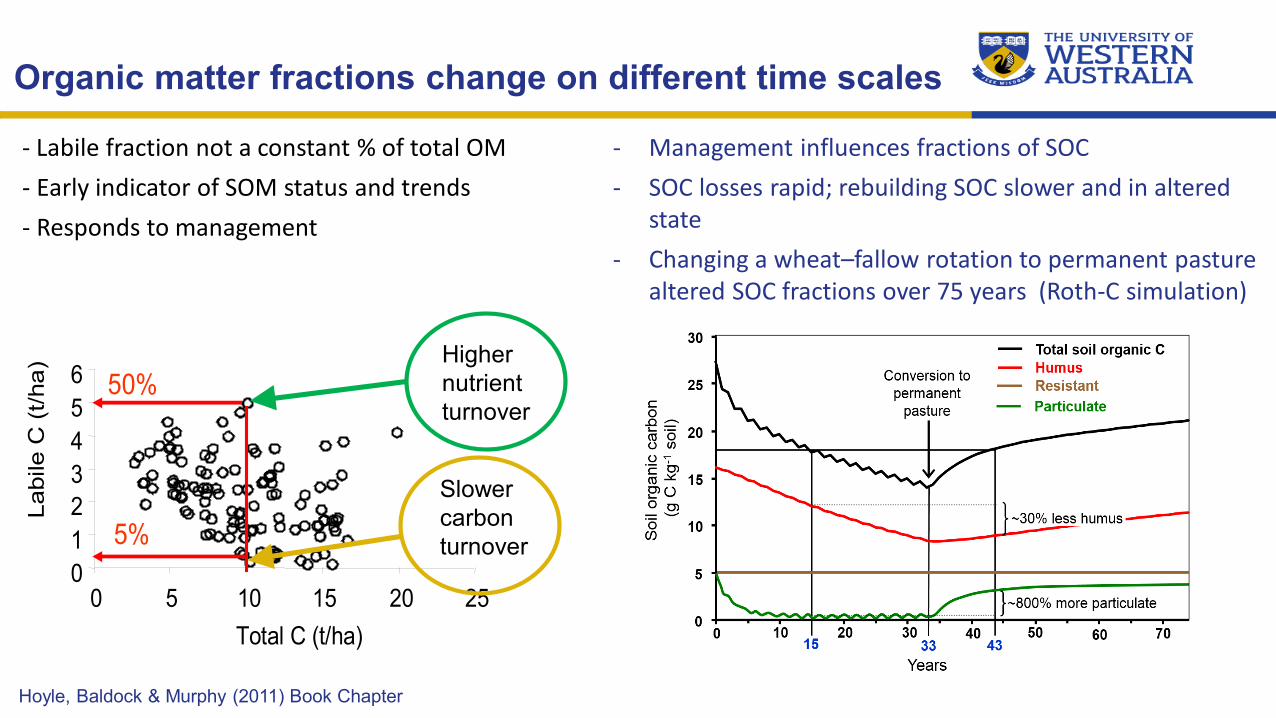
Organic matter fractions change on different time scales
- Labile fraction not a constant % of total OM- Early indicator of SOM status and trends- Responds to management
0123456
0 5 10 15 20 25Total C (t/ha)
Labi
le C
(t/h
a)
5%
50%
0123456
0 5 10 15 20 25Total C (t/ha)
Labi
le C
(t/h
a)
5%
50%
Hoyle, Baldock & Murphy (2011) Book Chapter
Higher nutrient turnover
Slower carbon turnover
- Management influences fractions of SOC- SOC losses rapid; rebuilding SOC slower and in altered
state- Changing a wheat–fallow rotation to permanent pasture
altered SOC fractions over 75 years (Roth-C simulation)
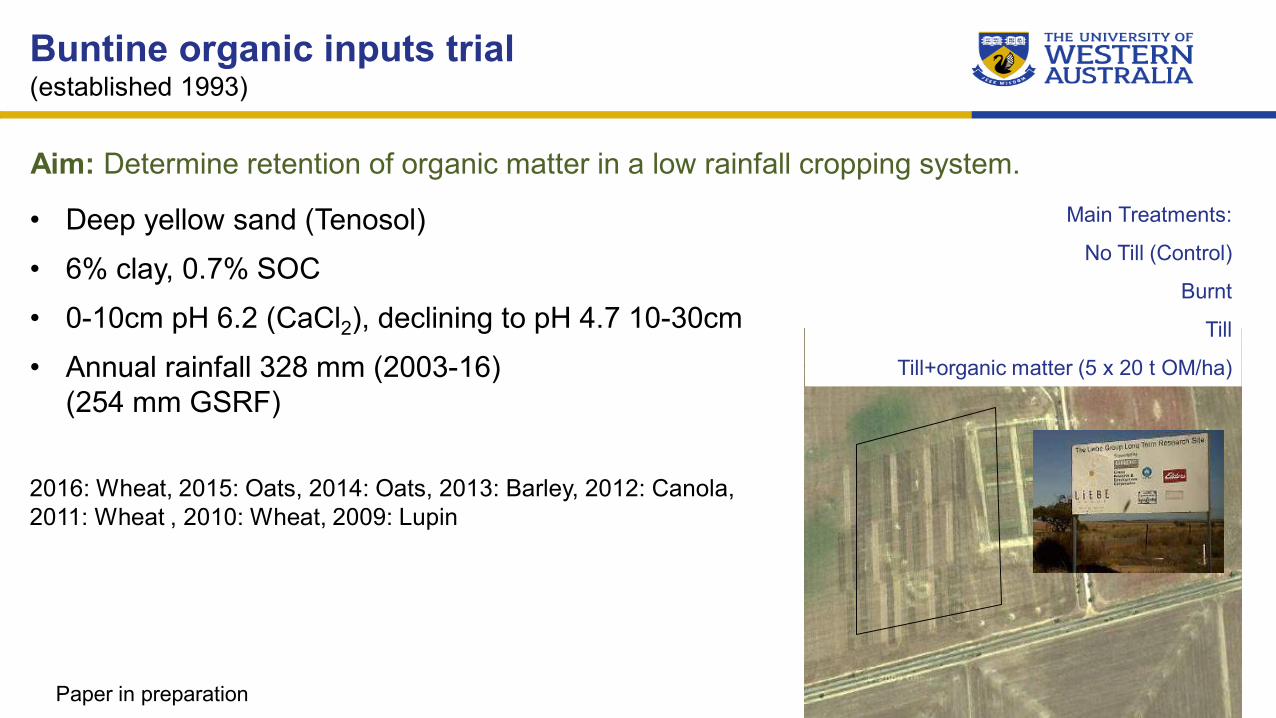
• Deep yellow sand (Tenosol)• 6% clay, 0.7% SOC• 0-10cm pH 6.2 (CaCl2), declining to pH 4.7 10-30cm• Annual rainfall 328 mm (2003-16)
(254 mm GSRF)
2016: Wheat, 2015: Oats, 2014: Oats, 2013: Barley, 2012: Canola, 2011: Wheat , 2010: Wheat, 2009: Lupin
Aim: Determine retention of organic matter in a low rainfall cropping system.
Paper in preparation
Buntine organic inputs trial(established 1993)
Main Treatments:
No Till (Control)
Burnt
Till
Till+organic matter (5 x 20 t OM/ha)
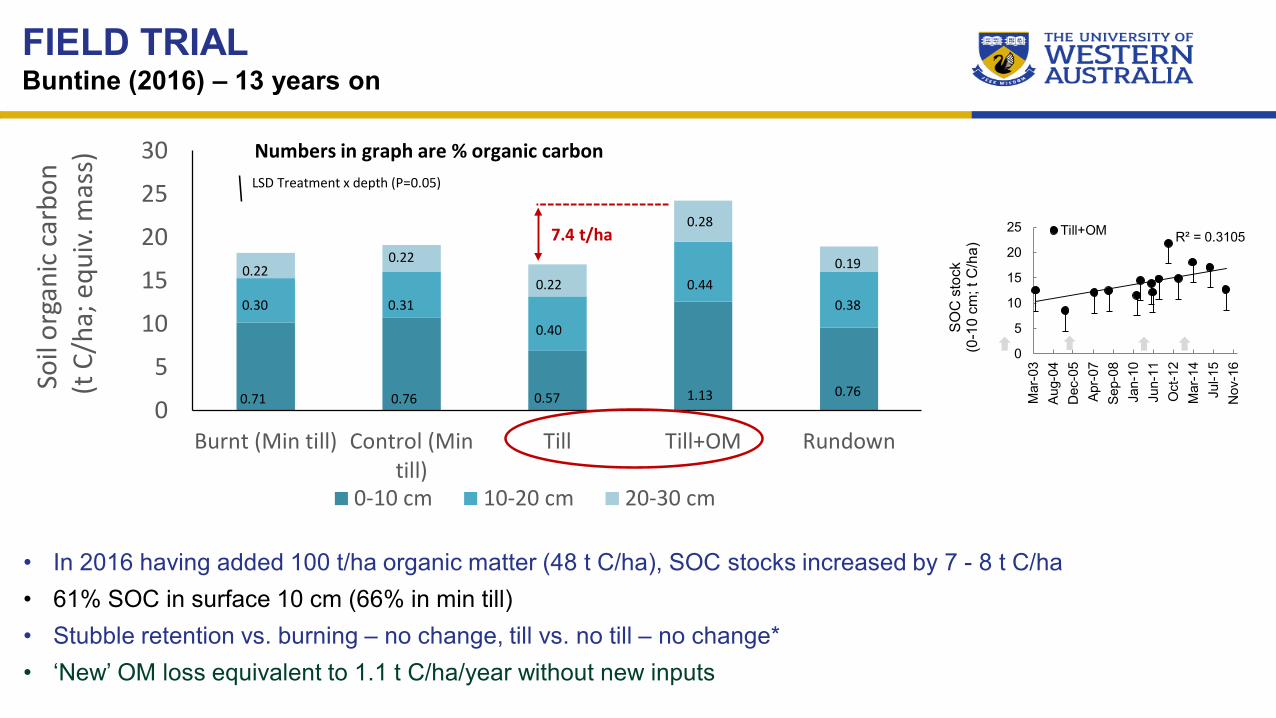
FIELD TRIALBuntine (2016) – 13 years on
• In 2016 having added 100 t/ha organic matter (48 t C/ha), SOC stocks increased by 7 - 8 t C/ha• 61% SOC in surface 10 cm (66% in min till)• Stubble retention vs. burning – no change, till vs. no till – no change*• ‘New’ OM loss equivalent to 1.1 t C/ha/year without new inputs
0
5
10
15
20
25
30
Burnt (Min till) Control (Mintill)
Till Till+OM Rundown
Soil
orga
nic
carb
on(t
C/h
a; e
quiv.
mas
s)
0-10 cm 10-20 cm 20-30 cm
LSD Treatment x depth (P=0.05)
0.71 0.76 0.57 1.13
0.30 0.31
0.40
0.44
0.28
0.22
0.220.22
Numbers in graph are % organic carbon
0.76
0.38
0.19
7.4 t/ha R² = 0.3105
0
5
10
15
20
25
Mar
-03
Aug-
04D
ec-0
5Ap
r-07
Sep-
08Ja
n-10
Jun-
11O
ct-1
2M
ar-1
4Ju
l-15
Nov
-16
SOC
sto
ck
(0-1
0 cm
; t C
/ha)
Till+OM
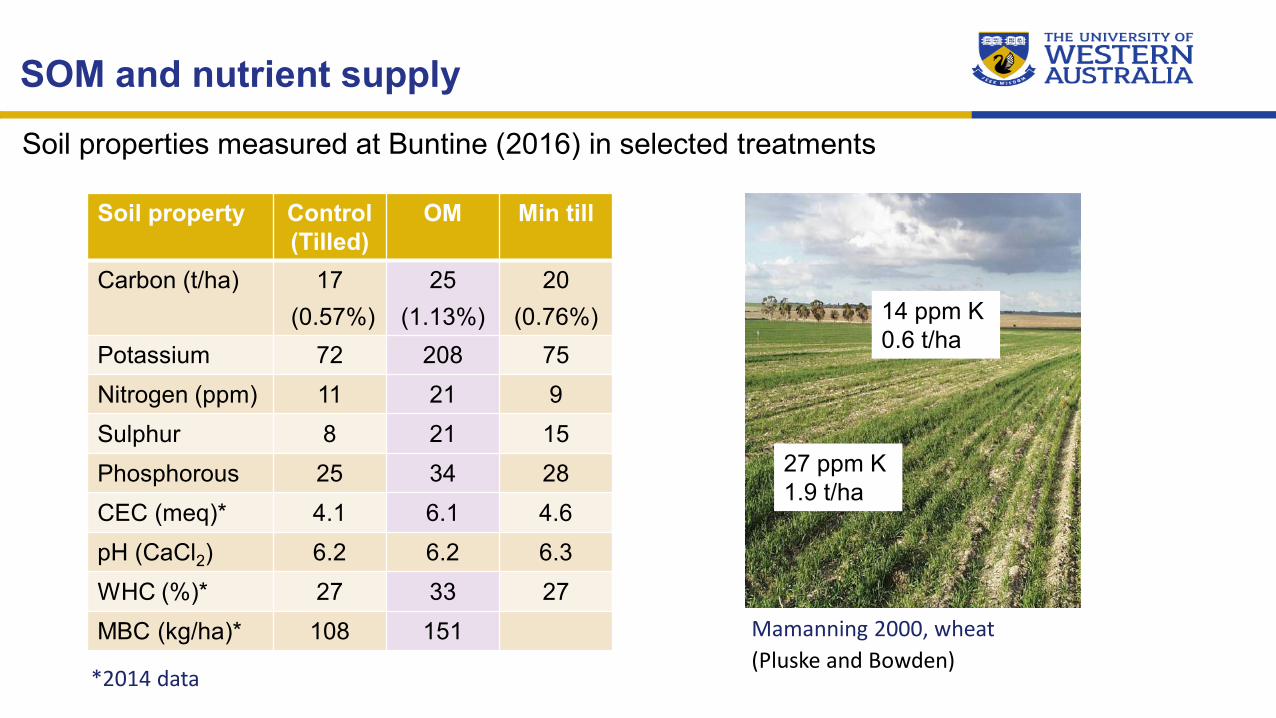
Mamanning 2000, wheat(Pluske and Bowden)
14 ppm K0.6 t/ha
27 ppm K1.9 t/ha
Soil property Control (Tilled)
OM Min till
Carbon (t/ha) 17(0.57%)
25 (1.13%)
20(0.76%)
Potassium 72 208 75Nitrogen (ppm) 11 21 9Sulphur 8 21 15Phosphorous 25 34 28CEC (meq)* 4.1 6.1 4.6pH (CaCl2) 6.2 6.2 6.3WHC (%)* 27 33 27MBC (kg/ha)* 108 151
Soil properties measured at Buntine (2016) in selected treatments
SOM and nutrient supply
*2014 data
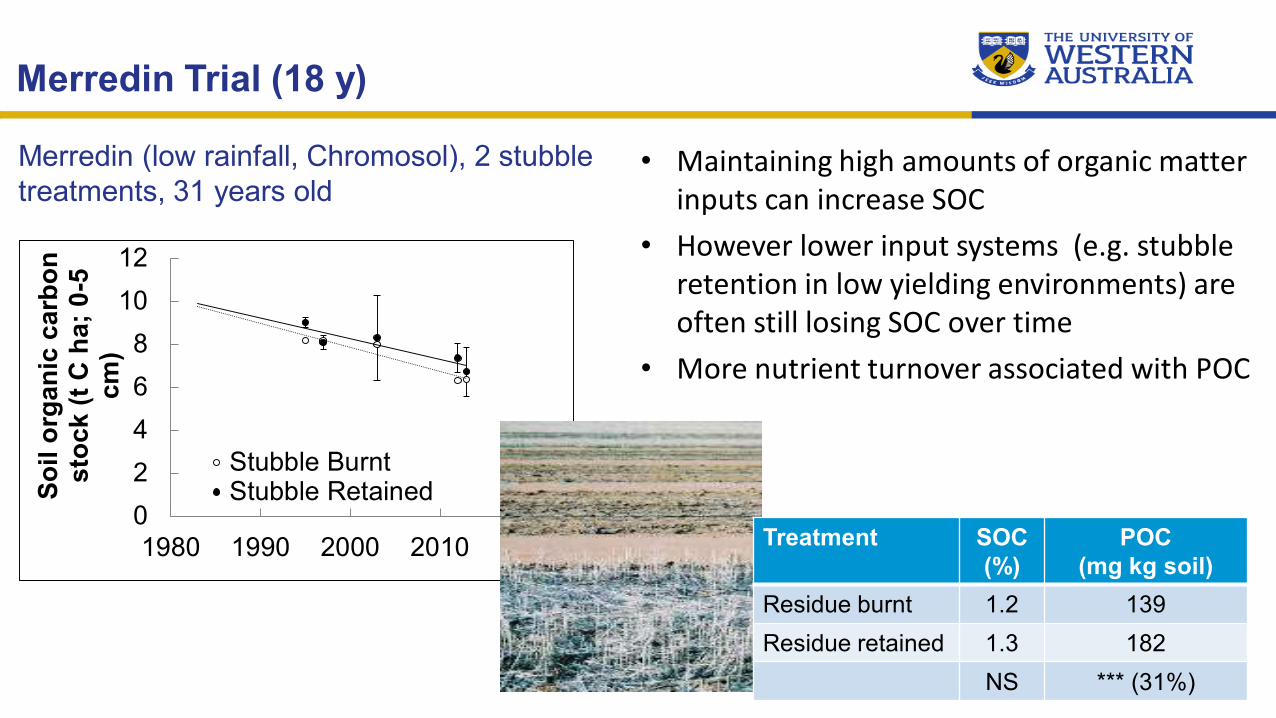
Merredin (low rainfall, Chromosol), 2 stubble treatments, 31 years old
02468
1012
1980 1990 2000 2010 2020
Soil
orga
nic
carb
on
stoc
k (t
C h
a; 0
-5
cm)
Stubble BurntStubble Retained
• Maintaining high amounts of organic matter inputs can increase SOC
• However lower input systems (e.g. stubble retention in low yielding environments) are often still losing SOC over time
• More nutrient turnover associated with POC
Merredin Trial (18 y)
Treatment SOC (%)
POC (mg kg soil)
Residue burnt 1.2 139Residue retained 1.3 182
NS *** (31%)
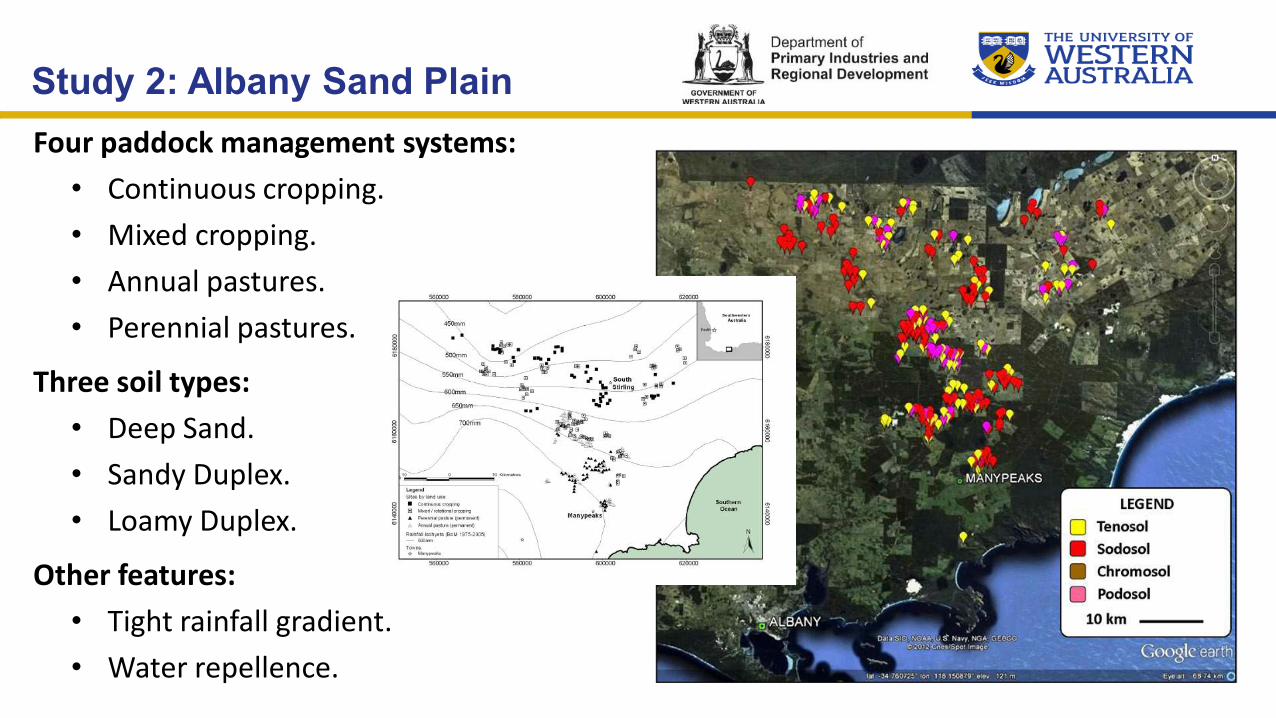
Study 2: Albany Sand PlainFour paddock management systems:
• Continuous cropping.• Mixed cropping.• Annual pastures.• Perennial pastures.
Three soil types:• Deep Sand.• Sandy Duplex.• Loamy Duplex.
Other features:• Tight rainfall gradient.• Water repellence.
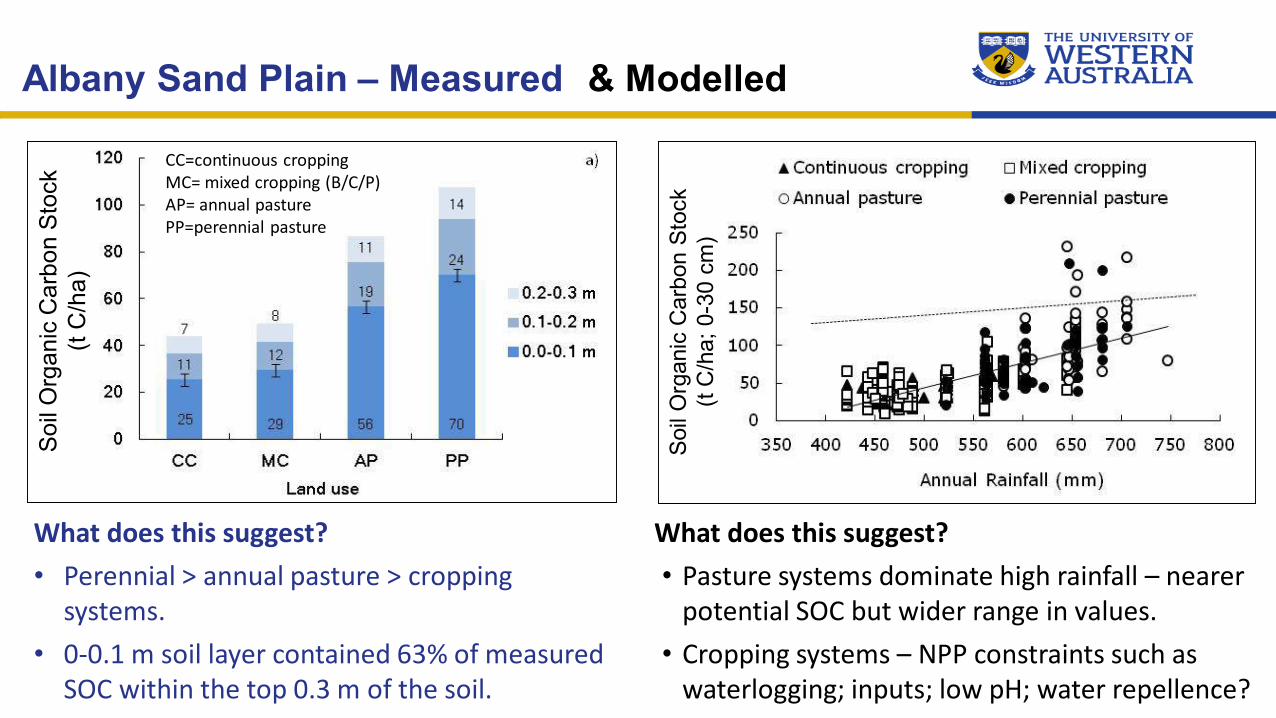
What does this suggest?• Perennial > annual pasture > cropping
systems.• 0-0.1 m soil layer contained 63% of measured
SOC within the top 0.3 m of the soil.
CC=continuous croppingMC= mixed cropping (B/C/P)AP= annual pasturePP=perennial pasture
Albany Sand Plain – Measured
What does this suggest?• Pasture systems dominate high rainfall – nearer
potential SOC but wider range in values.• Cropping systems – NPP constraints such as
waterlogging; inputs; low pH; water repellence?
& ModelledSo
il O
rgan
ic C
arbo
n St
ock
(t C
/ha)
Soil
Org
anic
Car
bon
Stoc
k (t
C/h
a; 0
-30
cm)
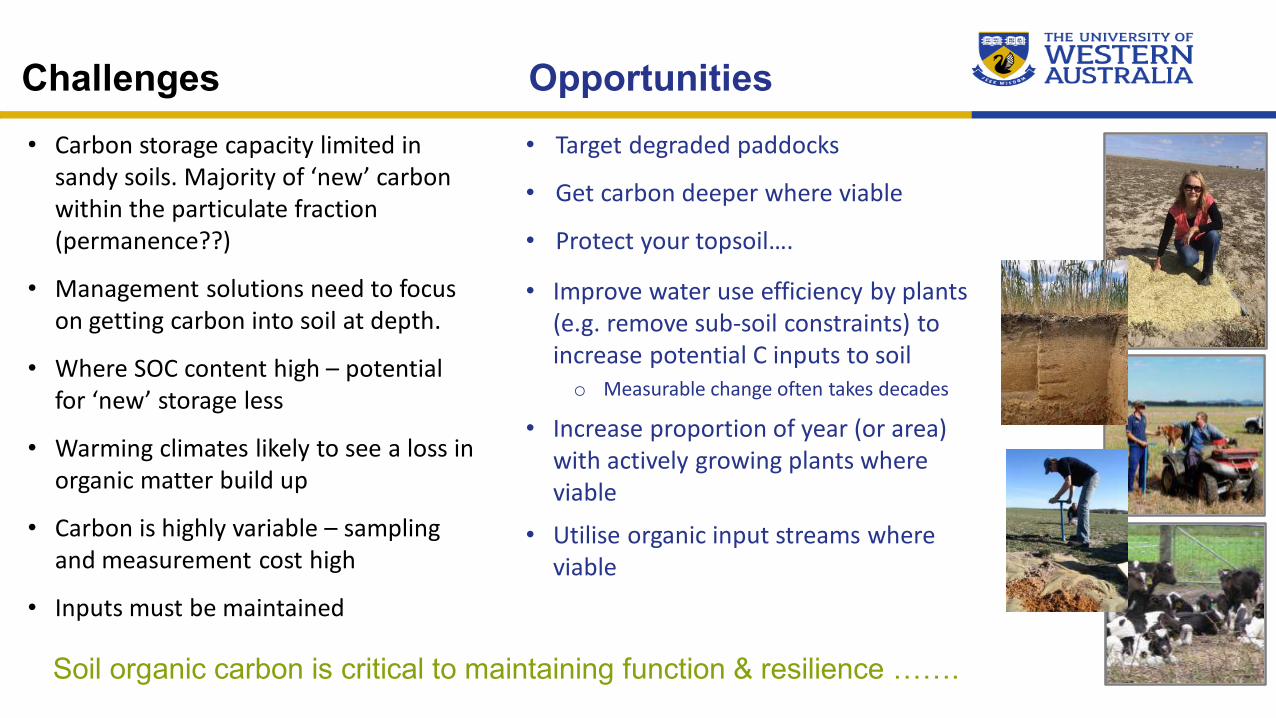
• Carbon storage capacity limited in sandy soils. Majority of ‘new’ carbon within the particulate fraction (permanence??)
• Management solutions need to focus on getting carbon into soil at depth.
• Where SOC content high – potential for ‘new’ storage less
• Warming climates likely to see a loss in organic matter build up
• Carbon is highly variable – sampling and measurement cost high
• Inputs must be maintained
Challenges Opportunities• Target degraded paddocks
• Get carbon deeper where viable
• Protect your topsoil….
• Improve water use efficiency by plants (e.g. remove sub-soil constraints) to increase potential C inputs to soilo Measurable change often takes decades
• Increase proportion of year (or area) with actively growing plants where viable
• Utilise organic input streams where viable
Soil organic carbon is critical to maintaining function & resilience …….
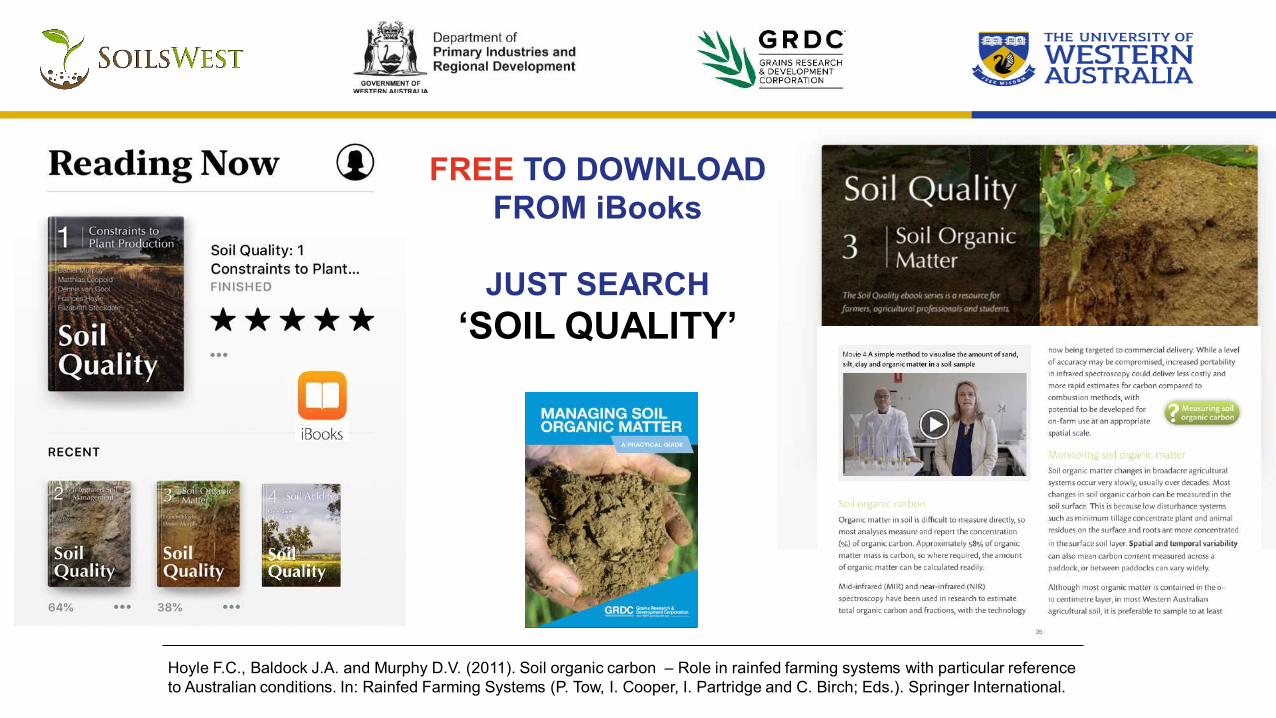
FREE TO DOWNLOADFROM iBooks
JUST SEARCH‘SOIL QUALITY’
Hoyle F.C., Baldock J.A. and Murphy D.V. (2011). Soil organic carbon – Role in rainfed farming systems with particular reference to Australian conditions. In: Rainfed Farming Systems (P. Tow, I. Cooper, I. Partridge and C. Birch; Eds.). Springer International.
