soil erosion, diffuse source pollution and sediment
TRANSCRIPT

SOIL EROSION, DIFFUSE SOURCE POLLUTION AND SEDIMENT
PROBLEMS ASSOCIATED WITH MAIZE CULTIVATION IN ENGLAND
by
MOKHTAR BIN JAAFAR
Thesis submitted in partial fulfillment of the requirement for the Degree of Doctor of Philosophy of the University of Exeter
May 2010

i
SOIL EROSION, DIFFUSE SOURCE POLLUTION AND SEDIMENT
PROBLEMS ASSOCIATED WITH MAIZE CULTIVATION IN ENGLAND
Submitted by MOKHTAR BIN JAAFAR to the University of Exeter as a thesis for the degree of Doctor of Philosophy in Geography, May 2010.
The thesis is available for Library use on the understanding that it is copyright material and that no quotation from the thesis may be published withput proper
acknowledgement.
I certify that all material in this thesis which is not my own work has been identified and that no material has previously been submitted and approved for the award of a degree
by this or any other University.
…………………………….. (MOKHTAR BIN JAAFAR)

ii
Abstract
SOIL EROSION, DIFFUSE SOURCE POLLUTION AND SEDIMENT
PROBLEMS ASSOCIATED WITH MAIZE CULTIVATION IN ENGLAND
This thesis reports an investigation of soil erosion problems associated with maize cultivation in England. To place the investigation into a broader context, the study commences with a review of soil erosion problems more generally, before focusing on the specific on-site and off-site problems associated with maize cultivation. Agricultural statistics are used to quantify the recent expansion of maize cultivation in England and attention is directed to both the temporal trends and spatial patterns involved. A major expansion of maize cultivation occurred in England between 1990 and 2000. Particular attention is then directed to the expansion of maize cultivation in Southwest England, since this is a very important area for cultivation of forage maize.
Against this general background, a more detailed investigation of soil erosion associated with maize fields and its impact on the local streams and rivers was undertaken. This focused on two river catchments, namely the River Culm above Cullompton, Devon, and the River Tone above Taunton, Somerset. These two basins were selected as having a high density of maize fields within their catchments. A detailed field survey was undertaken to identify all the fields used for maize cultivation in the two catchments during 2004 and the previous two years and to provide a map of their location. More detailed work, aimed at quantifying both gross and net rates of soil loss, was undertaken on six fields selected to be representative of maize fields in the two catchments. Beryllium-7 measurements were used to estimate the erosion associated with a period of heavy rainfall in late December 2004 and early January 2005, when the harvest fields were left in a bare compacted conditions, with little or no vegetation cover and field observations indicated that significant erosion occurred. The results obtained from the beryllium-7 measurements which related only to the short period in late 2004 and early 2005 were complemented by caesium-137 measurements in the same fields which were used to obtain an estimate of the longer-term (i.e. ca. 45 years) mean annual erosion rates associated with the more traditional land use that had characterized these fields prior to the introduction of forage maize cultivation. These results indicated that the introduction of maize cultivation increased gross and net rates of soil loss by ca. 4 and 8 times, respectively and significantly increased sediment delivery ratios, resulting in more efficient delivery of sediment from the eroding fields to the streams.
An assessment of the likely impact of sediment mobilised from the maize fields within the catchments of the River Culm and River Tone during winter 2004-5 was made by establishing a sediment monitoring and sampling programme at the downstream gauging stations on these two rivers over the period November 2004 to March 2005. Estimates of the suspended sediment loads of both rivers were obtained for this period and these were compared with an estimate of the total amount of sediment delivered to the water courses in the two catchments from maize fields based on an upscaling of the results obtained from the beryllium-7 measurements undertaken on the six representative fields. Uncertainties regarding both field to channel and within channel

iii
and floodplain conveyance losses precluded definitive comparison of the estimates of the amounts of sediment delivered to the water courses from maize fields with the measured sediment loads. However, the results obtained demonstrated the likely importance of the contribution from eroding maize fields to the suspended sediment loads of the Rivers Culm and Tone during winter 2004-5. The geochemical properties of suspended sediment collected from the two rivers were also compared with the equivalent properties of soil collected from the surface of maize fields within the two study catchments, in order to provide further evidence of the impact of maize cultivation on their suspended loads. The available geochemical data confirmed that much of the sediment transported by the Rivers Culm and Tone could have been mobilized from maize fields, but the lack of detailed geochemical data, precluded a definitive conclusion regarding its source.
The results obtained from the field-based component of the study have been combined with the information on the regional and national patterns of maize cultivation and synthesized to provide a general assessment of the likely environmental impact of maize cultivation in England. This information has in turn been used to consider the potential for developing improved land management practises to reduce the environmental impact of maize cultivation within the context of the EU Common Agricultural Policy (CAP) and the Water Framework Directive (WFD). Finally, recommendations for the further development and extension of the study are provided.

iv
CONTENTS
Page
Declaration i Abstract ii Contents iv List of Tables viii List of Figures x List of Plates xii Abbreviations xiii Acknowledgements xv CHAPTER 1: INTRODUCTION
1.1 Overview 1.2 Soil Erosion on Agricultural Land in England 1.3 Maize Cultivation and Environmental Problem in England 1.4 Research Needs 1.5 Research Aims 1.6 Thesis Structure
1 2 7 10 12 12
CHAPTER 2: RESEARCH STRATEGY
2.1 Overview 2.2 Research Objectives 2.3 Selection of the Study Area 2.3.1 National scale 2.3.2 Regional scale 2.3.3 Local scale 2.3.4 Site scale 2.4 Summary
14 14 15 17 18 19 21 22
CHAPTER 3: METHODOLOGY
3.1 Introduction 3.2 Field Sampling and Sample Preparation 3.2.1 Soil sampling and sample preparation for 7Be measurement 3.2.2 Soil sampling and sample preparation for 137Cs measurement 3.2.3 Soil sampling and sample preparation for 210Pb and chemical
analysis 3.2.4 River water sampling and sample preparation for suspended
sediment analysis 3.3 Laboratory Analysis 3.3.1 Radionuclide measurement 3.3.1.1 Measurement of 7Be and 137Cs activity in soil samples 3.3.1.2 Measurement of excess 210Pb in soil and suspended sediment
samples 3.3.2 Total organic carbon (C) and nitrogen (N) analysis 3.3.3 Heavy metal analysis 3.3.4 Base cations analysis 3.3.5 Total phosphorus analysis
24 24 25 27 29
30
31 31 33 35
36 38 39 39

v
3.4 Data Manipulation and Analysis 3.4.1 DEFRA data 3.4.2 Edinburgh Library data 3.4.3 CEH data 3.4.4 Field mapping data 3.5 Summary
39 40 40 41 42 42
CHAPTER 4: MAIZE CULTIVATION IN ENGLAND AND THE
SOUTHWEST REGION
4.1 Introduction 4.2 Maize Cultivation: An Overview 4.3 The Data Used in this Analysis 4.4 Maize Cultivation in England 4.5 Maize Cultivation in the Southwest Region 4.6 Conclusion
43 44 50 51 61 67
CHAPTER 5: MAIZE CULTIVATION IN THE CULM AND TONE
CATCHMENTS
5.1 Introduction 5.2 Spatial and Temporal Patterns of Maize Cultivation in the Culm and
Tone Catchments 5.2.1 Maize cultivation in the Culm Catchment 5.2.2 Maize cultivation in the Tone Catchment 5.3 The Connectivity of the Maize Fields and the River Networks 5.3.1 The connectivity between maize fields and river network in the
Culm Catchment 5.3.2 The connectivity between maize fields and river network in the
Tone Catchment 5.3.3 Discussion 5.4 Conclusion
70 70
71 77 81 82
83
93 96
CHAPTER 6: SOIL EROSION ASSOCIATED WITH MAIZE
CULTIVATION
6.1 Introduction 6.2 Study Site 6.2.1 Study sites in the Culm Catchment 6.2.1.1 The Dalwood Farm study site 6.2.1.2 The Little Landside Farm study site 6.2.1.3 The Westcott Farm study site 6.2.2 Study sites in the Tone Catchment 6.2.2.1 The Cutsey Farm study site 6.2.2.2 The Higher Woodbrook Farm study site 6.2.2.3 The Ritherden Farm study site 6.3 Use of 7Be to Document Short-Term Erosion Rates 6.3.1 Origin of 7Be 6.3.2 Use of 7Be to investigate soil redistribution 6.3.2.1 Assumption of the 7Be technique 6.3.2.2 Converting 7Be measurements into estimates of soil
redistribution
97 97 99 99 100 100 101 101 101 102 102 102 103 104 105

vi
6.3.3 7Be soil sampling programme 6.4 Investigation of Short-Term Soil Erosion in the Study Fields 6.4.1 7Be measurements 6.5 Use of 137Cs to Document Longer-Term Erosion Rates 6.5.1 Production of 137Cs 6.5.2 The 137Cs technique 6.5.2.1 Assumption of the 137Cs technique 6.5.2.2 Converting the 137Cs measurements into soil redistribution
rates 6.5.3 137Cs soil sampling programme 6.6 Investigation of Longer-Term Soil Erosion Rates 6.6.1 137Cs measurements 6.7 Discussion of the Estimates of Short-Term and Longer-Term Erosion
Rates Provided by the 7Be and 137Cs measurements 6.8 Conclusion
107 110 110 115 115 116 117 118
122 122 123 127 132
CHAPTER 7: RIVER MONITORING AND SEDIMENT
INVESTIGATIONS IN THE RIVERS CULM AND TONE
7.1 Introduction 7.2 The River Monitoring and Sediment Investigation Programme 7.3 Results from the Sediment Monitoring Programme 7.3.1 The relationships between sediment concentration (SSC) and
turbidity (FTU) 7.3.2 Estimation of sediment load (SSL) and sediment yield (SY) 7.3.3 Comparison of the sediment loads of the Rivers Culm and Tone
with estimates of the sediment generated by erosion of the maize fields during the study period
7.4 Analysis of Sediment Properties 7.5 Conclusion
133 133 136 136
137 141
145 147
CHAPTER 8: THE ENVIRONMENTAL IMPACT OF MAIZE
CULTIVATION IN ENGLAND
8.1 Introduction 8.2 Soil Erosion Associated with Maize Cultivation 8.3 Soil Types and the Distribution of Maize Cultivation 8.4 Diffuse Pollution Associated with Maize Cultivation 8.5 Conclusion
149 150 159 161 163
CHAPTER 9: MAIZE CULTIVATION MANAGMENT
9.1 Introduction 9.2 Erosion Control Associated with Maize Cultivation 9.3 The Common Agricultural Policy (CAP) and Maize Cultivation 9.3.1 Single Farm Payment (SFP) scheme 9.3.2 The Environmental Stewardship Scheme (ESS) 9.4 Catchment Sensitive Farming (CSF) 9.5 The Agri-Environment Scheme (AES) and Code of Good Agriculture
Practise (COGAP) 9.6 The Water Framework Directive (WFD) and Diffuse Water Pollution
from Agriculture (DWPA)
165 166 171 172 176 180 185
190

vii
9.7 Discussion and Recommendations 9.8 Conclusion
192 197
CHAPTER 10: CONCLUSION
10.1 Introduction 10.2 Maize Cultivation in England: Spatial and Temporal Characteristics and
Trends 10.3 Rates of Soil Loss Associated with Maize Cultivation in England 10.4 The Contribution of Maize Cultivation to the Suspended Sediment
Loads of Local Rivers 10.5 The Environmental Impact of Maize Cultivation in England 10.6 Maize Cultivation Management in England 10.7 The Wider Contribution of the Study 10.8 Recommendations for Future Work 10.9 Concluding Remarks
199 201
202 204
206 207 207 210 213
REFERENCES 214

viii
LIST OF TABLES
Table Page
4.1 A ranked list silage maize and grain maize production within European countries in 1999
45
4.2 Changes in the maize cultivation area in England between 1970 and 2004
52
4.3 The maize cultivation area for all regions in England 57 4.4 The area of maize cultivation and the number of dairy cows in the
Southwest in 1990, 1995 and 2000 68
5.1 The area of maize cultivation and the number of maize fields in the Culm Catchment in 2002, 2003 and 2004
74
5.2 The overlay analysis results for the area of maize cultivation in the Culm Catchment for 2002, 2003 and 2004
76
5.3 The area of maize cultivation and the number of maize fields in the Tone Catchment in 2002, 2003 and 2004
81
5.4 The overlay analysis results for the area of maize cultivation in the Tone Catchment for 2002, 2003 and 2004
81
5.5 The number of maize fields with regard to distance from the River Culm channel network in 2002
87
5.6 The number of maize fields with regard to distance from the River Culm channel network in 2003
87
5.7 The number of maize fields with regard to distance from the River Culm channel network in 2004
87
5.8 The number of maize fields with regard to distance from the River Tone channel network in 2002
92
5.9 The number of maize fields with regard to distance from the River Tone channel network in 2003
92
5.10 The number of maize fields with regard to distance from the River Tone channel network in 2004
92
6.1 Number of sampling points 110 6.2 The mean inventory and reference inventory values for the study
fields 111
6.3 The values of GER, NER and SDR associated with estimate the of short-term erosion rate for the six study fields
115
6.4 Number of sampling points 123 6.5 The mean inventory and reference inventory values 124 6.6 The estimates of longer-term values of GER, NER and SDR provided
for the six study fields by the 137Cs measurements 127
6.7 Comparison of GER, NER and SDR of short- and longer-term soil erosion, represented by 7Be and 137Cs
129
7.1 Average values of estimated SSC (mg l-1) for the Rivers Tone and Culm during the study period
141
7.2 Estimated values of SSL and SY for Rivers Tone and Culm 141 7.3 A comparison of the estimates of sediment input to the river systems
of the Culm and Tone catchments from the maize fields during the new winter of 2004-5 with the measured suspended sediment load for this period
144

ix
7.4 Mann-Whitney U-test results for a comparison of the geochemical
properties of surface soils from eroding maize fields and suspended sediment collected in the Culm and Tone basins
147
9.1 Summary of investigations aimed at controlling erosion associated with fodder maize cultivation
169
9.2 Good Agricultural and Environmental Condition (GAEC) in use for cross-compliance guidance for the management of habitats and landscape features in 2005
173
9.3 Statutory Management Requirements regimes 174 9.4 Erosion risk category with regard to risk classes and soil types 176 9.5 Sign of runoff risk with regard to risk classes and soil types 176 9.6 List of farmer objectives and practices 183 9.7 Some examples of the environmental issues associated with maize
cultivation in the ECSFDI scheme 186
9.8 A summary of the key elements in the Code of Agricultural Practice for the Protection of Soil
189
9.9 An example of choosing correct early-maturing maize based on maturity score
194

x
LIST OF FIGURES
Figure Page
2.1 Flow chart of the project 16 4.1 Trends in maize cultivation in England between 1970 and 2004 52 4.2 The distribution of maize cultivation in England in 1979 54 4.3 The distribution of maize cultivation in England in 1988 55 4.4 The distribution of maize cultivation in England in 1995 58 4.5 The distribution of maize cultivation in England in 2000 60 4.6 Trends in cropland area in the Southwest between 1950 and 2003 62 4.7 Trends in cropland area for each county in the Southwest between
1950 and 2003 62
4.8 Trend in maize cultivation for each county in the Southwest between 1990 and 2003
63
4.9 The distribution of maize cultivation in the Southwest Region (1979) 64 4.10 The distribution of maize cultivation in the Southwest Region (1988) 65 4.11 The distribution of maize cultivation in the Southwest Region (1995) 66 4.12 The distribution of maize cultivation in the Southwest Region (2000) 66 5.1 The spatial distribution of maize cultivation density in the Culm
Catchment in 1979(a), 1988(b), 1995(c) and 2000(d) 72
5.2 The spatial distribution of maize cultivation in the Culm Catchment in 2002(a), 2003(b) and 2004(c)
75
5.3 The spatial distribution of maize cultivation density in the Tone Catchment in 1979(a), 1988(b), 1995(c) and 2000(d)
78
5.4 The spatial distribution of maize cultivation in the Tone Catchment in 2002(a), 2003(b) and 2004(c)
80
5.5 An example of buffering analysis and spatial distribution of maize cultivation in the Culm Catchment in 2002
84
5.6 An example of buffering analysis and spatial distribution of maize cultivation in the Culm Catchment in 2003
85
5.7 An example of buffering analysis and spatial distribution of maize cultivation in the Culm Catchment in 2004
86
5.8 An example of buffering analysis and spatial distribution of maize cultivation in the Tone Catchment in 2002
89
5.9 An example of buffering analysis and spatial distribution of maize cultivation in the Tone Catchment in 2003
90
5.10 An example of buffering analysis and spatial distribution of maize cultivation in the Tone Catchment in 2004
91
5.11 The area of maize cultivation (%) with regard to the distance from river networks
95
6.1 (a) The location of Culm Catchment (Devon) and Tone Catchment (Somerset) in the Southwest region, and (b) six study fields in both catchments
98
6.2 Total rainfall at the Hemyock and Clayhanger rain gauge stations for the period November 2004 to March 2005
109
6.3 Total daily rainfall at the Hemyock and Clayhanger rain gauge stations for the period 20 December to 10 January 2005
109

xi
6.4 The depth distribution of 7Be in a stable soil profile from a reference site
111
6.5 Estimates of erosion and deposition derived from 7Be measurements for the two transects representative of three maize fields in the Culm Catchment at (a) Dalwood, (b) Little Landside and (c) Wescott
113
6.6 Estimates of erosion and deposition derived from 7Be measurements for the two transects representative of three maize fields in the Tone Catchment at (a) Cutsey, (b) Higher Woodbrook and (c) Ritherdeen
114
6.7 137Cs estimates of erosion and deposition for the two transects representative of three maize fields in the Culm Catchment at (a) Dalwood, (b) Little Landside, and (c) Wescott
125
6.8 137Cs estimates of erosion and deposition for the two transects representative of three maize fields in the Culm Catchment at (a) Cutsey, (b) Higher Woodbrook, and (c) Ritherdeen
126
7.1 The relationships between suspended sediment concentration and turbidity established for (a) the River Tone at the Bishop’s Hull gauging station, and (b) the River Culm at the Woodmill gauging station
139
7.2 Estimates of daily mean SSC for the two study catchments for the study period November 2004 to March 2005
140
8.1 Monthly rainfall in England between 2002 and 2006 153 8.2 The distribution of rainfall in the Southwest, the Southeast and West
Midlands between October 2005 and March 2006 153
8.3 Comparison between the spatial distribution of sediment transport capacity of overland flow
156
8.4 Comparison between (a) the connectivity index, (b) spatial distribution of maize cultivation in England in 2000, and (c) connectivity ratio
157
8.5 Erosion vulnerability for (a) 1-in-1 year erosion events, and (b) for 1-in-10 year erosion events
158
8.6 Comparison between (a) soil types and (b) the spatial distribution of maize cultivation in England in 2000
160
8.7 (a) Areas at risk of phosphorus pollution and (b) the distribution of maize cultivation in 2000
162
8.8 (a) Catchments at risk from diffuse agricultural pollution and (b) the distribution of maize cultivation in 2000
163
9.1 The links between the various policies, schemes and initiatives which influence farming practices in the England
166
9.2 The location of the ESAs programme 181 9.3 List and map of priority areas under the England Catchment
Sensitive Farming Delivery Initiative (ECSFDI) 184
9.4 Map shows the Nitrate Vulnerable Zones in England 191

xii
LIST OF PLATES
Plate Page
3.1 Plastic core tube used in 7Be soil sampling 26 3.2 Soil samples in a freezer 26 3.3 Soil samples in the freezer drier 26 3.4 The rotary sieve used for disaggregating and sieving soil samples 27 3.5 The fine fraction of a soil sample contained in a medium-sized
Marinelli beaker 27
3.6 Metal corer and motorized percussion hammer used in 137Cs soil sampling
28
3.7 Soil samples for chemical analysis were disaggregated using a pestle and mortar
29
3.8 The Heraeus Multifuge 4 KR Centrifudge 31 3.9 A hyperpure germanium coaxial γ-detector 32 3.10 The CE Instruments NA 2500 elemental analyzer used for C and N
analyses 37
3.11 The Atomic Absorption Spectrophotometer used for heavy metal analysis
38

xiii
ABBREVIATIONS
AAPS Arable Area Payment Scheme AAS Atomic Absorption Spectrophotometry ACL Agricultural Land Classification AES Agri-Environment Scheme Bq Becquerel CAP Common Agricultural Policy CEH Centre for Ecological Hydrology CIA Central Intelligence Agency COGAP Code of Good Agricultural Practise CSF Catchment Sensitive Farming CSS Countryside Stewardship Scheme DC The number of dairy cows CS Countryside Stewardship DEFRA Department of Environment, Food and Rural Affairs DM Dry matter (maize silage) DWPA Diffuse Water Pollution from Agriculture EA Environment Agency EAS Environmentally Sensitive Areas ECSFDI England Catchment Sensitive Farming Delivery Initiative EL Edinburgh Library ELS Entry Level Stewardship ESA Environmentally Sensitive Area ESS Environmental Stewardship Scheme ETDA Ethylene diamine-tetra acid EU European Union EUWFD European Union Water Framework Directive FAO Food and Agriculture Organization FEP Full energy peak FER Farm Environment Record FMD Foot and Mouth Disease FRP Filterable reactive P GAEC Good Agricultural and Environmental Condition GER Gross erosion rate GIS Geographical Information Systems HLS Higher Level Stewardship HPGe High-purity germanium IACR Institute of Arable Crops Research IGER Institute of Grassland and Environmental Research LCM Land Cover Map LFA Less Favoured Area MAFF Ministry of Agriculture, Fisheries and Food MC Area under maize cultivation NER Net erosion rate NVZ Nitrate Vulnerable Zones OELS Organic Entry Level Stewardship POS Protection of Soil

xiv
POW
Protection of Water
RBMP River Basin Management Plan RBPG River Basin Planning Guidance RPA Rural Payment Agency RQO River Quality Objective SDA Severely Disadvantage Areas SDR Sediment delivery ratio SFPS (SFP) Single Farm Payment Scheme SMP Soil Management Plan SMR Statutory Management Requirements SOAEFD The Scottish Office Agriculture, Environment and Fisheries
Department SPS Single Payment Scheme SSC Suspended sediment concentration FTU Formazin Turbidity Unit SSL Suspended sediment load SY Sediment yield TPO Tree Preservation Orders TSE Transmissible Spongiform Encephalopathies USLE Universal Soil Loss Equation WFD Water Framework Directive

xv
ACKNOWLEDGEMENTS
Firstly, my thanks go to my supervisors; Prof. Des Walling and Dr Yusheng Zhang, to whom I am particularly indebted for the support, ideas, supervision and encouragement that they have provided throughout my time as a PhD student. Special thanks are also due to the School of Geography, University of Exeter, and particularly to Jim Grapes, Diane Fraser and Andy Bartram for the provision of valuable technical support. The help and cooperation of many landowners in the Culm and Tone catchments, who allowed access to their land and permitted collection of soil and sediment samples is also gratefully acknowledged. This study could not have been undertaken without the support of the Universiti Kebangsaan Malaysia and the Ministry of Higher Education Malaysia. I wish to express my gratitude to the Ministry of Higher Education for provision of a scholarship and to my University for granting leave of absence to enable me to undertake PhD studies in the UK. Finally, I wish to express my humble gratitude to my colleagues in the School of Social, Development and Environmental Studies, Faculty of Social Sciences and Humanities, Universiti Kebangsaan Malaysia for their support and encouragement, and to my father, Jaafar Mahussain, who has patiently supported me in so many ways.

1
CHAPTER 1: INTRODUCTION
1.1 Overview
Globally, land degradation is studied by scientists, such as geomorphologists, engineers
and ecologists in order to understand physical processes. In particular, soil erosion is
one of the physical processes of land degradation that can cause serious environmental
problems.
Pimentel and Kounang (1998) estimated that about 75 billion tonne of soils are eroded
from the world’s terrestrial ecosystems each year. In most cases, agricultural land is the
most at risk of being eroded, losing soil at rates ranging from 13 t/ha/yr to 40 t/ha/yr.
The authors also state that worldwide, erosion rates range from a low of 0.001-2 t/ha/yr
on relatively flat land with grass and/or forest cover to rates ranging from 1-5 t/ha/yr on
mountainous regions with normal vegetation cover. Many scientists also agree that the
rate of soil erosion, either by wind or water, frequently exceeds the rate of soil
formation. For example, over a period of 100 years at an erosion rate of 2 t/ha/yr on 10
ha, erosion deposits soil equivalent to about 1 ha of land with a soil depth of 15 cm
(Pimentel and Kounang, 1998).
Agricultural land is probably the greatest contributor to soil loss in the world. According
to the FAO (2003), about one-third of agricultural land is planted for crops, and
cropland is more highly susceptible to erosion as a result of tillage practises, which
expose the soil to wind and water erosion. Serious on-farm soil erosion reduces overall
crop productivity. This is associated with loss of organic matter and plant nutrients in

2
the erosion process, together with a reduction of soil depth. In addition, soil erosion by
water on slopes will decrease the infiltration capacity and this will result in increased
runoff and decreased water-storage. Wiebe (2003) estimated that the global crop
production loss caused by erosion is highest for potatoes at 0.6% per year, followed by
millet (0.48%), and maize (0.42%). It has also been estimated that the total anual cost of
erosion from agricultural land in the USA is about US$44 billion per year, which is
equivalent to US$247 per ha of cropland and pasture (Eswaran et al. (various years) in
Wiebe, 2003).
Off-farm impacts of soil erosion from agricultural land are varied, but serious
environmental problems on agricultural terrain commonly start when runoff
transporting soil particles reaches water bodies or streams. This will affect the
biological status of water systems, degrading water quality and threatening aquatic life,
and can cause flooding when overflow occurs because of sedimentation. The cost of the
damage associated with the off-farm impacts of soil erosion is difficult to quantify
precisely but it is generally high and of a similar magnitude to the on-site costs, and
perhaps higher.
1.2 Soil Erosion on Agricultural Land in England
Archaeological studies have suggested that soil erosion has probably taken place in
England since the clearance of land for agriculture in the Bronze Age (Bell and
Boardman, 1992). However, soil erosion has really only been recognized as a serious
environmental problem in England since the 1970s, and is often associated with
negative impacts resulting from inappropriate land management. Robinson (1999) listed
a number of studies of soil erosion in the United Kingdom that demonstrate the

3
seriousness of soil erosion on agricultural land in the region. This include Reed (1979),
Boardman (1984), and Robinson and Blackman (1990). Prior to the 1970s, most soil
erosion problems in the United Kingdom were associated with the upland areas and
were caused by overgrazing. This included upland peat moors where sheep undercut the
turf and damaged and exposed the bare surface to wind erosion, especially during dry
periods. However since then, soil erosion by water has increased in England and more
arable land is at more risk of erosion by water than by wind, especially on sandy and
sandy loam soils (Evans, 1990; 1992). Morgan (1985) noted that most of these soils
used for arable farming in the Midland and Eastern counties of England are readily
susceptable to soil erosion after sudden storms. In addition, rilling of arable land is more
widespread on sandy soils, and is also common on light loams and loamy soils with a
high silt content (Evans, 1992).
The serious impact of soil erosion in England has generally been blamed on adverse
changes associated with agricultural activities, such as mismanagement and
environmentally unfriendly attitudes among farmers and harvest contractors. According
to Unwin’s (2001) classification of agricultural land in England, it is the areas below an
altitude of 150 m and rainfall of over 1000 mm, with intensive cropping, which are most
at risk of soil erosion. Solomon (1997) reported that the total area of arable crops
considered as being at very high risk of water erosion in England is 17,990 ha with
62,170 ha of crops at high risk, and 74,590 ha of crops at locally high risk.
Twenty years ago most agricultural land was used for the growing of spring-sown
barley and winter wheat and the production of grass for cattle and sheep. However, in
the 1980s and 1990s, and in more recent years, the arable land has been autumn-drilled

4
for winter cereals, in response to the better yields. The crop cover provided by winter
cereals is low throughout the winter period and exposes the soil surface to heavy
rainfall, which can create rills and gullies within the fields and cause floods
downstream. Currently, maize growing is becoming a major environmental issue in
England, due to its association with bare soil during the late autumn of winter period,
which frequently coincides with periods of heavy rain. A more detailed discussion on
this with particular issue will be provided in the next section (1.3).
The causes of soil erosion on agriculture land are mainly related to on-farm activities,
and are the result of factors such as the failure of agricultural policy and socio-economic
pressure. Inman (2006) discussed some of the causes of soil erosion on agriculture land
in England and Wales. He suggests that one of the key on-farm activities that
encourages soil erosion is the growing crops on inappropriate land. This is closely
related to unsuitable soil types which are too fragile to resist the erosive energy of
rainfall and snow melt. Crops have also been grown on more marginal land, particularly
on steep slopes. Rills may develop during periods of heavy rainfall.
Another significant cause of soil erosion is inappropriate timing of agricultural
practises. This relates to ploughing and harvesting land during winter periods or under
wet conditions. Ploughing and harvesting using heavy machinery can cause soil
compaction and destroy soil structure. These conditions will increase surface runoff and
soil erosion that cause the depletion of soil nutrients.
Late sowing in the autumn and delayed harvesting in the late autumn of winter periods
will increase the risks of soil erosion. Both situations will leave the land with a lack of

5
ground cover to protect the soil surface from rainfall impact. Exposure of bare soil
surfaces to winter rainfall is likely to result in the development of rills and gullies, and
these will increase the rate of on-site soil erosion.
Most of the measurements of water erosion in England have recorded relatively low
rates of soil loss. For example, Walling and Quine (1991) reported a net erosion rate
from a sugar beet field at Rufford Forest Farm in Nottinghamshire of 10.5 t/ha/yr. The
average soil erosion rate from bare loamy sands of the Bridgnorth series in Shropshire
has been reported as 11.3 t/ha/yr (Fullen, 1992). Brazier (2004) listed the results of soil
erosion studies undertaken at various places in the UK, involving various soil types, and
his data indicated that average soil erosion rates range from 0.22 to 4.89 t/ha/yr.
However, studies based on 137Cs surveys reported by Walling & Quine (1995) indicated
that soil erosion rates at various places in the UK ranged from 0.6 to 10.5 t/ha/yr.
Brazier (2004) showed that based on several field survey in the UK, the erosion rates
ranged from 0.001 to 6.3 t/ha/yr in various soil types. In addition, Morgan (1985)
reported that the erosion rates in the UK from cultivated land ranged from 0.01 to 0.30
kg/m2/yr, and 1.00 to 4.50 kg/m2/yr from bare soil. These findings show that the erosion
rates in the UK are relatively low compared with other countries in the world. As an
example, the erosion rates from cultivated land and bare soil in Belgium ranged from
0.30 to 3.00 and 0.70 to 8.20 kg/m2/yr respectively, it ranged from 0.50 to 17.00 and
0.40 to 9.00 kg/m2/yr in the USA, and in China, it ranged from 15.00 to 20.00 and 28.00
to 36.00 kg/m2/yr (Morgan, 1985). All of these findings support Morgan’s (1985)
conclusions that very low annual soil erosion rates were caused by water erosion.
Relatively, the soil erosion rates is also low compared with the soil erosion rates in
Asia, Africa, and South America, averaging 30 to 40 t/ha/yr (Pimentel et al., 1995).

6
Generally, most soil erosion events have been reported in areas of arable cultivation
during the autumn and winter periods, associated with greater rainfall. This is also
associated with late sowing in autumn with harvesting in winter, which leaves bare soil
surfaces without very little or no ground cover. The impact of soil erosion, especially on
agricultural land has major implications for physical landscapes and society at large. It
also has both on-farm and off-farm impacts.
The main on-farm effect of soil erosion from agricultural land can be related to the loss
of production associated with the loss of topsoil which is rich in organic matter. Off-
farm effects include loss of biodiversity, damage to roads and footpaths, contamination
of drinking water, and nutrient over-enrichment of freshwater bodies. For example, soil
erosion on the South Downs of Southern England has occurred regularly since the early
1980s, especially during the wetter autumn and winter periods, providing average
annual rates of erosion of 0.5 to 5.0 m3/ha/yr for the decade 1982-1991 (Boardman et
al., 2003). Although the overall rates seem low, the rates for individual fields can be
very high, reaching over 200 m3/ha/yr, and the costs of damage resulting from muddy
floods has proved to be very high. For example, damage in Mile Oak and Hangleton,
Brighton in 1987 caused by muddy floods totalled more than £259,000 (Robinson and
Blackman, 1990), while the total damage cost in Rottingdean was in excess of £400,000
(Boardrman, 1995). In the bigger picture, the total annual external environmental and
health cost of the UK agriculture was estimated at £2.343 billion in 1996, comprised of
air pollution (£1,113 m), human health costs (£776 m), water pollution (£231 m),
damage to biodiversity and landscape (£126 m), and soil damage (£96 m). In specific to
water pollution regarding to drinking water, the highest damage comes from pesticides

7
(£120 m), phosphate and soil (£55 m), zoonoses (£23 m), nitrate (£16 m), monitoring
and advice on pesticides and nutrients (£11 m), and eutrophication and pollution
incidents such as fertilizers and animal wastes (£6 m) (Pretty et al., 2000).
In order to combat both on-farm and off-farm soil erosion effects, including diffuse
agricultural pollution, the Ministry of Agriculture Fisheries and Food, and the
Environment Agency are working closely together with farmers’ organizations to
reduce soil erosion and water erosion effects. Some of the initiatives to tackle this issue
are The Code of Good Agricultural Practice for the Protection of Soil, and the Provision
of Advisory Services. More spesific, DEFRA (Department for Environment, Food and
Rural Affairs) also introduced a Catchment-Sensitive Farming Programme to tackle
DWPA (Diffuse Water Pollution from Agriculture). More details on these policies as
they are associated with maize cultivation will be discussed in Chapter 9.
1.3 Maize Cultivation and Environmental Problems in England
Besides potatoes and winter wheat, one of the major crops that causes serious
environmental problems associated with both the on-farm and off-farm impact of soil
erosion is maize cultivation. Growing maize has become more common in England
since the early 1970s to produce feed for cattle, and particularly to support dairy
farming, where maize is mainly used for silage. Forage maize has become a major
alternative to grass silage for ruminant livestock in England because of its better end-
product quality, which is related to improved forage intake, and improved animal
productivity, and it can also reduce production costs ( Fitzgerald et al., 1998; Anil et al.,
2000).

8
According to the DEFRA database, land cultivated with maize in England in the 1970s
occupied an area of less than 10,000 ha. However, this increased to 108,400 ha in 2003.
A more detailed discussion of the growth of maize cultivation in England will be
presented in Chapter 4.
As discussed above, in Sections 1.1 and 1.2, it is already well known that soil erosion
associated with agricultural activity, especially crop farming, has a serious
environmental impact, and this is particularly the case for maize cultivation in England.
Maize is usually drilled during spring (April/May) and harvested in the autumn (mid-
September/mid-October), but in some cases it is also harvested in late autumn, due to
restrictions on the availability of contractors for harvesting. Once the maize has been
harvested, fields are left bare and this exposes the fields to autumn and winter rainfall.
Both factors (bare soil and heavy rainfall) increase the likelihood of water erosion by
creating rills and/or gullies on slope surfaces, and promoting surface runoff, which
flows downhill into water courses. Maize harvesting also frequently takes place under
wet conditions with heavy harvest machinery, leading to compaction of the soil and
damage to soil structure, and this increses runoff still further. Most maize growers
harvest their crops by moving the harvesting equipment up and down the slope, rather
than across it. This also increases the runoff in accordance with the steepness of the
slope.
Maize is often grown continuously on the same field, and the fields are frequently left
fallow over winter prior to cultivation and pre-drilling the following spring. It is
common for farmers to take the opportunity to spread slurry onto bare harvested maize
fields over the winter period as an organic fertilizer to support the crop during the next

9
season. However, this is likely to reduce the infiltration rates, espescially if the slurry
dries up, thereby increasing runoff, and transporting slurry and sediment to
watercourses during periods of heavy rainfall.
Clements and Lavender (2004) have reported a plot study involving measurement of
surface water runoff from fine sandy loam soils with a slope steepness 3.7o in maize
stubble fields in the Parrett Catchment area of Somerset during the winter period of
2003/04. The results, based on ten rainfall events from 10 November 2003 to 29 March
2004, show that the mean surface runoff from late harvest plots can be as high at 762
m3/h, and from bare stubble plots at 283 m3/h. However, more suspended solids were
measured from bare stubble plots with mean as high at 1975 mg/l, and at 1842 mg/l
from late harvest plots. In the case of phosphorus, it was reported that more phosphorus
was measured from late harvest plots with mean as high at 7202 µg/l, and at 5052 µg/l
from bare stubble plots. The results also show that more nitrate nitrogen was measured
from bare stubble plots compared with late harvest plots, at 1.87 mg/l and only 0.76
mg/l, respectively. The results of surface runoff show the seriousness of on-farm effects
of soil erosion from bare maize plots and late harvest plots, associated with the
mobilization of top soil and low infiltration rates, which increase the runoff on the slope
with a probable resulting increase in soil erosion rates. In addition, off-farm effects from
high surface runoff from both treatment plots can be seen from the mean value of
suspended solids and phosphorus and nitrate contents.
An investigation of soil erosion in a 6.7 ha bare maize field at Higher Walton Farm near
Crediton, undertaken by Blake (2000) using 7Be measurements indicate that the mean
erosion rates for the field was 5.3 kg/m2 with a net soil loss of 2.5 kg/m2 and the

10
sediment delivery ratio (SDR) is calculated as 0.80. The erosion rates and the net soil
loss must be seen as quite high for the local area and the SDR value indicates that a
significant proportion of the mobilized soil was delivered beyond the field towards the
local stream (Blake, 2000). By comparing the short-term results with medium-term
tracer of 137Cs, Blake (2000) reported that the mean erosion rate, a net soil loss and the
SDR value derived from 7Be are significantly higher (1.1 kg/m2/yr, 0.48 kg/m2/yr, 0.83
respectively, for 137Cs). The 7Be measurements results can be explained by the intensive
nature of rainfall during the soil sampling programme in the January 1998, which can be
considered to be quite rare. In the case of 137Cs measurements results, it can be related
to the high yield of such rarer rainfall that would be lost in the averaging effect over the
30-40 years period (Blake, 2000). Serious off-farm effects from the field resulted from
the SDR for both tracers indicate that a significant proportion of the soil was transported
out of the field as eroded sediment to nearby water courses.
The references discussed above indicate that harvested maize fields in autumn tend to
be exposed to soil erosion during winter periods under heavy rainfall when they are
characterized by compacted bare soil. The effects of on-farm erosion and the resulting
off-farm pollution clearly demonstrate the seriousness of soil loss and damage to water
courses because sediments and nutrients degrade water quality and thus aquatic
ecosystems.
1.4 Research Needs
The above discussion has demonstrate the potential seriousness of both the off-farm and
on-farm impact of soil erosion associated with maize cultivation. Apart from those
discussed above, there have been very few studies in investigating soil erosion rates

11
from bare maize fields in England. Previously, most studies of soil erosion from
cropland in England have concentrated on cereals, sugar beet, potatoes, and vegetable
crops.
Considering the serious environmental problems that can occur as a result of maize
cultivation, and especially the considerable expansion of the area under maize in
England in recent years, it is important that there should be more studies of the soil
erosion that is likely to occur as a result. Further studies are required of both gross and
net rate of soil loss as well as the magnitude of soil losses from individual fields and the
role of the sediment mobilized from bare maize fields in polluting river systems.
Documentation of soil erosion associated with maize cultivation including both on-farm
and off-farm impacts at both field and catchment scales will serve to improve
management policy and to encourage more environmentally friendly attitudes among
farmers and harvest contractors with regard to the management of soil, farming systems,
harvesting practises, and bare soil conservation on maize fields. Currently, it would be
fair to say that management policy regarding the control of soil erosion from
agricultural land, including maize cultivation for silage, is still facing problems in
reducing soil erosion impact. Guidelines for improved agricultural land management,
such as ‘The Code of Good Agricultural Practice for the Protection of Soil’, and ‘The
Catchment Sensitive Farming Programme’, may help in solving any practical problems
in tackling the impact of soil erosion from maize cultivation areas. However, many
farmers leave maize fields bare after harvesting, without any effective protection from
rainfall, and the very turbid rivers that are often observed during the winter period, are
possibly linked to sediment mobilization from bare soil in the maize fields that have
12
experienced soil erosion. Overall there is a need for a better review and understanding
of current management policy regarding soil erosion control and soil conservation, and
also of pollution prevention, and management practises associated with maize
cultivation that can reduce on-farm and off-farm impact, especially with regard to water
courses.
1.5 Research Aims
The overall aim of the research reported in this thesis is to investigate the problem of
soil erosion by water associated with maize cultivation. To achieve the research aim,
this research has been divided into three parts. The first considers the distribution of
maize growing in England and its recent expansion. The second develops an
understanding of the on-farm and off-farm impacts of maize cultivation, and the third
considers the implications of the results of the research for improving management
practices to reduce the impact of soil erosion from maize fields. The work should help
to provide better documentation of on-farm and off-farm impacts of soil erosion, and
could be used to review some of the farming management systems applied by policy
makers, farmers and harvest contractors.
1.6 Thesis Structure
The thesis is divided into 10 chapters. Chapter 1 establishes the background to soil
erosion associated with maize cultivation in England and outlines the aims of the
research undertaken. Chapter 2 explains the objectives of the research, and a description
of the research strategy. This includes a discussion of how the study area was selected
at national, regional, local and site scales. Chapter 3 describes the methodology used in
this research to investigate on-farm and off-farm impacts associated with maize

13
cultvation. The description is divided into two sections: the first concerns techniques for
soil sampling and water-sediment monitoring, including sample preparation; the second
concerns laboratory analysis involving 7Be and 137Cs measurements, and also analysis
of the chemical properties of soils and sediment.
Chapter 4 presents a review of maize cultivation in England and its expansion from
national to regional perspectives. Chapter 5 builds on Chapter 4 and provides a
discussion of maize cultivation at the local and site scales. Chapter 6 describes the soil
erosion investigation undertaken at selected study sites, and this in turn is divided into
two sections. The first section is a discussion of the information on soil erosion rates
and patterns provided by 7Be measurements which provide a short-term perspective, and
the second presents equivalent information obtained from 137Cs measurements which
provide a longer-term perspective. Chapter 7 reports the results of an investigation on
suspended sediment transported by the Rivers Culm and Tone and this includes
information on the analysis of several chemical properties of the sediment such as heavy
metal, organic carbon, and total phosphorus content. Chapter 8 discusses the
environmental impact of maize cultivation in England based on a review of the national
distribution of maize growing areas and the river networks of England, and presents an
assessment of the possibility of off-farm impact from maize cultivation areas on river
catchments, based on the project results. Chapter 9 reviews current farming
management systems and a discussion of potential improvements to the system of
combating soil erosion impacts associated with maize cultivation. The final chapter,
Chapter 10, summarizes the thesis and the results presented and provides
recommendations for future research.

14
CHAPTER 2: RESEARCH STRATEGY
2.1 Overview
This chapter describes the research strategy designed to achieve research aims outlined
in Chapter 1. Specific objectives based on the research needs are outlined in Section 2.2.
The chapter will also describe the process of choosing the study area in this project to
fulfill the research aims and individual objectives which are based on four perspectives,
at national, regional, local and site scales.
2.2 Research Objectives
As indicated in the previous chapter, the aims of the project are divided into two
aspects. The first is to provide an understanding of the off-farm impacts of maize
cultivation on a local or catchment scale, and the second is to consider the implication
of the results of the project for improving management practices in order to reduce the
impact of soil erosion associated with maize cultivation. Based on both aims, the
objectives of this project are listed below;
1. To review the background to maize cultivation in England.
2. To analyse the spatial and temporal patterns of maize cultivation.
3. To investigate rates and patterns of soil erosion from maize fields.
4. To investigate sediment transfer from maize fields to rivers.
5. To evaluate the environmental impact of maize cultivation in England.
6. To consider the potential of improved management practises in reducing the
environmental impact of maize cultivation.

15
In addition, the first and second objectives are to discuss the causes of the expansion of
maize cultivation area in the country, and to report and describe spatial and temporal
patterns of maize cultivation at national, regional and local scales. The results obtained
from these discussions will be dealt with in Chapter 4, for the national and regional
scales; and in Chapter 5 for local scales. In the case of the third objective, the
investigation of rates and patterns of soil erosion will be based on shorter and longer
terms of radionuclide tracer at a site scale. The results will be reported in Chapter 6.
Investigation of sediment transfer from maize fields to rivers will be made at a local or
catchment scale, and the result will be discussed in Chapter 7. The fifth objective of
evaluation of the environmental impact of maize cultivation will be made at local and
national scales, based on the results from Chapter 4, Chapter 5, Chapter 6 and Chapter
7; and the discussion will be made in Chapter 8. Consideration of the potential of
improved management practises in order to reduce the environmental impact of maize
cultivation will be discussed at a national scale, considering several policies associated
with agriculture in general as well as the cultivation of maize.
In accordance with the above description, the next section will focus on a discussion of
the selection of study areas at national, regional, local and site scales. Figure 2.1
summarizes the above description and the further discussion of the strategy that will be
taken in this project.
2.3 Selection of the Study Area
As mentioned above, the process of the selection of the study areas is based on four
scales, national, regional, local and site scales. As is well known, the United Kingdom
consists of four countries or political entities, namely England, Wales, Scotland and

16
Figure 2.1 : Flow chart of the project
PROJECT AIMS Off-farm impacts of
maize cultivation
Review the background to maize cultivation
NATIONAL REGIONAL LOCAL SITE
Improving management practices
PROJECT OBJECTIVES
Investigate rates & patterns of soil erosion
Investigate sediment transfer from maize field
Evaluate the environmental impact of maize cultivation
Improve management practices to reduce the impacts
STRATEGY
• Identify maize cultivation area (regional)
• Report on spatial & temporal patterns of maize cultivation area
• Identify suitable study area at regional scale based on spatial & temporal trends
• Identify maize cultivation area (county)
• Report on spatial & temporal patterns of maize cultivation area
• Identify suitable study area at local scale based on spatial & temporal trend, & rain gauge existence
• Field mapping of maize cultivation field
• Report on spatial & temporal patterns (3 years in row) of maize cultivation area
• Identify suitable study sites (6 sites) based on temporal trends & topography
• Survey & soil sample collection to investigate rates & patterns of soil erosion
• Monitor & sediment sample collection to investigate sediment transfer
Analysis of spatial and temporal patterns of maize cultivation
Northern Ireland. However, considering the time-period of the project and limitations
that could occur during the process of collecting field and secondary data, this project
has tried to minimize any uncertainty and limitations in carrying out the project from the
beginning to try and avoid future problems.
2.3.1 National scale
As indicated in Figure 2.1, achieving the aims and the objectives of the project ought
ideally to be done on a national scale in order to understand the spatial and temporal
patterns of maize cultivation in the United Kingdom. However, under the project time-
period limitation, the author has had to select only one of the countries for this project,
and England has been choosen. The reason for this is because England is the largest
country of the four, at 130,395 km2. In addition, most of the land in England is arable
and cultivated with variety of crops, which thus better suits the project aims and
objectives. A detailed description of cropland in England will be made in Chapter 4.
In order to review the background to maize cultivation in England, data on maize
cultivation for certain years are needed to show the spatial and temporal patterns of
maize growing. Data in map format has been supplied by the Library of Edinburgh
University for the years 1979, 1981, 1985, 1988, 1993, 1995, 1997, 1999 and 2000. The
data are in raster format, and all data are in size of 2 km2 per pixel, except for 1985
which is in 5 km2 per pixel size. The data have been analysed using Geographical
Information Systems (GIS) of ArcMap, version 8.3. In the case of temporal patterns, the
data were collected from the DEFRA website (Department for Environment, Food and
Rural Affairs), for the years of 1970, 1972, 1974, 1980, 1982, 1984, 1990, 2000 and
2002. These data were transferred to Excel for trend analysis.

18
The main analysis process at this scale is to identify maize cultivation area in England
for each region, for the years mentioned above. The results from this analysis were
intended for use in identifying a suitable study area at a regional scale after a study of
spatial and temporal patterns in each region.
The project will also discuss the factors that cause the expansion of maize cultivation
areas in England. In addition, it will also review and discuss management practises with
the aim of making some recommendations so as to reduce the environmental impact of
maize cultivation. This could be done by reviewing present agricultural policies,
especially those dealing directly with maize cultivation. The results will be discussed in
Chapter 9.
2.3.2 Regional scale
One of the most important considerations in selecting a suitable study area at a regional
scale is to choose an area relatively densely cultivated with maize. As a result of studies
of maize cultivation at a national scale, the Southwest region was selected as the most
suitable study area for this project. Starting from this point, a similar analysis of spatial
and temporal patterns of maize cultivation in the Southwest region was also carried out,
based on the similar data from both the Edinburgh Library and from DEFRA.
The study of the spatial and temporal patterns of maize cultivation at this scale will
cover all six counties of the Southwest region, i.e. Cornwall and the Isles of Scilly,
Devon, Dorset, Gloucestershire, Somerset, and Wiltshire. The spatial distribution of
maize cultivation in the Southwest region will be presented in map format while the
temporal patterns will be reported using figures to show the trends of maize cultivation

19
scale within the counties. The report will also be discussed in Chapter 4, together with
the results at a national scale.
2.3.3 Local scale
The studies of spatial and temporal patterns of maize cultivation in the Southwest region
have in turn been used to identify two catchments as a study area at local scale. The
reason for the choice of the two catchments as study areas in this project was based on
the reasons below:
• investigation of any differences of soil erosion rates and patterns from two different
catchment background of soil types;
• investigation of any differences of off-farm impact in the river, associated with
diffuse pollution, from different physical characteristics, such as topography,
geological aspects, soil types, the size of catchment and river network length;
• representation of the country of England associated with the environmental impact
of maize cultivation with regard to catchment size and the location of maize fields to
the river network.
In addition, the existence and availability of rain gauge stations and river flow data such
as turbidity and water discharge has also been considered in selecting suitable
catchments in this project.
Finally, after taking into consideration the reasons mentioned above, two catchments
were selected as study areas in this project: the Culm Catchment, which is in the Exe
River basin and located in Devon, and the Tone Catchment, which is one of the main
Parrett River tributaries and is located in Somerset.

20
At this scale, two main actions were taken. The first was to identify maize fields within
both catchments for the years 2002, 2003 and 2004. This involved field mapping work
to gather information from farmers and land owners using direct interviews and based
on observation during the field work. Farmers and land owners were asked to identify
maize fields that had been cultivated for those three years. More than 300 farms and
farmers were visited and interviewed to fulfill this purpose.
Secondly, it was necessary to identify the existence of rain gauge stations and the
availability of river flow data for the purpose of investigation of off-farm impact from
maize cultivation area. This involved field checking of existing river gauging stations at
down-stream points from both catchments, and the suitability and possibility of the
stations for sediment concentration and river turbidity measurements. In addition, the
availability of secondary data based on daily measurements of river flow and turbidity
from the Environment Agency (EA) were also checked to support field measurement
data. Another requirement that was considered was accessibility to the river gauging
stations for river monitoring. This included the distance of the river gauging station
from Exeter University and permission from the Environment Agency to access and set-
up river monitoring instruments. Taking account all those factors, two river gauging
stations were finally selected for this project, with one for each catchment, to act as
river monitoring points down-stream. The river gauging station selected to represent the
Culm Catchment is known as the Woodmill station, while that for the Tone catchment is
the Bishop Hull station.
The Woodmill station is run by the School of Geography, University of Exeter,
monitoring river flow and river turbidity. This is an advantage for this project because
of the accessibility of the secondary data regarding the history of river flow and river

21
turbidity history. However, in the case of the Bishop Hull station, the station is operated
by the Environment Agency alone, and in order to gain access to the premises to set-up
the monitoring instruments and for field work monitoring during the winter period of
2004/2005, permission had to be given by the management of the EA. The EA have
their own river flow and turbidity instruments at this station, which was a help for this
project because it enabled comparisons to be made for data from different monitoring
instruments.
2.3.4 Site scale
Furthermore, in investigating soil erosion rates and patterns, the project needs a suitable
number of study sites for soil sampling collections to represent the local study area.
Some considerations that have to be taken an account before deciding the number of
study sites in this project are listed below:
1. The size of maize field. This relates to the number of sampling points for each field.
If the size of the field slope is longer from the top to the bottom of the field, the number
of sampling points will be more.
2. The half-life of 7Be that needs to be measured soon after its dry and sieved. This is
associated with limited number of detectors in the School of Geography Laboratory,
which are also being used by other researchers.
3. The distance between each field, which will effect how far it might be to carry out
soil sampling within the same day, or at least on consecutive days after the first day of
sampling. This is important, in the case of 7Be to avoid any uncertainty of soil samples
regarding a second rainfall event.

22
Taking these considerations into account, the author decided to choose six bare maize
fields, three in each catchment, to be study sites. According to this decision, the next
process was to identify six suitable maize fields as study sites. The process of selecting
six suitable maize fields was carried out by referring to field mapping results on a local
scale. This process involved three important aspects. The first was to identify maize
fields grown with maize for three years in a row from 2002 to 2004. The second was the
importance of avoiding undulating or flat fields. Undulating fields would have a
tendency to spread runoff on the surface in too many directions, while flat fields could
be flooded and thus rendered unsuitable as case studies. It is also important to avoid
undulating fields because of the necessity of using a transect approach in soil sampling
programmes. The third was to select a different background of soil type for each field so
as to represent a variety of soil types within the catchments. The geographical and
physical characteristics of the six study sites will be described in Chapter 6.
In addition, soil sampling programmes for both 7Be and 137Cs have been made in the
same fields and at the same as sampling points for the purpose of comparison of soil
erosion rates at shorter and longer terms of life for both radionuclide tracers.
2.4 Summary
This chapter has described the research strategy at various scales in achieving the aims
and objectives of the project. England was chosen as a study area at the national scale,
and the Southwest region was selected to represent the England at a regional scale. For
both scales, the spatial and temporal patterns of maize cultivation is described based on
data supplied by the library of Edinburgh University and DEFRA. Furthermore, two
catchments (the Culm and Tone catchments) were selected for investigation of off-farm

23
impacts of soil erosion, and six maize fields were chosen to represent both catchments
associated with soil erosion rates at shorter and longer terms.
The next chapter will describe the methodology that has been used in this project. It will
cover aspects of field work for field mapping, the soil sampling programme and river
turbidity monitoring approaches that were applied in this project. In addition, the
methodology chapter will also describe the laboratory work associated with
radionuclide measurements and chemical property analyses.

24
CHAPTER 3: METHODOLOGY
3.1 Introduction
This chapter will describe various methods employed in the field and laboratory
components of the study, and more specifically the measurements of fallout
radionuclides and analysis of the chemical properties of soil and suspended sediment
samples. The fallout radionuclide measurements focused on 7Be, 137Cs and 210Pb fallout,
whilst the analysis of chemical characteristics included heavy metals, base cations,
phosphorus, carbon and nitrogen. The detailed procedures employed to determine the
7Be and the 137Cs content of soil and sediment samples will, however, be presented in
Chapter 6. The present chapter also describes some of the techniques employed for data
manipulation and analysis.
3.2 Field Sampling and Sample Preparation
This section will describe the soil sampling techniques that were employed in the field
to obtain samples for 7Be, 137Cs and 210Pb fallout measurements. The collection of water
samples for determination of suspended sediment concentration and recovery of
sediment for analysis will also be included in this section. In addition, the processing
and preparation of soil and suspended sediment samples prior to laboratory analysis will
also be explained in this section.
Soil sampling for 7Be and 137Cs measurements was undertaken at a number of study
sites (fields) in the Culm and Tone catchments. A transect approach was employed, and
this involved two parallel transects in each field. The same sampling points were used
for both 137Cs and 7Be. The main sampling was undertaken in maize fields, but it was

25
also necessary to collect reference samples from adjacent flat areas in pasture fields.
The soil sampling was undertaken after the maize had been harvested.
3.2.1 Soil sampling and sample preparation for 7Be measurement
Bulk soil samples for 7Be measurement were collected from the study sites within the
catchments of the River Tone and Culm in order to determine the 7Be inventory. Soil
cores were collected using a 150mm diameter plastic core tube (Plate 3.1). The tube was
driven into the soil surface to a depth of 30mm and the shallow core was carefully
removed and transferred to a strong plastic bag. The plastic bag containing the soil
sample was tied and labeled to record the sampling point. In order to make a
comparison with the inventories recorded in the study fields, bulk reference cores were
also collected in the same way from pasture sites adjacent to each study field.
All soil samples were fully dried prior to measurement of their 7Be contents. In view of
the need to dry the soil samples rapidly, because of the short half-life of 7Be, all soil
samples were freeze-dried. The soil samples were fully frozen (Plate 3.2) prior to being
placed in the vacuum chamber of the ThermoSavant ModulyoD freezed drier (Plate
3.3). After drying the soil samples were weighed and disaggregated. Disaggregation was
undertaken using a rotary sieve (Plate 3.4), which pulverized and sieved the soil
samples to < 2mm fractions. Grinding times for each sample were 10–15 minutes. Only
the sieve size of < 2mm fractions was used for 7Be measurement. The fine fraction
samples were packed into medium-sized Marinelli beakers (Plate 3.5) and weighed,
prior to assay of their 7Be contents using a high-purity germanium coaxial γ-detector
(HPGe).

26
Plate 3.1: Plastic core tube used in 7Be soil sampling
Plate 3.2: Soil samples in a freezer
Plate 3.3: Soil samples in the freezer drier

27
Plate 3.4: The rotary sieve used for disaggregating and sieving the soil samples
Plate 3.5: The fine fraction of a soil sample contained in a medium-sized Marinelli beaker
3.2.2 Soil sampling and sample preparation for 137
Cs measurement
Bulk soil cores were collected from the study sites to determine the 137Cs inventory. Soil
cores were collected using a 70mm internal diameter metal corer (Plate 3.6). The corer
was driven into the soil using a motorized percussion hammer (Plate 3.6) to various

28
depths, depending on the location of the sampling points along the slope, and the soil
depth and composition. If a sampling point was stony, the depth of soil core could be
only 30–45cm. Most of the stony sampling points were found at the top of the slopes. In
contrast, many sampling points in the middle of the slopes were 45–55cm deep, whilst
for some of the sampling points at the bottom of the slope, the soil cores could be >
55cm long. The soil cores were carefully removed and transferred to strong plastic bags,
tied and labelled to record the point. Bulk reference cores were taken in the same way
from an adjacent flat pasture site for each study field.
Plate 3.6: Metal corer and motorized percussion hammer used in 137Cs soil sampling
All soil samples were oven dried at 50oC, and after being fully dried, the samples were
ready for weighing. Dried soil samples were disaggregated using a similar approach to
that used for preparing samples for 7Be analysis, as described in section 3.2.1. However,
the sieving times for the 137Cs soil samples were longer, taking up to 20–30 minutes,
because the soil samples collected for a 137Cs analysis were considerately larger than
those collected for 7Be analysis. The fine fraction at < 2mm of the soil samples was
packed into a medium-sized Marinelli beaker, and after being weighed, the samples
were ready for 137Cs assay using the same detector as used for 7Be measurements.
Metal corer
Motorized percussion hammer

29
3.2.3 Soil sampling and sample preparation for 210
Pb and chemical analysis
In order to analyse the excess 210Pb activity and the chemical properties of surface soil
from maize fields, additional soil sampling was undertaken in 24 maize fields within the
Culm and Tone catchments. Those 24 maize fields included 12 maize fields in the Culm
Catchment and another 12 maize fields in the Tone Catchment. The maize fields were
chosen randomly within these catchments, but it was a requirement that the field had to
be free from any farming activity during the soil sampling time.
The soil samples were collected using a small scoop from the soil surface adjacent to
the slope rills which provided evidence that the slope surface had been eroded during
preceding heavy rain. The sampling points were located randomly in each field. The
mass of the soil samples collected from each of the fields typically amounted to 500–
600g. All soil samples were transported and stored in strong plastic bags, tied and
clearly labeled.
The soil samples were oven dried at 50oC before being weighed. Subsequently, the
samples were disaggregated gently using a pestle and mortar (Plate 3.7), and dry sieved
to recover the 20µm fraction using a 20µm sieve. The sieved soil samples were packed
into strong plastic bags, in readiness for 210Pb activity measurement and chemical
analysis.
Plate 3.7: Soil samples for chemical analysis were disaggregated using a pestle and mortar

30
3.2.4 River water sampling and sample preparation for suspended sediment
analysis
River water sampling for recovery of suspended sediment and measurement of
suspended sediment concentrations was undertaken at two hydrological monitoring
stations, located at the outlet of the Culm and Tone catchments. The Woodmill station,
located closed to Cullompton, was at the outlet of the Culm Catchment outlet, while the
Bishop’s Hull station, located closed to Taunton, was located at the Tone Catchment
outlet.
River water sampling was undertaken during peak river flows after heavy rain had
occurred. For the purpose of recovering suspended sediment, sampling involved use of a
submersible pump powered by a portable generator, to pump river water through a
30mm reinforced plastic hose into five 20l polyethylene cans. However, for the purpose
of determining suspended sediment concentrations, the river water sample was collected
in 500ml bottles using the same apparatus.
The 100l bulk river water samples collected at the both outlets of both catchments were
taken back to the laboratory, and left for four days to allow the suspended sediment in
the water samples to settle to the bottom of the can. After the suspended sediment had
completely settled, the overlying clear water was syphoneed out using a small hose,
leaving the suspended sediment at the bottom of the can along with a small volume of
water. This residual sample of suspended sediment contained in a small volume of water
was transferred to a centrifuge bottle, ready for recovery using a Multifuge 4 KR
Heraeus centrifuge (Plate 3.8). The centrifuging process took about one hour, and after
this process had been completed, the suspended sediment was transferred using distilled

31
water and a spatula into a plastic pot. The sediment contained in these plastic pots was
then freeze dried, and stored in plastic bags, prior to chemical analysis.
Plate 3.8: The Heraeus Multifuge 4 KR Centrifuge
3.3 Laboratory Analysis
This section will cover two areas. The first describing the measurement of 7Be, 137Cs
and 210Pb activity, and the second the techniques used for analyses of the chemical
properties of soil and suspended sediment samples.
3.3.1 Radionuclide measurement
In this study, a high resolution of low-level gamma spectrometer incorporating a high-
purity germanium (HPGe) detector (Plate 3.9) was used to determine gamma-emitted
radioactivity in soil and sediment samples. More specifically, the detector type used in
this study is a hyperpure germanium coaxial γ-detector (EG&G ORTEC HPGe) with
associated lead-shielding and liquid nitrogen cooling, linked to a multi-channel
analyser. A detailed explanation of gamma spectrometry measurements is provided by
Wallbrink et al. (2002).

32
Plate 3.9: A hyperpure germanium coaxial γ-detector
The detector, which contains a germanium crystal, generates free electrons in response
to absorbing energy from ionizing radioactivity, and the magnitude of the charge in the
crystal is directly related to the energy of the incident gamma ray (Wallbrink et al.,
2002). In this case, the sample in the detector releases γ-ray emissions and some of them
will be absorbed. At this stage, the γ-ray emissions lose part or all of their energy by
producing electron pulses. These electron pulses are amplified by the pre-amplifier as
voltage pulses and sent to the multichannel analyser. The pulses are sorted by height
and output from the different channels into the counting system, where the counts are
processed and displayed (Blake, 2000).
The counting system is based on the full energy peak (FEP), where the area under the
FEP is known as the net count rate, which can be used to calculate the radionuclide
activity in the sample. In order to calculate the radionuclide activity in the sample from
the net count rate value, it is important to know the detector efficiency. The efficiency
of the detector is a function of the energy of the γ-rays, the characteristics of the crystal,
the geometry of the sample and the self absorption of γ-rays by the sample itself (Blake,

33
2000). All these must be taken into account when defining the efficiency of a detector
using standards.
3.3.1.1 Measurement of 7Be and
137Cs activity in soil samples
As indicated above, soil samples for 7Be and 137Cs, analysis were packed into medium-
sized Marinelli beakers. The Marinelli beaker surrounds the detector head to provide
more efficient detection.
In order to convert the net full energy peak (FEP) into a measurement of radionuclide
activity, the efficiency of the detector must be known. This is defined as the ratio of the
net FEP count rate of γ-ray recorded by the detector to the emission rate of γ-ray from
the sample. The activity in the sample can be calculated as:
where nx is the net FEP count rate of γ-ray recorded by the detector, and ηx is the
efficiency for a γ-ray emitted from radionuclide x in a sample.
The detector efficiency calibration can be defined as:
where ƒ is the activity efficiency of the detector, which is defined as the efficiency τ
(emission rate) multiplied by the r (emission probability of the gamma ray), M0 is the
standard mass in kg, C0 is the total counts, Cb is the background counts of an unspiked
sample, T0 is the count time, Tb is the corresponding background count time, and λ is the
decay constant of the radionuclide, which can be defined as:
where T0.5 is the half-life of the radionuclide.
ƒ (M0) = (C0 / T0 – Cb / Tb) x (1 / M0 x (A0e
-λ(t-t0)) (3.2)
λ = 1n2 / T0.5 (3.3)
Ax = (nx / ηx) (3.1)

34
In analysis for 7Be and 137Cs, soil samples were counted on the detector for at least 6
hours. Walling and Quine (1993) have suggested that counting times to detect the
fallout activity are commonly in the range 29000 to 55000s. However, considering the
large number of soil samples (more than 300 samples), the limitations of detector
availability, and the time limitation for analysis of 7Be soil samples linked to the short
half-life of this radionuclide, count-times were kept as short as possible, whilst still
providing reliable results.
In this study, the areal activity (Bq m-2) of 7Be and 137Cs is used to characterize the
fallout activity in the soil sample. The areal activity (Aa) for bulk cores can be calculated
as:
where A is the activity of the sub-sample of the bulk core analysed (Bq kg-1), MT is the
total mass of the bulk core (kg), and S is the corer area. The activity of 7Be in the
samples was obtained from the counts at the 475 keV, and 660 keV for 137Cs.
Since radionuclides are subject to continuous decay, it is important to relate all
measurements to a standard point in time. It is therefore necessary to correct the derived
activity to the date on which the sample was collected (ic A(0)), and this can be
calculated as;
where A(t) is the activity of a radionuclide in a radioactive source at the time of
measurement, and λt is the decay constant of the radionuclide, which was defined in
Equation 3.2. The T0.5 for 7Be is 53.3 days, and 11,059.5 days or 30.3 years for 137Cs.
Aa = AMT / S (3.4)
A(t) = A(0)e-λt (3.5)
35
The results from the 7Be and 137Cs fallout activity measurement, which are expressed in
Bq m-2 will be used in this study to estimate soil erosion rates for each study site.
Detailed explanation of the use of 137Cs and 7Be to estimate soil erosion will be
provided in Chapter 6.
3.3.1.2 Measurement of excess 210
Pb in soil and suspended sediment samples
The < 20µm fraction of the soil and suspended sediment samples for excess 210Pb was
packed into a plastic pot. The pot was sealed and left for 21 days before measurement to
allow 226Ra to come to equilibrium with 214Pb.
The detector efficiency calibration for excess 210Pb measurement, based on the mass in
the pot and pot height, can be calculated as:
where η(h) is the γ-ray count rate recorded by the detector, and A0(h) and ד are the
known activity of the pot with mass and height and the abundance of γ-ray, respectively.
The pot inner diameter is 7cm and the height is 8cm.
The plastic pot containing the sample was placed on top of the detector head and
counted for over 50,000s. This provided a precision of ca. ± 10% at the 90% level of
confidence for the γ-ray spectrometry measurements. The activity of 137Cs in the
samples was obtained from the counts at the 660 keV peak. The total activity of the
sample was measured at 46.5 keV for 210Pb, and 350 keV for 226Ra. The excess of
unsupported 210Pb concentrations of the sample was calculated by subtracting the 226Ra-
supported 210Pb concentrations from the total 210Pb concentrations. The 226Ra is
measured via the short-lived daughter 214Pb.
η (h) = [n(h) / A0(h)(3.6) ד
36
The activity calculation for 210Pb can be represented as:
where APb-210ex is the unsupported
210Pb activity (mBq g-1), APb-210 is the total 210Pb
activity (mBq g-1), and APb-214 is the 214Pb activity (mBq g-1).
However, since 214Pb is a daughter of 222Rn, which is an inert gas, the use of 214Pb
activity to estimate the 226Ra-suppprted 210Pb activity can result in over-estimation of its
value due to escape of a proportion of the 222Rn from the soil sample. This effect can be
corrected using a proportion factor α:
and α can be calculated as:
where APb-210.deep is the total
210Pb activity for a sample from below the penetration depth
of fallout 210Pb (mBq g-1), and APb-214.deep is the 214Pb activity for a sample from below
the penetration depth of atmospheric 210Pb (mBq g-1). In this case, the value of α is
normally in the range 0.80–1.0.
3.3.2 Total organic carbon (C) and nitrogen (N) analysis
The concentration of carbon and nitrogen in the soil and suspended sediment samples
were determined by pyrolysis using a CE Instruments NA 2500 elemental analyzer
(Plate 3.10). The samples were packed into small tin capsules, and were sealed by
pressing the tin capsules with samples into pellets.
APb-210ex = APb-210 – APb-214 (3.7)
APb-210ex = APb-210 – αAPb-214 (3.8)
α = (APb-210.deep) / (APb-214.deep) (3.9)

37
Plate 3.10: The CE Instruments NA 2500 elemental analyzer used for C and N analyses
Blake (2000) explained the process occurring within the tin capsule samples and the
elemental analyzer reaction in detail. The elemental analyzer is set up at 1000oC, which
allows the sample and tin capsule to melt. At this stage, the exothermic reaction with the
capsule produces a dynamic flash combustion at 1800oC, and the resulting gas is then
transported by a constant flow of helium and oxygen through chromium oxide oxidation
catalysts where oxidation is completed (Blake, 2000). The combustion products are then
transported in another reactor at 780oC and converted into elemental carbon and
nitrogen. The measurement of carbon and nitrogen is made when the sample is eluted
through a gas chromatographic column where it passes across a thermal conductivity
detector (Blake, 2000).
Quantifying the carbon and nitrogen content of the soil and suspended sediment samples
is carried out by determining the carbon and nitrogen calibration curves. This can be
done using an ethylene diamine-tetra acid (ETDA) as a standard. This standard sample
is also processed in the same way as the soil and suspended sediment samples. The
results from the measurements will be reported in Chapter 7.

38
3.3.3 Heavy metal analysis
The heavy metal content of soil and suspended sediment samples were determined using
Atomic Absorption Spectrophotometry (AAS) (Plate 3.11). The technique used in this
study was documented by Allen (1989), and involves the extraction of the heavy metals
from the direct digestion using nitric and hydrochloric acid. According to Alloway and
Ayres (1997), the term heavy metal is applied to the group of metals and metalloids with
an atomic density greater than 6 g/cm3.
In this study, heavy metal elements associated with agricultural sources were selected
for analysis. This involved three sources of heavy metals which are heavy metals from
impurities in fertilizers, from pesticides, and from composts and manures. The heavy
metal elements associated with these three sources are As, Cd, Cn, Cr, Cu, Hg, Mn, Mo,
Ni, Pb, U, V, and Zn.
Plate 3.11: The Atomic Absorption Spectrophotometer used for heavy metal analysis

39
3.3.4 Base cations analysis
A method proposed by Qui and Zhu (1993) was used to extract base cations from soil
and sediment samples for subsequent analysis by AAS. The base cations used in this
study were Ca and Na, and ammonium acetate was used as a reagent to extract the base
cations.
3.3.5 Total phosphorus analysis
The total phosphorus was extracted from soil and suspended sediment samples using the
method proposed by Olsen and Dean (1965). The digestion process uses perchloric acid,
sulphuric acid, ascorbic acid, ammonium molybdate and potassium antimony tartrate as
reagents.
3.4 Data Manipulation and Analysis
One of the primary study objectives is to review the spatial and temporal background of
maize cultivation at national, regional and local scales. This requires the manipulation
and analysis of data from many different sources. In this study, data were supplied by
the Department for Environment, Food and Rural Affairs (DEFRA), the Edinburgh
Library (EL), and the Centre for Ecology and Hydrology (CEH). To complement these
secondary data, field mapping and data verification have also been undertaken. Each
data source has a different background and this section will focus on an explanation of
the data sources.
To process and support these primary and secondary data, the system known as GIS
(Geographical Information Systems) was used as a tool. The GIS software of ArcGIS
v8.3, which consists of ArcCatalog and ArcMap, were used in data manipulation and
analysis.

40
3.4.1 DEFRA data
In this study, the data used from DEFRA sources relates to the annual census conducted
by DEFRA, and the results are released every year in June through the Agricultural and
Horticultural Census. The released result is based on census form returns each year by
registered farmers. Each farmer is obliged to give information about the size of each
field occupied by every type of agricultural activity. The accuracy of such information
is of course highly dependent on the reliability and availability of the farmers’
information returns. DEFRA also produces an agricultural map for Agricultural Land
Classification (ALC) at a 1:250,000 scale. However, such a scale is not really suitable
for the purpose of this research, as more detailed information is needed. The census data
available to use in this research are from the following years: 1950, 1954, 1955, 1960 to
1965, 1970 to 1975, 1980 to 1985, 1990, 1995 and 2000 to 2003.
3.4.2 Edinburgh Library data
The Edinburgh Library has data in digital map format for various years and in different
resolutions. The information in the digital maps is derived from agricultural census data
summarized by MAFF (Ministry of Agriculture, Fisheries and Food) and SOAEFD
(The Scottish Office Agriculture, Environment and Fisheries Department) and is related
to groups of farm holdings. The process of data transformation is based on parish data in
a square grid of 1km2. The Parish Framework is used in conjunction with a 7-fold
classification of land use with the same 1 km2 grid as in the Land Use Framework. The
digital maps used in this research represent the following years: 1979, 1981, 1985,
1988, 1993, 1995, 1997, 1999 and 2000. These maps are based on a 2 km2 grids, except
for that of 1985, which is based on a 5 km2 grid.

41
3.4.3 CEH data
The CEH dataset used in this study is the Land Cover Map (LCM) of 2000. The
LCM2000 is a thematic classification map based on spectral data recorded by satellite
images. The dataset is based on a raster format derived from a vector database and
stored as pixels in a 1km grid. It can be divided into two major classes, namely Target
Classes as the top hierarchy, and Subclasses. The Target Classes or Level 1 was
considered the nearest match which could be achieved consistently and with a high level
of accuracy. It was divided into 16 groups, such as arable and horticultural, suburban
and urban, and littoral rock and sediment.
The Subclasses are divided at two levels, known as Level 2 and Level 3. Level 2 is the
standard level of detail which provides 26 subclasses such as arable cereals, arable
horticulture and non-rotational horticulture. Level 3 known as Variants, provides details
down to 72 categories. In this research, the Variants level was used to identify the area
of maize.
Since it was based on interpretation of satellite imagery, an attempt was made to
validate the CEH data. Eighteen fields in the Culm Catchment and 24 fields in the Tone
Catchment shown as being used for maize in the CEH database were selected and their
land use in 2000 was checked by interviewing the relevant farm owner. The result
showed that 22 of the 24 maize fields in the Tone Catchment were used for maize in
2000. However, the other two fields identified by CEH data as a maize field in 2000
were not used for maize, both fields being covered with rough grassland mixed with
coppice and scrub. The validation process in the Culm Catchment shows that 100
percent of the selected maize fields were used for growing maize in 2000. For both
areas combined, the validation applied showed that 95.2 percent of maize fields

42
identified by CEH were used for growing maize in 2000. This result confirms the
reliability of the CEH data, which has therefore been used in this study.
3.4.4 Field mapping data
The secondary data supplied by DEFRA, EL and CEH do not provide spatial
information after 2000. From a local perspective, it was very important to show the
current spatial distribution of the maize-growing area within the Culm and the Tone
catchments for soil sampling purposes. In order to support the secondary data, field
mapping was undertaken to identify all maize fields within the study catchments for the
years 2002, 2003 and 2004. The field mapping carried out was based on interviews with
farm owners within the catchments. Each farm owner was asked to identify their maize
fields in those years, and topography maps were used as basic maps.
3.5 Summary
This chapter has explained various methods employed in this study to achieve the study
objectives. The methods have involved both fieldwork, which involved soil and
suspended sediment sampling, and also laboratory work which included sample
processing and preparation and analysis of the radionuclide and chemical contents of
soil and suspended sediment samples. In addition, data manipulation and analysis, based
on field-mapping work and secondary data from DEFRA and CEH have also been
described. The results of the sampling and analysis programmes will be presented and
discussed in Chapters 6 and 7. Results from the data manipulation and analysis
employed GIS will be presented and reported in Chapters 4 and 5.

43
CHAPTER 4: MAIZE CULTIVATION IN ENGLAND AND THE SOUTHWEST
REGION
4.1 Introduction
Most of the land in England is under agriculture. In 1950, about 10.33 million ha of
England were under arable land, grassland and rough grazing, but the area decreased to
8.15 million ha by 2003. This represented 44.3% of the agricultural land in the United
Kingdom in 2003. Arable land occupied about 50.4% of the agricultural land in England
in 1950, with permanent grassland accounting for 35.4%, and rough grazing land for
4.2%. However, by 2003, the proportion associated with arable land had decreased to
47.1%, with grassland accounting for 44.9%, and rough grazing for 8.0%.
Crops still constitute the largest area of agricultural land in England, and in 2003, the
area of arable land extended to 3.81 million ha. Most cropland is used for the growing
of cereals (66.7%) such as wheat, barley and oats. Other crops (those not used for
feeding of stock) accounted for 18.8% of cropland, and included crops such as sugar
beat, potatoes and rape. Fodder or compounding crops and horticultural crops occupied
a smaller area and together accounting for 14.5% of the cropland in England.
One crop that has expanded rapidly in England in recent years is maize. In 1990, the
area under maize cultivation was 33,265 ha, but by 2004, the area under maize had
increased to 107,494 ha. In England, maize is grown as a fodder crop. A detailed review
of the increase and spatial distribution of maize cultivation in both England and the
Southwest Region will be presented in section 4.4.

44
4.2 Maize Cultivation: An Overview
Maize (Zea mays L.) is the world’s third most important crops after rice and wheat.
According to FAO data, the world total maize production in 2005 was 692 million
metric tonnes, and the three top maize producers are the United States (280 million
metric tonnes), China (131 million metric tonnes) and Brazil (35 million metric tonnes).
However, this information relates to the production of grain maize, and information on
maize cultivation for animal feeding is not available from the FAO database. According
to the data produced by Maisadour Semences, the area of maize cultivation for silage
production totalled 3,857,000 ha in 1999, and this accounted for 61.3% of the
cultivation of silage maize in Europe. Table 4.1 provides a ranked list of countries in
Europe with respect to the area devoted to silage maize in 1999, with the equivalent
figures for grain maize cultivation given for comparison. From Table 4.1, it is clear that
growing maize for animal feeding or silage maize is more important in northern
countries, whilst cultivation of maize for grain is of greater importance in the countries
of southern Europe.
The most important countries for silage maize cultivation in Europe in 1999 were
France, Romania and Germany, with these three countries accounts for 64.3% of the
silage maize production in Europe. The United Kingdom, occupies position 11, and
accounted for 2.7% of the area of silage maize cultivation in Europe in 1999. However,
in terms of the proportion of arable land occupied by silage maize, Romania tops the
ranking, with silage maize occupy 2.136% of its arable land in 1999, and Ireland is at
the bottom of the ranking with silage maize occupy only 0.012% of its arable land.
Silage maize cultivation in the United Kingdom accounts for 0.099% of its arable land,
and placing it at rank 17 within the countries of Europe. In the case of the United
Kingdom, more than 90.0 % of the area under maize cultivation is found in England.

45
Table 4.1: A ranked list silage maize and grain maize production within European countries in 1999
Rank Country Silage maize
(ha x 103) Silage maize area as a proportion of the total
arable land1
Grain maize (ha x 103)
1 France 1,550 0.810 (7) 1.650 2 Romania 1,300 2.136 (1) 2,000 3 Germany 1,200 1.138 (6) 300 4 Bosnia-
Herzegovina 520 1.994 (2) -
5 Czech Rep. 240 1.206 (5) 40 6 Italy 235 0.211 (11) 920 7 Netherlands 233 1.510 (4) 9 8 Belgium 185 1.675 (3) 20 9 Poland 120 0.158 (14) 120 10 Slovakia 120 0.719 (8) 110 11 United Kingdom 103 0.099 (17) - 12 Hungary 100 0.537 (10) 950 13 Austria 95 0.191 (12) 140 14 Portugal 55 0.103 (15) 96 15 Croatia 40 0.183 (13) 40 16 Denmark 45 0.558 (9) - 17 Turkey 40 0.015 (20) 460 18 Switzerland 40 0.100 (16) 25 19 Bulgaria 30 0.081 (18) 370 20 Spain 30 0.016 (19) 330 21 Greece 10 0.015 (21) 115 22 Ireland 5 0.012 (22) -
Source: Maisadour semences 1CIA
In general, there has been a significant increase in the area under silage maize
cultivation in Europe since the mid-1980s, in response to changes in both agricultural
policy and agricultural technology. Most European countries suffered from WWII, and
each country introduced a comprehensive package of agricultural reforms to encourage
increased production of food, crops and livestock. More land was put under the plough,
and the governments in individual countries continued to support farming activity by
subsidising arable cultivation via both area and yield. These subsidies encouraged
farmers to plough more land for crop cultivation and to devote more land to cattle. More
grass was also cultivated in order to support dairy farming. However, with technological
46
changes in farming, especially in animal feeding, silage maize cultivation became
increasing popular in European countries to support dairy farming. This occurred in
parallel with a change in animal feeding rations from hay or grass silage (considered
less valuable fodder in terms of nutrition), to maize silage, which is rich in nutrients. In
addition, and especially in the 1990s, the Common Agricultural Policy (CAP) provided
a major impetus to the growing of silage maize through subsidies and other additional
benefits associated with dairy farming.
In the case of the United Kingdom, and also England, agricultural policy still plays an
important role in defining farming activities. The CAP offers market price support and
aid or income support in many ways to support farming activities. In this situation,
farmers are highly dependent on income support. This support offers farmers direct
income for their arable crops in the form of area payments under the Arable Area
Payments Scheme (AAPS). Brassley (2000) stated that, by the mid-1990s, maize
qualified for AAPS of up to £320 per hectare. However, in 2001, payment rates
declined to £225.64 per hectare but increased to £238.94 per hectare in 2002 and 2003.
In 2005, all arable land in England was put under a new scheme called the Single
Payment Scheme (SPS), following the CAP reform in 2003. Instead of subsidising
arable land based on production as in AAPS, the SPS makes payments based on the
‘environmentally friendly’ concept. Broadly, the SPS divided land into three classes;
moorland with uplands, regarded as Severely Disadvantage Areas (SDA), land in the
upland SDA but outside the moorland line, and all land outside the upland SDA. The
calculation of the arable area payment rates in these three zones is based on three
factors, namely, the historic area, a flat rate, and a combination of the two.

47
In general, farmers have more freedom to farm to the demands of the market, as
subsidies are being decoupled from production. On top of this, environmental friendly
farming practices under the standard of Good Agricultural and Environmental
Conditions (GAEC) are becoming better acknowledged and rewarded. This will
probably have some influence on farmers in making decisions as to whether to grow
maize in future. When considering whether farming practises qualify as
‘environmentally friendly’, soil erosion occurring during the winter after harvesting will
need to be taken into account.
As indicated above, maize cultivation in the United Kingdom is undertaken to support
dairy farming, and the growing of maize commenced in the 1950s, as forage for cattle.
Before that, hay and silage were two main sources of dairy fodder in the UK. Among
the factors that make silage maize cultivation important and occupy large area of
cropland in the UK, is the importance of dairy farming itself. The major animal fodder
in the UK is grass, beans, peas and maize. Maize silage is used to feed dairy cows
during the winter prior to their returning from the fields during the summer. As reported
later in this chapter, the area of maize cultivation expanded very strongly in the 1990s.
Since the war, the pattern and productivity of the UK dairy farming has changed
substantially, with better feeding systems, improved genetics and more skilful
management of farms (Brigstocke, 2004). Under these conditions, more farmers became
involved in dairy farming in England. According to DEFRA data, the number of dairy
holders in 1990 totalled 28,756 farms in England and involved more than 1.997 million
dairy cows. In 2000 and 2003, the number of dairy holders had decreased to 20,094 and
16,027 farms with the number of cows at 1.575 million and 1.434 million, respectively,
for each of these years. Although the number of dairy holders and the number of cows
had declined, maize still retains its importance as a fodder crop in England. To some
48
extent, new technologies in making silage suggest that a combination of maize silage
with high quality grass silage is a good alternative for winter rations in dairy farming.
This situation will probably remain, with farmers continuing to grow maize in the
future.
In addition, maize silage has also been shown to provide a better diet in dairy farming
and to produce better quality milk. Maize silage at 30-32 percent of dry matter (DM)
has been proved to be high in starch and fibre and ferments more slowly in the rumen.
For example, milk yield is higher for maize silage (30% DM) at 33.0 kg/day compared
with grass silage at only 28.0 kg/day (Advanta).
In general, growing maize for forage needs dry conditions to produce good quality
silage. The weather in the UK offers almost ideal conditions for growing fodder maize,
especially in England and Wales. Maize cultivation in England usually commences in
April, starting with sowing the crop, and ending with harvesting in mid-September or
early October. Maize grows well in areas with an annual rainfall below 760 mm and
with good soil conditions. In areas with an annual rainfall greater than 760 mm, maize
can still be grown (Huntseeds). However, in such cases, farmers are advised to use only
early varieties to avoid the need to harvest in late autumn. With warm temperatures and
sufficient solar radiation in summer in England, and especially in the Southwest region,
maize can be grown in ideal conditions to produce viable yields (ECN).

49
Other factors motivating farmers to change from grass silage to maize are the overall
costs of growing maize, which are relatively cheaper than grass silage. Although maize
seed is relatively expensive (around £40 to £50 per acre or 0.4046 ha), compared to
grass seed (£6 per 0.4046 ha), the overall costs are cheaper for maize. For example, the
establishment and growing costs1 for grass silage is cheaper than for maize at £76 and
£90 per 0.4046 ha, respectively. However, the total fixed costs per 0.4046 ha2 and the
total fixed costs per tonne are relatively cheaper for maize at £6.60 against £7.90 for
grass silage. A more detailed calculation involving yield of fresh matter, yield of dry
matter, dry matter content and metabolizable energy for maize gives a cost of £196 per
0.4046 ha, compared to grass silage, which is more expensive at £202.50 per 0.4046 ha
(Huntseeds).
Although silage maize cultivation is considered as an important crop in Europe and
England, it also produces problems for the environment. This already been discussed in
Chapter 1. In general, the environmental problems associated with maize cultivation can
be related to soil erosion and diffuse water pollution from the area of maize cultivation.
Soil erosion problems in maize fields can frequently be related to harvesting in late
autumn, which leaves surfaces bare and unprotected from rainfall impact in winter. This
could promote surface runoff and sediment mobilization and the transport of sediment
to nearby watercourses, which can pollute the water with both nutrients and pesticides.
The off-site impact associated with maize cultivation will be discussed in Chapter 7.
This chapter will focus on temporal and spatial patterns of maize cultivation in England
1 Establishment costs involved the cost of seed, agrochemicals and fertilizer before seeding, while the growing costs include fertilizer and agrochemical costs during the growing period. 2 The total fixed costs per 0.4046 ha include the costs of cultivation, drilling, spraying, fertilizer or slurry spreading, and ensiling costs.

50
and the Southwest Region, and the factors that have influenced changes in these
patterns.
4.3 The Data Used in this Analysis
This investigation of spatial and temporal patterns of maize cultivation in England and
the Southwest region is based on data from two sources. The sources comprise, firstly,
the Department for Environment, Food and Rural Affairs (DEFRA), and secondly, the
Edinburgh Library (EL). Each source has a different background which was explained
in the previous chapter.
The DEFRA data are based on the annual census through the Agricultural and
Horticultural Census, which are released annually in June. These data are based on
farmers’ information returns, field-by-field, and the results are presented in acreage
format. In the case of the EL data, the data are in digital map format, based on a spatial
resolution of a 1 km2 grid. It was necessary to manipulate the scale of the data from
unsupervised format to a supervised format of five categories, based on the density of
maize cultivation area in ha km-2. The five categories are (i) less than 2 ha km-2, (ii) 3-6
ha km-2, (iii) 7-12 ha km-2, (iv) 13-20 ha km-2, and (v) more than 20 ha km-2. The (i) and
(ii) values are considered as a low density, (iii) as a moderate density, and (iv) and (v)
as a high density. Although the manipulation of the EL data was applied to all available
data, as mentioned in the previous chapter, for the purpose of this chapter, only relevant
data will be used in order to review the spatial and temporal patterns of maize
cultivation in England. This involves the data available for four years, namely, 1979,
1988, 1995 and 2000.

51
4.4 Maize Cultivation in England
As indicated in the introduction to this chapter, crops still constitute the largest area of
agricultural land in England with most of cropland having used for the growing of
cereals. Cereals have becomes the most important crops in England since 1950, and the
area has probably never fallen below 2.4 million ha. The second most important crop in
England is stock crops (not for stock feeding) such as potato and sugar beat. This crop
increased in area by 25.9% between 1950 and 2003, increasing from 570,200 ha in 1950
to 717,700 ha in 2003. Fodder crops3 occupied the third place for cropland in England.
The area under fodder crops in 1950 extended 386,000 ha but this had decreased by
5.3% to 365,500 ha in 2003. Beans and peas have becomes important fodder crops in
England and accounted for 62.9% or 229,900 ha of the fodder crop area in 2003. They
are followed by maize in third place and the area cultivated for maize has expanded
rapidly since the 1970s.
According to DEFRA data, maize has been grown as a fodder crops in England since
1970, but the area was small in the early years. Figure 4.1 shows the temporal trend in
the area devoted to maize in England in the period from 1970 to 2004. In the early
1970s, the area of maize cultivation in England was relatively small, occupying an area
of less than 10,000 ha, and representing less than 5.0% of the total area under fodder
crops. The area of maize cultivation expanded to 20,800 ha in 1980, and increased by a
further 60.1% to 33,300 ha in 1990. However, since 1990, the area expanded to 100,000
ha in 1995 and to 107,494 ha in 2004, an increased of 7.5%. The greatest area cultivated
for maize in England was reported in 2001, when the crop occupied an area of 119,557
3 This includes turnips, swedes, fodder beet, mangolds, kale, cabbage, savoy, kohl rabi, beans, peas and maize.

52
ha. Table 4.2 presents more detailed data for the trend in the maize cultivation area in
England between 1970 and 2004.
1970
1972
1974
1980
1982
1984
1990
2000
2002
2004
0
20
40
60
80
100
120
Ha ('000)
Years
Figure 4.1: Trends in maize cultivation in England between 1970 and 2004
Table 4.2: Changes in the maize cultivation area in England between 1970 and 2004
Year Area (ha x 103)
Change (%)
Year Area (ha x 103)
Change (%)
1970 1.0 - 1984 14.7 1983-1984 (+2.1)
1971 2.0 1970-1971 (+100.0)
1985 19.0 1984-1985 (+16.2)
1972 3.5 1971-1972 (+75.0)
1990 33.3 1985-1990 (+75.3)
1973 6.6 1972-1973 (+88.6)
1995 100.4 1990-1995 (+67.0)
1974 15.7 1973-1974 (+137.9)
2000 97.6 1995-2000 (-2.8)
1975 25.5 1974-1975 (+62.4)
2001 119.5 2000-2001 (+22.4)
1980 20.8 1975-1980 (-18.4)
2002 111.3 2001-2002 (-6.9)
1981 17.0 1980-1981 (-18.3)
2003 108.4 2002-2003 (-2.6)
1982 15.0 1981-1982 (-11.8)
2004 107.4 2003-2004 (-0.9)
1983 14.4 1982-1983 (-4.0)
- - -
Source: DEFRA (various years)

53
Most of the area of maize cultivation during the 1970s was in the Eastern, Southeast and
Southwest regions, as shown in Figure 4.2. In the Eastern region, the area of maize
cultivation was greatest in the north-western and south-eastern parts. In the Southeast,
the maize cultivation area spread to the south-eastern, south-western and north-western
parts of the region but the greatest concentration was in the north-west of this region.
The area of maize cultivation in the Southwest was greatest in the eastern part of the
region.
Figure 4.3 shows the spatial distribution of maize cultivation area in England in 1988.
After nine years, the main areas of maize cultivation in England had a similar location
to that in 1979. However, in terms of the density, more areas of maize cultivation
evidenced increased, especially in the Southeast and the Southwest regions. In the
Southeast, more areas in the south-western and the north-western part of the region
became moderate in density, whilst in the Southwest, some area in the eastern part of
the region became high in density, and this area probably represented the greatest
concentration of maize growing in England in the late 1980s.
Although the maps of the maize cultivation areas in England in 1979 and 1988,
presented in Figure 4.2 and Figure 4.3, show some changes in density, in general many
areas remained low. Growing maize in the United Kingdom has always been related to
dairy farming, and more specifically to milk prices. Some small changes in the density
of maize cultivation in the 1970s to 1980s could reflect decreases in the milk price.
According to the Milk Marketing Board (DEFRA), the milk price in 1974-1983 (26.92
p/l) decreased by 9.1% when compared to that in 1964-1973 (24.48 p/l).

54
Figure 4.2: The distribution of maize cultivation in England in 1979
(ha km-2)

55
Figure 4.3: The distribution of maize cultivation in England in 1988
(ha km-2)
56
By 1995, there was very rapid expansion of the area of maize cultivation in England
compared to 1990. The area cultivated with maize increased by 201.5% to 100,432 ha.
With the exceptional of the Eastern region, all regions in England showed more than a
100.0% increase in their maize cultivation area, as shown in Table 4.3. The area
cultivated for maize in the Eastern region increased by only 50.0%. The largest area
cultivated with maize in 1995 was found in the Southwest region, occupying an area of
49,600 ha, followed by the Southeast region (18,900 ha), the West Midlands (12,700
ha), and the Eastern region (6,000 ha). According to Figure 4.4, the greatest
concentration of maize growing in 1995 was in the Southwest and West Midlands
regions, especially in the eastern part of the Southwest, and in the northern and southern
parts of the West Midlands. Meanwhile, in the Southeast region, maize cultivation was
greatest in the south-western part. Compared with 1988, more areas in England were
characterized by a higher density of maize production.
This major change in area and density of maize cultivation can be related to incentives
from the AAPS. As indicated in Section 4.2, by the mid-1990s, maize qualified for the
highest payment of £320 per 0.4046 ha. Supporting this was an increase in the standard
milk price from 19.35 p/l in 1985-1980 to 21.28 p/l in 1991-1998, which also caused
growth in the dairy farming sector. The 1990s also saw changes in technology for maize
growers. Improvement in mechanization allowed the use of larger machines that in turn
led to an increase in field and farm sizes. New tractors for cultivation such as sprayers
for weed pest and disease control, and the use of larger harvesting machines helped
farmers to reduce overall costs, and encouraged farmers to grow maize on a large scale.
In addition, genetic improvements, which focused on herbicide tolerance, and also

57
Table 4.3: The maize cultivation area for all regions in England
Region Area in 1990 (ha x 103)
Area in 1995 (ha x 103)
Change 1991-1995 (%)
Area in 2000 (ha x 103)
Change 1995-2000 (%)
Area in 2001 (ha x 103)
Change 2000-2001 (%)
Area in 2002 (ha x 103)
Change 2001-2002 (%)
Area in 2003 (ha x 103)
Change 2002-2003 (%)
South West
15.0 49.6 +230.6 42.8 -13.7 51.6 +20.6 48.2 -6.6 47.8 -0.8
South East 9.0 18.9 +110.0 18.1 -4.2 22.1 +22.1 20.2 -8.6 18.7 -7.4 Eastern 4.0 6.0 +50.0 6.3 +5.0 7.7 +22.2 7.0 -9.1 6.2 -11.4 West Midlands
2.0 12.7 +535.0 13.0 +2.4 16.1 +23.8 15.3 -5.0 15.3 0.0
Northwest 1.2 5.8 +383.3 8.2 +41.4 10.1 +23.2 9.5 -6.0 9.6 +1.0 East Midlands
1.1 5.4 +390.9 6.8 +25.9 8.7 +27.9 8.0 -8.0 7.8 -2.5
Yorkshire and Humber
0.3 1.5 +400.0 2.0 +33.3 2.6 +30.0 2.7 +3.8 2.6 -3.7
Northeast 0.02 0.2 +900.0 0.2 0.0 0.2 0.0 0.2 0.0 0.2 0.0 London 0.06 0.2 +233.3 0.2 0.0 0.3 +50.0 0.1 -30.0 0.1 0.0 Source: DEFRA (various years)

58
Figure 4.4: The distribution of maize cultivation in England in 1995
(ha km-2)

59
provided maize growers with various varieties of high yield seeds, increased maize
yields and maize growers’ incomes, on top of the AAPS.
By 2000, the area under maize cultivation in England slightly decreased by 2.8%, down
to 97,623 ha, compared with area in 1995, but increased again in 2004 by 10.1% up to
107,494 ha. As in the 1980s and 1990s, the Southwest region and the Southeast still
remained as the most important maize cultivation areas in England in 2000. However,
the area under maize expanded more in the Southwest than in the Southeast, as shown
in Figure 4.5. Most of the area under maize in the Eastern region and the West Midlands
remained more or less static. The densest area cultivated with maize could thus be
found in the Southwest, especially in the eastern part of Devon, Somerset and Dorset.
The area cultivated with maize in the Southeast still remained densest in the western
and southern parts of the region, whilst in the West Midlands, the densest area for maize
cultivation could be observed in northern part, spreading out from there to the southern
part of the region.
Small changes in the area of maize cultivation between 1995 and 2004 can be related to
changes in the dairy farming sector. The number of dairy farming holders and the
number of dairy cows in 2004 decreased by 37.0% (15,554 holders) and 24.0%
(1,374,456 cows), respectively, compared with 1995, when there were 24,678 holders
and 1,809,282 cows. This decrease can also be related to a decline in milk price, where
the milk price in 2002-2003 was 18.33 p/l, a decrease of 13.9% from the price in 1997-
1998 (21.28 p/l). The expansion of the area under maize in England, also has
implications for environmental problems, especially the off-site impact of the silage
maize area after harvesting during winter, in regard to soil erosion from bare maize
fields. This is one of the DEFRA concerns in the CAP reform in 2000, which

60
Figure 4.5: The distribution of maize cultivation in England in 2000
(ha km-2)

61
recognized that the degraded standard of water quality during winter could be caused by
soil erosion from bare maize fields. One of the key changes associated with the CAP
reform in 2000, aimed at reducing soil erosion, and avoiding diffuse pollution from
maize area and other crop lands, was the AAPS, which declined by 29.5% in 2001 to
£225.64 per hectare, compared with payment rates in the mid-1990s of £320.00 per
hectare. Although DEFRA promoted environmentally friendly practises in cropping
through the agri-environmental scheme, most farmers, including maize growers, were
probably still not ready to change the management systems at that time, especially small
holding farmers.
Although the area of maize cultivation shows a decline between 1990 and 2004, the
author also believes that the area of maize cultivation will continue to show a small
decrease in coming years, at least until 2010. This is based on the projection by the Milk
Development Council, that milk price would be around 15.00 p/l from 2007 onwards.
Compared with milk price in 2002-2003, this is a decrease by 18.2%. Under the CAP
reform in 2003, farmers have to follow many environmentally friendly approaches
recommended by DEFRA in order to sustain the environment. However, it seems that
many farmers are still not ready to fulfil most of the environmentally friendly
requirements, as for example mentioned in the Single Payment Scheme and the
Environmental Stewardship Scheme, which required them to prepare Soil Management
Plans and Soil Protection Reviews. All these could influence the area of maize
cultivation in England in the future.
4.5 Maize Cultivation in the Southwest Region
In terms of cropland area, the Southwest is the fifth region in England after the Eastern
region, the East Midlands, the Southeast, and Yorkshire and the Humber region. In

62
2003, the Southwest region accounted for 7.1% of the cropland in England. Cereals
have become the most important crop in the Southwest region, and in 2003 occupied an
area of more than 312,600 ha. Fodder crops were in second place with a cultivated area
of greater than 80,800 ha. Somerset, Devon and Dorset had been the largest areas
cultivated with cereals and fodder crops in 2003. Figure 4.6 shows the trends for
cropland areas in the Southwest, whilst Figure 4.7 shows the trend for cropland areas
for each county in the Southwest from 1950 to 2003.
0
50
100
150
200
250
300
350
400
450
1950 1960 1970 1980 1990 1995 2000 2001 2002 2003
Years
Ha ('000) Cereals
Stock crops
Fodder crops
Horticultural
Figure 4.6: Trends in cropland area in the Southwest between 1950 to 2003
0
50
100
150
200
250
Devon Wiltshire Gloucestershire Cornwall & Isles
of Scilly
Somerset Dorset
County
Hectares ('000)
1950
1960
1970
1980
1990
1995
2000
2001
2002
2003
Figure 4.7: Trends in cropland area for each county in the Southwest between 1950 to 2003

63
As indicated in section 4.4, maize has probably been grown as a fodder crop since the
late 1960s, and the area cultivated with maize also expanded very rapidly in the
Southwest, especially in the 1990s and early 2000s. In 1990, the area under maize in the
Southwest occupied 14,200 ha, and increased by 228.2% up to 46,600 ha in 1995.
However, this figure declined by 14.2% in 2000 to 40,000 ha, but increased again in
2004 by 11.7% to 44,700 ha. According to Figure 4.8, Dorset and Somerset became the
most important areas of maize cultivation in 1990, accounting for 3,400 ha and 3,300
ha, respectively. However, by 1995, Somerset had become the most important area of
maize cultivation, with an area of 11,200 ha. Somerset was followed by Dorset and
Devon in second and third places, with areas of 9,500 ha and 9,200 ha, respectively.
Until 2003, Somerset and Devon were the most important maize growing areas in the
Southwest, with a combined area of 20,500 ha.
0
10
20
30
40
50
60
South West
Dorset
Somerset
Devon
Wiltshire
Gloucestershire
Cornwall & Isles of Scilly
County
Hectares ('000)
1990
1995
2000
2001
2002
2003
Figure 4.8: Trend in maize cultivation for each county in the Southwest between 1990 to 2003
As shown in Figure 4.9, Somerset, Dorset and Wiltshire were the most important areas
for maize cultivation in 1979. In Somerset, maize cultivation was densest in the eastern

64
and southern parts of the county. In Dorset, maize cultivation can be seen to be
important in the eastern and south-eastern parts of the county, whilst in Wiltshire, most
of the maize cultivation area can be found in the western and northern parts of the
county. At this time, maize cultivation was relatively limited in Devon, Gloucestershire,
Avon and Cornwall.
When compared with 1979, maize cultivation in the Southwest in 1988 expanded
rapidly in Devon, as shown in Figure 4.10. The area of maize cultivation became
moderately dense in the eastern and south-eastern parts of the county. Meanwhile, in
Somerset, maize cultivation was widely distributed, whilst in Dorset, only limited
changes were seen in terms of the area of maize cultivation, because it was largely
grown within the same areas. These changes reflected similar trends to those found at
the national scale, which can be related to increases in the number of dairy cows.
Figure 4.9: The distribution of maize cultivation in the Southwest Region (1979)
Legend ha km-2

65
Overall, the number of dairy cows in the South declined by 7.7% between 1981 and
1988 from 778,880 cows in 1981 to 718,767 cows in 1988.
According to Figure 4.11, the density of maize cultivation in the Southwest in 1995 was
denser than in 1988. By 1995, the densest area was in eastern part of Somerset and
northern part of Dorset. In fact, the area under maize in Somerset expanded in every
corner of the county except the north-western part. Other counties also show an
expansion of the area of maize cultivation, and more new areas of maize cultivation can
be found in southern, western and south-eastern parts of Devon and Cornwall. In 2000,
the densest area of maize cultivation occurred in almost the same locations as in 1995,
and there were not many changes can be found in terms of the absolute density (Figure
4.12). In some areas in Wiltshire that were cultivated with maize previously, the density
of maize cultivation increased, especially in the northern and eastern parts of the
county. However, in other counties, most of the areas previously under maize have
Figure 4.10: The distribution of maize cultivation in the Southwest Region (1988)
Legend ha km-2

66
remained so. In addition, the highest increases in the area under maize in the Southwest
between 1995 and 2000 occurred in Devon, by 15% up to 10,599 ha.
Figure 4.11: The distribution of maize cultivation in the Southwest Region (1995)
Legend ha km-2
Figure 4.12: The distribution of maize cultivation in the Southwest Region (2000)
Legend ha km-2

67
Some changes in the density of the area under maize in the Southwest between 1995
and 2000 show similar trends to the national level. In addition to the decline in milk
price and incentive payment under the AAPS, the number of dairy cows in all counties
in the Southwest also decreased. For example, the number of dairy cows in Devon in
2000 decreased by 11.5% (155,229 cows), compared with the number of dairy cows in
1995 (175,505 cows). Table 4.4 shows the decreases in number of dairy cows in the
Southwest that could account for the changes in the area under maize in the region.
4.6 Conclusion
Agriculture is one of the important activities in England, especially in the Southwest
region. Most of the agricultural land in England and the Southwest is cultivated with
crops, especially for cereal and stock feeding. Fodder crops have become the third most
important crops in England and the Southwest. Maize too has become an important
fodder crop, and its cultivation expanded very rapidly between 1990 and 2000 in
England and notably the Southwest region.
This chapter has discussed the temporal and spatial patterns of maize cultivation in
England at the national level but with particular emphasis on the Southwest region. At
the national level, growing maize as a fodder crop has become very important since the
1990s to support dairy farming. The rapid expansion of the maize area has occurred in
almost every region in England, especially in the Eastern, Southeast and Southwest
regions. From the 1970s to the 1980s, most of the maize cultivation area could be found
in the Eastern and Southeast regions. However, since then, maize cultivation area has
spread rapidly and has become denser in the Southwest region from the 1990s to the
present. In the Southwest, the spatial distribution of maize cultivation area in the 1970s
and 1980s became denser in Somerset, Dorset and Wiltshire. However, the situation has

SOIL EROSION, DIFFUSE SOURCE POLLUTION AND SEDIMENT
PROBLEMS ASSOCIATED WITH MAIZE CULTIVATION IN ENGLAND
by
MOKHTAR BIN JAAFAR
Thesis submitted in partial fulfillment of the requirement for the Degree of Doctor of Philosophy of the University of Exeter
May 2010

i
SOIL EROSION, DIFFUSE SOURCE POLLUTION AND SEDIMENT
PROBLEMS ASSOCIATED WITH MAIZE CULTIVATION IN ENGLAND
Submitted by MOKHTAR BIN JAAFAR to the University of Exeter as a thesis for the degree of Doctor of Philosophy in Geography, May 2010.
The thesis is available for Library use on the understanding that it is copyright material and that no quotation from the thesis may be published withput proper
acknowledgement.
I certify that all material in this thesis which is not my own work has been identified and that no material has previously been submitted and approved for the award of a degree
by this or any other University.
…………………………….. (MOKHTAR BIN JAAFAR)

ii
Abstract
SOIL EROSION, DIFFUSE SOURCE POLLUTION AND SEDIMENT
PROBLEMS ASSOCIATED WITH MAIZE CULTIVATION IN ENGLAND
This thesis reports an investigation of soil erosion problems associated with maize cultivation in England. To place the investigation into a broader context, the study commences with a review of soil erosion problems more generally, before focusing on the specific on-site and off-site problems associated with maize cultivation. Agricultural statistics are used to quantify the recent expansion of maize cultivation in England and attention is directed to both the temporal trends and spatial patterns involved. A major expansion of maize cultivation occurred in England between 1990 and 2000. Particular attention is then directed to the expansion of maize cultivation in Southwest England, since this is a very important area for cultivation of forage maize.
Against this general background, a more detailed investigation of soil erosion associated with maize fields and its impact on the local streams and rivers was undertaken. This focused on two river catchments, namely the River Culm above Cullompton, Devon, and the River Tone above Taunton, Somerset. These two basins were selected as having a high density of maize fields within their catchments. A detailed field survey was undertaken to identify all the fields used for maize cultivation in the two catchments during 2004 and the previous two years and to provide a map of their location. More detailed work, aimed at quantifying both gross and net rates of soil loss, was undertaken on six fields selected to be representative of maize fields in the two catchments. Beryllium-7 measurements were used to estimate the erosion associated with a period of heavy rainfall in late December 2004 and early January 2005, when the harvest fields were left in a bare compacted conditions, with little or no vegetation cover and field observations indicated that significant erosion occurred. The results obtained from the beryllium-7 measurements which related only to the short period in late 2004 and early 2005 were complemented by caesium-137 measurements in the same fields which were used to obtain an estimate of the longer-term (i.e. ca. 45 years) mean annual erosion rates associated with the more traditional land use that had characterized these fields prior to the introduction of forage maize cultivation. These results indicated that the introduction of maize cultivation increased gross and net rates of soil loss by ca. 4 and 8 times, respectively and significantly increased sediment delivery ratios, resulting in more efficient delivery of sediment from the eroding fields to the streams.
An assessment of the likely impact of sediment mobilised from the maize fields within the catchments of the River Culm and River Tone during winter 2004-5 was made by establishing a sediment monitoring and sampling programme at the downstream gauging stations on these two rivers over the period November 2004 to March 2005. Estimates of the suspended sediment loads of both rivers were obtained for this period and these were compared with an estimate of the total amount of sediment delivered to the water courses in the two catchments from maize fields based on an upscaling of the results obtained from the beryllium-7 measurements undertaken on the six representative fields. Uncertainties regarding both field to channel and within channel

iii
and floodplain conveyance losses precluded definitive comparison of the estimates of the amounts of sediment delivered to the water courses from maize fields with the measured sediment loads. However, the results obtained demonstrated the likely importance of the contribution from eroding maize fields to the suspended sediment loads of the Rivers Culm and Tone during winter 2004-5. The geochemical properties of suspended sediment collected from the two rivers were also compared with the equivalent properties of soil collected from the surface of maize fields within the two study catchments, in order to provide further evidence of the impact of maize cultivation on their suspended loads. The available geochemical data confirmed that much of the sediment transported by the Rivers Culm and Tone could have been mobilized from maize fields, but the lack of detailed geochemical data, precluded a definitive conclusion regarding its source.
The results obtained from the field-based component of the study have been combined with the information on the regional and national patterns of maize cultivation and synthesized to provide a general assessment of the likely environmental impact of maize cultivation in England. This information has in turn been used to consider the potential for developing improved land management practises to reduce the environmental impact of maize cultivation within the context of the EU Common Agricultural Policy (CAP) and the Water Framework Directive (WFD). Finally, recommendations for the further development and extension of the study are provided.

iv
CONTENTS
Page
Declaration i Abstract ii Contents iv List of Tables viii List of Figures x List of Plates xii Abbreviations xiii Acknowledgements xv CHAPTER 1: INTRODUCTION
1.1 Overview 1.2 Soil Erosion on Agricultural Land in England 1.3 Maize Cultivation and Environmental Problem in England 1.4 Research Needs 1.5 Research Aims 1.6 Thesis Structure
1 2 7 10 12 12
CHAPTER 2: RESEARCH STRATEGY
2.1 Overview 2.2 Research Objectives 2.3 Selection of the Study Area 2.3.1 National scale 2.3.2 Regional scale 2.3.3 Local scale 2.3.4 Site scale 2.4 Summary
14 14 15 17 18 19 21 22
CHAPTER 3: METHODOLOGY
3.1 Introduction 3.2 Field Sampling and Sample Preparation 3.2.1 Soil sampling and sample preparation for 7Be measurement 3.2.2 Soil sampling and sample preparation for 137Cs measurement 3.2.3 Soil sampling and sample preparation for 210Pb and chemical
analysis 3.2.4 River water sampling and sample preparation for suspended
sediment analysis 3.3 Laboratory Analysis 3.3.1 Radionuclide measurement 3.3.1.1 Measurement of 7Be and 137Cs activity in soil samples 3.3.1.2 Measurement of excess 210Pb in soil and suspended sediment
samples 3.3.2 Total organic carbon (C) and nitrogen (N) analysis 3.3.3 Heavy metal analysis 3.3.4 Base cations analysis 3.3.5 Total phosphorus analysis
24 24 25 27 29
30
31 31 33 35
36 38 39 39

v
3.4 Data Manipulation and Analysis 3.4.1 DEFRA data 3.4.2 Edinburgh Library data 3.4.3 CEH data 3.4.4 Field mapping data 3.5 Summary
39 40 40 41 42 42
CHAPTER 4: MAIZE CULTIVATION IN ENGLAND AND THE
SOUTHWEST REGION
4.1 Introduction 4.2 Maize Cultivation: An Overview 4.3 The Data Used in this Analysis 4.4 Maize Cultivation in England 4.5 Maize Cultivation in the Southwest Region 4.6 Conclusion
43 44 50 51 61 67
CHAPTER 5: MAIZE CULTIVATION IN THE CULM AND TONE
CATCHMENTS
5.1 Introduction 5.2 Spatial and Temporal Patterns of Maize Cultivation in the Culm and
Tone Catchments 5.2.1 Maize cultivation in the Culm Catchment 5.2.2 Maize cultivation in the Tone Catchment 5.3 The Connectivity of the Maize Fields and the River Networks 5.3.1 The connectivity between maize fields and river network in the
Culm Catchment 5.3.2 The connectivity between maize fields and river network in the
Tone Catchment 5.3.3 Discussion 5.4 Conclusion
70 70
71 77 81 82
83
93 96
CHAPTER 6: SOIL EROSION ASSOCIATED WITH MAIZE
CULTIVATION
6.1 Introduction 6.2 Study Site 6.2.1 Study sites in the Culm Catchment 6.2.1.1 The Dalwood Farm study site 6.2.1.2 The Little Landside Farm study site 6.2.1.3 The Westcott Farm study site 6.2.2 Study sites in the Tone Catchment 6.2.2.1 The Cutsey Farm study site 6.2.2.2 The Higher Woodbrook Farm study site 6.2.2.3 The Ritherden Farm study site 6.3 Use of 7Be to Document Short-Term Erosion Rates 6.3.1 Origin of 7Be 6.3.2 Use of 7Be to investigate soil redistribution 6.3.2.1 Assumption of the 7Be technique 6.3.2.2 Converting 7Be measurements into estimates of soil
redistribution
97 97 99 99 100 100 101 101 101 102 102 102 103 104 105

vi
6.3.3 7Be soil sampling programme 6.4 Investigation of Short-Term Soil Erosion in the Study Fields 6.4.1 7Be measurements 6.5 Use of 137Cs to Document Longer-Term Erosion Rates 6.5.1 Production of 137Cs 6.5.2 The 137Cs technique 6.5.2.1 Assumption of the 137Cs technique 6.5.2.2 Converting the 137Cs measurements into soil redistribution
rates 6.5.3 137Cs soil sampling programme 6.6 Investigation of Longer-Term Soil Erosion Rates 6.6.1 137Cs measurements 6.7 Discussion of the Estimates of Short-Term and Longer-Term Erosion
Rates Provided by the 7Be and 137Cs measurements 6.8 Conclusion
107 110 110 115 115 116 117 118
122 122 123 127 132
CHAPTER 7: RIVER MONITORING AND SEDIMENT
INVESTIGATIONS IN THE RIVERS CULM AND TONE
7.1 Introduction 7.2 The River Monitoring and Sediment Investigation Programme 7.3 Results from the Sediment Monitoring Programme 7.3.1 The relationships between sediment concentration (SSC) and
turbidity (FTU) 7.3.2 Estimation of sediment load (SSL) and sediment yield (SY) 7.3.3 Comparison of the sediment loads of the Rivers Culm and Tone
with estimates of the sediment generated by erosion of the maize fields during the study period
7.4 Analysis of Sediment Properties 7.5 Conclusion
133 133 136 136
137 141
145 147
CHAPTER 8: THE ENVIRONMENTAL IMPACT OF MAIZE
CULTIVATION IN ENGLAND
8.1 Introduction 8.2 Soil Erosion Associated with Maize Cultivation 8.3 Soil Types and the Distribution of Maize Cultivation 8.4 Diffuse Pollution Associated with Maize Cultivation 8.5 Conclusion
149 150 159 161 163
CHAPTER 9: MAIZE CULTIVATION MANAGMENT
9.1 Introduction 9.2 Erosion Control Associated with Maize Cultivation 9.3 The Common Agricultural Policy (CAP) and Maize Cultivation 9.3.1 Single Farm Payment (SFP) scheme 9.3.2 The Environmental Stewardship Scheme (ESS) 9.4 Catchment Sensitive Farming (CSF) 9.5 The Agri-Environment Scheme (AES) and Code of Good Agriculture
Practise (COGAP) 9.6 The Water Framework Directive (WFD) and Diffuse Water Pollution
from Agriculture (DWPA)
165 166 171 172 176 180 185
190

vii
9.7 Discussion and Recommendations 9.8 Conclusion
192 197
CHAPTER 10: CONCLUSION
10.1 Introduction 10.2 Maize Cultivation in England: Spatial and Temporal Characteristics and
Trends 10.3 Rates of Soil Loss Associated with Maize Cultivation in England 10.4 The Contribution of Maize Cultivation to the Suspended Sediment
Loads of Local Rivers 10.5 The Environmental Impact of Maize Cultivation in England 10.6 Maize Cultivation Management in England 10.7 The Wider Contribution of the Study 10.8 Recommendations for Future Work 10.9 Concluding Remarks
199 201
202 204
206 207 207 210 213
REFERENCES 214

viii
LIST OF TABLES
Table Page
4.1 A ranked list silage maize and grain maize production within European countries in 1999
45
4.2 Changes in the maize cultivation area in England between 1970 and 2004
52
4.3 The maize cultivation area for all regions in England 57 4.4 The area of maize cultivation and the number of dairy cows in the
Southwest in 1990, 1995 and 2000 68
5.1 The area of maize cultivation and the number of maize fields in the Culm Catchment in 2002, 2003 and 2004
74
5.2 The overlay analysis results for the area of maize cultivation in the Culm Catchment for 2002, 2003 and 2004
76
5.3 The area of maize cultivation and the number of maize fields in the Tone Catchment in 2002, 2003 and 2004
81
5.4 The overlay analysis results for the area of maize cultivation in the Tone Catchment for 2002, 2003 and 2004
81
5.5 The number of maize fields with regard to distance from the River Culm channel network in 2002
87
5.6 The number of maize fields with regard to distance from the River Culm channel network in 2003
87
5.7 The number of maize fields with regard to distance from the River Culm channel network in 2004
87
5.8 The number of maize fields with regard to distance from the River Tone channel network in 2002
92
5.9 The number of maize fields with regard to distance from the River Tone channel network in 2003
92
5.10 The number of maize fields with regard to distance from the River Tone channel network in 2004
92
6.1 Number of sampling points 110 6.2 The mean inventory and reference inventory values for the study
fields 111
6.3 The values of GER, NER and SDR associated with estimate the of short-term erosion rate for the six study fields
115
6.4 Number of sampling points 123 6.5 The mean inventory and reference inventory values 124 6.6 The estimates of longer-term values of GER, NER and SDR provided
for the six study fields by the 137Cs measurements 127
6.7 Comparison of GER, NER and SDR of short- and longer-term soil erosion, represented by 7Be and 137Cs
129
7.1 Average values of estimated SSC (mg l-1) for the Rivers Tone and Culm during the study period
141
7.2 Estimated values of SSL and SY for Rivers Tone and Culm 141 7.3 A comparison of the estimates of sediment input to the river systems
of the Culm and Tone catchments from the maize fields during the new winter of 2004-5 with the measured suspended sediment load for this period
144

ix
7.4 Mann-Whitney U-test results for a comparison of the geochemical
properties of surface soils from eroding maize fields and suspended sediment collected in the Culm and Tone basins
147
9.1 Summary of investigations aimed at controlling erosion associated with fodder maize cultivation
169
9.2 Good Agricultural and Environmental Condition (GAEC) in use for cross-compliance guidance for the management of habitats and landscape features in 2005
173
9.3 Statutory Management Requirements regimes 174 9.4 Erosion risk category with regard to risk classes and soil types 176 9.5 Sign of runoff risk with regard to risk classes and soil types 176 9.6 List of farmer objectives and practices 183 9.7 Some examples of the environmental issues associated with maize
cultivation in the ECSFDI scheme 186
9.8 A summary of the key elements in the Code of Agricultural Practice for the Protection of Soil
189
9.9 An example of choosing correct early-maturing maize based on maturity score
194

x
LIST OF FIGURES
Figure Page
2.1 Flow chart of the project 16 4.1 Trends in maize cultivation in England between 1970 and 2004 52 4.2 The distribution of maize cultivation in England in 1979 54 4.3 The distribution of maize cultivation in England in 1988 55 4.4 The distribution of maize cultivation in England in 1995 58 4.5 The distribution of maize cultivation in England in 2000 60 4.6 Trends in cropland area in the Southwest between 1950 and 2003 62 4.7 Trends in cropland area for each county in the Southwest between
1950 and 2003 62
4.8 Trend in maize cultivation for each county in the Southwest between 1990 and 2003
63
4.9 The distribution of maize cultivation in the Southwest Region (1979) 64 4.10 The distribution of maize cultivation in the Southwest Region (1988) 65 4.11 The distribution of maize cultivation in the Southwest Region (1995) 66 4.12 The distribution of maize cultivation in the Southwest Region (2000) 66 5.1 The spatial distribution of maize cultivation density in the Culm
Catchment in 1979(a), 1988(b), 1995(c) and 2000(d) 72
5.2 The spatial distribution of maize cultivation in the Culm Catchment in 2002(a), 2003(b) and 2004(c)
75
5.3 The spatial distribution of maize cultivation density in the Tone Catchment in 1979(a), 1988(b), 1995(c) and 2000(d)
78
5.4 The spatial distribution of maize cultivation in the Tone Catchment in 2002(a), 2003(b) and 2004(c)
80
5.5 An example of buffering analysis and spatial distribution of maize cultivation in the Culm Catchment in 2002
84
5.6 An example of buffering analysis and spatial distribution of maize cultivation in the Culm Catchment in 2003
85
5.7 An example of buffering analysis and spatial distribution of maize cultivation in the Culm Catchment in 2004
86
5.8 An example of buffering analysis and spatial distribution of maize cultivation in the Tone Catchment in 2002
89
5.9 An example of buffering analysis and spatial distribution of maize cultivation in the Tone Catchment in 2003
90
5.10 An example of buffering analysis and spatial distribution of maize cultivation in the Tone Catchment in 2004
91
5.11 The area of maize cultivation (%) with regard to the distance from river networks
95
6.1 (a) The location of Culm Catchment (Devon) and Tone Catchment (Somerset) in the Southwest region, and (b) six study fields in both catchments
98
6.2 Total rainfall at the Hemyock and Clayhanger rain gauge stations for the period November 2004 to March 2005
109
6.3 Total daily rainfall at the Hemyock and Clayhanger rain gauge stations for the period 20 December to 10 January 2005
109

xi
6.4 The depth distribution of 7Be in a stable soil profile from a reference site
111
6.5 Estimates of erosion and deposition derived from 7Be measurements for the two transects representative of three maize fields in the Culm Catchment at (a) Dalwood, (b) Little Landside and (c) Wescott
113
6.6 Estimates of erosion and deposition derived from 7Be measurements for the two transects representative of three maize fields in the Tone Catchment at (a) Cutsey, (b) Higher Woodbrook and (c) Ritherdeen
114
6.7 137Cs estimates of erosion and deposition for the two transects representative of three maize fields in the Culm Catchment at (a) Dalwood, (b) Little Landside, and (c) Wescott
125
6.8 137Cs estimates of erosion and deposition for the two transects representative of three maize fields in the Culm Catchment at (a) Cutsey, (b) Higher Woodbrook, and (c) Ritherdeen
126
7.1 The relationships between suspended sediment concentration and turbidity established for (a) the River Tone at the Bishop’s Hull gauging station, and (b) the River Culm at the Woodmill gauging station
139
7.2 Estimates of daily mean SSC for the two study catchments for the study period November 2004 to March 2005
140
8.1 Monthly rainfall in England between 2002 and 2006 153 8.2 The distribution of rainfall in the Southwest, the Southeast and West
Midlands between October 2005 and March 2006 153
8.3 Comparison between the spatial distribution of sediment transport capacity of overland flow
156
8.4 Comparison between (a) the connectivity index, (b) spatial distribution of maize cultivation in England in 2000, and (c) connectivity ratio
157
8.5 Erosion vulnerability for (a) 1-in-1 year erosion events, and (b) for 1-in-10 year erosion events
158
8.6 Comparison between (a) soil types and (b) the spatial distribution of maize cultivation in England in 2000
160
8.7 (a) Areas at risk of phosphorus pollution and (b) the distribution of maize cultivation in 2000
162
8.8 (a) Catchments at risk from diffuse agricultural pollution and (b) the distribution of maize cultivation in 2000
163
9.1 The links between the various policies, schemes and initiatives which influence farming practices in the England
166
9.2 The location of the ESAs programme 181 9.3 List and map of priority areas under the England Catchment
Sensitive Farming Delivery Initiative (ECSFDI) 184
9.4 Map shows the Nitrate Vulnerable Zones in England 191
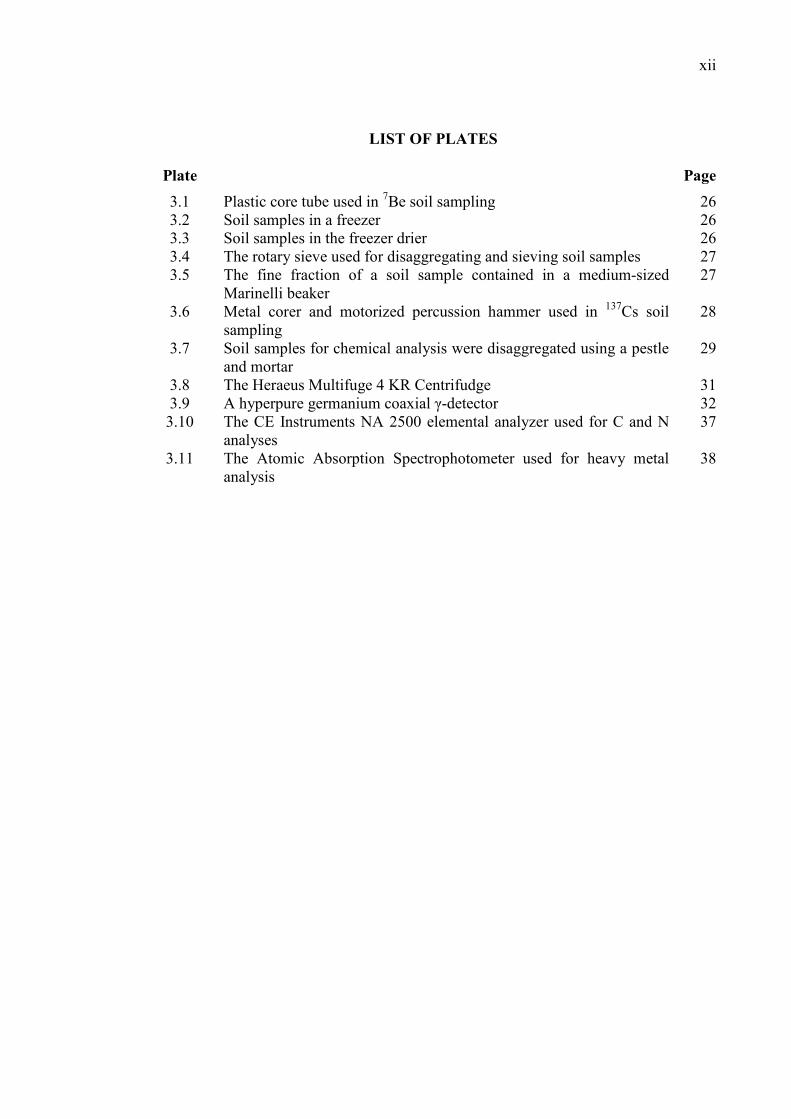
xii
LIST OF PLATES
Plate Page
3.1 Plastic core tube used in 7Be soil sampling 26 3.2 Soil samples in a freezer 26 3.3 Soil samples in the freezer drier 26 3.4 The rotary sieve used for disaggregating and sieving soil samples 27 3.5 The fine fraction of a soil sample contained in a medium-sized
Marinelli beaker 27
3.6 Metal corer and motorized percussion hammer used in 137Cs soil sampling
28
3.7 Soil samples for chemical analysis were disaggregated using a pestle and mortar
29
3.8 The Heraeus Multifuge 4 KR Centrifudge 31 3.9 A hyperpure germanium coaxial γ-detector 32 3.10 The CE Instruments NA 2500 elemental analyzer used for C and N
analyses 37
3.11 The Atomic Absorption Spectrophotometer used for heavy metal analysis
38
xiii
ABBREVIATIONS
AAPS Arable Area Payment Scheme AAS Atomic Absorption Spectrophotometry ACL Agricultural Land Classification AES Agri-Environment Scheme Bq Becquerel CAP Common Agricultural Policy CEH Centre for Ecological Hydrology CIA Central Intelligence Agency COGAP Code of Good Agricultural Practise CSF Catchment Sensitive Farming CSS Countryside Stewardship Scheme DC The number of dairy cows CS Countryside Stewardship DEFRA Department of Environment, Food and Rural Affairs DM Dry matter (maize silage) DWPA Diffuse Water Pollution from Agriculture EA Environment Agency EAS Environmentally Sensitive Areas ECSFDI England Catchment Sensitive Farming Delivery Initiative EL Edinburgh Library ELS Entry Level Stewardship ESA Environmentally Sensitive Area ESS Environmental Stewardship Scheme ETDA Ethylene diamine-tetra acid EU European Union EUWFD European Union Water Framework Directive FAO Food and Agriculture Organization FEP Full energy peak FER Farm Environment Record FMD Foot and Mouth Disease FRP Filterable reactive P GAEC Good Agricultural and Environmental Condition GER Gross erosion rate GIS Geographical Information Systems HLS Higher Level Stewardship HPGe High-purity germanium IACR Institute of Arable Crops Research IGER Institute of Grassland and Environmental Research LCM Land Cover Map LFA Less Favoured Area MAFF Ministry of Agriculture, Fisheries and Food MC Area under maize cultivation NER Net erosion rate NVZ Nitrate Vulnerable Zones OELS Organic Entry Level Stewardship POS Protection of Soil
xiv
POW
Protection of Water
RBMP River Basin Management Plan RBPG River Basin Planning Guidance RPA Rural Payment Agency RQO River Quality Objective SDA Severely Disadvantage Areas SDR Sediment delivery ratio SFPS (SFP) Single Farm Payment Scheme SMP Soil Management Plan SMR Statutory Management Requirements SOAEFD The Scottish Office Agriculture, Environment and Fisheries
Department SPS Single Payment Scheme SSC Suspended sediment concentration FTU Formazin Turbidity Unit SSL Suspended sediment load SY Sediment yield TPO Tree Preservation Orders TSE Transmissible Spongiform Encephalopathies USLE Universal Soil Loss Equation WFD Water Framework Directive

xv
ACKNOWLEDGEMENTS
Firstly, my thanks go to my supervisors; Prof. Des Walling and Dr Yusheng Zhang, to whom I am particularly indebted for the support, ideas, supervision and encouragement that they have provided throughout my time as a PhD student. Special thanks are also due to the School of Geography, University of Exeter, and particularly to Jim Grapes, Diane Fraser and Andy Bartram for the provision of valuable technical support. The help and cooperation of many landowners in the Culm and Tone catchments, who allowed access to their land and permitted collection of soil and sediment samples is also gratefully acknowledged. This study could not have been undertaken without the support of the Universiti Kebangsaan Malaysia and the Ministry of Higher Education Malaysia. I wish to express my gratitude to the Ministry of Higher Education for provision of a scholarship and to my University for granting leave of absence to enable me to undertake PhD studies in the UK. Finally, I wish to express my humble gratitude to my colleagues in the School of Social, Development and Environmental Studies, Faculty of Social Sciences and Humanities, Universiti Kebangsaan Malaysia for their support and encouragement, and to my father, Jaafar Mahussain, who has patiently supported me in so many ways.

1
CHAPTER 1: INTRODUCTION
1.1 Overview
Globally, land degradation is studied by scientists, such as geomorphologists, engineers
and ecologists in order to understand physical processes. In particular, soil erosion is
one of the physical processes of land degradation that can cause serious environmental
problems.
Pimentel and Kounang (1998) estimated that about 75 billion tonne of soils are eroded
from the world’s terrestrial ecosystems each year. In most cases, agricultural land is the
most at risk of being eroded, losing soil at rates ranging from 13 t/ha/yr to 40 t/ha/yr.
The authors also state that worldwide, erosion rates range from a low of 0.001-2 t/ha/yr
on relatively flat land with grass and/or forest cover to rates ranging from 1-5 t/ha/yr on
mountainous regions with normal vegetation cover. Many scientists also agree that the
rate of soil erosion, either by wind or water, frequently exceeds the rate of soil
formation. For example, over a period of 100 years at an erosion rate of 2 t/ha/yr on 10
ha, erosion deposits soil equivalent to about 1 ha of land with a soil depth of 15 cm
(Pimentel and Kounang, 1998).
Agricultural land is probably the greatest contributor to soil loss in the world. According
to the FAO (2003), about one-third of agricultural land is planted for crops, and
cropland is more highly susceptible to erosion as a result of tillage practises, which
expose the soil to wind and water erosion. Serious on-farm soil erosion reduces overall
crop productivity. This is associated with loss of organic matter and plant nutrients in

2
the erosion process, together with a reduction of soil depth. In addition, soil erosion by
water on slopes will decrease the infiltration capacity and this will result in increased
runoff and decreased water-storage. Wiebe (2003) estimated that the global crop
production loss caused by erosion is highest for potatoes at 0.6% per year, followed by
millet (0.48%), and maize (0.42%). It has also been estimated that the total anual cost of
erosion from agricultural land in the USA is about US$44 billion per year, which is
equivalent to US$247 per ha of cropland and pasture (Eswaran et al. (various years) in
Wiebe, 2003).
Off-farm impacts of soil erosion from agricultural land are varied, but serious
environmental problems on agricultural terrain commonly start when runoff
transporting soil particles reaches water bodies or streams. This will affect the
biological status of water systems, degrading water quality and threatening aquatic life,
and can cause flooding when overflow occurs because of sedimentation. The cost of the
damage associated with the off-farm impacts of soil erosion is difficult to quantify
precisely but it is generally high and of a similar magnitude to the on-site costs, and
perhaps higher.
1.2 Soil Erosion on Agricultural Land in England
Archaeological studies have suggested that soil erosion has probably taken place in
England since the clearance of land for agriculture in the Bronze Age (Bell and
Boardman, 1992). However, soil erosion has really only been recognized as a serious
environmental problem in England since the 1970s, and is often associated with
negative impacts resulting from inappropriate land management. Robinson (1999) listed
a number of studies of soil erosion in the United Kingdom that demonstrate the

3
seriousness of soil erosion on agricultural land in the region. This include Reed (1979),
Boardman (1984), and Robinson and Blackman (1990). Prior to the 1970s, most soil
erosion problems in the United Kingdom were associated with the upland areas and
were caused by overgrazing. This included upland peat moors where sheep undercut the
turf and damaged and exposed the bare surface to wind erosion, especially during dry
periods. However since then, soil erosion by water has increased in England and more
arable land is at more risk of erosion by water than by wind, especially on sandy and
sandy loam soils (Evans, 1990; 1992). Morgan (1985) noted that most of these soils
used for arable farming in the Midland and Eastern counties of England are readily
susceptable to soil erosion after sudden storms. In addition, rilling of arable land is more
widespread on sandy soils, and is also common on light loams and loamy soils with a
high silt content (Evans, 1992).
The serious impact of soil erosion in England has generally been blamed on adverse
changes associated with agricultural activities, such as mismanagement and
environmentally unfriendly attitudes among farmers and harvest contractors. According
to Unwin’s (2001) classification of agricultural land in England, it is the areas below an
altitude of 150 m and rainfall of over 1000 mm, with intensive cropping, which are most
at risk of soil erosion. Solomon (1997) reported that the total area of arable crops
considered as being at very high risk of water erosion in England is 17,990 ha with
62,170 ha of crops at high risk, and 74,590 ha of crops at locally high risk.
Twenty years ago most agricultural land was used for the growing of spring-sown
barley and winter wheat and the production of grass for cattle and sheep. However, in
the 1980s and 1990s, and in more recent years, the arable land has been autumn-drilled

4
for winter cereals, in response to the better yields. The crop cover provided by winter
cereals is low throughout the winter period and exposes the soil surface to heavy
rainfall, which can create rills and gullies within the fields and cause floods
downstream. Currently, maize growing is becoming a major environmental issue in
England, due to its association with bare soil during the late autumn of winter period,
which frequently coincides with periods of heavy rain. A more detailed discussion on
this with particular issue will be provided in the next section (1.3).
The causes of soil erosion on agriculture land are mainly related to on-farm activities,
and are the result of factors such as the failure of agricultural policy and socio-economic
pressure. Inman (2006) discussed some of the causes of soil erosion on agriculture land
in England and Wales. He suggests that one of the key on-farm activities that
encourages soil erosion is the growing crops on inappropriate land. This is closely
related to unsuitable soil types which are too fragile to resist the erosive energy of
rainfall and snow melt. Crops have also been grown on more marginal land, particularly
on steep slopes. Rills may develop during periods of heavy rainfall.
Another significant cause of soil erosion is inappropriate timing of agricultural
practises. This relates to ploughing and harvesting land during winter periods or under
wet conditions. Ploughing and harvesting using heavy machinery can cause soil
compaction and destroy soil structure. These conditions will increase surface runoff and
soil erosion that cause the depletion of soil nutrients.
Late sowing in the autumn and delayed harvesting in the late autumn of winter periods
will increase the risks of soil erosion. Both situations will leave the land with a lack of
5
ground cover to protect the soil surface from rainfall impact. Exposure of bare soil
surfaces to winter rainfall is likely to result in the development of rills and gullies, and
these will increase the rate of on-site soil erosion.
Most of the measurements of water erosion in England have recorded relatively low
rates of soil loss. For example, Walling and Quine (1991) reported a net erosion rate
from a sugar beet field at Rufford Forest Farm in Nottinghamshire of 10.5 t/ha/yr. The
average soil erosion rate from bare loamy sands of the Bridgnorth series in Shropshire
has been reported as 11.3 t/ha/yr (Fullen, 1992). Brazier (2004) listed the results of soil
erosion studies undertaken at various places in the UK, involving various soil types, and
his data indicated that average soil erosion rates range from 0.22 to 4.89 t/ha/yr.
However, studies based on 137Cs surveys reported by Walling & Quine (1995) indicated
that soil erosion rates at various places in the UK ranged from 0.6 to 10.5 t/ha/yr.
Brazier (2004) showed that based on several field survey in the UK, the erosion rates
ranged from 0.001 to 6.3 t/ha/yr in various soil types. In addition, Morgan (1985)
reported that the erosion rates in the UK from cultivated land ranged from 0.01 to 0.30
kg/m2/yr, and 1.00 to 4.50 kg/m2/yr from bare soil. These findings show that the erosion
rates in the UK are relatively low compared with other countries in the world. As an
example, the erosion rates from cultivated land and bare soil in Belgium ranged from
0.30 to 3.00 and 0.70 to 8.20 kg/m2/yr respectively, it ranged from 0.50 to 17.00 and
0.40 to 9.00 kg/m2/yr in the USA, and in China, it ranged from 15.00 to 20.00 and 28.00
to 36.00 kg/m2/yr (Morgan, 1985). All of these findings support Morgan’s (1985)
conclusions that very low annual soil erosion rates were caused by water erosion.
Relatively, the soil erosion rates is also low compared with the soil erosion rates in
Asia, Africa, and South America, averaging 30 to 40 t/ha/yr (Pimentel et al., 1995).

6
Generally, most soil erosion events have been reported in areas of arable cultivation
during the autumn and winter periods, associated with greater rainfall. This is also
associated with late sowing in autumn with harvesting in winter, which leaves bare soil
surfaces without very little or no ground cover. The impact of soil erosion, especially on
agricultural land has major implications for physical landscapes and society at large. It
also has both on-farm and off-farm impacts.
The main on-farm effect of soil erosion from agricultural land can be related to the loss
of production associated with the loss of topsoil which is rich in organic matter. Off-
farm effects include loss of biodiversity, damage to roads and footpaths, contamination
of drinking water, and nutrient over-enrichment of freshwater bodies. For example, soil
erosion on the South Downs of Southern England has occurred regularly since the early
1980s, especially during the wetter autumn and winter periods, providing average
annual rates of erosion of 0.5 to 5.0 m3/ha/yr for the decade 1982-1991 (Boardman et
al., 2003). Although the overall rates seem low, the rates for individual fields can be
very high, reaching over 200 m3/ha/yr, and the costs of damage resulting from muddy
floods has proved to be very high. For example, damage in Mile Oak and Hangleton,
Brighton in 1987 caused by muddy floods totalled more than £259,000 (Robinson and
Blackman, 1990), while the total damage cost in Rottingdean was in excess of £400,000
(Boardrman, 1995). In the bigger picture, the total annual external environmental and
health cost of the UK agriculture was estimated at £2.343 billion in 1996, comprised of
air pollution (£1,113 m), human health costs (£776 m), water pollution (£231 m),
damage to biodiversity and landscape (£126 m), and soil damage (£96 m). In specific to
water pollution regarding to drinking water, the highest damage comes from pesticides

7
(£120 m), phosphate and soil (£55 m), zoonoses (£23 m), nitrate (£16 m), monitoring
and advice on pesticides and nutrients (£11 m), and eutrophication and pollution
incidents such as fertilizers and animal wastes (£6 m) (Pretty et al., 2000).
In order to combat both on-farm and off-farm soil erosion effects, including diffuse
agricultural pollution, the Ministry of Agriculture Fisheries and Food, and the
Environment Agency are working closely together with farmers’ organizations to
reduce soil erosion and water erosion effects. Some of the initiatives to tackle this issue
are The Code of Good Agricultural Practice for the Protection of Soil, and the Provision
of Advisory Services. More spesific, DEFRA (Department for Environment, Food and
Rural Affairs) also introduced a Catchment-Sensitive Farming Programme to tackle
DWPA (Diffuse Water Pollution from Agriculture). More details on these policies as
they are associated with maize cultivation will be discussed in Chapter 9.
1.3 Maize Cultivation and Environmental Problems in England
Besides potatoes and winter wheat, one of the major crops that causes serious
environmental problems associated with both the on-farm and off-farm impact of soil
erosion is maize cultivation. Growing maize has become more common in England
since the early 1970s to produce feed for cattle, and particularly to support dairy
farming, where maize is mainly used for silage. Forage maize has become a major
alternative to grass silage for ruminant livestock in England because of its better end-
product quality, which is related to improved forage intake, and improved animal
productivity, and it can also reduce production costs ( Fitzgerald et al., 1998; Anil et al.,
2000).

8
According to the DEFRA database, land cultivated with maize in England in the 1970s
occupied an area of less than 10,000 ha. However, this increased to 108,400 ha in 2003.
A more detailed discussion of the growth of maize cultivation in England will be
presented in Chapter 4.
As discussed above, in Sections 1.1 and 1.2, it is already well known that soil erosion
associated with agricultural activity, especially crop farming, has a serious
environmental impact, and this is particularly the case for maize cultivation in England.
Maize is usually drilled during spring (April/May) and harvested in the autumn (mid-
September/mid-October), but in some cases it is also harvested in late autumn, due to
restrictions on the availability of contractors for harvesting. Once the maize has been
harvested, fields are left bare and this exposes the fields to autumn and winter rainfall.
Both factors (bare soil and heavy rainfall) increase the likelihood of water erosion by
creating rills and/or gullies on slope surfaces, and promoting surface runoff, which
flows downhill into water courses. Maize harvesting also frequently takes place under
wet conditions with heavy harvest machinery, leading to compaction of the soil and
damage to soil structure, and this increses runoff still further. Most maize growers
harvest their crops by moving the harvesting equipment up and down the slope, rather
than across it. This also increases the runoff in accordance with the steepness of the
slope.
Maize is often grown continuously on the same field, and the fields are frequently left
fallow over winter prior to cultivation and pre-drilling the following spring. It is
common for farmers to take the opportunity to spread slurry onto bare harvested maize
fields over the winter period as an organic fertilizer to support the crop during the next
9
season. However, this is likely to reduce the infiltration rates, espescially if the slurry
dries up, thereby increasing runoff, and transporting slurry and sediment to
watercourses during periods of heavy rainfall.
Clements and Lavender (2004) have reported a plot study involving measurement of
surface water runoff from fine sandy loam soils with a slope steepness 3.7o in maize
stubble fields in the Parrett Catchment area of Somerset during the winter period of
2003/04. The results, based on ten rainfall events from 10 November 2003 to 29 March
2004, show that the mean surface runoff from late harvest plots can be as high at 762
m3/h, and from bare stubble plots at 283 m3/h. However, more suspended solids were
measured from bare stubble plots with mean as high at 1975 mg/l, and at 1842 mg/l
from late harvest plots. In the case of phosphorus, it was reported that more phosphorus
was measured from late harvest plots with mean as high at 7202 µg/l, and at 5052 µg/l
from bare stubble plots. The results also show that more nitrate nitrogen was measured
from bare stubble plots compared with late harvest plots, at 1.87 mg/l and only 0.76
mg/l, respectively. The results of surface runoff show the seriousness of on-farm effects
of soil erosion from bare maize plots and late harvest plots, associated with the
mobilization of top soil and low infiltration rates, which increase the runoff on the slope
with a probable resulting increase in soil erosion rates. In addition, off-farm effects from
high surface runoff from both treatment plots can be seen from the mean value of
suspended solids and phosphorus and nitrate contents.
An investigation of soil erosion in a 6.7 ha bare maize field at Higher Walton Farm near
Crediton, undertaken by Blake (2000) using 7Be measurements indicate that the mean
erosion rates for the field was 5.3 kg/m2 with a net soil loss of 2.5 kg/m2 and the

10
sediment delivery ratio (SDR) is calculated as 0.80. The erosion rates and the net soil
loss must be seen as quite high for the local area and the SDR value indicates that a
significant proportion of the mobilized soil was delivered beyond the field towards the
local stream (Blake, 2000). By comparing the short-term results with medium-term
tracer of 137Cs, Blake (2000) reported that the mean erosion rate, a net soil loss and the
SDR value derived from 7Be are significantly higher (1.1 kg/m2/yr, 0.48 kg/m2/yr, 0.83
respectively, for 137Cs). The 7Be measurements results can be explained by the intensive
nature of rainfall during the soil sampling programme in the January 1998, which can be
considered to be quite rare. In the case of 137Cs measurements results, it can be related
to the high yield of such rarer rainfall that would be lost in the averaging effect over the
30-40 years period (Blake, 2000). Serious off-farm effects from the field resulted from
the SDR for both tracers indicate that a significant proportion of the soil was transported
out of the field as eroded sediment to nearby water courses.
The references discussed above indicate that harvested maize fields in autumn tend to
be exposed to soil erosion during winter periods under heavy rainfall when they are
characterized by compacted bare soil. The effects of on-farm erosion and the resulting
off-farm pollution clearly demonstrate the seriousness of soil loss and damage to water
courses because sediments and nutrients degrade water quality and thus aquatic
ecosystems.
1.4 Research Needs
The above discussion has demonstrate the potential seriousness of both the off-farm and
on-farm impact of soil erosion associated with maize cultivation. Apart from those
discussed above, there have been very few studies in investigating soil erosion rates

11
from bare maize fields in England. Previously, most studies of soil erosion from
cropland in England have concentrated on cereals, sugar beet, potatoes, and vegetable
crops.
Considering the serious environmental problems that can occur as a result of maize
cultivation, and especially the considerable expansion of the area under maize in
England in recent years, it is important that there should be more studies of the soil
erosion that is likely to occur as a result. Further studies are required of both gross and
net rate of soil loss as well as the magnitude of soil losses from individual fields and the
role of the sediment mobilized from bare maize fields in polluting river systems.
Documentation of soil erosion associated with maize cultivation including both on-farm
and off-farm impacts at both field and catchment scales will serve to improve
management policy and to encourage more environmentally friendly attitudes among
farmers and harvest contractors with regard to the management of soil, farming systems,
harvesting practises, and bare soil conservation on maize fields. Currently, it would be
fair to say that management policy regarding the control of soil erosion from
agricultural land, including maize cultivation for silage, is still facing problems in
reducing soil erosion impact. Guidelines for improved agricultural land management,
such as ‘The Code of Good Agricultural Practice for the Protection of Soil’, and ‘The
Catchment Sensitive Farming Programme’, may help in solving any practical problems
in tackling the impact of soil erosion from maize cultivation areas. However, many
farmers leave maize fields bare after harvesting, without any effective protection from
rainfall, and the very turbid rivers that are often observed during the winter period, are
possibly linked to sediment mobilization from bare soil in the maize fields that have

12
experienced soil erosion. Overall there is a need for a better review and understanding
of current management policy regarding soil erosion control and soil conservation, and
also of pollution prevention, and management practises associated with maize
cultivation that can reduce on-farm and off-farm impact, especially with regard to water
courses.
1.5 Research Aims
The overall aim of the research reported in this thesis is to investigate the problem of
soil erosion by water associated with maize cultivation. To achieve the research aim,
this research has been divided into three parts. The first considers the distribution of
maize growing in England and its recent expansion. The second develops an
understanding of the on-farm and off-farm impacts of maize cultivation, and the third
considers the implications of the results of the research for improving management
practices to reduce the impact of soil erosion from maize fields. The work should help
to provide better documentation of on-farm and off-farm impacts of soil erosion, and
could be used to review some of the farming management systems applied by policy
makers, farmers and harvest contractors.
1.6 Thesis Structure
The thesis is divided into 10 chapters. Chapter 1 establishes the background to soil
erosion associated with maize cultivation in England and outlines the aims of the
research undertaken. Chapter 2 explains the objectives of the research, and a description
of the research strategy. This includes a discussion of how the study area was selected
at national, regional, local and site scales. Chapter 3 describes the methodology used in
this research to investigate on-farm and off-farm impacts associated with maize
13
cultvation. The description is divided into two sections: the first concerns techniques for
soil sampling and water-sediment monitoring, including sample preparation; the second
concerns laboratory analysis involving 7Be and 137Cs measurements, and also analysis
of the chemical properties of soils and sediment.
Chapter 4 presents a review of maize cultivation in England and its expansion from
national to regional perspectives. Chapter 5 builds on Chapter 4 and provides a
discussion of maize cultivation at the local and site scales. Chapter 6 describes the soil
erosion investigation undertaken at selected study sites, and this in turn is divided into
two sections. The first section is a discussion of the information on soil erosion rates
and patterns provided by 7Be measurements which provide a short-term perspective, and
the second presents equivalent information obtained from 137Cs measurements which
provide a longer-term perspective. Chapter 7 reports the results of an investigation on
suspended sediment transported by the Rivers Culm and Tone and this includes
information on the analysis of several chemical properties of the sediment such as heavy
metal, organic carbon, and total phosphorus content. Chapter 8 discusses the
environmental impact of maize cultivation in England based on a review of the national
distribution of maize growing areas and the river networks of England, and presents an
assessment of the possibility of off-farm impact from maize cultivation areas on river
catchments, based on the project results. Chapter 9 reviews current farming
management systems and a discussion of potential improvements to the system of
combating soil erosion impacts associated with maize cultivation. The final chapter,
Chapter 10, summarizes the thesis and the results presented and provides
recommendations for future research.

14
CHAPTER 2: RESEARCH STRATEGY
2.1 Overview
This chapter describes the research strategy designed to achieve research aims outlined
in Chapter 1. Specific objectives based on the research needs are outlined in Section 2.2.
The chapter will also describe the process of choosing the study area in this project to
fulfill the research aims and individual objectives which are based on four perspectives,
at national, regional, local and site scales.
2.2 Research Objectives
As indicated in the previous chapter, the aims of the project are divided into two
aspects. The first is to provide an understanding of the off-farm impacts of maize
cultivation on a local or catchment scale, and the second is to consider the implication
of the results of the project for improving management practices in order to reduce the
impact of soil erosion associated with maize cultivation. Based on both aims, the
objectives of this project are listed below;
1. To review the background to maize cultivation in England.
2. To analyse the spatial and temporal patterns of maize cultivation.
3. To investigate rates and patterns of soil erosion from maize fields.
4. To investigate sediment transfer from maize fields to rivers.
5. To evaluate the environmental impact of maize cultivation in England.
6. To consider the potential of improved management practises in reducing the
environmental impact of maize cultivation.

15
In addition, the first and second objectives are to discuss the causes of the expansion of
maize cultivation area in the country, and to report and describe spatial and temporal
patterns of maize cultivation at national, regional and local scales. The results obtained
from these discussions will be dealt with in Chapter 4, for the national and regional
scales; and in Chapter 5 for local scales. In the case of the third objective, the
investigation of rates and patterns of soil erosion will be based on shorter and longer
terms of radionuclide tracer at a site scale. The results will be reported in Chapter 6.
Investigation of sediment transfer from maize fields to rivers will be made at a local or
catchment scale, and the result will be discussed in Chapter 7. The fifth objective of
evaluation of the environmental impact of maize cultivation will be made at local and
national scales, based on the results from Chapter 4, Chapter 5, Chapter 6 and Chapter
7; and the discussion will be made in Chapter 8. Consideration of the potential of
improved management practises in order to reduce the environmental impact of maize
cultivation will be discussed at a national scale, considering several policies associated
with agriculture in general as well as the cultivation of maize.
In accordance with the above description, the next section will focus on a discussion of
the selection of study areas at national, regional, local and site scales. Figure 2.1
summarizes the above description and the further discussion of the strategy that will be
taken in this project.
2.3 Selection of the Study Area
As mentioned above, the process of the selection of the study areas is based on four
scales, national, regional, local and site scales. As is well known, the United Kingdom
consists of four countries or political entities, namely England, Wales, Scotland and

16
Figure 2.1 : Flow chart of the project
PROJECT AIMS Off-farm impacts of
maize cultivation
Review the background to maize cultivation
NATIONAL REGIONAL LOCAL SITE
Improving management practices
PROJECT OBJECTIVES
Investigate rates & patterns of soil erosion
Investigate sediment transfer from maize field
Evaluate the environmental impact of maize cultivation
Improve management practices to reduce the impacts
STRATEGY
• Identify maize cultivation area (regional)
• Report on spatial & temporal patterns of maize cultivation area
• Identify suitable study area at regional scale based on spatial & temporal trends
• Identify maize cultivation area (county)
• Report on spatial & temporal patterns of maize cultivation area
• Identify suitable study area at local scale based on spatial & temporal trend, & rain gauge existence
• Field mapping of maize cultivation field
• Report on spatial & temporal patterns (3 years in row) of maize cultivation area
• Identify suitable study sites (6 sites) based on temporal trends & topography
• Survey & soil sample collection to investigate rates & patterns of soil erosion
• Monitor & sediment sample collection to investigate sediment transfer
Analysis of spatial and temporal patterns of maize cultivation

Northern Ireland. However, considering the time-period of the project and limitations
that could occur during the process of collecting field and secondary data, this project
has tried to minimize any uncertainty and limitations in carrying out the project from the
beginning to try and avoid future problems.
2.3.1 National scale
As indicated in Figure 2.1, achieving the aims and the objectives of the project ought
ideally to be done on a national scale in order to understand the spatial and temporal
patterns of maize cultivation in the United Kingdom. However, under the project time-
period limitation, the author has had to select only one of the countries for this project,
and England has been choosen. The reason for this is because England is the largest
country of the four, at 130,395 km2. In addition, most of the land in England is arable
and cultivated with variety of crops, which thus better suits the project aims and
objectives. A detailed description of cropland in England will be made in Chapter 4.
In order to review the background to maize cultivation in England, data on maize
cultivation for certain years are needed to show the spatial and temporal patterns of
maize growing. Data in map format has been supplied by the Library of Edinburgh
University for the years 1979, 1981, 1985, 1988, 1993, 1995, 1997, 1999 and 2000. The
data are in raster format, and all data are in size of 2 km2 per pixel, except for 1985
which is in 5 km2 per pixel size. The data have been analysed using Geographical
Information Systems (GIS) of ArcMap, version 8.3. In the case of temporal patterns, the
data were collected from the DEFRA website (Department for Environment, Food and
Rural Affairs), for the years of 1970, 1972, 1974, 1980, 1982, 1984, 1990, 2000 and
2002. These data were transferred to Excel for trend analysis.

18
The main analysis process at this scale is to identify maize cultivation area in England
for each region, for the years mentioned above. The results from this analysis were
intended for use in identifying a suitable study area at a regional scale after a study of
spatial and temporal patterns in each region.
The project will also discuss the factors that cause the expansion of maize cultivation
areas in England. In addition, it will also review and discuss management practises with
the aim of making some recommendations so as to reduce the environmental impact of
maize cultivation. This could be done by reviewing present agricultural policies,
especially those dealing directly with maize cultivation. The results will be discussed in
Chapter 9.
2.3.2 Regional scale
One of the most important considerations in selecting a suitable study area at a regional
scale is to choose an area relatively densely cultivated with maize. As a result of studies
of maize cultivation at a national scale, the Southwest region was selected as the most
suitable study area for this project. Starting from this point, a similar analysis of spatial
and temporal patterns of maize cultivation in the Southwest region was also carried out,
based on the similar data from both the Edinburgh Library and from DEFRA.
The study of the spatial and temporal patterns of maize cultivation at this scale will
cover all six counties of the Southwest region, i.e. Cornwall and the Isles of Scilly,
Devon, Dorset, Gloucestershire, Somerset, and Wiltshire. The spatial distribution of
maize cultivation in the Southwest region will be presented in map format while the
temporal patterns will be reported using figures to show the trends of maize cultivation

19
scale within the counties. The report will also be discussed in Chapter 4, together with
the results at a national scale.
2.3.3 Local scale
The studies of spatial and temporal patterns of maize cultivation in the Southwest region
have in turn been used to identify two catchments as a study area at local scale. The
reason for the choice of the two catchments as study areas in this project was based on
the reasons below:
• investigation of any differences of soil erosion rates and patterns from two different
catchment background of soil types;
• investigation of any differences of off-farm impact in the river, associated with
diffuse pollution, from different physical characteristics, such as topography,
geological aspects, soil types, the size of catchment and river network length;
• representation of the country of England associated with the environmental impact
of maize cultivation with regard to catchment size and the location of maize fields to
the river network.
In addition, the existence and availability of rain gauge stations and river flow data such
as turbidity and water discharge has also been considered in selecting suitable
catchments in this project.
Finally, after taking into consideration the reasons mentioned above, two catchments
were selected as study areas in this project: the Culm Catchment, which is in the Exe
River basin and located in Devon, and the Tone Catchment, which is one of the main
Parrett River tributaries and is located in Somerset.

20
At this scale, two main actions were taken. The first was to identify maize fields within
both catchments for the years 2002, 2003 and 2004. This involved field mapping work
to gather information from farmers and land owners using direct interviews and based
on observation during the field work. Farmers and land owners were asked to identify
maize fields that had been cultivated for those three years. More than 300 farms and
farmers were visited and interviewed to fulfill this purpose.
Secondly, it was necessary to identify the existence of rain gauge stations and the
availability of river flow data for the purpose of investigation of off-farm impact from
maize cultivation area. This involved field checking of existing river gauging stations at
down-stream points from both catchments, and the suitability and possibility of the
stations for sediment concentration and river turbidity measurements. In addition, the
availability of secondary data based on daily measurements of river flow and turbidity
from the Environment Agency (EA) were also checked to support field measurement
data. Another requirement that was considered was accessibility to the river gauging
stations for river monitoring. This included the distance of the river gauging station
from Exeter University and permission from the Environment Agency to access and set-
up river monitoring instruments. Taking account all those factors, two river gauging
stations were finally selected for this project, with one for each catchment, to act as
river monitoring points down-stream. The river gauging station selected to represent the
Culm Catchment is known as the Woodmill station, while that for the Tone catchment is
the Bishop Hull station.
The Woodmill station is run by the School of Geography, University of Exeter,
monitoring river flow and river turbidity. This is an advantage for this project because
of the accessibility of the secondary data regarding the history of river flow and river

21
turbidity history. However, in the case of the Bishop Hull station, the station is operated
by the Environment Agency alone, and in order to gain access to the premises to set-up
the monitoring instruments and for field work monitoring during the winter period of
2004/2005, permission had to be given by the management of the EA. The EA have
their own river flow and turbidity instruments at this station, which was a help for this
project because it enabled comparisons to be made for data from different monitoring
instruments.
2.3.4 Site scale
Furthermore, in investigating soil erosion rates and patterns, the project needs a suitable
number of study sites for soil sampling collections to represent the local study area.
Some considerations that have to be taken an account before deciding the number of
study sites in this project are listed below:
1. The size of maize field. This relates to the number of sampling points for each field.
If the size of the field slope is longer from the top to the bottom of the field, the number
of sampling points will be more.
2. The half-life of 7Be that needs to be measured soon after its dry and sieved. This is
associated with limited number of detectors in the School of Geography Laboratory,
which are also being used by other researchers.
3. The distance between each field, which will effect how far it might be to carry out
soil sampling within the same day, or at least on consecutive days after the first day of
sampling. This is important, in the case of 7Be to avoid any uncertainty of soil samples
regarding a second rainfall event.

22
Taking these considerations into account, the author decided to choose six bare maize
fields, three in each catchment, to be study sites. According to this decision, the next
process was to identify six suitable maize fields as study sites. The process of selecting
six suitable maize fields was carried out by referring to field mapping results on a local
scale. This process involved three important aspects. The first was to identify maize
fields grown with maize for three years in a row from 2002 to 2004. The second was the
importance of avoiding undulating or flat fields. Undulating fields would have a
tendency to spread runoff on the surface in too many directions, while flat fields could
be flooded and thus rendered unsuitable as case studies. It is also important to avoid
undulating fields because of the necessity of using a transect approach in soil sampling
programmes. The third was to select a different background of soil type for each field so
as to represent a variety of soil types within the catchments. The geographical and
physical characteristics of the six study sites will be described in Chapter 6.
In addition, soil sampling programmes for both 7Be and 137Cs have been made in the
same fields and at the same as sampling points for the purpose of comparison of soil
erosion rates at shorter and longer terms of life for both radionuclide tracers.
2.4 Summary
This chapter has described the research strategy at various scales in achieving the aims
and objectives of the project. England was chosen as a study area at the national scale,
and the Southwest region was selected to represent the England at a regional scale. For
both scales, the spatial and temporal patterns of maize cultivation is described based on
data supplied by the library of Edinburgh University and DEFRA. Furthermore, two
catchments (the Culm and Tone catchments) were selected for investigation of off-farm

23
impacts of soil erosion, and six maize fields were chosen to represent both catchments
associated with soil erosion rates at shorter and longer terms.
The next chapter will describe the methodology that has been used in this project. It will
cover aspects of field work for field mapping, the soil sampling programme and river
turbidity monitoring approaches that were applied in this project. In addition, the
methodology chapter will also describe the laboratory work associated with
radionuclide measurements and chemical property analyses.

24
CHAPTER 3: METHODOLOGY
3.1 Introduction
This chapter will describe various methods employed in the field and laboratory
components of the study, and more specifically the measurements of fallout
radionuclides and analysis of the chemical properties of soil and suspended sediment
samples. The fallout radionuclide measurements focused on 7Be, 137Cs and 210Pb fallout,
whilst the analysis of chemical characteristics included heavy metals, base cations,
phosphorus, carbon and nitrogen. The detailed procedures employed to determine the
7Be and the 137Cs content of soil and sediment samples will, however, be presented in
Chapter 6. The present chapter also describes some of the techniques employed for data
manipulation and analysis.
3.2 Field Sampling and Sample Preparation
This section will describe the soil sampling techniques that were employed in the field
to obtain samples for 7Be, 137Cs and 210Pb fallout measurements. The collection of water
samples for determination of suspended sediment concentration and recovery of
sediment for analysis will also be included in this section. In addition, the processing
and preparation of soil and suspended sediment samples prior to laboratory analysis will
also be explained in this section.
Soil sampling for 7Be and 137Cs measurements was undertaken at a number of study
sites (fields) in the Culm and Tone catchments. A transect approach was employed, and
this involved two parallel transects in each field. The same sampling points were used
for both 137Cs and 7Be. The main sampling was undertaken in maize fields, but it was

25
also necessary to collect reference samples from adjacent flat areas in pasture fields.
The soil sampling was undertaken after the maize had been harvested.
3.2.1 Soil sampling and sample preparation for 7Be measurement
Bulk soil samples for 7Be measurement were collected from the study sites within the
catchments of the River Tone and Culm in order to determine the 7Be inventory. Soil
cores were collected using a 150mm diameter plastic core tube (Plate 3.1). The tube was
driven into the soil surface to a depth of 30mm and the shallow core was carefully
removed and transferred to a strong plastic bag. The plastic bag containing the soil
sample was tied and labeled to record the sampling point. In order to make a
comparison with the inventories recorded in the study fields, bulk reference cores were
also collected in the same way from pasture sites adjacent to each study field.
All soil samples were fully dried prior to measurement of their 7Be contents. In view of
the need to dry the soil samples rapidly, because of the short half-life of 7Be, all soil
samples were freeze-dried. The soil samples were fully frozen (Plate 3.2) prior to being
placed in the vacuum chamber of the ThermoSavant ModulyoD freezed drier (Plate
3.3). After drying the soil samples were weighed and disaggregated. Disaggregation was
undertaken using a rotary sieve (Plate 3.4), which pulverized and sieved the soil
samples to < 2mm fractions. Grinding times for each sample were 10–15 minutes. Only
the sieve size of < 2mm fractions was used for 7Be measurement. The fine fraction
samples were packed into medium-sized Marinelli beakers (Plate 3.5) and weighed,
prior to assay of their 7Be contents using a high-purity germanium coaxial γ-detector
(HPGe).

26
Plate 3.1: Plastic core tube used in 7Be soil sampling
Plate 3.2: Soil samples in a freezer
Plate 3.3: Soil samples in the freezer drier

27
Plate 3.4: The rotary sieve used for disaggregating and sieving the soil samples
Plate 3.5: The fine fraction of a soil sample contained in a medium-sized Marinelli beaker
3.2.2 Soil sampling and sample preparation for 137
Cs measurement
Bulk soil cores were collected from the study sites to determine the 137Cs inventory. Soil
cores were collected using a 70mm internal diameter metal corer (Plate 3.6). The corer
was driven into the soil using a motorized percussion hammer (Plate 3.6) to various

28
depths, depending on the location of the sampling points along the slope, and the soil
depth and composition. If a sampling point was stony, the depth of soil core could be
only 30–45cm. Most of the stony sampling points were found at the top of the slopes. In
contrast, many sampling points in the middle of the slopes were 45–55cm deep, whilst
for some of the sampling points at the bottom of the slope, the soil cores could be >
55cm long. The soil cores were carefully removed and transferred to strong plastic bags,
tied and labelled to record the point. Bulk reference cores were taken in the same way
from an adjacent flat pasture site for each study field.
Plate 3.6: Metal corer and motorized percussion hammer used in 137Cs soil sampling
All soil samples were oven dried at 50oC, and after being fully dried, the samples were
ready for weighing. Dried soil samples were disaggregated using a similar approach to
that used for preparing samples for 7Be analysis, as described in section 3.2.1. However,
the sieving times for the 137Cs soil samples were longer, taking up to 20–30 minutes,
because the soil samples collected for a 137Cs analysis were considerately larger than
those collected for 7Be analysis. The fine fraction at < 2mm of the soil samples was
packed into a medium-sized Marinelli beaker, and after being weighed, the samples
were ready for 137Cs assay using the same detector as used for 7Be measurements.
Metal corer
Motorized percussion hammer

29
3.2.3 Soil sampling and sample preparation for 210
Pb and chemical analysis
In order to analyse the excess 210Pb activity and the chemical properties of surface soil
from maize fields, additional soil sampling was undertaken in 24 maize fields within the
Culm and Tone catchments. Those 24 maize fields included 12 maize fields in the Culm
Catchment and another 12 maize fields in the Tone Catchment. The maize fields were
chosen randomly within these catchments, but it was a requirement that the field had to
be free from any farming activity during the soil sampling time.
The soil samples were collected using a small scoop from the soil surface adjacent to
the slope rills which provided evidence that the slope surface had been eroded during
preceding heavy rain. The sampling points were located randomly in each field. The
mass of the soil samples collected from each of the fields typically amounted to 500–
600g. All soil samples were transported and stored in strong plastic bags, tied and
clearly labeled.
The soil samples were oven dried at 50oC before being weighed. Subsequently, the
samples were disaggregated gently using a pestle and mortar (Plate 3.7), and dry sieved
to recover the 20µm fraction using a 20µm sieve. The sieved soil samples were packed
into strong plastic bags, in readiness for 210Pb activity measurement and chemical
analysis.
Plate 3.7: Soil samples for chemical analysis were disaggregated using a pestle and mortar

30
3.2.4 River water sampling and sample preparation for suspended sediment
analysis
River water sampling for recovery of suspended sediment and measurement of
suspended sediment concentrations was undertaken at two hydrological monitoring
stations, located at the outlet of the Culm and Tone catchments. The Woodmill station,
located closed to Cullompton, was at the outlet of the Culm Catchment outlet, while the
Bishop’s Hull station, located closed to Taunton, was located at the Tone Catchment
outlet.
River water sampling was undertaken during peak river flows after heavy rain had
occurred. For the purpose of recovering suspended sediment, sampling involved use of a
submersible pump powered by a portable generator, to pump river water through a
30mm reinforced plastic hose into five 20l polyethylene cans. However, for the purpose
of determining suspended sediment concentrations, the river water sample was collected
in 500ml bottles using the same apparatus.
The 100l bulk river water samples collected at the both outlets of both catchments were
taken back to the laboratory, and left for four days to allow the suspended sediment in
the water samples to settle to the bottom of the can. After the suspended sediment had
completely settled, the overlying clear water was syphoneed out using a small hose,
leaving the suspended sediment at the bottom of the can along with a small volume of
water. This residual sample of suspended sediment contained in a small volume of water
was transferred to a centrifuge bottle, ready for recovery using a Multifuge 4 KR
Heraeus centrifuge (Plate 3.8). The centrifuging process took about one hour, and after
this process had been completed, the suspended sediment was transferred using distilled

31
water and a spatula into a plastic pot. The sediment contained in these plastic pots was
then freeze dried, and stored in plastic bags, prior to chemical analysis.
Plate 3.8: The Heraeus Multifuge 4 KR Centrifuge
3.3 Laboratory Analysis
This section will cover two areas. The first describing the measurement of 7Be, 137Cs
and 210Pb activity, and the second the techniques used for analyses of the chemical
properties of soil and suspended sediment samples.
3.3.1 Radionuclide measurement
In this study, a high resolution of low-level gamma spectrometer incorporating a high-
purity germanium (HPGe) detector (Plate 3.9) was used to determine gamma-emitted
radioactivity in soil and sediment samples. More specifically, the detector type used in
this study is a hyperpure germanium coaxial γ-detector (EG&G ORTEC HPGe) with
associated lead-shielding and liquid nitrogen cooling, linked to a multi-channel
analyser. A detailed explanation of gamma spectrometry measurements is provided by
Wallbrink et al. (2002).

32
Plate 3.9: A hyperpure germanium coaxial γ-detector
The detector, which contains a germanium crystal, generates free electrons in response
to absorbing energy from ionizing radioactivity, and the magnitude of the charge in the
crystal is directly related to the energy of the incident gamma ray (Wallbrink et al.,
2002). In this case, the sample in the detector releases γ-ray emissions and some of them
will be absorbed. At this stage, the γ-ray emissions lose part or all of their energy by
producing electron pulses. These electron pulses are amplified by the pre-amplifier as
voltage pulses and sent to the multichannel analyser. The pulses are sorted by height
and output from the different channels into the counting system, where the counts are
processed and displayed (Blake, 2000).
The counting system is based on the full energy peak (FEP), where the area under the
FEP is known as the net count rate, which can be used to calculate the radionuclide
activity in the sample. In order to calculate the radionuclide activity in the sample from
the net count rate value, it is important to know the detector efficiency. The efficiency
of the detector is a function of the energy of the γ-rays, the characteristics of the crystal,
the geometry of the sample and the self absorption of γ-rays by the sample itself (Blake,
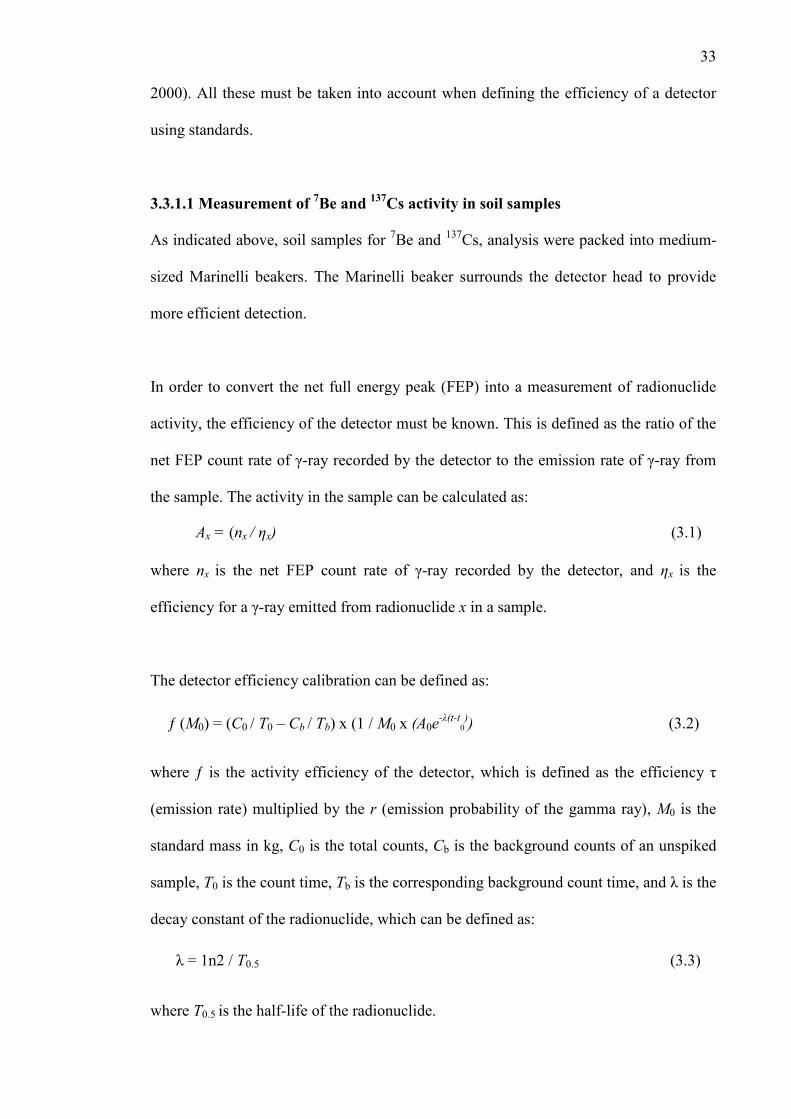
33
2000). All these must be taken into account when defining the efficiency of a detector
using standards.
3.3.1.1 Measurement of 7Be and
137Cs activity in soil samples
As indicated above, soil samples for 7Be and 137Cs, analysis were packed into medium-
sized Marinelli beakers. The Marinelli beaker surrounds the detector head to provide
more efficient detection.
In order to convert the net full energy peak (FEP) into a measurement of radionuclide
activity, the efficiency of the detector must be known. This is defined as the ratio of the
net FEP count rate of γ-ray recorded by the detector to the emission rate of γ-ray from
the sample. The activity in the sample can be calculated as:
where nx is the net FEP count rate of γ-ray recorded by the detector, and ηx is the
efficiency for a γ-ray emitted from radionuclide x in a sample.
The detector efficiency calibration can be defined as:
where ƒ is the activity efficiency of the detector, which is defined as the efficiency τ
(emission rate) multiplied by the r (emission probability of the gamma ray), M0 is the
standard mass in kg, C0 is the total counts, Cb is the background counts of an unspiked
sample, T0 is the count time, Tb is the corresponding background count time, and λ is the
decay constant of the radionuclide, which can be defined as:
where T0.5 is the half-life of the radionuclide.
ƒ (M0) = (C0 / T0 – Cb / Tb) x (1 / M0 x (A0e
-λ(t-t0)) (3.2)
λ = 1n2 / T0.5 (3.3)
Ax = (nx / ηx) (3.1)
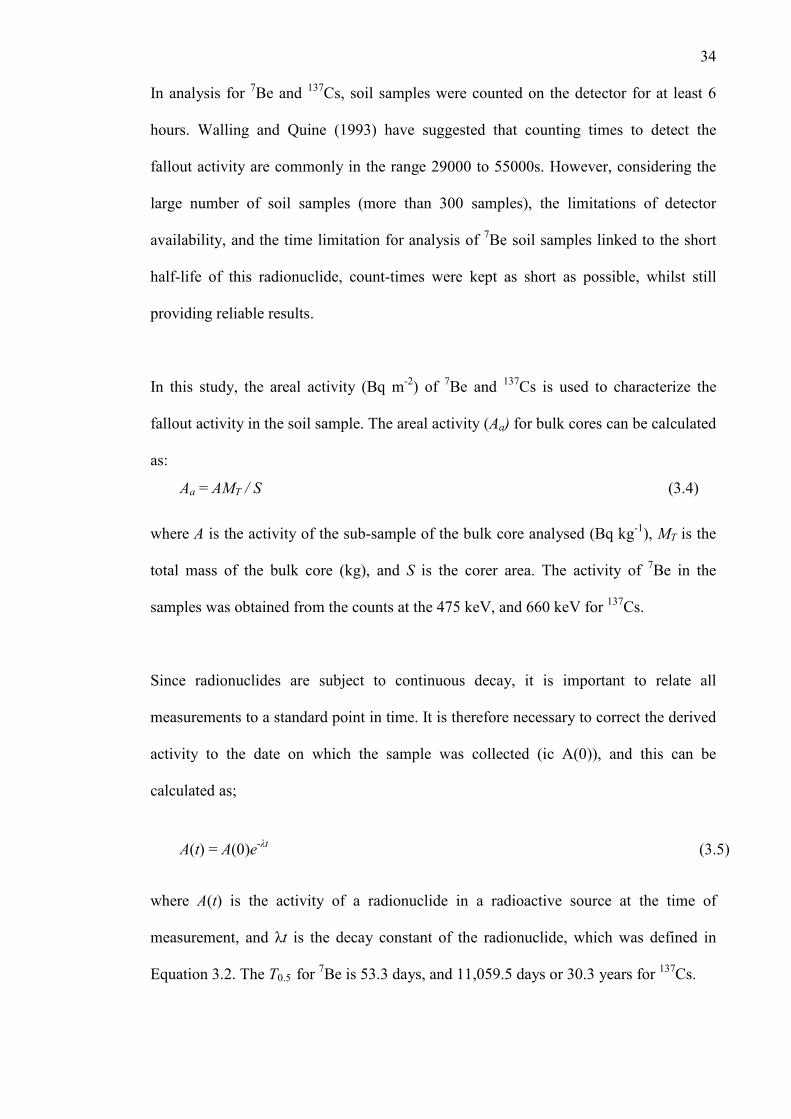
34
In analysis for 7Be and 137Cs, soil samples were counted on the detector for at least 6
hours. Walling and Quine (1993) have suggested that counting times to detect the
fallout activity are commonly in the range 29000 to 55000s. However, considering the
large number of soil samples (more than 300 samples), the limitations of detector
availability, and the time limitation for analysis of 7Be soil samples linked to the short
half-life of this radionuclide, count-times were kept as short as possible, whilst still
providing reliable results.
In this study, the areal activity (Bq m-2) of 7Be and 137Cs is used to characterize the
fallout activity in the soil sample. The areal activity (Aa) for bulk cores can be calculated
as:
where A is the activity of the sub-sample of the bulk core analysed (Bq kg-1), MT is the
total mass of the bulk core (kg), and S is the corer area. The activity of 7Be in the
samples was obtained from the counts at the 475 keV, and 660 keV for 137Cs.
Since radionuclides are subject to continuous decay, it is important to relate all
measurements to a standard point in time. It is therefore necessary to correct the derived
activity to the date on which the sample was collected (ic A(0)), and this can be
calculated as;
where A(t) is the activity of a radionuclide in a radioactive source at the time of
measurement, and λt is the decay constant of the radionuclide, which was defined in
Equation 3.2. The T0.5 for 7Be is 53.3 days, and 11,059.5 days or 30.3 years for 137Cs.
Aa = AMT / S (3.4)
A(t) = A(0)e-λt (3.5)

35
The results from the 7Be and 137Cs fallout activity measurement, which are expressed in
Bq m-2 will be used in this study to estimate soil erosion rates for each study site.
Detailed explanation of the use of 137Cs and 7Be to estimate soil erosion will be
provided in Chapter 6.
3.3.1.2 Measurement of excess 210
Pb in soil and suspended sediment samples
The < 20µm fraction of the soil and suspended sediment samples for excess 210Pb was
packed into a plastic pot. The pot was sealed and left for 21 days before measurement to
allow 226Ra to come to equilibrium with 214Pb.
The detector efficiency calibration for excess 210Pb measurement, based on the mass in
the pot and pot height, can be calculated as:
where η(h) is the γ-ray count rate recorded by the detector, and A0(h) and ד are the
known activity of the pot with mass and height and the abundance of γ-ray, respectively.
The pot inner diameter is 7cm and the height is 8cm.
The plastic pot containing the sample was placed on top of the detector head and
counted for over 50,000s. This provided a precision of ca. ± 10% at the 90% level of
confidence for the γ-ray spectrometry measurements. The activity of 137Cs in the
samples was obtained from the counts at the 660 keV peak. The total activity of the
sample was measured at 46.5 keV for 210Pb, and 350 keV for 226Ra. The excess of
unsupported 210Pb concentrations of the sample was calculated by subtracting the 226Ra-
supported 210Pb concentrations from the total 210Pb concentrations. The 226Ra is
measured via the short-lived daughter 214Pb.
η (h) = [n(h) / A0(h)(3.6) ד

36
The activity calculation for 210Pb can be represented as:
where APb-210ex is the unsupported
210Pb activity (mBq g-1), APb-210 is the total 210Pb
activity (mBq g-1), and APb-214 is the 214Pb activity (mBq g-1).
However, since 214Pb is a daughter of 222Rn, which is an inert gas, the use of 214Pb
activity to estimate the 226Ra-suppprted 210Pb activity can result in over-estimation of its
value due to escape of a proportion of the 222Rn from the soil sample. This effect can be
corrected using a proportion factor α:
and α can be calculated as:
where APb-210.deep is the total
210Pb activity for a sample from below the penetration depth
of fallout 210Pb (mBq g-1), and APb-214.deep is the 214Pb activity for a sample from below
the penetration depth of atmospheric 210Pb (mBq g-1). In this case, the value of α is
normally in the range 0.80–1.0.
3.3.2 Total organic carbon (C) and nitrogen (N) analysis
The concentration of carbon and nitrogen in the soil and suspended sediment samples
were determined by pyrolysis using a CE Instruments NA 2500 elemental analyzer
(Plate 3.10). The samples were packed into small tin capsules, and were sealed by
pressing the tin capsules with samples into pellets.
APb-210ex = APb-210 – APb-214 (3.7)
APb-210ex = APb-210 – αAPb-214 (3.8)
α = (APb-210.deep) / (APb-214.deep) (3.9)

37
Plate 3.10: The CE Instruments NA 2500 elemental analyzer used for C and N analyses
Blake (2000) explained the process occurring within the tin capsule samples and the
elemental analyzer reaction in detail. The elemental analyzer is set up at 1000oC, which
allows the sample and tin capsule to melt. At this stage, the exothermic reaction with the
capsule produces a dynamic flash combustion at 1800oC, and the resulting gas is then
transported by a constant flow of helium and oxygen through chromium oxide oxidation
catalysts where oxidation is completed (Blake, 2000). The combustion products are then
transported in another reactor at 780oC and converted into elemental carbon and
nitrogen. The measurement of carbon and nitrogen is made when the sample is eluted
through a gas chromatographic column where it passes across a thermal conductivity
detector (Blake, 2000).
Quantifying the carbon and nitrogen content of the soil and suspended sediment samples
is carried out by determining the carbon and nitrogen calibration curves. This can be
done using an ethylene diamine-tetra acid (ETDA) as a standard. This standard sample
is also processed in the same way as the soil and suspended sediment samples. The
results from the measurements will be reported in Chapter 7.

38
3.3.3 Heavy metal analysis
The heavy metal content of soil and suspended sediment samples were determined using
Atomic Absorption Spectrophotometry (AAS) (Plate 3.11). The technique used in this
study was documented by Allen (1989), and involves the extraction of the heavy metals
from the direct digestion using nitric and hydrochloric acid. According to Alloway and
Ayres (1997), the term heavy metal is applied to the group of metals and metalloids with
an atomic density greater than 6 g/cm3.
In this study, heavy metal elements associated with agricultural sources were selected
for analysis. This involved three sources of heavy metals which are heavy metals from
impurities in fertilizers, from pesticides, and from composts and manures. The heavy
metal elements associated with these three sources are As, Cd, Cn, Cr, Cu, Hg, Mn, Mo,
Ni, Pb, U, V, and Zn.
Plate 3.11: The Atomic Absorption Spectrophotometer used for heavy metal analysis

39
3.3.4 Base cations analysis
A method proposed by Qui and Zhu (1993) was used to extract base cations from soil
and sediment samples for subsequent analysis by AAS. The base cations used in this
study were Ca and Na, and ammonium acetate was used as a reagent to extract the base
cations.
3.3.5 Total phosphorus analysis
The total phosphorus was extracted from soil and suspended sediment samples using the
method proposed by Olsen and Dean (1965). The digestion process uses perchloric acid,
sulphuric acid, ascorbic acid, ammonium molybdate and potassium antimony tartrate as
reagents.
3.4 Data Manipulation and Analysis
One of the primary study objectives is to review the spatial and temporal background of
maize cultivation at national, regional and local scales. This requires the manipulation
and analysis of data from many different sources. In this study, data were supplied by
the Department for Environment, Food and Rural Affairs (DEFRA), the Edinburgh
Library (EL), and the Centre for Ecology and Hydrology (CEH). To complement these
secondary data, field mapping and data verification have also been undertaken. Each
data source has a different background and this section will focus on an explanation of
the data sources.
To process and support these primary and secondary data, the system known as GIS
(Geographical Information Systems) was used as a tool. The GIS software of ArcGIS
v8.3, which consists of ArcCatalog and ArcMap, were used in data manipulation and
analysis.
40
3.4.1 DEFRA data
In this study, the data used from DEFRA sources relates to the annual census conducted
by DEFRA, and the results are released every year in June through the Agricultural and
Horticultural Census. The released result is based on census form returns each year by
registered farmers. Each farmer is obliged to give information about the size of each
field occupied by every type of agricultural activity. The accuracy of such information
is of course highly dependent on the reliability and availability of the farmers’
information returns. DEFRA also produces an agricultural map for Agricultural Land
Classification (ALC) at a 1:250,000 scale. However, such a scale is not really suitable
for the purpose of this research, as more detailed information is needed. The census data
available to use in this research are from the following years: 1950, 1954, 1955, 1960 to
1965, 1970 to 1975, 1980 to 1985, 1990, 1995 and 2000 to 2003.
3.4.2 Edinburgh Library data
The Edinburgh Library has data in digital map format for various years and in different
resolutions. The information in the digital maps is derived from agricultural census data
summarized by MAFF (Ministry of Agriculture, Fisheries and Food) and SOAEFD
(The Scottish Office Agriculture, Environment and Fisheries Department) and is related
to groups of farm holdings. The process of data transformation is based on parish data in
a square grid of 1km2. The Parish Framework is used in conjunction with a 7-fold
classification of land use with the same 1 km2 grid as in the Land Use Framework. The
digital maps used in this research represent the following years: 1979, 1981, 1985,
1988, 1993, 1995, 1997, 1999 and 2000. These maps are based on a 2 km2 grids, except
for that of 1985, which is based on a 5 km2 grid.

41
3.4.3 CEH data
The CEH dataset used in this study is the Land Cover Map (LCM) of 2000. The
LCM2000 is a thematic classification map based on spectral data recorded by satellite
images. The dataset is based on a raster format derived from a vector database and
stored as pixels in a 1km grid. It can be divided into two major classes, namely Target
Classes as the top hierarchy, and Subclasses. The Target Classes or Level 1 was
considered the nearest match which could be achieved consistently and with a high level
of accuracy. It was divided into 16 groups, such as arable and horticultural, suburban
and urban, and littoral rock and sediment.
The Subclasses are divided at two levels, known as Level 2 and Level 3. Level 2 is the
standard level of detail which provides 26 subclasses such as arable cereals, arable
horticulture and non-rotational horticulture. Level 3 known as Variants, provides details
down to 72 categories. In this research, the Variants level was used to identify the area
of maize.
Since it was based on interpretation of satellite imagery, an attempt was made to
validate the CEH data. Eighteen fields in the Culm Catchment and 24 fields in the Tone
Catchment shown as being used for maize in the CEH database were selected and their
land use in 2000 was checked by interviewing the relevant farm owner. The result
showed that 22 of the 24 maize fields in the Tone Catchment were used for maize in
2000. However, the other two fields identified by CEH data as a maize field in 2000
were not used for maize, both fields being covered with rough grassland mixed with
coppice and scrub. The validation process in the Culm Catchment shows that 100
percent of the selected maize fields were used for growing maize in 2000. For both
areas combined, the validation applied showed that 95.2 percent of maize fields

42
identified by CEH were used for growing maize in 2000. This result confirms the
reliability of the CEH data, which has therefore been used in this study.
3.4.4 Field mapping data
The secondary data supplied by DEFRA, EL and CEH do not provide spatial
information after 2000. From a local perspective, it was very important to show the
current spatial distribution of the maize-growing area within the Culm and the Tone
catchments for soil sampling purposes. In order to support the secondary data, field
mapping was undertaken to identify all maize fields within the study catchments for the
years 2002, 2003 and 2004. The field mapping carried out was based on interviews with
farm owners within the catchments. Each farm owner was asked to identify their maize
fields in those years, and topography maps were used as basic maps.
3.5 Summary
This chapter has explained various methods employed in this study to achieve the study
objectives. The methods have involved both fieldwork, which involved soil and
suspended sediment sampling, and also laboratory work which included sample
processing and preparation and analysis of the radionuclide and chemical contents of
soil and suspended sediment samples. In addition, data manipulation and analysis, based
on field-mapping work and secondary data from DEFRA and CEH have also been
described. The results of the sampling and analysis programmes will be presented and
discussed in Chapters 6 and 7. Results from the data manipulation and analysis
employed GIS will be presented and reported in Chapters 4 and 5.

43
CHAPTER 4: MAIZE CULTIVATION IN ENGLAND AND THE SOUTHWEST
REGION
4.1 Introduction
Most of the land in England is under agriculture. In 1950, about 10.33 million ha of
England were under arable land, grassland and rough grazing, but the area decreased to
8.15 million ha by 2003. This represented 44.3% of the agricultural land in the United
Kingdom in 2003. Arable land occupied about 50.4% of the agricultural land in England
in 1950, with permanent grassland accounting for 35.4%, and rough grazing land for
4.2%. However, by 2003, the proportion associated with arable land had decreased to
47.1%, with grassland accounting for 44.9%, and rough grazing for 8.0%.
Crops still constitute the largest area of agricultural land in England, and in 2003, the
area of arable land extended to 3.81 million ha. Most cropland is used for the growing
of cereals (66.7%) such as wheat, barley and oats. Other crops (those not used for
feeding of stock) accounted for 18.8% of cropland, and included crops such as sugar
beat, potatoes and rape. Fodder or compounding crops and horticultural crops occupied
a smaller area and together accounting for 14.5% of the cropland in England.
One crop that has expanded rapidly in England in recent years is maize. In 1990, the
area under maize cultivation was 33,265 ha, but by 2004, the area under maize had
increased to 107,494 ha. In England, maize is grown as a fodder crop. A detailed review
of the increase and spatial distribution of maize cultivation in both England and the
Southwest Region will be presented in section 4.4.

44
4.2 Maize Cultivation: An Overview
Maize (Zea mays L.) is the world’s third most important crops after rice and wheat.
According to FAO data, the world total maize production in 2005 was 692 million
metric tonnes, and the three top maize producers are the United States (280 million
metric tonnes), China (131 million metric tonnes) and Brazil (35 million metric tonnes).
However, this information relates to the production of grain maize, and information on
maize cultivation for animal feeding is not available from the FAO database. According
to the data produced by Maisadour Semences, the area of maize cultivation for silage
production totalled 3,857,000 ha in 1999, and this accounted for 61.3% of the
cultivation of silage maize in Europe. Table 4.1 provides a ranked list of countries in
Europe with respect to the area devoted to silage maize in 1999, with the equivalent
figures for grain maize cultivation given for comparison. From Table 4.1, it is clear that
growing maize for animal feeding or silage maize is more important in northern
countries, whilst cultivation of maize for grain is of greater importance in the countries
of southern Europe.
The most important countries for silage maize cultivation in Europe in 1999 were
France, Romania and Germany, with these three countries accounts for 64.3% of the
silage maize production in Europe. The United Kingdom, occupies position 11, and
accounted for 2.7% of the area of silage maize cultivation in Europe in 1999. However,
in terms of the proportion of arable land occupied by silage maize, Romania tops the
ranking, with silage maize occupy 2.136% of its arable land in 1999, and Ireland is at
the bottom of the ranking with silage maize occupy only 0.012% of its arable land.
Silage maize cultivation in the United Kingdom accounts for 0.099% of its arable land,
and placing it at rank 17 within the countries of Europe. In the case of the United
Kingdom, more than 90.0 % of the area under maize cultivation is found in England.
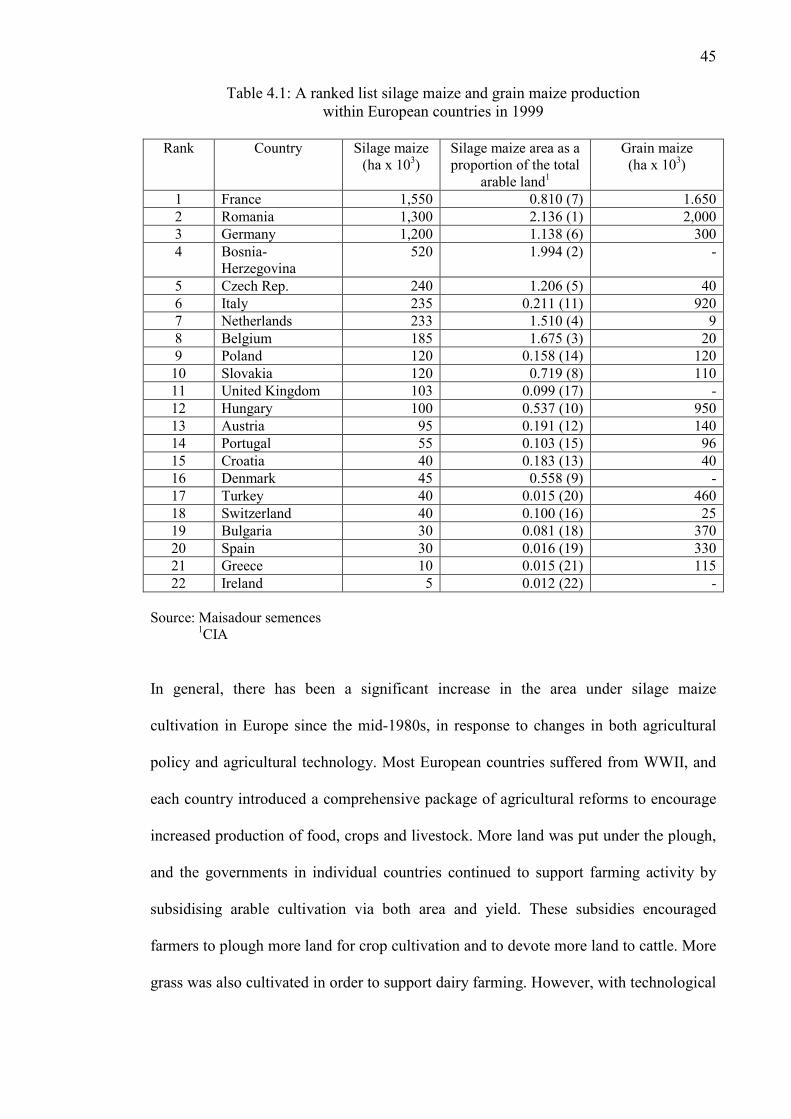
45
Table 4.1: A ranked list silage maize and grain maize production within European countries in 1999
Rank Country Silage maize
(ha x 103) Silage maize area as a proportion of the total
arable land1
Grain maize (ha x 103)
1 France 1,550 0.810 (7) 1.650 2 Romania 1,300 2.136 (1) 2,000 3 Germany 1,200 1.138 (6) 300 4 Bosnia-
Herzegovina 520 1.994 (2) -
5 Czech Rep. 240 1.206 (5) 40 6 Italy 235 0.211 (11) 920 7 Netherlands 233 1.510 (4) 9 8 Belgium 185 1.675 (3) 20 9 Poland 120 0.158 (14) 120 10 Slovakia 120 0.719 (8) 110 11 United Kingdom 103 0.099 (17) - 12 Hungary 100 0.537 (10) 950 13 Austria 95 0.191 (12) 140 14 Portugal 55 0.103 (15) 96 15 Croatia 40 0.183 (13) 40 16 Denmark 45 0.558 (9) - 17 Turkey 40 0.015 (20) 460 18 Switzerland 40 0.100 (16) 25 19 Bulgaria 30 0.081 (18) 370 20 Spain 30 0.016 (19) 330 21 Greece 10 0.015 (21) 115 22 Ireland 5 0.012 (22) -
Source: Maisadour semences 1CIA
In general, there has been a significant increase in the area under silage maize
cultivation in Europe since the mid-1980s, in response to changes in both agricultural
policy and agricultural technology. Most European countries suffered from WWII, and
each country introduced a comprehensive package of agricultural reforms to encourage
increased production of food, crops and livestock. More land was put under the plough,
and the governments in individual countries continued to support farming activity by
subsidising arable cultivation via both area and yield. These subsidies encouraged
farmers to plough more land for crop cultivation and to devote more land to cattle. More
grass was also cultivated in order to support dairy farming. However, with technological

46
changes in farming, especially in animal feeding, silage maize cultivation became
increasing popular in European countries to support dairy farming. This occurred in
parallel with a change in animal feeding rations from hay or grass silage (considered
less valuable fodder in terms of nutrition), to maize silage, which is rich in nutrients. In
addition, and especially in the 1990s, the Common Agricultural Policy (CAP) provided
a major impetus to the growing of silage maize through subsidies and other additional
benefits associated with dairy farming.
In the case of the United Kingdom, and also England, agricultural policy still plays an
important role in defining farming activities. The CAP offers market price support and
aid or income support in many ways to support farming activities. In this situation,
farmers are highly dependent on income support. This support offers farmers direct
income for their arable crops in the form of area payments under the Arable Area
Payments Scheme (AAPS). Brassley (2000) stated that, by the mid-1990s, maize
qualified for AAPS of up to £320 per hectare. However, in 2001, payment rates
declined to £225.64 per hectare but increased to £238.94 per hectare in 2002 and 2003.
In 2005, all arable land in England was put under a new scheme called the Single
Payment Scheme (SPS), following the CAP reform in 2003. Instead of subsidising
arable land based on production as in AAPS, the SPS makes payments based on the
‘environmentally friendly’ concept. Broadly, the SPS divided land into three classes;
moorland with uplands, regarded as Severely Disadvantage Areas (SDA), land in the
upland SDA but outside the moorland line, and all land outside the upland SDA. The
calculation of the arable area payment rates in these three zones is based on three
factors, namely, the historic area, a flat rate, and a combination of the two.

47
In general, farmers have more freedom to farm to the demands of the market, as
subsidies are being decoupled from production. On top of this, environmental friendly
farming practices under the standard of Good Agricultural and Environmental
Conditions (GAEC) are becoming better acknowledged and rewarded. This will
probably have some influence on farmers in making decisions as to whether to grow
maize in future. When considering whether farming practises qualify as
‘environmentally friendly’, soil erosion occurring during the winter after harvesting will
need to be taken into account.
As indicated above, maize cultivation in the United Kingdom is undertaken to support
dairy farming, and the growing of maize commenced in the 1950s, as forage for cattle.
Before that, hay and silage were two main sources of dairy fodder in the UK. Among
the factors that make silage maize cultivation important and occupy large area of
cropland in the UK, is the importance of dairy farming itself. The major animal fodder
in the UK is grass, beans, peas and maize. Maize silage is used to feed dairy cows
during the winter prior to their returning from the fields during the summer. As reported
later in this chapter, the area of maize cultivation expanded very strongly in the 1990s.
Since the war, the pattern and productivity of the UK dairy farming has changed
substantially, with better feeding systems, improved genetics and more skilful
management of farms (Brigstocke, 2004). Under these conditions, more farmers became
involved in dairy farming in England. According to DEFRA data, the number of dairy
holders in 1990 totalled 28,756 farms in England and involved more than 1.997 million
dairy cows. In 2000 and 2003, the number of dairy holders had decreased to 20,094 and
16,027 farms with the number of cows at 1.575 million and 1.434 million, respectively,
for each of these years. Although the number of dairy holders and the number of cows
had declined, maize still retains its importance as a fodder crop in England. To some

48
extent, new technologies in making silage suggest that a combination of maize silage
with high quality grass silage is a good alternative for winter rations in dairy farming.
This situation will probably remain, with farmers continuing to grow maize in the
future.
In addition, maize silage has also been shown to provide a better diet in dairy farming
and to produce better quality milk. Maize silage at 30-32 percent of dry matter (DM)
has been proved to be high in starch and fibre and ferments more slowly in the rumen.
For example, milk yield is higher for maize silage (30% DM) at 33.0 kg/day compared
with grass silage at only 28.0 kg/day (Advanta).
In general, growing maize for forage needs dry conditions to produce good quality
silage. The weather in the UK offers almost ideal conditions for growing fodder maize,
especially in England and Wales. Maize cultivation in England usually commences in
April, starting with sowing the crop, and ending with harvesting in mid-September or
early October. Maize grows well in areas with an annual rainfall below 760 mm and
with good soil conditions. In areas with an annual rainfall greater than 760 mm, maize
can still be grown (Huntseeds). However, in such cases, farmers are advised to use only
early varieties to avoid the need to harvest in late autumn. With warm temperatures and
sufficient solar radiation in summer in England, and especially in the Southwest region,
maize can be grown in ideal conditions to produce viable yields (ECN).

49
Other factors motivating farmers to change from grass silage to maize are the overall
costs of growing maize, which are relatively cheaper than grass silage. Although maize
seed is relatively expensive (around £40 to £50 per acre or 0.4046 ha), compared to
grass seed (£6 per 0.4046 ha), the overall costs are cheaper for maize. For example, the
establishment and growing costs1 for grass silage is cheaper than for maize at £76 and
£90 per 0.4046 ha, respectively. However, the total fixed costs per 0.4046 ha2 and the
total fixed costs per tonne are relatively cheaper for maize at £6.60 against £7.90 for
grass silage. A more detailed calculation involving yield of fresh matter, yield of dry
matter, dry matter content and metabolizable energy for maize gives a cost of £196 per
0.4046 ha, compared to grass silage, which is more expensive at £202.50 per 0.4046 ha
(Huntseeds).
Although silage maize cultivation is considered as an important crop in Europe and
England, it also produces problems for the environment. This already been discussed in
Chapter 1. In general, the environmental problems associated with maize cultivation can
be related to soil erosion and diffuse water pollution from the area of maize cultivation.
Soil erosion problems in maize fields can frequently be related to harvesting in late
autumn, which leaves surfaces bare and unprotected from rainfall impact in winter. This
could promote surface runoff and sediment mobilization and the transport of sediment
to nearby watercourses, which can pollute the water with both nutrients and pesticides.
The off-site impact associated with maize cultivation will be discussed in Chapter 7.
This chapter will focus on temporal and spatial patterns of maize cultivation in England
1 Establishment costs involved the cost of seed, agrochemicals and fertilizer before seeding, while the growing costs include fertilizer and agrochemical costs during the growing period. 2 The total fixed costs per 0.4046 ha include the costs of cultivation, drilling, spraying, fertilizer or slurry spreading, and ensiling costs.

50
and the Southwest Region, and the factors that have influenced changes in these
patterns.
4.3 The Data Used in this Analysis
This investigation of spatial and temporal patterns of maize cultivation in England and
the Southwest region is based on data from two sources. The sources comprise, firstly,
the Department for Environment, Food and Rural Affairs (DEFRA), and secondly, the
Edinburgh Library (EL). Each source has a different background which was explained
in the previous chapter.
The DEFRA data are based on the annual census through the Agricultural and
Horticultural Census, which are released annually in June. These data are based on
farmers’ information returns, field-by-field, and the results are presented in acreage
format. In the case of the EL data, the data are in digital map format, based on a spatial
resolution of a 1 km2 grid. It was necessary to manipulate the scale of the data from
unsupervised format to a supervised format of five categories, based on the density of
maize cultivation area in ha km-2. The five categories are (i) less than 2 ha km-2, (ii) 3-6
ha km-2, (iii) 7-12 ha km-2, (iv) 13-20 ha km-2, and (v) more than 20 ha km-2. The (i) and
(ii) values are considered as a low density, (iii) as a moderate density, and (iv) and (v)
as a high density. Although the manipulation of the EL data was applied to all available
data, as mentioned in the previous chapter, for the purpose of this chapter, only relevant
data will be used in order to review the spatial and temporal patterns of maize
cultivation in England. This involves the data available for four years, namely, 1979,
1988, 1995 and 2000.

51
4.4 Maize Cultivation in England
As indicated in the introduction to this chapter, crops still constitute the largest area of
agricultural land in England with most of cropland having used for the growing of
cereals. Cereals have becomes the most important crops in England since 1950, and the
area has probably never fallen below 2.4 million ha. The second most important crop in
England is stock crops (not for stock feeding) such as potato and sugar beat. This crop
increased in area by 25.9% between 1950 and 2003, increasing from 570,200 ha in 1950
to 717,700 ha in 2003. Fodder crops3 occupied the third place for cropland in England.
The area under fodder crops in 1950 extended 386,000 ha but this had decreased by
5.3% to 365,500 ha in 2003. Beans and peas have becomes important fodder crops in
England and accounted for 62.9% or 229,900 ha of the fodder crop area in 2003. They
are followed by maize in third place and the area cultivated for maize has expanded
rapidly since the 1970s.
According to DEFRA data, maize has been grown as a fodder crops in England since
1970, but the area was small in the early years. Figure 4.1 shows the temporal trend in
the area devoted to maize in England in the period from 1970 to 2004. In the early
1970s, the area of maize cultivation in England was relatively small, occupying an area
of less than 10,000 ha, and representing less than 5.0% of the total area under fodder
crops. The area of maize cultivation expanded to 20,800 ha in 1980, and increased by a
further 60.1% to 33,300 ha in 1990. However, since 1990, the area expanded to 100,000
ha in 1995 and to 107,494 ha in 2004, an increased of 7.5%. The greatest area cultivated
for maize in England was reported in 2001, when the crop occupied an area of 119,557
3 This includes turnips, swedes, fodder beet, mangolds, kale, cabbage, savoy, kohl rabi, beans, peas and maize.

52
ha. Table 4.2 presents more detailed data for the trend in the maize cultivation area in
England between 1970 and 2004.
1970
1972
1974
1980
1982
1984
1990
2000
2002
2004
0
20
40
60
80
100
120
Ha ('000)
Years
Figure 4.1: Trends in maize cultivation in England between 1970 and 2004
Table 4.2: Changes in the maize cultivation area in England between 1970 and 2004
Year Area (ha x 103)
Change (%)
Year Area (ha x 103)
Change (%)
1970 1.0 - 1984 14.7 1983-1984 (+2.1)
1971 2.0 1970-1971 (+100.0)
1985 19.0 1984-1985 (+16.2)
1972 3.5 1971-1972 (+75.0)
1990 33.3 1985-1990 (+75.3)
1973 6.6 1972-1973 (+88.6)
1995 100.4 1990-1995 (+67.0)
1974 15.7 1973-1974 (+137.9)
2000 97.6 1995-2000 (-2.8)
1975 25.5 1974-1975 (+62.4)
2001 119.5 2000-2001 (+22.4)
1980 20.8 1975-1980 (-18.4)
2002 111.3 2001-2002 (-6.9)
1981 17.0 1980-1981 (-18.3)
2003 108.4 2002-2003 (-2.6)
1982 15.0 1981-1982 (-11.8)
2004 107.4 2003-2004 (-0.9)
1983 14.4 1982-1983 (-4.0)
- - -
Source: DEFRA (various years)

53
Most of the area of maize cultivation during the 1970s was in the Eastern, Southeast and
Southwest regions, as shown in Figure 4.2. In the Eastern region, the area of maize
cultivation was greatest in the north-western and south-eastern parts. In the Southeast,
the maize cultivation area spread to the south-eastern, south-western and north-western
parts of the region but the greatest concentration was in the north-west of this region.
The area of maize cultivation in the Southwest was greatest in the eastern part of the
region.
Figure 4.3 shows the spatial distribution of maize cultivation area in England in 1988.
After nine years, the main areas of maize cultivation in England had a similar location
to that in 1979. However, in terms of the density, more areas of maize cultivation
evidenced increased, especially in the Southeast and the Southwest regions. In the
Southeast, more areas in the south-western and the north-western part of the region
became moderate in density, whilst in the Southwest, some area in the eastern part of
the region became high in density, and this area probably represented the greatest
concentration of maize growing in England in the late 1980s.
Although the maps of the maize cultivation areas in England in 1979 and 1988,
presented in Figure 4.2 and Figure 4.3, show some changes in density, in general many
areas remained low. Growing maize in the United Kingdom has always been related to
dairy farming, and more specifically to milk prices. Some small changes in the density
of maize cultivation in the 1970s to 1980s could reflect decreases in the milk price.
According to the Milk Marketing Board (DEFRA), the milk price in 1974-1983 (26.92
p/l) decreased by 9.1% when compared to that in 1964-1973 (24.48 p/l).

54
Figure 4.2: The distribution of maize cultivation in England in 1979
(ha km-2)

55
Figure 4.3: The distribution of maize cultivation in England in 1988
(ha km-2)

56
By 1995, there was very rapid expansion of the area of maize cultivation in England
compared to 1990. The area cultivated with maize increased by 201.5% to 100,432 ha.
With the exceptional of the Eastern region, all regions in England showed more than a
100.0% increase in their maize cultivation area, as shown in Table 4.3. The area
cultivated for maize in the Eastern region increased by only 50.0%. The largest area
cultivated with maize in 1995 was found in the Southwest region, occupying an area of
49,600 ha, followed by the Southeast region (18,900 ha), the West Midlands (12,700
ha), and the Eastern region (6,000 ha). According to Figure 4.4, the greatest
concentration of maize growing in 1995 was in the Southwest and West Midlands
regions, especially in the eastern part of the Southwest, and in the northern and southern
parts of the West Midlands. Meanwhile, in the Southeast region, maize cultivation was
greatest in the south-western part. Compared with 1988, more areas in England were
characterized by a higher density of maize production.
This major change in area and density of maize cultivation can be related to incentives
from the AAPS. As indicated in Section 4.2, by the mid-1990s, maize qualified for the
highest payment of £320 per 0.4046 ha. Supporting this was an increase in the standard
milk price from 19.35 p/l in 1985-1980 to 21.28 p/l in 1991-1998, which also caused
growth in the dairy farming sector. The 1990s also saw changes in technology for maize
growers. Improvement in mechanization allowed the use of larger machines that in turn
led to an increase in field and farm sizes. New tractors for cultivation such as sprayers
for weed pest and disease control, and the use of larger harvesting machines helped
farmers to reduce overall costs, and encouraged farmers to grow maize on a large scale.
In addition, genetic improvements, which focused on herbicide tolerance, and also

57
Table 4.3: The maize cultivation area for all regions in England
Region Area in 1990 (ha x 103)
Area in 1995 (ha x 103)
Change 1991-1995 (%)
Area in 2000 (ha x 103)
Change 1995-2000 (%)
Area in 2001 (ha x 103)
Change 2000-2001 (%)
Area in 2002 (ha x 103)
Change 2001-2002 (%)
Area in 2003 (ha x 103)
Change 2002-2003 (%)
South West
15.0 49.6 +230.6 42.8 -13.7 51.6 +20.6 48.2 -6.6 47.8 -0.8
South East 9.0 18.9 +110.0 18.1 -4.2 22.1 +22.1 20.2 -8.6 18.7 -7.4 Eastern 4.0 6.0 +50.0 6.3 +5.0 7.7 +22.2 7.0 -9.1 6.2 -11.4 West Midlands
2.0 12.7 +535.0 13.0 +2.4 16.1 +23.8 15.3 -5.0 15.3 0.0
Northwest 1.2 5.8 +383.3 8.2 +41.4 10.1 +23.2 9.5 -6.0 9.6 +1.0 East Midlands
1.1 5.4 +390.9 6.8 +25.9 8.7 +27.9 8.0 -8.0 7.8 -2.5
Yorkshire and Humber
0.3 1.5 +400.0 2.0 +33.3 2.6 +30.0 2.7 +3.8 2.6 -3.7
Northeast 0.02 0.2 +900.0 0.2 0.0 0.2 0.0 0.2 0.0 0.2 0.0 London 0.06 0.2 +233.3 0.2 0.0 0.3 +50.0 0.1 -30.0 0.1 0.0 Source: DEFRA (various years)

58
Figure 4.4: The distribution of maize cultivation in England in 1995
(ha km-2)
59
provided maize growers with various varieties of high yield seeds, increased maize
yields and maize growers’ incomes, on top of the AAPS.
By 2000, the area under maize cultivation in England slightly decreased by 2.8%, down
to 97,623 ha, compared with area in 1995, but increased again in 2004 by 10.1% up to
107,494 ha. As in the 1980s and 1990s, the Southwest region and the Southeast still
remained as the most important maize cultivation areas in England in 2000. However,
the area under maize expanded more in the Southwest than in the Southeast, as shown
in Figure 4.5. Most of the area under maize in the Eastern region and the West Midlands
remained more or less static. The densest area cultivated with maize could thus be
found in the Southwest, especially in the eastern part of Devon, Somerset and Dorset.
The area cultivated with maize in the Southeast still remained densest in the western
and southern parts of the region, whilst in the West Midlands, the densest area for maize
cultivation could be observed in northern part, spreading out from there to the southern
part of the region.
Small changes in the area of maize cultivation between 1995 and 2004 can be related to
changes in the dairy farming sector. The number of dairy farming holders and the
number of dairy cows in 2004 decreased by 37.0% (15,554 holders) and 24.0%
(1,374,456 cows), respectively, compared with 1995, when there were 24,678 holders
and 1,809,282 cows. This decrease can also be related to a decline in milk price, where
the milk price in 2002-2003 was 18.33 p/l, a decrease of 13.9% from the price in 1997-
1998 (21.28 p/l). The expansion of the area under maize in England, also has
implications for environmental problems, especially the off-site impact of the silage
maize area after harvesting during winter, in regard to soil erosion from bare maize
fields. This is one of the DEFRA concerns in the CAP reform in 2000, which

60
Figure 4.5: The distribution of maize cultivation in England in 2000
(ha km-2)

61
recognized that the degraded standard of water quality during winter could be caused by
soil erosion from bare maize fields. One of the key changes associated with the CAP
reform in 2000, aimed at reducing soil erosion, and avoiding diffuse pollution from
maize area and other crop lands, was the AAPS, which declined by 29.5% in 2001 to
£225.64 per hectare, compared with payment rates in the mid-1990s of £320.00 per
hectare. Although DEFRA promoted environmentally friendly practises in cropping
through the agri-environmental scheme, most farmers, including maize growers, were
probably still not ready to change the management systems at that time, especially small
holding farmers.
Although the area of maize cultivation shows a decline between 1990 and 2004, the
author also believes that the area of maize cultivation will continue to show a small
decrease in coming years, at least until 2010. This is based on the projection by the Milk
Development Council, that milk price would be around 15.00 p/l from 2007 onwards.
Compared with milk price in 2002-2003, this is a decrease by 18.2%. Under the CAP
reform in 2003, farmers have to follow many environmentally friendly approaches
recommended by DEFRA in order to sustain the environment. However, it seems that
many farmers are still not ready to fulfil most of the environmentally friendly
requirements, as for example mentioned in the Single Payment Scheme and the
Environmental Stewardship Scheme, which required them to prepare Soil Management
Plans and Soil Protection Reviews. All these could influence the area of maize
cultivation in England in the future.
4.5 Maize Cultivation in the Southwest Region
In terms of cropland area, the Southwest is the fifth region in England after the Eastern
region, the East Midlands, the Southeast, and Yorkshire and the Humber region. In

62
2003, the Southwest region accounted for 7.1% of the cropland in England. Cereals
have become the most important crop in the Southwest region, and in 2003 occupied an
area of more than 312,600 ha. Fodder crops were in second place with a cultivated area
of greater than 80,800 ha. Somerset, Devon and Dorset had been the largest areas
cultivated with cereals and fodder crops in 2003. Figure 4.6 shows the trends for
cropland areas in the Southwest, whilst Figure 4.7 shows the trend for cropland areas
for each county in the Southwest from 1950 to 2003.
0
50
100
150
200
250
300
350
400
450
1950 1960 1970 1980 1990 1995 2000 2001 2002 2003
Years
Ha ('000) Cereals
Stock crops
Fodder crops
Horticultural
Figure 4.6: Trends in cropland area in the Southwest between 1950 to 2003
0
50
100
150
200
250
Devon Wiltshire Gloucestershire Cornwall & Isles
of Scilly
Somerset Dorset
County
Hectares ('000)
1950
1960
1970
1980
1990
1995
2000
2001
2002
2003
Figure 4.7: Trends in cropland area for each county in the Southwest between 1950 to 2003
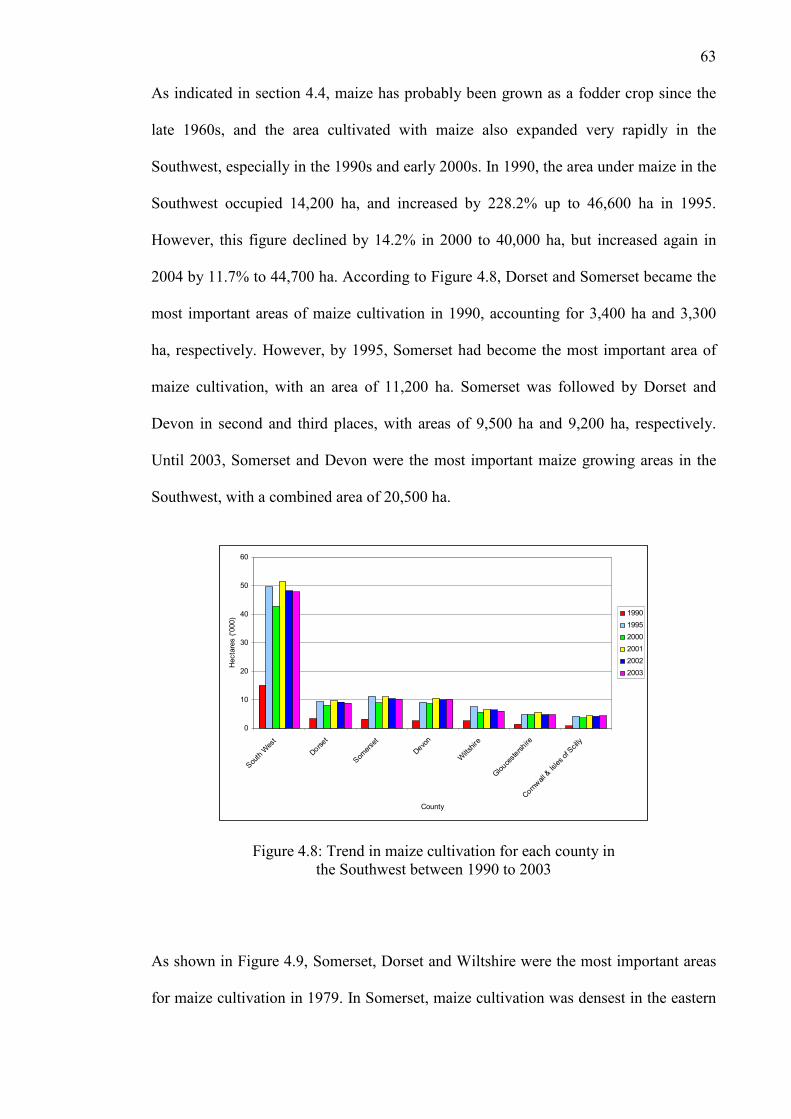
63
As indicated in section 4.4, maize has probably been grown as a fodder crop since the
late 1960s, and the area cultivated with maize also expanded very rapidly in the
Southwest, especially in the 1990s and early 2000s. In 1990, the area under maize in the
Southwest occupied 14,200 ha, and increased by 228.2% up to 46,600 ha in 1995.
However, this figure declined by 14.2% in 2000 to 40,000 ha, but increased again in
2004 by 11.7% to 44,700 ha. According to Figure 4.8, Dorset and Somerset became the
most important areas of maize cultivation in 1990, accounting for 3,400 ha and 3,300
ha, respectively. However, by 1995, Somerset had become the most important area of
maize cultivation, with an area of 11,200 ha. Somerset was followed by Dorset and
Devon in second and third places, with areas of 9,500 ha and 9,200 ha, respectively.
Until 2003, Somerset and Devon were the most important maize growing areas in the
Southwest, with a combined area of 20,500 ha.
0
10
20
30
40
50
60
South West
Dorset
Somerset
Devon
Wiltshire
Gloucestershire
Cornwall & Isles of Scilly
County
Hectares ('000)
1990
1995
2000
2001
2002
2003
Figure 4.8: Trend in maize cultivation for each county in the Southwest between 1990 to 2003
As shown in Figure 4.9, Somerset, Dorset and Wiltshire were the most important areas
for maize cultivation in 1979. In Somerset, maize cultivation was densest in the eastern

64
and southern parts of the county. In Dorset, maize cultivation can be seen to be
important in the eastern and south-eastern parts of the county, whilst in Wiltshire, most
of the maize cultivation area can be found in the western and northern parts of the
county. At this time, maize cultivation was relatively limited in Devon, Gloucestershire,
Avon and Cornwall.
When compared with 1979, maize cultivation in the Southwest in 1988 expanded
rapidly in Devon, as shown in Figure 4.10. The area of maize cultivation became
moderately dense in the eastern and south-eastern parts of the county. Meanwhile, in
Somerset, maize cultivation was widely distributed, whilst in Dorset, only limited
changes were seen in terms of the area of maize cultivation, because it was largely
grown within the same areas. These changes reflected similar trends to those found at
the national scale, which can be related to increases in the number of dairy cows.
Figure 4.9: The distribution of maize cultivation in the Southwest Region (1979)
Legend ha km-2

65
Overall, the number of dairy cows in the South declined by 7.7% between 1981 and
1988 from 778,880 cows in 1981 to 718,767 cows in 1988.
According to Figure 4.11, the density of maize cultivation in the Southwest in 1995 was
denser than in 1988. By 1995, the densest area was in eastern part of Somerset and
northern part of Dorset. In fact, the area under maize in Somerset expanded in every
corner of the county except the north-western part. Other counties also show an
expansion of the area of maize cultivation, and more new areas of maize cultivation can
be found in southern, western and south-eastern parts of Devon and Cornwall. In 2000,
the densest area of maize cultivation occurred in almost the same locations as in 1995,
and there were not many changes can be found in terms of the absolute density (Figure
4.12). In some areas in Wiltshire that were cultivated with maize previously, the density
of maize cultivation increased, especially in the northern and eastern parts of the
county. However, in other counties, most of the areas previously under maize have
Figure 4.10: The distribution of maize cultivation in the Southwest Region (1988)
Legend ha km-2

66
remained so. In addition, the highest increases in the area under maize in the Southwest
between 1995 and 2000 occurred in Devon, by 15% up to 10,599 ha.
Figure 4.11: The distribution of maize cultivation in the Southwest Region (1995)
Legend ha km-2
Figure 4.12: The distribution of maize cultivation in the Southwest Region (2000)
Legend ha km-2

67
Some changes in the density of the area under maize in the Southwest between 1995
and 2000 show similar trends to the national level. In addition to the decline in milk
price and incentive payment under the AAPS, the number of dairy cows in all counties
in the Southwest also decreased. For example, the number of dairy cows in Devon in
2000 decreased by 11.5% (155,229 cows), compared with the number of dairy cows in
1995 (175,505 cows). Table 4.4 shows the decreases in number of dairy cows in the
Southwest that could account for the changes in the area under maize in the region.
4.6 Conclusion
Agriculture is one of the important activities in England, especially in the Southwest
region. Most of the agricultural land in England and the Southwest is cultivated with
crops, especially for cereal and stock feeding. Fodder crops have become the third most
important crops in England and the Southwest. Maize too has become an important
fodder crop, and its cultivation expanded very rapidly between 1990 and 2000 in
England and notably the Southwest region.
This chapter has discussed the temporal and spatial patterns of maize cultivation in
England at the national level but with particular emphasis on the Southwest region. At
the national level, growing maize as a fodder crop has become very important since the
1990s to support dairy farming. The rapid expansion of the maize area has occurred in
almost every region in England, especially in the Eastern, Southeast and Southwest
regions. From the 1970s to the 1980s, most of the maize cultivation area could be found
in the Eastern and Southeast regions. However, since then, maize cultivation area has
spread rapidly and has become denser in the Southwest region from the 1990s to the
present. In the Southwest, the spatial distribution of maize cultivation area in the 1970s
and 1980s became denser in Somerset, Dorset and Wiltshire. However, the situation has

68
Table 4.4: The area of maize cultivation and the number of dairy cows in the South West in 1990, 1995 and 2000
1990 1995 1995 2000 2000 County
MC DC
MC
Changes in MC in 1990-1995 (%)
DC
Changes in DC in 1990-1995 (%)
MC
Changes in MC in 1995-2000 (%)
DC
Changes in DC in 1995-2000 (%)
Cornwall 841.0 103,115 4,211.2 +400.7 96,547 -6.4 3,670.9 -12.8 85,534 -11.4 Devon 2,567.0 184,786 9,216.6 +259.0 175,505 -5.0 8,708.4 -5.5 155,229 -11.5 Dorset 3,381.0 101,964 9,497.0 +180.9 93,943 -7.9 8,035.7 -15.4 77,954 -17.0 Gloucestershire 1,427.3 49,481 4,868.6 +241.1 45,461 -8.1 4,849.1 -0.4 38,406 -15.5 Somerset 3,347.5 140,541 11,178.2 +233.9 128,332 -8.7 8,992.5 -19.5 109,498 -14.7 Wiltshire 2,601.7 76,521 7,680.5 +195.2 68,337 -10.7 5,725.1 -25.4 55,639 -18.6 Total 14,165.5 656,404 46,652.1 +229.3 608,125 -7.3 39,981.7 -14.3 522,260 -14.1 Source: DEFRA (various years)
Note: MC – Area under maize cultivation (ha) DC – The number of dairy cows

changed since the 1990s, and the maize cultivation area is now densest in Devon,
Somerset and Dorset.
Most of the recent changes in the area of maize cultivation in England and the
Southwest can be related to the state of dairy farming, which in more detail is related to
milk prices and the number of dairy cows. On top of this is the incentive from the
AAPS, especially in the 1980s, which probably reached the highest payment for
growing crops, including maize. Technological developments, especially in the 1970s
and 1990s, also became an important factor that could encourage farmers to grow
maize. This could be related to the introduction of new machines for managing the crop
(from sowing to harvesting), and improvements in herbicide tolerance, which increased
both yields and incomes. All these factors contributed to the expansion of the area under
maize in England and the Southwest region between the 1970s and mid-2000s.

70
CHAPTER 5: MAIZE CULTIVATION IN THE CULM AND TONE
CATCHMENTS
5.1 Introduction
The previous chapter considered maize cultivation in the United Kingdom from a
national and regional perspective, focusing on England and the Southwest region. This
chapter considers the spatial and temporal patterns of maize cultivation at a local level,
and this involves the two study catchments, namely the Culm and the Tone catchments.
A detailed description of the background data used to support this analysis has already
been presented in Chapter 3. As indicated in Chapter 2, the Culm and Tone catchments
are located in the Southwest region, in the counties of Devon and Somerset,
respectively. These two counties have the largest areas in the Southwest, and probably
in the country, under maize, as reported in Chapter 4. The first section of the present
chapter considers the spatial and temporal patterns of maize cultivation in both
catchments. The second section considers in greater detail at the spatial location of
current maize cultivation within the two catchments, with emphasis on its location with
respect to the river networks.
5.2 Spatial and Temporal Patterns of Maize Cultivation in the Culm and Tone
Catchments
As discussed in the previous chapter, maize has become an important fodder crop in
England to support dairy farming. The following description of spatial and temporal
patterns of maize cultivation within the Culm and Tone catchments is based on data
provided by DEFRA, and the CEH land cover database, and on field mapping
undertaken by the author as part of the current investigation. The data (DEFRA and
CEH) have again been manipulated for the purpose of this study, which classifies the
density of maize cultivation into five categories, as explained in Chapter 4 (Section 4.3).

71
The field mapping data for 2002, 2003, and 2004 were generated through field
observation and direct interviews with farmers during the field surveys, aim at
producing maps of the individual fields used for maize cultivation, based on the
standard topographic 1:25,000 maps with field boundaries. These datasets were stored
in GIS format, in raster format for the DEFRA and CEH data, and in vector format for
the field mapping data, in readiness for further analysis of the spatial patterns involved.
5.2.1 Maize cultivation in the Culm Catchment
The Culm Catchment covers an area of 227.4 km2. According to the MAFF agricultural
land classification, the major part of the Culm Catchment area is classified as Grade 3,
where the quality of land is classed as being between good to moderate for agricultural
purposes, with moderate limitations for agricultural use. These limitations could be due
to soil type, relief or climate, all of which might restrict the choice of crops and timing
of cultivation. Small areas in the downstream part of the catchment, located in the
vicinity of Cullompton and Kentisbeare, are classified as Grade 1, which represents land
of an excellent quality with only minor or probably no physical limitations on its
agricultural use. Maize growing in the Culm Catchment is most likely to be
concentrated on Grade 1 land, especially in the downstream part of the catchment.
According to Figure 5.1(a), maize growing was of limited importance in the Culm
Catchment in 1979. The area of maize cultivation was located in the downstream part of
the catchment, and was characterized by very low density (less than 2 ha km-2). The
areas involved were around Cullompton, Kentisbeare, Uffculme, Willand and
Halberton.

72
Figure 5.1: The spatial distribution of maize cultivation density in the Culm Catchment in 1979 (a), 1988 (b), 1995 (c) and 2000 (d)
(a) (b)
(c) (d)

73
Some changes in the spatial distribution and extent of maize cultivation can be
identified in 1988, as shown in Figure 5.1(b). The area of maize cultivation can be seen
to have expanded into the middle part of the catchment, especially around Burlescombe
and Sheldon. Furthermore, in terms of the density of maize cultivation, the areas around
Kentisbeare, Willand and Halberton (in the downstream part of the catchment) changed
from very low to low density (3-6 ha km-2).
By 1995, maize cultivation had spread across all the catchment, although the density
varied, as shown in Figure 5.1(c). In general, the downstream part of the catchment
increased from low to moderate density (7-12 ha km-2), whilst in the middle part of the
catchment, especially around Sheldon, it increased from low to high density (13-20 ha
km-2).
When compared with 1995, some further changes in the areas under maize occurred by
2000, as shown in Figure 5.1(d). Around Halberton, there was an area of maize
cultivation characterized by a very high density (more than 20 ha km-2). Within the
downstream part of the catchment most other areas had changed from moderate density
in 1995 to high density. In the middle part of the catchment, especially around
Holcombe Rogus and Culmstock, the density of maize cultivation remained moderate or
high.
There was little or no maize growing in the upstream part of the catchment before the
1990s. However, the area of maize cultivation can be seen to have expended into the
upstream part of the catchment in the 1990s, and especially into the areas around
Clayhidon and Churchstanton, providing an area of low density maize cultivation in
1995 and 2000.

74
According to the CEH land cover database, the total area under maize in the Culm
catchment in 2000 was 885.0 ha. Based on the field survey, this area reduced by ca.
22.5 ha to 862.5 ha in 2002, but expanded again in 2003 to 1,042.5 ha. However, in
2004, the area under maize in the Culm Catchment covered only 855.0 ha, a decrease of
ca. 188 ha from 2003. From 2002 to 2004, most of the maize cultivation was located in
the downstream part of the catchment, as shown in Figure 5.2.
The field mapping data available for 2002, 2003 and 2004 show that 115 fields were
cultivated with maize in 2002, with the total increasing to 139 fields in 2003, but
decreasing again to 114 fields in 2004. Table 5.1 summarize the area of maize
cultivation and the number of maize fields in 2002, 2003, and 2004 in the Culm
catchment.
Table 5.1: The area of maize cultivation and the number of maize fields in the Culm Catchment in 2002, 2003 and 2004
2002 2003 % change
(2002 & 2003) 2004 % change
(2003 & 2004)
Area (ha)
862.5
(115 fields)
1,042.5
(139 fields) +20.9 855.0
(114 fields) -18.0
Note: (+) indicates increase (-) indicates decrease
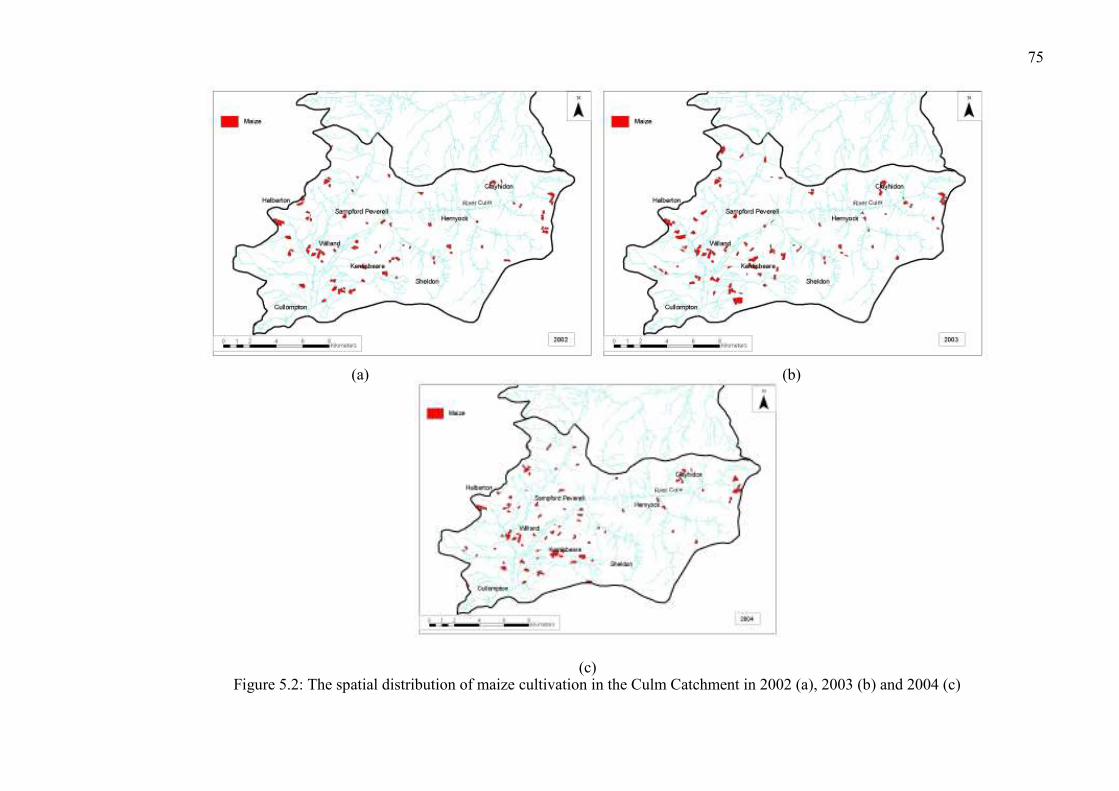
75
Figure 5.2: The spatial distribution of maize cultivation in the Culm Catchment in 2002 (a), 2003 (b) and 2004 (c)
(a) (b)
(c)

76
Table 5.2 presents the result from an overlay analysis aimed at company the distribution
of maize fields in 2002, 2003 and 2004. The results show that for 2002 and 2003, 61
maize fields were cultivated in both years, with these fields being located particularly
around Halberton and Shelton. The ‘new’ maize fields accounted for 585.0 ha in 2003.
However, in 2003 and 2004, the number of maize fields cultivated in both years
decreased to 48, but these fields accounted for 360.0 ha of the maize cultivation area in
the Culm Catchment in 2004. In addition, an overlay analysis for 2002, 2003 and 2004
shows that maize was grown within the same fields over the three years in 35 fields.
This represented an area of 262.5 ha of maize cultivation area in 2004.
Table 5.2: The overlay analysis results for the area of maize cultivation in the Culm Catchment for 2002, 2003 and 2004
2002 and 2003 2003 and 2004 2002, 2003 and 2004
Same maize fields 61 fields (457.5 ha) 48 fields (360.0 ha) 35 fields (262.5 ha)
New maize fields 78 fields (585.0 ha) 66 fields (495.0 ha) 79 fields (592.5 ha)
To summarize, considering the trends of the temporal and spatial pattern of maize
cultivation in the Culm Catchment in 1979, 1988, 1995, 2000, 2002, 2003 and 2004, it
can be concluded that most of the area under maize was located in the downstream part
of the catchment. This was particularly concentrated within the area around Kentisbeare,
Cullompton, Halberton and Uffculme. In the middle part of the catchment, maize
growing was mostly at a moderate density, and was concentrated in the area around
Sheldon, Holcombe Rogus, Hemyock, and Culmstock. Maize is found only rarely in the
upper part of the catchment but some areas were found around Clayhidon and
Churchstanton. In general, the density of maize cultivation was low in 1979 and 1988,
but changed to moderate in 1995 and to high in 2000.
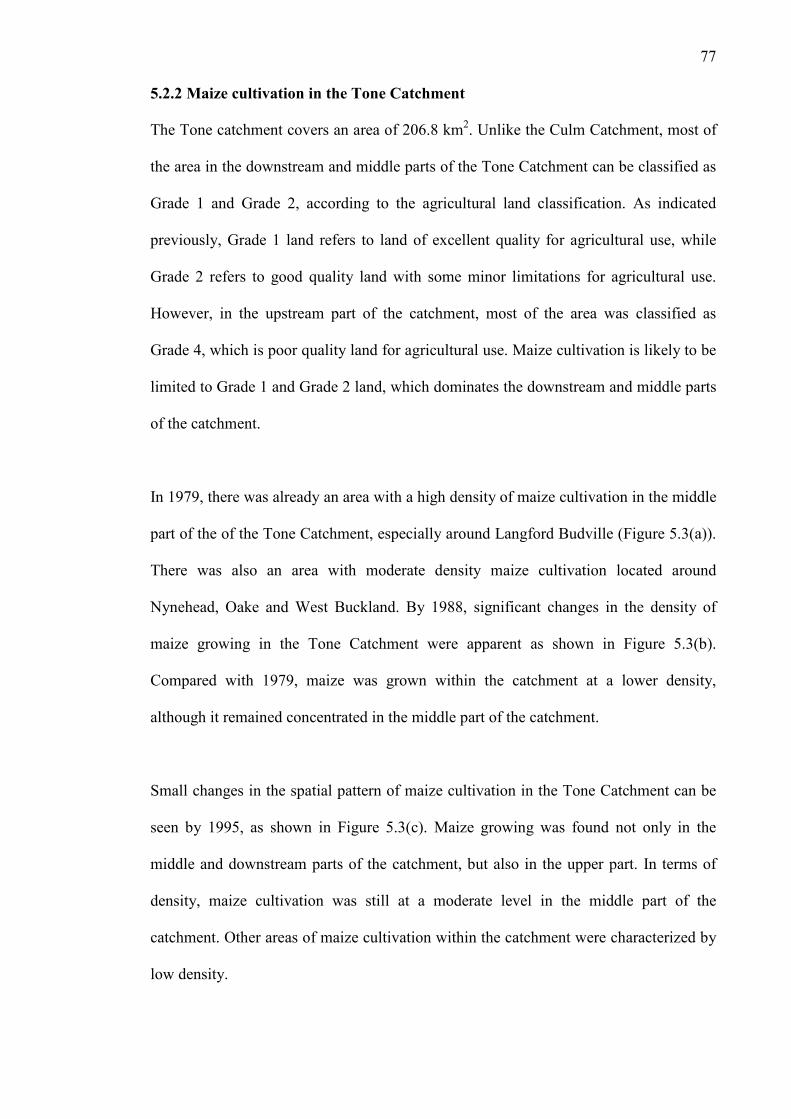
77
5.2.2 Maize cultivation in the Tone Catchment
The Tone catchment covers an area of 206.8 km2. Unlike the Culm Catchment, most of
the area in the downstream and middle parts of the Tone Catchment can be classified as
Grade 1 and Grade 2, according to the agricultural land classification. As indicated
previously, Grade 1 land refers to land of excellent quality for agricultural use, while
Grade 2 refers to good quality land with some minor limitations for agricultural use.
However, in the upstream part of the catchment, most of the area was classified as
Grade 4, which is poor quality land for agricultural use. Maize cultivation is likely to be
limited to Grade 1 and Grade 2 land, which dominates the downstream and middle parts
of the catchment.
In 1979, there was already an area with a high density of maize cultivation in the middle
part of the of the Tone Catchment, especially around Langford Budville (Figure 5.3(a)).
There was also an area with moderate density maize cultivation located around
Nynehead, Oake and West Buckland. By 1988, significant changes in the density of
maize growing in the Tone Catchment were apparent as shown in Figure 5.3(b).
Compared with 1979, maize was grown within the catchment at a lower density,
although it remained concentrated in the middle part of the catchment.
Small changes in the spatial pattern of maize cultivation in the Tone Catchment can be
seen by 1995, as shown in Figure 5.3(c). Maize growing was found not only in the
middle and downstream parts of the catchment, but also in the upper part. In terms of
density, maize cultivation was still at a moderate level in the middle part of the
catchment. Other areas of maize cultivation within the catchment were characterized by
low density.

78
Figure 5.2: The spatial distribution of maize cultivation density in the Tone Catchment in 1979 (a), 1988 (b), 1995 (c) and 2000 (d)
(a) (b)
(c) (d)
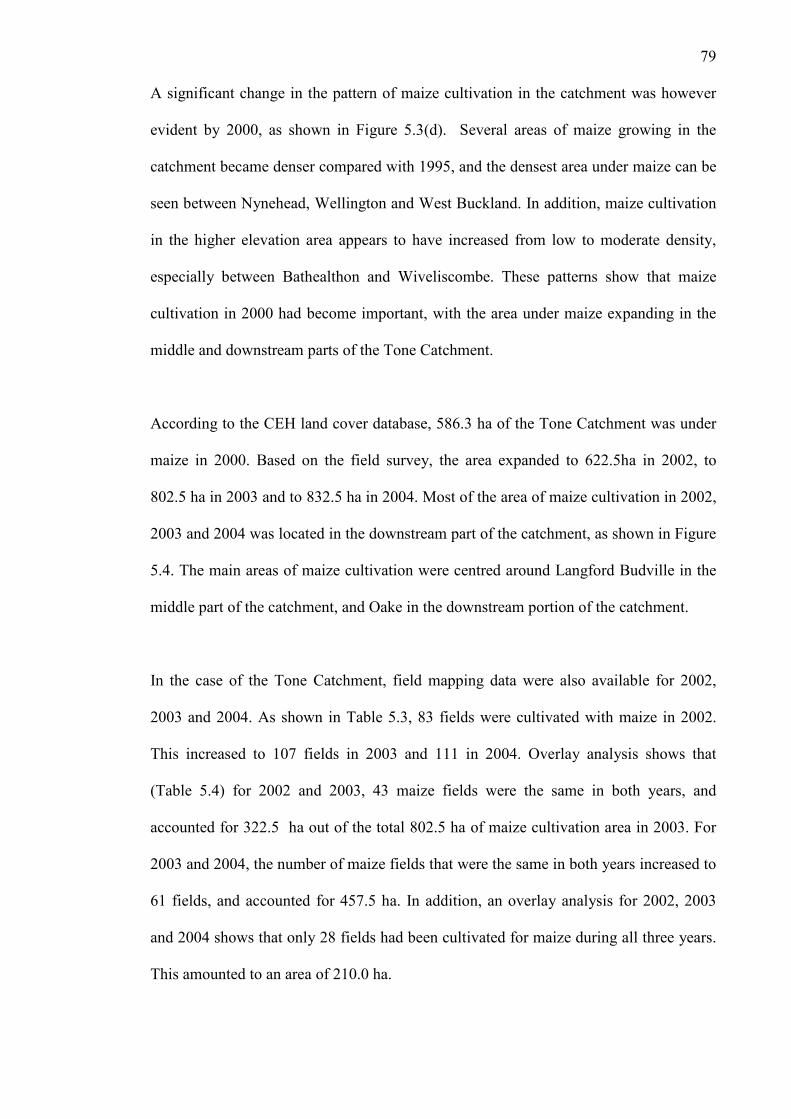
79
A significant change in the pattern of maize cultivation in the catchment was however
evident by 2000, as shown in Figure 5.3(d). Several areas of maize growing in the
catchment became denser compared with 1995, and the densest area under maize can be
seen between Nynehead, Wellington and West Buckland. In addition, maize cultivation
in the higher elevation area appears to have increased from low to moderate density,
especially between Bathealthon and Wiveliscombe. These patterns show that maize
cultivation in 2000 had become important, with the area under maize expanding in the
middle and downstream parts of the Tone Catchment.
According to the CEH land cover database, 586.3 ha of the Tone Catchment was under
maize in 2000. Based on the field survey, the area expanded to 622.5ha in 2002, to
802.5 ha in 2003 and to 832.5 ha in 2004. Most of the area of maize cultivation in 2002,
2003 and 2004 was located in the downstream part of the catchment, as shown in Figure
5.4. The main areas of maize cultivation were centred around Langford Budville in the
middle part of the catchment, and Oake in the downstream portion of the catchment.
In the case of the Tone Catchment, field mapping data were also available for 2002,
2003 and 2004. As shown in Table 5.3, 83 fields were cultivated with maize in 2002.
This increased to 107 fields in 2003 and 111 in 2004. Overlay analysis shows that
(Table 5.4) for 2002 and 2003, 43 maize fields were the same in both years, and
accounted for 322.5 ha out of the total 802.5 ha of maize cultivation area in 2003. For
2003 and 2004, the number of maize fields that were the same in both years increased to
61 fields, and accounted for 457.5 ha. In addition, an overlay analysis for 2002, 2003
and 2004 shows that only 28 fields had been cultivated for maize during all three years.
This amounted to an area of 210.0 ha.

80
Figure 5.4: The spatial distribution of maize cultivation in the Tone Catchment in 2002 (a), 2003 (b) and 2004 (c)
(a) (b)
(c)

81
Table 5.3: The area of maize cultivation and the number of maize fields in the Tone Catchment in 2002, 2003 and 2004
2002 2003 % change
(2002 & 2003) 2004 % change
(2003 & 2004)
Area (ha) 622.5
(83 fields)
802.5
(107 fields)
+28.9 832.5
(111 fields)
+3.7
Note: (+) indicates increase
Table 5.4: The overlay analysis results for the area of maize cultivation in the Tone Catchment for 2002, 2003 and 2004
2002 and 2003 2003 and 2004 2002, 2003 and 2004
Same maize fields 43 fields (322.5 ha) 61 fields (457.5 ha) 28 fields (210.0 ha)
New maize fields 40 fields (300.0 ha) 46 fields (345.0 ha) 83 fields (622.5 ha)
In conclusion, the spatial distribution of maize cultivation in the Tone Catchment was
dominated by an important area of maize cultivation located in the middle part of the
catchment, particularly around Langford Budville and Sampford Arundel. The area
around Oake, representative of the downstream part of the catchment was also an
important area for maize growing. During 1979 and 1988 the density of maize
cultivation was low, but then increased to moderate in 1995 and to high in 2000.
5.3 The Connectivity of the Maize Fields and the River Networks
This section will examine the location of the maize fields in each of the study catchment
with respect to the river networks and thus the likely field-river connections. GIS was
used in this analysis, employing buffering analysis in the ArcMap software, as indicated
in Chapter 3. For the purpose of this analysis, only the field mapping data for 2002,
2003 and 2004 were used as template maps. These template maps, which show the
spatial distribution of maize fields within the Culm and Tone catchments, were overlaid

82
with the river network information. The buffering analysis of the spatial distribution of
maize fields with respect to the river network was made based on manipulation of the
distances of a field from the closest river channel (registered as a line feature)
represented by six categories:
1. Up to 100 m from the river.
2. From 100m to 250m from the river.
3. From 250m to 500m from the river.
4. From 500m to 750m from the river.
5. From 750m to 1000m from the river.
6. More than 1000m from the river.
The results of the overlay and buffering analysis are presented in map form to show the
spatial distribution of maize fields related to the river network. However, in order to
avoid ‘messy’ maps with buffering borders for each category of distance, the map will
show only the 250 to 500 m result for the Rivers Culm and Tone. Further details of
overlay and buffering results, in terms of the number of maize fields within each
category are presented in table format.
5.3.1 The connectivity between maize fields and river network in the Culm
Catchment
In the case of the Culm catchment, a buffering analysis was made for both the main
channel of River Culm, which flows from the eastern part of the catchment and the main
tributaries. These include the Spratford Stream, which covers the western part of the
Culm catchment, and flows from the north-western part of the catchment, joining the
Culm downstream near Cullompton, the Madford River in the upstream part of the

83
catchment, the Bolham River in the central part of the catchment, and Kent River in the
downstream part of the catchment.
Figures 5.5, 5.6 and 5.7 present the results of the buffering analysis for the Culm
Catchment, whilst Tables 5.5, 5.6 and 5.7 show the number of maize fields for each
distance category in 2002, 2003 and 2004, respectively. It is clear that the majority of
maize fields in the Culm Catchment are located between 100 and 250 m from the river
network. In 2002, this involved 43 (37.4%) maize fields, increasing to 47 (33.8%) in
2003, and 49 (43.0%) in 2004. There were also a large number of maize fields located
within 100 m of the River Culm network. In 2002, 39 (33.9%) maize fields were
identified located as being within 100 m from the river network, but this declined to 38
(27.3%) and 35 (30.7%) maize fields in 2003 and 2004, respectively.
The number of maize fields located between 250 to 500 m from the river networks is
also considerable, giving 28 maize fields in 2002, 30 in 2003 and 20 in 2004. However,
not many maize fields were located more than 500 m from the river networks during
those years. Most of the maize fields located at distances of less than 250 m from the
River Culm networks could be found around Kentisbeare in the downstream and
Sampford Peverell in the middle part of the catchment.
5.3.2 The connectivity between maize fields and river network in the Tone
Catchment
A buffering analysis for the Tone Catchment was also undertaken for the Tone River,
which flows from the north-western part of the catchment to the eastern part of the
catchment. Similar procedures of buffering analysis, as used for the River Culm
networks, were also applied to the River Tone networks. This also covered the main

84
Figure 5.5: An example of buffering analysis and spatial distribution of maize cultivation in the Culm Catchment in 2002

85
Figure 5.6: An example of buffering analysis and spatial distribution of maize cultivation in the Culm Catchment in 2003

86
Figure 5.7: An example of buffering analysis and spatial distribution of maize cultivation in the Culm Catchment in 2004

87
Table 5.5: The number of maize fields with regard to distance
from the River Culm channel network in 2002
Distance from the river networks No. of maize fields %
Up to 100 m 39 33.9
100 to 250 m 43 37.4
250 to 500 m 28 24.3
500 to 750 m 5 4.4
TOTAL 115 100.0
Table 5.6: The number of maize fields with regard to distance
from the River Culm channel network in 2003
Distance from the river networks No. of maize fields %
Up to 100 m 38 27.3
100 to 250 m 47 33.8
250 to 500 m 30 21.6
500 to 750 m 21 15.1
750 to 1000 m 3 2.2
TOTAL 139 100.0
Table 5.7: The number of maize fields with regard to distance
from the River Culm channel network in 2004
Distance from the river networks No. of maize fields %
Up to 100 m 35 30.7
100 to 250 m 49 43.0
250 to 500 m 20 17.5
500 to 750 m 8 7.0
750 to 1000 m 2 1.8
TOTAL 114 100.0

88
tributaries of the River Tone: the Hillfarrance Brook, which flows from the eastern part
of the catchment; the Westford Stream, which flows from the southern part of the
middle part of the catchment; and Haywords Water and Stoford Stream, which flow
from the southern part of the catchment.
The results of the buffering analysis of the maize fields locations and network
connectivity for the River Tone catchment in 2002, 2003 and 2004 are shown in Figures
5.8 (2002), 5.9 (2003) and 5.10 (2004). In addition, Tables 5.8, 5.9 and 5.10 show the
number of maize fields with respect to their distances from the river network. Similar
patterns of maize field distribution can be seen in the Tone Catchment as in the Culm
Catchment, where most of the maize fields are located between the distances of 100 to
250 m from the river networks. In 2002, almost half of the maize fields (49.4%) in the
Tone catchment were identified as located in that distance category, and the number
increased to 45 maize fields in 2003 and 51 in 2004.
The number of maize fields up to 100 m from the river networks was also large with 20
maize fields in 2002, increasing to 32 in 2003 and 38 in 2004. Not many maize fields
were identified at a distance of more than 500 m from the river networks. Most maize
fields were located at less than 250 m from the river networks were found in the
downstream and middle parts of the Tone Catchment. For 2002, more maize fields were
identified at less than 250 m from Hillfarrance Brook.
89
Figure 5.8: An example of buffering analysis and spatial distribution of maize cultivation in the Tone Catchment in 2002
90
Figure 5.9: An example of buffering analysis and spatial distribution of maize cultivation in the Tone Catchment in 2003

91
Figure 5.10: An example of buffering analysis and spatial distribution of maize cultivation in the Tone Catchment in 2004

92
Table 5.8: The number of maize fields in related to distance
from the River Tone network in 2002
Distance from the river networks No. of maize fields %
Up to 100 m 20 24.1
100 to 250 m 41 49.4
250 to 500 m 19 22.8
500 to 750 m 3 3.7
TOTAL 83 100.0
Table 5.9: The number of maize fields in related to distance
from the River Tone network in 2003
Distance from the river networks No. of maize fields %
Up to 100 m 32 29.9
100 to 250 m 45 42.0
250 to 500 m 25 23.4
500 to 750 m 3 2.8
750 to 1000 m 2 1.9
TOTAL 107 100.0
Table 5.10: The number of maize fields in related to distance
from the River Tone network in 2004
Distance from the river networks No. of maize fields %
Up to 100 m 38 34.2
100 to 250 m 51 45.9
250 to 500 m 18 16.2
500 to 750 m 4 3.7
TOTAL 111 100.0

93
5.3.3 Discussion
For both study catchments, most of maize fields were identified as being less than 250
m from river network and ranging from flat to undulating in nature, with elevations less
than 250 m above sea level. The topography is suitable for growing maize and practical
for the use of harvesting machinery.
In the case of the Culm Catchment, most maize fields located less than 250 m from river
networks were found in the downstream part of the catchment, especially around
Kentisbeare and Willand. In contrast, in the Tone Catchment, most maize fields within
the same distance were found in the middle part of the catchment, especially around
Stawley, Sampford Arundel and Langford Budville. These areas lie on the Bromsgrove
and Whimple 3 soil types. The Bromsgrove series is a non-alluvial brown-earth soil
with loamy or clayey subsoil, while the Whimple 3 series is argillic brown-earth soil,
either loamy or clayey, with an ordinary clay-enriched subsoil. Both soil series are
considered suitable for growing maize because of their slowly permeable subsoils.
In addition to the physical factors that probably influence the maize growers’ decision
to grow maize close to river network, there is a potential for damage to the environment,
especially with regards to water quality. As mentioned in the introductory chapter,
maize fields which are bare during winter easily expose soil to erosion caused by heavy
rainfall and a high volume of surface runoff. The conditions of bare surface soil like this
could mobilize and transport sediment from maize fields to nearby watercourses and
cause diffuse source pollution. Based on buffering analysis findings for both
catchments, indicates that majority of maize fields located closed to river networks. This
likely caused river pollution during winter and pollutes the river with diffuse pollution.
Based on the author’s observations, with support from topographic maps, it is possible

94
to judge that most of these fields are on undulating and quite steep slopes, which could
encourage soil erosion.
In the case of six study fields, the average of slope steepness is around 3 to 3.5o. This
could encourage very fast runoff and very easy erosion of the slope surface. The author
made this assumption based on the observation during soil sampling, where many rills
were observed from the top to the bottom parts of the slopes, especially in Cutsey,
Dalwood, Westcoot, Ritherden and Little Landside maize fields.
In terms of area with respect to their distance from river networks, it is clear that most
maize fields located between the distance of 100 to 250 m from the river networks, in
both the Culm and Tone catchments as shown in Figure 5.11. For example, 57.8% or
481.2 ha and 45% or 384.7 ha of maize fields in 2004 were identified as being located
between that distance in the Tone and Culm catchments, respectively. There was also a
large area of maize cultivation up to 100 m from the river networks in both catchments.
For example, 30.7% of the area of maize cultivation in the Culm Catchment in 2002,
and 25.3% of the area of maize cultivation in the Tone Catchment in 2003 were found
to be located up to 100 m distance from the river networks. All these figures show that
maize growing in the Culm and Tone catchment was concentrated in the area of up to
250 m distance from the river networks.

95
0
5
10
15
20
25
30
35
40
45
50
Up to 100 m 100 to 250 m 250 to 500 m 500 to 750 m 750 to 1000 m
Distance from the river networks
Area (%) 2002
2003
2004
(a) The Culm Catchment
0
10
20
30
40
50
60
70
Up to 100 m 100 to 250 m 250 to 500 m 500 to 750 m 750 to 1000 m
Distance from the river networks
Area (%0 2002
2003
2004
(b) The Tone Catchment
Figure 5.11: The area of maize cultivation (%) with regard to the distance from river networks
2002 – Total area of maize cultivation = 862.5 ha 2003 – Total area of maize cultivation = 1,042.5 ha 2004 – Total area of maize cultivation = 855.0 ha
2002 – Total area of maize cultivation = 622.5 ha 2003 – Total area of maize cultivation = 802.5 ha 2004 – Total area of maize cultivation = 832.5 ha

96
5.4 Conclusion
This chapter has discussed the spatial and temporal patterns of maize cultivation in the
Culm and Tone Catchments. In general, most of the area of maize cultivation in the
Culm Catchment was densest in the downstream part. In the case of the Tone
Catchment, this could be found in the middle part of the catchment. In both catchments,
the number of maize fields that were grown within the same fields over the three years
(2002, 2003 and 2004) decreased, but an increasing number can be seen for new maize
fields in both catchments. With regard to the maize fields and their connectivity with
river networks, the majority are located at less than 250 m from the river networks in
both catchments. This seems likely to encourage the transportation of sediments through
the river networks, thus causing a degradation of water quality in regard to diffuse
pollution.

97
CHAPTER 6: SOIL EROSION ASSOCIATED WITH MAIZE CULTIVATION
6.1 Introduction
The use of radionuclides, and particularly 137Cs, as tracers in soil erosion studies is
already well developed around the world. However, there has been little work
undertaken in using 7Be as a tracer in investigating soil erosion. Because of its short
half-life (53 days), 7Be potentially offers a valuable tool for documenting short-term
erosion rates. This chapter reports an attempt to use both 137Cs and 7Be in combination,
in order to provide information on the increase in erosion rates associated with maize
cultivation. 137Cs measurements were used to derive estimates of the medium-term
average erosion rate in selected fields over the past ca. 50 years and these estimates
were compared with estimates of the short-term erosion in the same fields associated
with winter rainfall falling on a soil compacted by harvesting in the preceding autumn.
6.2 Study Sites
In this study, six maize fields (Figure 6.1) were selected as study sites for investigating
soil erosion rates associated with maize cultivation within the Culm and Tone
catchments. Three of the study fields were located in the Culm Catchment and the other
three were located in the Tone Catchment. All of the fields had been used for maize
cultivation for at least three years in a row since 2002. The maize growing in these
fields was sown during the spring, and harvested in autumn. The soil sampling for the
7Be and 137Cs measurements was carried out in these fields following an extended
period of rainfall in December 2004 and early January 2005, after the maize was
harvested in the autumn of 2004.

98
Figure 6.1: (a) The location of Culm Catchment (Devon) and Tone Catchment (Somerset)
in the Southwest region, and (b) six study fields in the both catchments
(a)
(b)
Tone
catchment
Culm
catchment
Dalwood Farm
Little Landside Farm
Westcott Farm
Cutsey Farm
Higher Woodbrook Farm
Ritherden Farm
River flow
River flow
Cullompton
Bishop’s
Hull

In order to derive quantitative estimates of rates of soil erosion and deposition from 7Be
and 137Cs measurements, it is necessary to establish a reference inventory for each study
field. Estimates of soil redistribution rates for individual sampling points in the field are
derived by comparing the inventory obtained for the sampling point with the reference
inventory measured at a nearby reference site where neither erosion or deposition has
occured. A decrease in the inventory relative to the reference inventory is indicative of
erosion, whereas an increase indicates depositions. The soil sampling for the 7Be and
137Cs measurements from reference sites was carried out at the same time as the
sampling of the six study fields.
6.2.1 Study sites in the Culm Catchment
The study sites in the Culm catchment included three maize fields, at Dalwood Farm,
Little Landside Farm, and Westcott Farm. The location of these fields within the Culm
Catchment is shown in Figure 6.1. The geographical location, physical characteristic
and agricultural history of each field are described below.
6.2.1.1 The Dalwood Farm study site
The Dalwood Farm study site is located, approximately 3 km to the south-east of
Culmstock. The field covers 3.84 ha and the altitude ranges from 170 to 200 m above
sea level, with slope steepness varying between 2.0o to 4.6o. The soil type is the
Bearsted 2 series, which comprises brown earths and podzols, and stoneless sand. This
soil is well drained, with a porous profile (Findlay et al., 1984). Maize has been grown
continuously in this field since 2001 and it had previously been used for grass and
winter wheat. The field used to establish the reference inventory was located nearby,

100
about 30 m from the study field. This flat pasture field had a similar soil type to the
study site and had been under pasture for at least 15 years.
6.2.1.2 The Little Landside Farm study site
The study site at Little Landsite Farm is located in the north-west of the Culm
Cathment, approximately 7 km to the north of Willand, near Sampford Peverell. The
size of the field is 5.62 ha, and its altitude ranges from 150 to 180 m above sea level.
The slope gradient ranges between 2.2o to 6.4o. A small stream rises at the foot of the
slope and drains to the Grand Western Canal. The soil is a typical brown earth, with
some stones, which is representative of the Crediton series. The reference inventory
field was located about 300 m from the study field, and has been under pasture for at
least 15 years.
6.2.1.3 The Westcott Farm study site
The study field at Wescott Farm is located in the western part of the Culm Catchment,
approximately 4.5 km to the west of Willand. The field is relatively small, extending to
approximately 3.3 ha and its altitude ranges from 85 to 100 m above sea level. The
slope gradient ranges from 1.4 to 6.4o. The nearest watercourse to the field is the Grand
Western Canal, which is located about 200 m from the field. The field is underlain by
Permo-Triassic rocks, and the Bromsgrove series soils consist of well-drained reddish
coarse loamy soils, which contain fine and medium grained sands (Findlay et al., 1984).
The field has been used for growing maize since 1999 and was previously cultivated
with winter wheat, potatoes and sugar beet. The reference inventory field is located
about 400 m from the study field and has been under pasture for many years.

101
6.2.2 Study sites in the Tone Catchment
Three maize fields were selected within the Tone Catchment. There were located at
Cutsey Farm, Higher Woodbrook Farm and Ritherden’s Farm, as shown in Figure 6.1.
A detailed description of each field is provided below.
6.2.2.1 The Cutsey Farm study site
The study field at Cutsey Farm is located about 4 km to the east of Wellington and very
close to West Buckland. The field covers 4.1 ha and its altitude ranges between 55 and
70 m above sea level. The field is quite steep, with minimum and maximum slopes of
1.6o and 7.5o, and an average slope of 5.5o. The soil type is the Worcester series, which
is dominated by reddish clayey soils developed on the Permo-Triassic mudstones and
clay shales (Findlay et al., 1984). Maize has been grown in this field since 1994. The
reference inventory field is located about 100 m from the study field, and has been
under pasture for many years.
6.2.2.2 The Higher Woodbrook Farm study site
The study field at Higher Woodbrook Farm is located close to Angersleigh,
approximately 10 km from Taunton. The field covers 11.0 ha and its altitude ranges
between 90 and 130 m above sea level. The slope gradient ranges from 2.3o to 4.8o. The
field is underlain by Permo-Triassic and Carboniferous mudstones and clay shales, and
the soil type is the Whimple 3 series. This type of soil is a reddish fine loamy silt over
clay, and its permeability is very low (Findlay et al., 1984). The field has been used for
maize cultivation since 2002, before which it was cultivated with winter wheat. The
reference inventory field is located about 150 m from the study field and has been under
pasture for many years.

102
6.2.2.3 The Ritherden Farm study site
The study field at Ritherden Farm is located approximately 1.5 km to the south-east of
Wellington. The field covers 3.2 ha and its altitude ranges from 90 to 105 m. The
maximum slope steepness is 5.3o and the slope average is 2.9o. The field is underlain by
Permo-Triassic strata and the soil is the Brockhurst 1 series. This soil type is mainly fine
loam over clay and is associated with low permeability subsoil (Findlay et al., 1984).
This field has been used for maize cultivation since 2002 and had been previously
cultivated with grass, winter wheat and potatoes. The small reference inventory field is
located about 50 m from the study field and has been under pasture for more than 20
years.
6.3 Use of 7Be to Document Short-Term Erosion Rates
6.3.1 Origin of 7Be
7Be is produced in the upper atmosphere by cosmic ray spallation of nitrogen and
oxygen and has a half-life of 53.4 days (Olsen et. al, 1985; Bonniwell et al., 1999). The
production of 7Be in the atmosphere varies both spatially and temporally and is
influenced by both latitude and altitude. Lal et al. (1958) stated that 7Be production is
highest at higher latitudes and relatively constant over the same latitude. In addition,
Brost et al. (1991) reported that 7Be production is greatest in the upper stratosphere, still
significant in the upper troposphere, and least in the lower troposphere.
Olsen et al. (1985) noted that BeO is produced by nuclear reactions, and that its
subsequent deposition onto the land surface occurs as both wet and dry fallout.
Wallbrink and Murray (1996) stated that in most environments 7Be fallout reaching the
soil surface will be rapidly and strongly fixed by the surface soil.

103
It has also been demonstrated by several authors that 7Be fallout occurs primarily as wet
fallout associated with precipitation. Blake (2000) investigated the 7Be concentrations in
rainfall at a study site at Keymelford, near Crediton, Devon. He reported that the 7Be
concentration in the rainfall at Keymelford ranged from 0.23 to 7.44 Bq 1-1. However,
there was no significant correlation between rainfall amount and 7Be concentration, and
this strongly suggests that the principal control of the 7Be fallout is a regional
meteorological effect.
Blake (2000) also reported that the amount of deposition per unit precipitation was
significantly higher in the spring. The spring period accounted for 28.4% of the total
annual 7Be fallout and only 21.4% of the total annual precipitation. However, during
autumn, the 7Be fallout accounted for 37.1% of the annual total and was associated with
41.8% of the total annual precipitation. During winter, 21.0% of the total annual 7Be
fallout was associated with 20.8% of the total annual precipitation.
6.3.2 Use of 7Be to investigate soil redistribution
As indicated in the introduction to this chapter, relatively little work has been
undertaken to date using 7Be as a tracer in soil erosion investigation. Blake et al. (1999)
noted that previous work, such as that by Walling and Woodward (1992) had
demonstrated how 7Be could be used to fingerprint sediment derived from surficial
sources, rather than its use to document soil erosion rates. The reason for this lack of
work with 7Be might be because of the short half-life of 7Be (53.3 days), which can
introduce problems for measuring large numbers of samples before decay reduces
sample activity below the detection level. Work by Blake et al. (1999) has explored the
potential for using 7Be as a short-term tracer in soil erosion investigations for
establishing soil erosion rates and patterns of soil redistribution. The investigation
104
assumed that the 7Be fallout input associated with the period of erosional rainfall was
spatially uniform and that any pre-existing 7Be within the surface soils of the study area
was uniformly distributed across the area. The authors concluded that 7Be could be used
in investigating the magnitude of the erosion rates. Work by Wilson et al. (2003) has
also supported previous work by Wallbrink and Murray (1996), Bonniwell et al. (1999)
and Blake et al. (1999), which showed significant relationships between soil and 7Be
loss, and Wilson et al. (2003) concluded that the erosion rates documented using 7Be
were consistent with the longer-term erosion rates estimated using 137Cs. The results
also demonstrated that 7Be could be used as a tracer to determine areas of erosion and
deposition.
6.3.2.1 Assumptions of the 7Be technique
The use of the 7Be technique in documenting rates and patterns of soil loss in this study
was based on several key assumptions and requirements. A number of potential
limitations and uncertainties were also taken into consideration in the study. Three
important assumptions must be taken in account when using the 7Be technique to
investigate soil erosion to estimate short-term erosion rates. Blake et al. (1999) noted
that, firstly, the fallout input of 7Be associated with the erosional event must be assumed
spatially uniform. Secondly, it is also assumed that any pre-existing 7Be within the
surface soils of the study area is uniformly distributed across the area. Since significant
amounts of 7Be can also be adsorbed or taken up by plants, the presence of vegetation
cover introduces complications and application of the 7Be technique is effectively
limited to bare surfaces or surfaces with very limited vegetation cover.
The reference inventory is established by sampling an adjacent area, where neither
erosion nor deposition has occurred (Zapata et al., 2002). By comparing measurements

105
of the 7Be inventory obtained for sampling points in a field with the reference inventory,
it is possible to identify areas of erosion where the sampled inventory is less than the
reference inventory, and areas of deposition, where the inventory is greater. Estimates
of the amount of erosion or deposition can be derived from the 7Be measurements, using
a conversion model, which relates the gain or loss of 7Be to the amount of soil removed
by erosion or added by deposition.
In this study, the estimates of soil erosion amounts were obtained on the basis of a
single site visit during the winter of 2005 (January) after an extended period of heavy
rainfall. The estimates of soil redistribution were based on individual sampling points
located along representative transects.
6.3.2.2 Converting 7Be measurements into estimates of soil redistribution
In order to convert the 7Be measurement into soil redistribution rates, a profile
distribution model was used. This model is a theoretical method for converting 7Be
measurement into estimates of soil redistribution. The model is applicable to soils that
remain uncultivated during the study period and it was therefore, necessary to assume
that the six study sites had remained uncultivated during the period extending from the
main period of 7Be input to the end of the period of erosion studied. The assumption
was correct, since the study field were previously cultivated in the spring of 2004, prior
to sowing of the maize crop.
The model assumes that the depth distribution of 7Be in the soil can be characterized by
an exponential function (Walling and Quine, 1990; Zhang et al., 1990 and Walling et
al., 2002). Because the depth distribution of 7Be is represented by an exponential
decline with depth, this can be described by an exponential function of the form;

106
C(x) = ce-x / h0 (6.1)
where C(x) is the 7Be activity (Bq m-2), at mass depth x, c is a constant, x is the mass
depth from the soil surface (kg m-2), and h0 is the coefficient describing profile shape
(kg m-2). h0 is also known as a the relaxation mass depth. If the value of h0 increases, the
penetration of 7Be into the soil profile can be assumed to be deeper. The h0 value
obtained for the reference sites and used in this study was 5.4 kg m-2.
The mass depth of soil lost can be estimated using this model by comparing the 7Be
inventory measured at each sampling point within the study field with the reference
inventory. Blake (2000) described in detail a procedure for calculating the spatial
distribution of soil redistribution rates for 7Be. The h0 value is critical in determining
soil redistribution rates, because the measured 7Be inventory at the sampling point will
reflect the depth of soil lost. This can be represented as follows:
A = C(x)dx = Arefeh/h
0 (6.2)
where A is the measured 7Be inventory (Bq m-2), Aref is the local 7Be reference inventory
(Bq m-2), and h is the depth of soil lost (kg m-2). The h value than can be calculated as
follows:
h = h0 1n (A / Aref) (6.3)
Deposition can be assumed to have occurred if the measured 7Be inventory at any point
exceeds the reference value. In this case, the depth of deposition h' (kg m-2) can be
estimated as:
h′ = ( A – Aref ) / Cd (6.4)

107
s s
where Cd is the 7Be concentration of deposited sediment. This value can be estimated
using the mean 7Be concentration of the sediment eroded from eroding points, which
can be calculated as:
Cd = ∫ hCe dS / ∫ hdS (6.5)
where Ce is the concentration of 7Be in soil transported from an eroding point. The Ce
value can be calculated as:
Ce = ( Aref – A ) / h (6.6)
Based on these equations, the soil redistribution rates for 7Be was calculated using the
conversion model software developed by the School of Geography, University of
Exeter. The result will be reported and discussed in the next section.
6.3.3 7Be soil sampling programme
The soil sampling programme used to investigate soil erosion rates within the maize
fields in this study was conducted in mid January 2005, from January 10-12,
immediately after an extended period of winter rainfall, which was known to have
caused erosion in many maize fields within the study area. Available rainfall records
obtained from the Environment Agency for the Hemyock rain gauge station
(representative of the Culm Catchment) and the Clayhanger rain gauge station
(representative of the Tone Catchment), are summarized in Figure 6.2. Heavy rainfall
fell in December 2004 in both catchments, amounting to 85.4 mm and 110.0 mm,
respectively. In the 10 days of early January (from 1 to 10 January 2005) the amount of
rainfall recorded for the Hemyock station was 30.3 mm, whilst the Clayhanger station
recorded 35.7 mm (Figure 6.3). Based on these records, it can be seen that the period

108
December 2004 to early January was associated with ca. 115 mm of rainfall over the
Culm Catchment and ca. 145 mm over the Upper Tone Catchment. As indicated above,
this rainfall caused significant erosion on many maize fields within the study area and
there was evidence of both sheet erosion and minor rilling in many of these fields.
The sampling programme involved the manual collection of shallow soil cores along
two transects extending from the top to bottom of the slope in each study field, using a
15 cm diameter corer to a depth of 30 mm. The number of sampling points along each
transect for each field differed between fields, depending on the length of the slope.
Table 6.1 shows the number of sampling points for each study field.
For each study field, soil cores were also collected from a flat area in an adjacent
cultivated field which had been cultivated in early autumn the previous year to provide a
reference inventory for comparison with the 7Be inventories measured in the field. Nine
bulk soil cores were collected from each reference site using the same equipment and a
similar approach to that employed for the soil sampling in the study fields. In addition,
in order to provide the value of relaxation depth required to convert the observed 7Be
inventories into estimates of soil redistribution, as required by profile distribution
model, a sectioned core was also collected from each reference site. These cores were
sectioned into 5 mm depth increments. All soil samples from the study fields and
reference sites were processed and analysed for 7Be activity, as described in Chapter 3.
All measured activities were decay corrected to the sampling date, and the results
obtained from the measurements of 7Be concentration and the associated estimates of
redistribution are presented in the following section.

109
Figure 6.2: Total rainfall at the Hemyock and Clayhanger rain gauge stations for the period November 2004 to March 2005
Figure 6.3: Total daily rainfall at the Hemyock and Clayhanger rain gauge stations for the period 20 December 2004 to 10 Janaury 2005
Rainfall (mm)
Hemyock station
Clayhanger station
mm
355 356 357 358 359 360 361 362 363 364 365 366 1 2 3 4 5 6 7 8 9 10
(2004) (2005) Julian date

110
Table 6.1: Number of sampling points
Study site Transect
Culm catchment Transect 1 Transect 2
Total
Dalwood 14 11 25 Little Landside 14 11 25 Wescott 12 11 23
Tone catchment Transect 1 Transect 2 Total Cutsey 10 9 19
Higher Woodbrook 14 13 27 Ritherden 15 14 29
6.4 Investigation of Short-Term Soil Erosion in the Study Fields
This section will report and discuss the estimates of soil erosion on maize fields in the
Culm and Tone catchments, derived from measurements of 7Be activity at each of the
study sites. The first part of the section focuses on the 7Be measurements and the
estimates of short-term soil erosion and deposition obtained from these measurements
and the associated patterns along each transect in the six study fields. The second part
discusses the soil erosion and deposition, in terms of gross erosion rates (GER), net
erosion rates (NER), and sediment delivery ratio (SDR).
6.4.1 7Be measurements
Figure 6.4 presents a representative example of the depth distribution of 7Be
documented for the reference sites. This confirms that most of the 7Be is held within the
upper few millimeters of the soil as reported by Blake et al. (1999). Values of h0 the
relaxation depth (see Eq. 6.1), were obtained for each reference site and the mean value
of 5.4 kg m-2 was used for estimating the soil redistribution (Blake et al. 1999).
The mean 7Be inventory values for the individual study fields are compared with the
mean reference inventory value for that field. In all cases, as shown in Table 6.2, the

111
mean 7Be inventory reported for the field is considerably less than the mean reference
inventory.
Figure 6.4: The depth distribution of 7Be in a stable soil profile from a reference site
Table 6.2: The mean inventory and reference inventory values for the study fields
Study field Mean inventory (Bq m-2)
Reference inventory (Bq m-2)
Reduction (%)
Culm Catchment Dalwood 245.8 321.4 30.8
Little Landside 150.3 259.0 72.3 Westcott 278.5 486.0 74.5
Tone Catchment Cutsey 261.9 289.2 10.4
Higher Woodbrook 202.7 235.5 16.2 Ritherden 185.9 295.2 58.8
The highest difference between the reference inventory value and the mean inventory
for the field can be seen for Westcott and Little Landside farms where there are
reductions of 74.5% and 72.3%, respectively. In the case of Cutsey and Higher
Woodbrook farms, the difference between the means measured inventory and the
reference inventory is much less, but the two values are, nevertheless still significantly
different. These results indicate that significant erosion occurred within all study fields
during the period of heavy rainfall that extended from December 2004 until early
January 2005.
7Be activity (Bq kg-1)
Cumulative mass (kg m-2)

112
Figure 6.5 and Figure 6.6 present the values of erosion-deposition (t ha-1) for all six
study fields. The estimated erosion for all sampling points in the study fields of the
Culm Catchment ranged from ca. 0.6 to 121.9 t ha-1. These values are very similar to
those obtained for the fields in the Tone Catchment which ranged from ca. 0.9 to 130.8 t
ha-1.
The information on erosion and deposition presented in Figure 6.5 and Figure 6.6 were
used to derive estimates of gross erosion rates (GER), net soil erosion rates (NER), and
sediment delivery ratio (SDR) for the individual fields. Table 6.3 shows the GER, NER
and SDR values for the six study fields.
The GER value are estimated to range from ca. 21 t ha-1 to 47 t ha-1, whilst the NER
value are estimated to range from ca. 18 t ha-1 to 42 t ha-1. Based on the erosion and
deposition rates presented in Figure 6.5 and 6.6, the SDR values for the six study fields
associated with the period of erosion occurring in December 2004 and early January
2005 were estimated to range between 55% and 95%. These results indicate that a
substantial proportion of the soil eroded from the maize stubble fields was transported
out of the fields and towards the local stream network.
Table 6.3: The values of GER, NER and SDR associated with the estimate of
short-term erosion rate for the six study fields
GER (Gross Erosion
Rate) 7Be (t ha-1)
NER (Net Erosion Rate)
7Be (t ha-1)
SDR (Sediment Delivery Ratio)
(%)
Dalwood 31.3 24.2 77 Little Landside 46.7 42.3 89 Wescott 41.1 38.7 95 Cutsey 21.4 19.7 89 Higher Woodbrook
31.5 18.1 55
Ritherden 34.6 32.6 94

113
The results presented above are judged to confirm that significant erosion occurred in
the six study fields. It is also demonstrates that a significant proportion of the mobilized
soil was transferred out of the fields and therefore that SDR values were quite high.
Most of the eroded sediment was contributed from the top and middle part of the slopes.
A small proportion of the eroded sediment is subsequently deposited at intermediate
points on either the central or lower slopes.
6.5 Use of 137
Cs to Document Longer-Term Erosion Rates
6.5.1 Production of 137
Cs
137Cs is an artificial fallout radionuclide produced by weapon testing during the 1950s
and 1960s, which can therefore be used to document medium term erosion rates. It has a
half-life of ca. 30.2 years. Ritchie and McHenry (1990) stated that most 137Cs reached
the soil surface by wet fallout, and on contact with the soil surface, the radionuclide
rapidly and strongly adsorbed by the soil particles especially by clay and organic
colloids within the soil (Blake, 2000; Tamura and Jacobs, 1960; Owens et al. 1996).
137Cs was globally distributed but the deposition of 137Cs is not spatially uniform.
Blagoeva and Zikovsky (1995) stated that 137Cs fallout was greater in the northern
hemisphere than in the southern hemisphere. Furthermore, Kiss et al. (1988) reported
that in the northern hemisphere the total fallout of 137Cs declines from middle to higher
latitudes, and that within a given region, fallout commonly also varies as a linear
function of the mean annual precipitation.

114
a) Dalwood
Distance (m)
-35
-30
-25
-20
-15
-10
-5
0
0 20 40 60 80 100 120 140 160 180 200 220 240 260Relative height (m
)
Transect A Transect B
-19.723.9
-42.8
-55.8-26.2
-18.0-50.5
38.1-62.4
2.3-19.9
-33.2 -27.4-147.0
-0.6-47.7
-51.1-23.8
19.9-30.2
-40.296.2
-41.1-19.1
-40.0
b) Little Landside
Distance (m)
-25
-20
-15
-10
-5
0
0 20 40 60 80 100 120 140 160 180
Relative height (m
)
Transect A Transect B
-44.5-38.1
-87.5-121.9
-104.1 -40.8-59.1
46.5-92.5
-66.7
-86.54.7
-27.0-41.0
-58.6 -11.051.4
-22.2-59.9 -70.0
-7.2-41.3
-65.2
5.6 -57.1
c) Wescott
Distance (m)
-18
-16
-14
-12
-10
-8
-6
-4
-2
0
0 20 40 60 80 100 120 140 160 180
Relative height (m
)
Transect A Transect B
-70.7-62.2
-26.7 -23.2
-12.3-23.7
-39.0-65.4
-6.0-34.5
4.4
-93.8-70.0
-57.0
18.4
33.4
93.2
-27.3-79.3
-29.1
-30.7-54.8 -54.3
Figure 6.5: Estimates of erosion and deposition derived from 7Be measurements for the two transects representative of three maize fields in the Culm Catchment at
(a) Dalwood, (b) Little Landside, and (c) Wescott
t ha-1
t ha-1
t ha-1

115
a) Cutsey
Distance (m)
-18
-16
-14
-12
-10
-8
-6
-4
-2
0
0 10 20 30 40 50 60 70 80 90 100Relative height (m
)
Transect A Transect B
NA
NA
-46.5
-57.2
-30.3
-50.3
-19.40.97
-21.5
2.54
NA
-47.6 -3.2-0.9
-49.4
5.3
8.8
-30.76.2
b) Higher Woodbrook
Distance (m)
-25
-20
-15
-10
-5
0
0 20 40 60 80 100 120 140 160 180 200 220
Relative height (m)
Transect A Transect B
-62.6-8.9
-74.7
23.5
-66.64.9
35.2-46.7
18.1-10.6
26.9103.6
-52.5-37.9
-53.1
-65.2
-65.6-35.4
-31.0-41.0
-72.0-46.3
5.0-31.8
-34.3-8.8 146.2
c) Ritherden
Distance (m)
-20
-18
-16
-14
-12
-10
-8
-6
-4
-2
0
0 50 100 150 200 250
Relative height (m)
Transect A Transect B
-39.3-48.7
-38.5 -16.9
-52.7-24.0
-54.3
-15.7
-6.59.2
39.8-65.8
11.6 -65.8-67.5
-0.02
-49.6-49.0 -19.0
-18.4 -130.8
-17.4
-16.3
-69.3
-48.8
-28.9
-6.0-46.6
-6.9
Figure 6.6: Estimates of erosion and deposition derived from 7Be measurements for the two transects representative of three maize fields in the Tone Catchment at
(a) Cutsey, (b) Higher Woodbrook, and (c) Ritherdeen
t ha-1
t ha-1
t ha-1

116
137Cs was ejected into the stratosphere beginning in November 1952 during high-yield
thermonuclear weapons tests. It was circulated globally before being deposited on the
landscape. Davis (1963) reported that precipitation rates and the number of surface
nuclear weapon tests would have affected the temporal pattern of deposition of 137Cs on
the landscape. However, global fallout began in 1954, and peaked in 1963 to 1964,
immediately after the Nuclear Test Ban Treaty that was implemented in 1963. In the
absence of further release of 137Cs from weapons testing, fallout subsequently declined
and reached negligible levels by the early 1970s. Cambray et al. (1989) reported a
similar trend in 137Cs deposition fluxes based on their measurements at Milford Haven.
Approximately, 60% of the total fallout of 137Cs from weapons testing could still remain
within the environment. In addition to the thermonuclear weapons tests, in the early
1950s, further inputs of 137Cs to the atmosphere were provided by the Chernobyl
accident in 1986. However, the influence of this incident was essentially restricted to
Europe and areas adjacent to Chernobyl.
6.5.2 The 137
Cs technique
In contrast to the use of 7Be as a fallout radionuclide tracer for documenting short-term
erosion rates, 137Cs method has been developed and successfully employed over the past
few decades. It has been widely applied in many environments to determine sediment
deposition and erosion. The 137Cs measurement technique is widely accepted as an
effective and valuable approach for obtaining information on medium-term rates and
patterns of soil redistribution. Rogowski and Tamura (1970) originally showed
significant exponential relationships between soil loss and 137Cs loss and concluded that
137Cs movement on the landscape was related to soil movement and could be used to
estimate soil redistribution patterns (Zapata, 2003). Since that early work there have
been many important advances in the development and application of the approach.

117
6.5.2.1 Assumptions of the 137
Cs technique
A number of assumptions were made in this study in order to use the 137Cs technique to
document rates and patterns of soil loss from six study fields. The assessment of 137Cs
redistribution is traditionally based on a comparison of measured inventories at
individual sampling points with an equivalent estimate of the inventory representing the
cumulative atmospheric fallout input at the site (Zapata et al. 2002). The cumulative
input or reference inventory can be established by sampling stables sites, where neither
erosion nor deposition has occurred. In this study, a stable site from a pasture field was
available close to each study field.
To derive quantitative estimates of rates of soil erosion and deposition from 137Cs
measurements, which will provide an assessment of medium-term (30.2 years) rates of
soil redistribution, it is necessary to relate the erosion or deposition rate to the
magnitude of the reduction or increase in the 137Cs inventory (Zapata et al., 2002). Mass
balance model III described by Walling and He (1999) was used as the conversion
model to provide the estimates.
Other assumptions that also need to be taken into account are that (1) the distribution of
the total atmospheric fallout of 137Cs over the study field is uniform, (2) the fallout 137Cs
is rapidly and strongly absorbed by soil upon reaching the ground surface, and (3)
subsequent redistribution of 137Cs occurs in association with soil erosion (Walling and
Collins, 2000). The first assumption ensures that the initial spatial distribution of 137Cs
fallout inputs was uniform and any deviations in the measured 137Cs content of soil
samples from the local inventory represent the net impact of soil redistribution during
the period since fallout occurred in the mid 1950s (Walling and Quine, 1990; Walling
and He, 1997; Walling and Collins, 2000). The second and third assumptions are

118
supported by many empirical studies e.g. Livens and Loveland 1988; and Walling and
Collins 2000.
6.5.2.2 Converting the 137
Cs measurements into soil redistribution rates
There are many conversion models that have been used in soil-erosion investigations.
Walling and Quine (1990) classified the models in two categories, namely empirical and
theoretical models. Empirical models are based on a relationship between the erosion or
deposition rate and the percentage loss or gain in the 137Cs inventory, relative to the
reference inventory value, that is derived empirically, using the results from long-term
erosion plots (Walling et al., 2002). The main problems with empirical conversion
models are that the results are not transferable to another area and that they relate to the
period for which the relationship was developed rather than the present.
Theoretical calibration models have also been developed to define the relationship
between the fraction of initial 137Cs lost and the rate of soil loss. One of the most
commonly used theoretical models is proportional model. This model can be used for
estimating soil-erosion rates from 137Cs measurements on cultivated soils. The model is
based on the premise that 137Cs fallout inputs are completely mixed within the plough
layer and the depth of soil lost as a result of erosion during the period since beginning of
137Cs accumulation is directly proportional to the reduction in the 137Cs content of the
soil profile relative to the reference inventory (Walling et al., 2002). However, this
assumption is an over-simplification of the behaviour and accumulation of 137Cs in the
soil because 137Cs will have accumulated in the soil profile over a number of years and a
proportion of the fresh fallout will have remained on the surface and been subject to
removal by erosion prior to cultivation. The model also does not account for dilution of
the 137Cs concentration in the plough layer by incorporation of subsoil as erosion

119
processes and this will cause soil loss to be underestimated. Walling et al. (2002) note
that when the reduction in the 137Cs inventory relative to the reference inventory
exceeds 50%, the proportional model could underestimate the erosion rate by more than
40%.
Quine (1989), Walling and Quine (1990, 1993) and He and Walling (1997) suggested
an alternative approach to overcome the limitations of the proportional model. This
involves the use of mass-balance models to account for the changes in the 137Cs content
of the soil profile through time in response to fallout 137Cs inputs and losses of 137Cs
from the profile due to erosion. In this study, mass-balance model III as described by
Walling and He (1999) was used. The model incorporates the effects of soil
redistribution by tillage. Other mass-balance models, namely mass-balance model I (the
simplified mass-balance model), and mass-balance model II (the improved mass-
balance model), do not take account of soil redistribution caused by tillage.
Mass-balance model I, proposed by Zhang et al. (1990) assumed that the total 137Cs
fallout occurred in 1963. However, this model does not take account of particle size
effects or the fate of fresh fallout prior to incorporate into the soil by tillage. To
overcome this problem, Walling and He (1999) developed mass-balance model II to
take account of the fate of the freshly deposited fallout before its incorporation into
plough layer by cultivation and the effects of particle-size (Walling et al., 2002). Mass-
balance model III, developed by Walling and He (1993) can only be used for a complete
slope with transects parallel to the flow direction, since it assumes down-slope transfer
of soil by tillage. The details of mass-balance model III are described by Walling et al.
(2002).

120
As indicated above, mass-balance III was used in this study as the conversion model to
derive estimates of soil erosion rates from 137Cs measurements. Following Walling et al.
(2002) the down-slope sediment flux from a unit contour length associated with tillage
can be expressed as:
(6.7)
where FQ is the down-slope sediment flux (kg m-1 yr-1), ø is a constant related to the
tillage practice employed (kg m-1 yr-1), and β is the steepest slope angle (o).
ø can be determined as
(6.8)
where Rt,out,1 is the net soil transfer rate (kg m-1 yr-1), L1 is slope length and β1 is slope
angle. Rt,out,1 can be calculated from the measured total 137Cs inventory.
Erosion and deposition are assumed to occur along the transect. For a point
experiencing water erosion, the variation of the total 137Cs inventory A(t) (Bq m-2) with
time can be expressed as:
(6.9)
where Ct,in, Ct,out, and Cw.out is the 137Cs concentrations of the sediment associated with
tillage input, tillage output and water output, respectively, in Bq kg-1.
For a point experiencing water-induced deposition, variation of the total 137Cs inventory
with time can be expressed as:
FQ = ø sin β
Ø = (Rt,out,1L1) / (sin β1)
dA(t)/dt = (1 – Г)I(t) + Rt,in Ct,in (t) – Rt,out Ct,out (t) – Rw Cw.out (t) – λA(t)

121
(6.10)
where Cw.in is the 137Cs concentration of the sediment input from water-induced
deposition (Bq kg-1).
In addition, the 137Cs concentration of soil within the plough layer for a net erosion site
can be described as a function below:
(6.11)
and the 137Cs concentration of soil within the plough layer for a net deposition site can
be expressed as:
(6.12)
where (|R| (R<0) is the net deposition rate.
The 137Cs concentration of water-derived deposited sediment (Cw.in(t')) can be expressed
as:
(6.13)
As for 7Be measurements, and based on theses equations, the soil redistribution rates for
137Cs was calculated using the conversion model software developed by the School of
Geography, University of Exeter.
dA(t)/dt = I(t) + Rt,in Ct,in (t) – Rt,out Ct,out (t) + R'w Cw.in (t) – λA(t)
Cs(t') = A(t') / d
Cs(t') = 1/d [A(t') – (|R|t – 1/d) ∫A(t'')e-λt'' dt''] t0
Cw.in(t') = (1/∫RdS) ∫P' Cw.in(t')RdS s s

122
6.5.3 137
Cs soil sampling programme
The soil sampling programme used to document medium-term rates of soil loss from the
six study fields was conducted from October to November 2004 in the same field where
the 7Be investigation was undertaken. Bulk soil cores were collected at sampling points
spaced uniformly along two parallel transects in each study field, extending from the top
to the bottom of the slope. A metal core tube 69 mm in diameter coupled to a motorized
percussion corer was used to collect cores ranging from 30 to 60 cm depth, depending
on the depth of the soil and the stone content. Soil cores were also collected at the same
pasture fields as for the 7Be investigation to establish the reference inventory.
Information on the number of cores collected from the transects in each field is provided
in Table 6.4. All core samples were dried at 50oC, disaggregated and sieved to < 2mm
prior to gamma assay to determine the 137Cs activity, using the procedures described in
Chapter 3 (Section 3.3.1.1).
Table 6.4: Number of sampling points
Study site Transect
Culm Catchment Transect 1 Transect 2
Total
Dalwood 13 11 24 Little Landside 14 11 25 Wescott 12 9 21
Tone Catchment Transect 1 Transect 2 Total Cutsey 9 7 16 Higher
Woodbrook 14 13 27
Ritherden 15 14 29
6.6 Investigation of Longer-Term Soil Erosion Rates
Reporting and discussion of the rates and patterns of longer-term soil erosion rates
associated with the study fields in the Culm and Tone catchments derived from 137Cs
measurements follows a similar approach to that employed for the 7Be measurements.

123
6.6.1 137
Cs measurements
As shown in Table 6.5, the mean inventory values for the sampled fields are in all cases
significantly lower than the local reference inventory, indicating that erosion has
occurred in all the study fields. The greatest difference between the mean inventory and
the reference inventory value (23.4%) is found at Little Landside Farm, whilst the
smallest difference (7.2%) is found at Higher Woodbrook Farm. In the case of Cutsey
and Higher Woodbrook farms, the mean inventory value shows only a limited reduction
relative to the reference inventory.
Figure 6.7 and Figure 6.8 show the erosion-deposition values (t ha-1 yr-1) documented
for each sampling point in the six study fields in the Culm and Tone catchments. Both
erosion and deposition are also evident along each transect in all study fields. As noted
in both figures, the NA refers to NOT AVAILABLE. This is because the first sampling
point is used in mass-balance model III to initiate the calculations and must be an
eroding point. The estimates of erosion rates for the individual sampling points in the
three study fields in the Culm Catchment range from ca. 0.4 to 40 t ha-1 yr-1 whilst for
the Tone Catchment they range from ca. 0.1 to 24.1 t ha-1 yr-1.
Table 6.5: The mean inventory and reference inventory values
Study field Mean inventory (Bq m-2)
Reference inventory (Bq m-2)
Reduction (%)
Culm Catchment Dalwood 2127.8 2400.2 12.8 Little Landside 1966.6 2427.8 23.4 Westcoot 1918.3 2114.0 10.2
Tone Catchment Cutsey 1579.4 1703.8 7.9 Higher Woodbrook
1866.0 2000.0 7.2
Ritherden 1755.4 1950.2 11.1
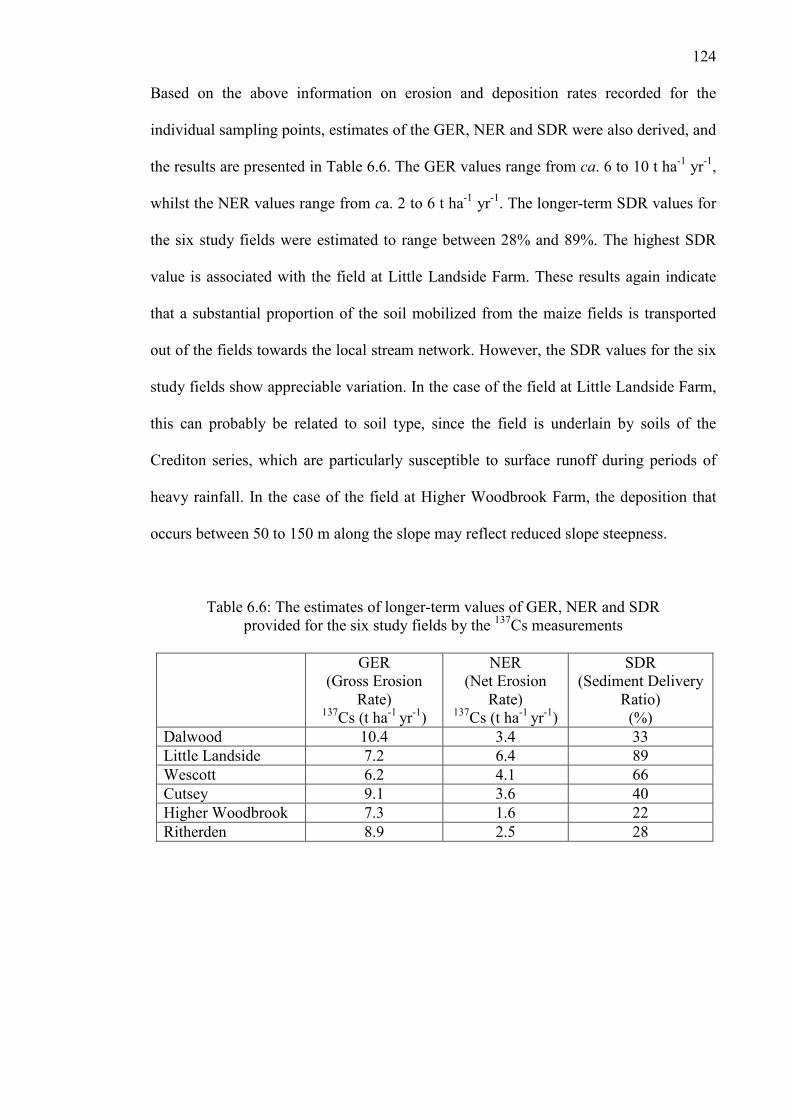
124
Based on the above information on erosion and deposition rates recorded for the
individual sampling points, estimates of the GER, NER and SDR were also derived, and
the results are presented in Table 6.6. The GER values range from ca. 6 to 10 t ha-1 yr-1,
whilst the NER values range from ca. 2 to 6 t ha-1 yr-1. The longer-term SDR values for
the six study fields were estimated to range between 28% and 89%. The highest SDR
value is associated with the field at Little Landside Farm. These results again indicate
that a substantial proportion of the soil mobilized from the maize fields is transported
out of the fields towards the local stream network. However, the SDR values for the six
study fields show appreciable variation. In the case of the field at Little Landside Farm,
this can probably be related to soil type, since the field is underlain by soils of the
Crediton series, which are particularly susceptible to surface runoff during periods of
heavy rainfall. In the case of the field at Higher Woodbrook Farm, the deposition that
occurs between 50 to 150 m along the slope may reflect reduced slope steepness.
Table 6.6: The estimates of longer-term values of GER, NER and SDR provided for the six study fields by the 137Cs measurements
GER
(Gross Erosion Rate)
137Cs (t ha-1 yr-1)
NER (Net Erosion
Rate) 137Cs (t ha-1 yr-1)
SDR (Sediment Delivery
Ratio) (%)
Dalwood 10.4 3.4 33 Little Landside 7.2 6.4 89 Wescott 6.2 4.1 66 Cutsey 9.1 3.6 40 Higher Woodbrook 7.3 1.6 22 Ritherden 8.9 2.5 28

125
a) Dalwood
Distance (m)
-35
-30
-25
-20
-15
-10
-5
0
0 20 40 60 80 100 120 140 160 180 200 220 240 260Relative height (m
)
Transect A Transect B
-19.24.3
-7.5
1.24.8
1.6-10.8
6.06.2
-5.0-0.4
NA -28.5-5.6
-0.9-18.7
17.6-9.0
-7.0-18.3
3.9-7.8
-15.712.3
-13.8
b) Little Landside
Distance (m)
-25
-20
-15
-10
-5
0
0 20 40 60 80 100 120 140 160 180
Relative height (m
)
Transect A Transect B
-40.0-1.6
-0.4-0.4
-1.6 -2.1-9.9
-5.9-13.2
-11.4
-3.1-6.6
-4.17.3
-40.0 -10.5-5.0
2.8-3.2 -6.2
-8.8-8.2
-1.0
-6.4 -3.0
c) Wescott
Distance (m)
-18
-16
-14
-12
-10
-8
-6
-4
-2
0
0 20 40 60 80 100 120 140 160 180
Relative height (m
)
Transect A Transect B
NANA
-7.5 -1.5
-0.45.2
-20.9-1.2
-14.8-1.7
10.4
-22.4-9.2
-2.2
-9.9
-3.6
1.5
-0.3-0.6
1.5
-3.512.9 -6.7
Figure 6.7: 137Cs estimates of erosion and deposition for the two transects representative of three maize fields in the Culm Catchment at (a) Dalwood,
(b) Little Landside, and (c) Wescott
t ha-1 yr-1
t ha-1 yr-1
t ha-1 yr-1

126
a) Cutsey
Distance (m)
-18
-16
-14
-12
-10
-8
-6
-4
-2
0
0 10 20 30 40 50 60 70 80 90 100Relative height (m
)
Transect A Transect B
NA
-13.1
-0.4
-8.1
-6.7
2.6
1.84.2
10.1
-3.4
NA
NA -5.8-9.2
-22.0
-12.2
10.2
9.2-3.0
b) Higher Woodbrook
Distance (m)
-25
-20
-15
-10
-5
0
0 50 100 150 200 250
Relative height (m
)
Transect A Transect B
-12.610.3
-12.7
-0.59.7
2.1-9.7
2.18.5
7.5-3.4 -4.8 -6.7
-3.9
-19.0-4.4
-1.4 1.24.1
-23.92.0
-2.7 2.3-3.4
-4.96.5
4.4
c) Ritherden
Distance (m)
-20
-18
-16
-14
-12
-10
-8
-6
-4
-2
0
0 50 100 150 200 250
Relative height (m)
Transect A Transect B
-18.4-5.3
-8.7 19.8
-3.1-0.1
-9.0
-6.9
-9.413.8
9.4-7.3
-3.7 1.35.9
-24.1
-12.8-13.4 1.7
-6.3 40.0
-2.1
-17.1
-14.5
-3.6
9.3
-18.8-2.7
1.4
Figure 6.8: 137Cs estimates of erosion and deposition for the two transects representative of three maize fields in the Tone Catchment at (a) Cutsey,
(b) Higher Woodbrook, and (c) Ritherdeen
t ha-1 yr-1
t ha-1 yr-1
t ha-1 yr-1

127
6.7 Discussion of the Estimates of Short-Term and Longer-Term Erosion Rates
Provided by the 7Be and
137Cs Measurements
The estimates of gross and net erosion provided by the 7Be and 137Cs measurements, as
shown in Table 6.3 and Table 6.6 and conflated in Table 6.7 provide a valuable basis for
assessing the impact of maize cultivation in increasing winter erosion rates. In the case
of 7Be, it must be recognized that the values of gross and net erosion were related only
to the period of heavy rainfall occurring in late December 2004 and early January 2005.
These are likely to underestimate the annual rate of soil redistribution. Equally, in the
case of 137Cs, it is important to recognize that the estimates of mean annual soil
redistribution will include the periods when the study fields were cultivated for maize.
Therefore, the erosion estimates based on the 7Be measurements are likely to
underestimate the annual erosion rate and the estimates based on the 137Cs
measurements are likely to overestimate the longer-term mean annual erosion rate
associated with cultivation of other crops or other land use. It is therefore important to
note that any assessment of the increase in erosion rates associated with maize
cultivation, based on this study should be seen as a minimum estimate of the increase.
According to the information presented in Table 6.7, it can be suggested that maize
cultivation causes the mean for GER associated with the study fields to increase by 4.2
times, whilst the mean NER increases by 8.1 times. For two study fields (Little
Landside and Westcott) the GER increased at least by 6 times, compared to the longer-
term erosion rate. In terms of NER, all the study fields shows very high increases,
particularly the study fields of Ritherden, Higher Woodbrook and Wescott, where
increases of 13, 11.3 and 9.4 times, respectively, were documented. In addition, the
study field at Ritherden provided the highest increase of SDR, which is 3.3 times
greater. Other fields such as Dalwood, Cutsey and Higher Woodbrook show an increase

128
in SDR by at least 2 times. The increases of SDR, therefore, account for the greater
increase in NER, relative to the increase in GER for most study fields. The increases in
GER, NER and SDR indicate that the heavy winter rainfall associated with the study
period, combined with the condition of the maize fields during the post-harvest period
caused short-term erosion rates to increase significantly over the longer-term values.
These findings can be compared with those reported by Walling et al. (1999a), who
used similar approach involving 7Be and 137Cs measurements to study the impact of
maize cultivation on winter erosion rates in another field in Devon. They reported that
both GER and NER were about 5 times greater than the longer-term mean annual
erosion.
Table 6.7: Comparison of GER, NER and SDR of short- and longer-term soil erosion, represented by 7Be and 137Cs
GER NER SDR
Fields
7Be (t ha-1)
137Cs (t ha-1 yr-1)
Increase (times)
7Be (t ha-1)
137Cs (t ha-1 yr-1)
Increase (times)
7Be (t ha-1)
137Cs (t ha-1 yr-1)
Increase (times)
Dalwood 31.3 10.4 3 24.2 3.4 7.1 77 33 2.3
Little Landside 46.7 7.2 6.5 42.3 6.4 6.6 89 89 0
Wescott 41.1 6.2 6.6 38.7 4.1 9.4 95 66 1.4
Cutsey 21.4 9.1 2.3 19.7 3.6 5.5 89 40 2.2
Higher Woodbrook 31.5 7.3 4.3 18.1 1.6 11.3 55 22 2.5
Ritherdeen 34.6 8.9 3.9 32.6 2.5 13 94 28 3.3
Mean 34.4 8.2 4.2 29.3 3.6 8.1 83 46 1.8
The findings reported above can be seen as reflecting the magnitude of the rainfall
during the winter period and the condition of the maize fields in the post-harvest period.
Since the growing of maize as a fodder crop in England has only expanded greatly
during the past 10-15 years, any increase in erosion rates can be expected to have a
limited effect on the longer-term erosion rates as estimated from the 137Cs
measurements (Walling et al. 1999a). However, based on field observation and

129
interview with maize growers, recently, many maize fields are frequently left bare after
the maize harvest. This condition can increase erosion rates associated with heavy
winter rain.
As mentioned above, in the case of the Little Landside field, the SDR values for the two
time periods were the same. This indicates that, at least for this field, the increased
erosion rates associated with maize cultivation were not associated with a change in the
proportion of the mobilized sediment exported from the field. However, if the mean
value of SDR is taken to represent the situation of maize cultivation in England, or at
least for the Culm and the Tone catchments, it is clear that maize cultivation increases
both gross erosion rates and the proportion of the mobilized sediment that is exported
from the fields towards the watercourses. The latter increase is particularly significant in
terms of the potential for increased sediment inputs to river systems and degradation of
aquatic habitats.
The results from this study also demonstrate that the sediment delivery ratios associated
with individual fields can vary significantly. In the case of 7Be, the SDR was reported
high for five study fields, ranging from 77-95%. In the case of 137Cs, only one study
field indicated a high SDR of 89%, whilst the SDR for the other study fields ranged
from 22-66%. These findings are similar to the SDR of ca.80% reported by Walling et
al. (1999a) for another maize field in Devon. In general, the SDR values for both 7Be
and 137Cs, emphasize the potential for high connectivity between slopes and the stream
network, although it is possible that a significant proportion of the sediment leaving the
study fields may be trapped and stored before reaching the stream network.

130
As an example, the field at Little Landside Farm documented the highest NER and very
high SDR of 89% for both tracers. These could reflect both soil type (Crediton series of
sandy loams) and the steepness of the slope, especially in the middle part of the field.
The soil type is easily detached by raindrops since the soil strength after harvest is low.
Studies by Fox and Bryan (1999) and Porto et al. (2003) have confirmed that runoff and
rainsplash on sandy loams soil are conducive to increased soil loss.
In terms of slope steepness, in the case of the field at Little Landside Farm, the gradient
of the slope from top to the middle part of the slope (0-100 m) continuously increases
up to 6.2o, and this would encourage rapid runoff and increase the rate of surface
erosion. Experiments reported by Fox and Bryan (1999) demonstrate the influence of
slope gradient in increasing erosion rate, where rain-impacted flow erosion was
significantly related to slope gradient and promoted more sediment mobilization. Other
studies by Fox et al. (1997), Huang and Bradford (1993) and Mathier et al. (1989) have
also demonstrated that slope gradient exerts a significant influence in increasing
erosion.
In addition of soil type and slope steepness, the length of slope can also be expected to
influence the pattern and rate of soil erosion. In this study, the length of slope for all
fields, with the exception of that for the field at Cutsey Farm, is more than 150 m.
Although this study does not investigate the relationship between slope length and soil
erosion rate, the author believes that variation in the rate of soil erosion between the
study fields also reflects the influence of slope in promoting soil loss as reported by
Mathier et al. (1989), El-Swaify (1997) and Gabriels (1999).

131
Loughran et al. (1987) also indicated that soil loss was significant correlated with slope
length, in the case of the upper basin of the Jackmoor Brook in Devon. However, there
was no statistically significant relationship in the lower part of the Jackmoor Brook
basin. These findings could also be related to slope steepness, since the upper part of the
Jackmoor Brook basin is steeper compared to the lower part of the basin. In terms of
this study, the field at Higher Woodbrook Farm probably provided the best example.
The field is located in the lower part of the Tone Catchment with elevation less than 130
m above sea level and slope gradient ranges up to ca. 5o, with slope length more than
200 m. However, for the both tracers, the SDR for this field is the lowest (55% for 7Be
and 22% for 137Cs).
In addition, as mentioned in introductory chapter, the use of the heavy harvesting
machinery compacts and destroys the structure of the surface soil. These conditions
would also promote erosion as infiltration would decrease, and detachment of soil
would increase. Investigations reported by Basher and Ross (2001) indicated that the
infiltration rate for uncultivated wheel tracks was very low; thereby generating high
volumes of runoff and transporting more sediment beyond the field. Earlier, Fullen
(1985) also indicated that compaction by agricultural machinery increased soil erosion,
as the rate of infiltration also decreased. His investigation showed that compacted
subsoils impeded infiltration and so contributed to surface runoff and serious topsoil
erosion (Fullen, 1985).
The findings presented in this section have important implication for further assessment
of the impact of the expansion of maize cultivation in England on soil erosion. It is also
suggested that erosion rates caused by maize cultivation have the potential to contribute
to diffuse source pollution and sediment-related problems in nearby watercourses.

132
6.8 Conclusion
This chapter presents findings for short- and longer-term soil erosion rates obtained
from 7Be and 137Cs measurements from the six study fields associated with maize
growing. Quantitative estimates of short-term rates of soil erosion-deposition based on
7Be measurements were assembled using a profile distribution conversion model, whilst
mass balance model III has been used to estimates the longer-term rates of soil
redistribution from measurements of 137Cs. The results clearly highlight the potential
magnitude of the increase in soil erosion caused by maize cultivation associated with
leaving bare compacted stubble fields exposed to the ensuing winter rainfall. The results
indicate a mean increase of NER by 8 times and a mean increase in SDR by 2. Both
changes will result in increased sediment inputs to the river system. The next chapter
will discuss further the off-site impact of maize cultivation, in terms of suspended
sediment fluxes in the Rivers Tone and Culm.

133
CHAPTER 7: RIVER MONITORING AND SEDIMENT INVESTIGATIONS IN
THE RIVERS CULM AND TONE
7.1 Introduction
The previous chapter has discussed soil erosion rates associated with maize cultivation
in the Culm and Tone catchments. In this chapter, attention turns from the fields to the
river and focuses on the results of the river monitoring and sediment investigations
undertaken in the Rivers Culm and Tone. This work aimed to assess the downstream
impact of the maize cultivation.
As indicated in the introductory chapter, one of the most serious off-site environmental
impacts associated with maize cultivation in the United Kingdom is the potential
degradation of river water quality during the winter period and the impact of the
increased sediment flux in degrading aquatic habitats. These problems are closely linked
to late harvests and the occurrence of bare compacted soil surfaces in the maize fields
during the winter period after harvest. In order to explore further the off-site impact of
maize cultivation on the receiving river, the following discussion of the results of the
sediment investigation is divided into two sections. The first section focuses on
assessment of suspended sediment transport by the Rivers Culm and Tone and the
possible impact of sediment inputs from eroding maize fields during the winter period
on the magnitude of the sediment loads, and the second section focuses on the
geochemical properties of the suspended sediment and their possible links with
sediment mobilized from the areas of maize cultivation in both river basins.
7.2 The River Monitoring and Sediment Investigation Programme
One of the main objectives of river monitoring in sediment studies is frequently to
quantify the suspended sediment load, in order to obtain information on slope-channel

134
connectivity and delivery of fine sediment to watercourses. However, to establish an
effective river monitoring programme is always challenging, in terms of selecting
suitable points or locations for the monitoring stations. The process of choosing suitable
monitoring points must be related to the objective of the study and other factors such as
the size of the river basin, measurement techniques, availability of pre-existing data, and
the environmental characteristic of the river basin.
The outlet of a river basin is commonly selected as the most appropriate point for
establishing a river monitoring programme, and many water pollution, sediment
delivery and sediment budgets investigations have selected the river basin outlet as a
monitoring point (Blake, 2000; Walling et al., 2006). In some cases, additional river
monitoring and suspended sediment sampling are also carried out on tributaries,
especially major tributaries (Wass et al., 1997; Walling et al., 1999b; Heywood and
Walling, 2003; Smith et al., 2003; Walling, 2005; Evans et al., 2006) or along the
targeted river network (Kenworthy and& Rhoads, 1995; Minh et al., 2007; Vanacker et
al., 2007), to help in providing additional information for individual sub-catchments.
Each approach has its own advantages. Within the constraints of this study, the outlet
approach has been favoured and emphasis has been placed on documenting the
suspended sediment load via turbidity monitoring. Further details of the river
monitoring programme are provided below.
The focus of river monitoring in sediment studies is commonly on collecting data on
suspended sediment concentrations or turbidity. The former relies on collection of water
samples, either manually or automatically. Ideally, the sampling programme should aim
to define the record of variation of sediment concentration in the river and this is likely
to involve an intensive sampling programme in small catchments where sediment

135
concentrations can fluctuate rapidly. The availability of personnel for sampling and
laboratory facilities for analysing the samples frequently exerts an important control on
the scope for implementing an effective sediment sampling programme. The use of
turbidity measurements aims to avoid the need for intensive sampling and involves the
continuous recording of turbidity and conversion of the record of turbidity to a record of
suspended sediment concentration (SSC), using a field-derived calibration relationship.
Since turbidity can be recorded continuously, it is possible to obtain a continuous record
of sediment concentration. Sampling is still required in order to derive the calibration
relationship and it is therefore important that such sampling should cover a wide range
of turbidity and sediment concentration. Wass et al. (1997) have argued that the
existence of a close relationship between both parameters has been established in a wide
range of watercourses and it is now generally expected that an adequate calibration
relationship between suspended sediment concentration and turbidity can be established
(Gippel, 1989).
Suspended sediment transport by the Rivers Culm and Tone was monitored between
November 2004 and March 2005, which corresponded to the main period of erosion and
sediment delivery of the 2004-5 winter period. As reported in the methodology chapter,
the station for the River Culm was located at the Environment Agency Woodmill
gauging station, and that for the Tone was located at the Environment Agency Bishop’s
Hull gauging station.
An in situ turbidity sensor was installed at each site and these were used to provide
continuous records of turbidity which were in turn used to derive continuous records of
suspended sediment concentration. The sensor was linked to a data logger and turbidity
was recorded at 15 minutes intervals. A self-cleaning sensor was used to minimize

136
problems associated with the fouling of the optical lens. Calibration of the turbidity
probes involved two components. Firstly, to ensure that the turbidity meter provided
reliable absolute data, routine calibration was undertaken over the period of deployment
of the turbidity probe, in order to confirm its stability. This calibration was undertaken
using a formazin reference standard. Secondly, it was necessary to develop a field-
derived calibration relationship for each of two sites that related the turbidity to the
sampled suspended sediment concentration in the river.
In order to establish the relationships between suspended sediment concentration and
turbidity for the two sites, suspended sediment samples were collected from the two
rivers during a representative range of flood events. The procedures for surface water
sampling have been described in Section 3.2.4 in the methodology chapter. Overall,
twenty water samples were collected from each catchment between November 2004 and
March 2005. In addition, bulk water samples were also collected during flood events to
provide larger quantities of sediment for further analysis. The procedures employed
have also been explained in the same section.
The next section will report the data assembled for the two monitoring stations on the
Rivers Tone and Culm.
7.3 Results from the Sediment Monitoring Programme
7.3.1 The relationships between sediment concentration (SSC) and turbidity (FTU)
As shown in Figure 7.1, the relationships between suspended sediment concentration
and turbidity were well defined for both catchments. They were characterized by r2
values of 0.983, in the case of Bishop’s Hull station, and 0.988 for the Woodmill
station. Although both rivers provided a clear positive relationship between SSC and

137
turbidity (T), there is some scatter in both relationships, which can be related to
variations in the grain size and mineralogy of the sediment associated with individual
samples. The equations for both rivers have been used to derive an estimated SSC for
the recorded values of turbidity. The calibration equation for the River Tone is SSC =
1.0936T + 13.138 whilst that for the River Culm is SSC = 1.1984T + 6.48. Figure 7.2
presents the synthesis records of SSC for the study period for the Rivers Tone and
Culm.
In the case of River Culm, the average value of SSC for the period November 2004 to
March 2005 was 53.1 mg l-1 which is higher than the equivalent value for the River
Tone (Table 7.1). It is clear that both the rivers are turbid and transport considerable
amounts of suspended sediment during the winter period. This may possible be linked to
the high rates of net soil loss from the bare maize fields during the same period
demonstrated by the 7Be measurements reported for selected fields in the Tone and
Culm catchments in Chapter 6.
7.3.2 Estimation of sediment load (SSL) and sediment yield (SY)
The suspended sediment load of the Rivers Culm and Tone for the study period were
estimated using the records of water discharge for the flow gauging stations and the
records of suspended sediment concentration derived from the continuous turbidity
records. Calculations were based on the daily mean values of discharge and sediment
concentration.

138
(a) Bishop’s Hull station
(b) Woodmill station
Figure 7.1: The relationships between suspended sediment concentration and turbidity established for (a) the River Tone at the Bishop’s Hull gauging station, and
(b) the River Culm at the Woodmill gauging station
FTU
SSC
FTU
SSC
n = 20 P < 0.001
n = 20 P < 0.001

139
(a) Estimated SSC record for the River Tone for the study period,
based on the turbidity record
(b) Estimated SSC record for the River Culm for the study period, based on the turbidity record
Figure 7.2: Estimates of daily mean SSC for the two study catchments for the study period November 2004 to March 2005
306 312 318 324 330 336 342 348 354 360 366 5 12 18 24 30 36 42 48 54 60 66 72 78 84 90
Julian date
306 312 318 324 330 336 342 348 354 360 366 5 12 18 24 30 36 42 48 54 60 66 72 78 84 90
Julian date
mg l-1
mg l-1

140
i=l
n
Table 7.1: Mean values of estimated SSC (mg l-1) for the Rivers Tone and Culm during the study period
River Tone River Culm
Estimated mean SSC (mg l-1) Estimated mean SSC (mg l-1) November 2004 22.5 46.9 December 2004 52.8 64.8 January 2005 31.9 60.9 February 2005 24.6 40.1 March 2005 51.8 39.1 Mean* 37.1 53.1
*The mean value is based on the records of turbidity and estimated SSC for the period from November 1st 2004 to 31st March 2005
The calculation of SSL is based on following formula:
SSL = ∑ (CiQi) (7.1)
where Ci is the suspended sediment concentration and Qi is the water discharge. The
results are presented in Table 7.2.
Table 7.2: Estimated values of SSL and SY for Rivers Tone and Culm
River Tone River Culm SSL (t) SY (t km-2) SSL (t) SY (t km-2)
November 2004 145.3 0.7 446.2 2.0 December 2004 1,322.7 6.4 960.2 4.3 January 2005 497.3 2.4 722.7 3.2 February 2005 283.7 1.4 640.6 2.9 March 2005 390.9 1.9 399.4 1.8 TOTAL 2,639.9 12.8* 3,169.1 14.2* *The total value is based on the records of SSL for the period from November 1st 2004 to 31st March 2005
The suspended sediment load for the River Tone for the study period is estimated to be
2,639.9 tonnes and that for the River Culm is estimated to be 3,169.1 tonnes. It is also
important to note that the maximum sediment loads were transported by both rivers in
December and January, when most rainfall occurred.

141
Based on the SSL values, the suspended sediment yields (SY) for the two catchments
can be calculated using formula below:
SY = SSL/A (7.2)
where SY is the yield, SSL is the sediment load and A is the catchment area.
The Tone Catchment has a catchment area of 206.8 km2, whilst the River Culm
Catchment has an area of 222.4 km2. As shown in Table 7.2, the sediment yield of the
River Culm is slightly greater than that of the River Tone during the study period. This
could suggest that the area of maize cultivation in the Culm Catchment may be a more
important sediment source than in the River Tone. However, although the SY value for
River Culm is higher than River Tone, the difference is small. Overall, there would
seem to be no great difference between the loads transported by the Rivers Culm and
Tone.
7.3.3 Comparison of the sediment loads of the Rivers Culm and Tone with
estimates of the sediment generated by erosion of the maize fields during the
study period
It is useful to compare the estimates of the sediment loads of the Rivers Culm and Tone
derived above with an estimate of the sediment input to the two rivers from eroding
maize fields within their catchments, in order to obtain an indication of the likely
importance of the latter input to the sediment loads of the rivers. Although it is not
possible to derive an accurate value for the amount of sediment mobilized from the
eroding maize fields during the study period, a tentative estimate can be obtained from
the results of the 7Be measurements reported previously. These provide estimates of net
rates of soil loss for three fields located in each of the two catchments. These values
have been used to provide a representative mean value of soil loss from eroding maize
fields in the Culm and Tone Catchments during the study period. Combination of this

142
values with information on the total area of maize fields within each catchment (i.e.
855.0 ha in the Culm Catchment and 832.5 ha in the Tone Catchment) provides an
estimate of the total net soil loss from the maize fields. These values are 30,010.5 t for
the River Culm Catchment and 19,563.7 t for the River Tone Catchment. It is however
important to recognize that these values of net soil loss represent estimates of the net
soil export at the boundaries of the fields. A significant proportion of this sediment is
likely to be deposited before reaching the stream network and this conveyance loss must
be taken into account. The precise magnitude of the conveyance loss for an individual
field will vary according to the location of the field relative to the stream network and
the nature of the topography within the area between the field and the stream channel.
As reported in Chapter 5, most of the maize fields (ca. 60%) in both catchments are
located between 100-500 m from the nearest stream network. This limited distance is
likely to promote reasonably efficient delivery of sediment to the stream networks, but
significant conveyance losses are still likely. Walling et al. (2002) report a study aimed
at constructing sediment budgets for the small Rosemaund and New Cliftonthorpe
catchments in the English Midlands. This work attempted to link the net soil loss from
individual fields to the sediment input to the channel system and estimated that the
field-channel conveyance loss was of the order of 80%. Since the topography and
drainage density of the Rosemaund and Cliftonthorpe catchments were similar to those
of the Culm and Tone catchments, a field to channel conveyance loss of 80% has been
assumed and combined with the estimates of net soil loss from the maize fields in two
catchments to estimate the likely sediment input to the river system (see Table 7.3).

143
Table 7.3: A comparison of the estimates of sediment input to the river systems of the Culm and Tone catchments from the maize fields during the new winter of 2004-5 with
the measured suspended sediment load for this period
Catchments Sediment input (t) Sediment load (t) (a) (b)
Culm
Tone
6,002.1
3,906.7
3,169.0 5,282.0
2,640.0 4,400.0 (a) Measured load at catchment outlet (b) Estimate of total sediment input to the channel system from the catchment
These estimates of sediment input from the maize fields to the channel systems of the
Culm and Tone catchments could be seen as inconsistent with the measured sediment
loads for the same period, in that they are significantly greater. However, it must be
recognized that a significant proportion of the suspended sediment load passing through
the river system during flood events is likely to be deposited within the channel system
and more particularly on the river floodplains. Walling (2008) reviewed existing
evidence of the magnitude of such in-channel conveyance losses and concluded that
they were typically about 40%. Using this value, the total sediment input to the channel
systems of the Culm and Tone catchments can be estimated as 5,282 t and 4,400 t,
respectively. Using these estimates of the total sediment input to the channel system of
the Tone and Culm catchments, the estimated contribution from maize fields in the
Culm catchment still exceeds the total input, but the contribution from maize fields in
the Tone catchment is slightly less than the total input. However, as discussed below,
these results still point to some inconsistencies in the estimation of the inputs to the
channel system from the maize fields.
The apparent inconsistencies between the estimates of sediment input to the river
systems within the Culm and Tone Catchments from the maize fields highlighted above,
introduce problems for any attempt to compare the two values. The value obtained for

144
the sediment input from the maize fields, should not exceed the measured sediment
load, when account is taken of channel and floodplain conveyance losses within each
catchment. The maize fields only occupied ca. 4% of two catchments and it is
unreasonable to assume that the remaining 96% of the catchment will have a zero or
minimal sediment contribution. These stream and river channels must also be expected
to make some contribution to the total load passing through the river system. It would
seem that field to channel and in-channel/floodplain conveyance losses may have been
underestimated. Further work is clearly required to resolve these uncertainties.
However, based on the results presented in Chapter 6, it can be suggested that the
introduction of maize cultivation is likely to have increased net soil losses from the
maize fields by ca. 8 times. If maize fields occupy ca. 4% of the two catchments and the
net soil loss from the non-maize growing areas is substantially less than 10% of that
estimated for the maize fields (e.g. 5%), due to the presence of significant areas of
grassland with low net soil loss, it could be suggested that the maize fields and non-
maize fields contribute approximately the same amount of the sediment to the overall
sediment yields of the two catchments. This tentative conclusion emphasizes the
potential important of the off-site impact of maize cultivation in increasing the sediment
loads of the Culm and Tone Catchments.
Further information on the likely importance of sediment mobilized from maize fields
within the study catchments to the sediment loads of the study rivers has been obtained
by comparing the geochemical properties of the sediment transported by the two rivers
during the study period with those of sediment mobilized from maize fields.

145
7.4 Analysis of Sediment Properties
Twenty four samples of surface soil were collected randomly from a representative
selection of individual stubble maize fields within the Culm and Tone catchments, in
order to compare the properties of suspended sediment and surface soil from the maize
fields and thereby assess the likely contribution of maize fields to the sediment loads of
the study rivers. In the case of suspended sediment, 5 bulk samples from both
catchments were analysed. The procedures employed are explained in Section 3.2.3.
As detailed in Chapter 3, a suite of geochemical properties has been used to characterize
the sediment mobilized from eroding maize fields and the suspended sediment
transported by the two study rivers. These properties include heavy metals, base cations,
total organic carbon and nitrogen, and total phosphorus. The Mann-Whitney U–test was
applied to each parameter to identify the link between surface soil samples and
suspended sediment samples. The test involves assessing whether the differentiation
between the mean values of each individual parameter for surface soils from maize
fields and suspended sediment samples are statistically significant. The distinguishing
process was based on the critical probability value of P<0.05. If the probability value for
a given parameter is below than critical value, the assumption has been made that this
parameter shows no link between surface soils and suspended sediment samples
collected from the rivers.
Table 7.4 presents the results from the Mann-Whitney U-test for each parameter for
both the Rivers Culm and Tone. The results confirm that not all parameters provide
evidence of a link between surface soil collected from bare maize fields and suspended
sediment in the river. The total carbon (C), nitrogen (N) and sodium (Na) concentrations
provide no evidence of a link between surface soils and suspended sediment. However,

146
the P (inorganic and organic) values for the River Tone suggested that a significant
proportion of the suspended sediment could be contributed from bare maize fields
within the catchment. Six metals (Cr, Cu, Fe, Pb-206, Pb-207, Pb-208) also showed a
statistically significant link between the concentrations associated with surface soil from
maize fields and with suspended sediment from the two study rivers. This indicates that
these metals show strong connectivity between surface soils and suspended sediment.
The chemical analysis results of suspended sediment in the Rivers Culm and Tone
demonstrates that Fe, and Pb-206, 207, and 208 could be useful tracers when
considering the link between eroded surface soils from bare maize fields and suspended
sediment in the winter period. However, the results for C, N, Na, Zn, Sr and Al do not
demonstrate a direct link between the eroding maize fields and the sediment load
transported by the study rivers.
Table 7.4: Mann-Whitney U-test results for a comparison of the geochemical properties of
surface soils from eroding maize fields and suspended sediment collected in the Culm and Tone basins
Surface soil mean Suspended sediment mean Probability value Chemical property Culm Tone Culm Tone Culm Tone
N (%) 6.50 6.58 17.00 16.89 0.001 0.001 C (%) 6.50 6.58 17.00 16.89 0.001 0.001 P (inorganic) 6.50 6.67 17.00 16.78 0.001 0.102 P (organic) 7.08 9.08 16.22 13.56 0.001 0.105 Al 13.92 14.17 7.11 6.78 0.012 0.005 As 8.75 8.17 14.00 14.78 0.058 0.013 Cd 7.67 8.25 15.44 14.67 0.003 0.015 Co 8.17 8.83 14.78 13.89 0.015 0.062 Cr 11.75 12.67 10.00 8.78 0.530 0.163 Cu 9.75 9.17 12.67 13.44 0.306 0.121 Fe 10.42 11.67 11.78 10.11 0.645 0.591 Mn 8.75 6.92 14.00 16.44 0.058 0.001 Ni 8.42 9.25 14.44 13.33 0.029 0.148 Pb-206 11.58 12.21 10.22 9.39 0.642 0.304 Pb-207 11.38 12.00 10.50 9.67 0.757 0.410 Pb-208 11.42 12.00 10.44 9.67 0.733 0.410 Sb 10.08 8.83 12.22 13.89 0.461 0.064 Sr 7.00 8.42 16.33 14.44 0.001 0.024 Zn 6.50 8.08 17.00 14.89 0.001 0.009 K 9.96 13.75 12.39 7.33 0.388 0.016 Mg 8.33 10.33 14.56 11.89 0.020 0.587 Na 6.50 6.67 17.00 16.78 0.001 0.001 137Cs 7.95 11.08 6.67 7.51 0.660 0.501 210Pb 11.22 28.98 66.51 51.54 0.001 0.031 Critical probability = P<0.05

147
The results presented above are complicated by contrasts in particle size composition
and organic matter content between the source material and sediment samples (e.g.
Collins et al., 1997; Ankers et al., 2003). This precludes detailed comparison of source
material and sediment properties, unless the comparison can be based on detailed
comparison of specific size fraction or organic fractions, which was beyond the scope of
this investigation. Furthermore, it is known that sediment properties will reflect a range
of local factors such as the underlying geology, soil type etc. which further complicate
many direct comparisons between the properties of the sediment eroded from maize
fields and those of the sediment transported by the rivers.
Overall, therefore, the geochemical results cannot be used to provide definitive
conclusions. They neither confirm nor refute the hypothesis that the properties of the
sediment transported by the river are closely linked to the properties of the sediment
mobilized from the eroding maize fields. In this context the results obtained from this
comparison of soil and sediment properties are broadly consistent with the results
presented above regarding the likely contribution of the eroding maize fields to the
sediment loads of the two rivers based on the measured erosion rates in maize fields and
an estimate of the efficiency of sediment conveyance from those fields to the stream
network. Both lines of evidence point to the maize fields providing a significant
proportion of the suspended sediment loads transported by the two study rivers.
7.5 Conclusion
This chapter presents findings for river monitoring and sediment investigations
undertaken in the Rivers Culm and Tone. The river monitoring and sediment
investigation programme were undertaken during winter period between November
2004 and March 2005. Although not definitive, the results obtained from the river
148
monitoring suggest that eroding maize fields are an important source of the fine
sediment transported by the Rivers Culm and Tone. The results suggest that as much as
50% of the suspended sediment loads of the two rivers could be contributed by the
eroding maize fields. However, the results obtained from the comparison of the
geochemical properties of suspended sediment and soil from eroding maize fields was
less conclusive, but were nevertheless broadly consistent with a substantial proportion
of the suspended sediment being derived from eroding maize fields. Further work to
take account of contrasts in grain size and organic matter content between soil and
sediment samples is, however, needed to explore the geochemical evidence further.

149
CHAPTER 8: THE ENVIRONMENTAL IMPACT OF MAIZE CULTIVATION
IN ENGLAND
8.1 Introduction
The area of maize cultivation in England has expanded greatly, particularly in the
1990s. Around 1995, maize cultivation experienced its greatest expansion in terms of
the area involved and many areas in the Southwest region were cultivated for silage
maize. Other areas, where maize is also important, included the Southeast, the Eastern
England and the West Midlands. Maize is currently being grown in all regions in
England. The expansion of maize cultivation has contributed to several environmental
problems, particularly soil erosion and the diffuse pollution of rivers. These
environmental impacts are closely related to poor land management practises during and
after harvest, and particularly during winter if maize fields are left bare without any
surface cover.
This chapter aims to provide a general assessment of the environmental impact of maize
cultivation linked to available information on the expansion of maize cultivation in
England. This is achieved by reviewing relevant information related to the physical
characteristics of the land devoted to fodder maize cultivation and current agricultural
practises. The information on the efficiency of sediment delivery from agricultural land
provided by McHugh et al. (2002), in map format, will be used to link the spatial
distribution of maize cultivation in England with information on sediment delivery
efficiency as represented by the connectivity index and connectivity ratio maps
presented by McHugh et al. (2002). However, before considering further the
relationship between the spatial distribution of maize cultivation and sediment delivery
efficiency, it is important to provide a general overview of the soil factors that are
important in understanding the relationship between soil erosion and soil type. In

150
addition, maps of the risk of diffuse water pollution produced by DEFRA (2004a) will
be used to explore further possible link between maize cultivation and diffuse source
pollution in England.
8.2 Soil Erosion Associated with Maize Cultivation
As indicated in Chapter 1, the growing of maize in England begins in spring, with the
sowing of the crop around April and May. The harvest takes place in autumn, around
mid-September and October. In the case of England, the risk of soil erosion associated
with maize cultivation becomes very important after harvest. This is related to the
practise of leaving the field, that is frequently damaged during harvest, bare and
unprotected from rainfall impact during the wet seasons. This can result in surface
runoff which encourages soil erosion, and the transport of sediment to watercourses.
In terms of on-site impacts, the rate of soil erosion varies, depending on various factors,
mostly related to the physical characteristic of the area. The discussion on this matter
was described in Chapter 6. At the general level, the rate of soil erosion can be related
to the intensity and quantity of rainfall, soil erodibility, and the length and steepness of
the slope. In terms of anthropogenic factors, these will be related to crop management
and erosion control practises. These factors can be used to predict the rate of soil
erosion. In the case of maize cultivation, beside the influence of these generic physical
controls, improper management of maize fields after harvest could also be the most
important factor that promotes surface erosion and transport of sediment to the rivers.
The rainfall factor (known as the R factor in the USLE equation), is related to intensity
and quantity of rainfall. In general, the rate of soil erosion will be high if the intensity
and amount of the rainfall are also high. This is related to both the effect of rainsplash in

151
dislodging soil particles and the capacity for rainfall intensity and amount to control the
amount of surface runoff. In a study located near Ilminster in Somerset, Clements and
Lavender (2004) showed that treatment plots with bare stubble and late harvest
treatment were characterized by significantly increased surface water runoff between
November 2003 and March 2004. Total rainfall and runoff were significantly correlated
r = 0.892, with d.f. = 9, and P <0.001. The highest runoff occurred on 19 January 2003
following 68.0 mm of rainfall in the previous fortnight. The use of chisel ploughing, in
attempt to reduce surface runoff, was shown to be highly effective, reducing total
surface water runoff to 36 m3/ha compared with 283 m3/ha for bare stubble plots,
whereas late harvest treatment increased surface water runoff to some 762 m3/ha.
In the case of England, the amount of rainfall received varies over the year, as shown in
Figure 8.1. Most of the high rainfall occurs after maize has been harvested and the
maize fields are left bare, usually from October to March. The conditions can promote
soil erosion, as the amount of rainfall during these periods is sufficient to promote
splash erosion and to create erosive runoff on bare stubble maize fields. In addition, as
discussed in Chapter 4, maize cultivation in England is mostly found in the Southwest,
the Southeast and the West Midlands. According to rainfall data, as presented in Figure
8.2, significant erosion and transport of sediments from bare maize fields to the river
networks can be expected during the winter months.

152
0
20
40
60
80
100
120
140
160
January
February
March
April
May
June
July
August
September
October
November
December
Months
Rainfall (m
m) 2002
2003
2004
2005
2006
Figure 8.1: Monthly rainfall in England between 2002 and 2006
0
20
40
60
80
100
120
140
160
180
200
Oct. 2005 Nov. 2005 Dec. 2005 Jan. 2006 Feb. 2006 Mar-06 Months
Rainfall (m
m)
South West
South East
Midlands
Figure 8.2: The distribution of rainfall in the Southwest, the Southeast and West Midlands between October 2005 and March 2006
In addition, the map of the spatial distribution of maize cultivation in England in 2000
can be linked to maps of erosion vulnerability and potential sediment delivery. It is
important to note that the erosion vulnerability and potential sediment delivery maps
were produced by McHugh et al. (2002) to determine sediment delivery from various
land uses, especially from arable land, grassland and upland pasture. Thus maps are
useful in this study, in terms of exploring potential increases in sediment delivery to
rivers, resulting from maize cultivation. It is also important to stress that the predictions

153
of sediment delivery from various land uses were originally based on the analyses of
connectivity index and connectivity ratio.
The connectivity index is a qualitative analysis that represents the likely relative
efficiency of sediment transfer. The connectivity ratio provides a quantitative measure
of the efficiency of sediment transfer from land surface to stream networks (McHugh et
al. 2002). Prediction of the connectivity index and the connectivity ratio involves
consideration of six factors, namely; (i) runoff potential, (ii) slope steepness, (iii) slope
shape, (iv) drainage pattern, (v) the sediment characteristics, and (vi) land use.
The runoff potential factor considers the influences of rainfall characteristics, surface
condition and soil properties on runoff generation. The slope steepness factor is related
to the slope gradient associated with overland flow and sediment transport capacity,
whereas the slope shape factor is related to the efficiency of surface form, in terms of
convex or concave slopes, associated with either erosion or deposition. The drainage
pattern factor is related to the drainage density and spatial distribution of drainage that
can influence sediment transfer distance and concentration of sediment in the river
network. In terms of mobilization and transportation of sediment, the sediment
characteristic factor represents the particle size composition of eroding soil, and is very
important in controlling the efficiency of sediment delivery. Lastly, a dynamic land use
factor is also important in sediment delivery in terms of the overall effect of land use
associated with surface roughness. A detailed explanation of each factor used in
deriving the connectivity index and connectivity ratio can be found in McHugh et al.
(2002).

154
Figure 8.3 shows that there is a relationship between sediment transport capacity and the
spatial distribution of maize cultivation. The sediment transport capacity is influenced
and determined by surface runoff magnitude, slope gradient, surface roughness and
sediment particle size. Clearly, the areas where the sediment transport capacity is
higher, the maize cultivation is also denser.
Derivation of the connectivity index involves combining information on sediment
transport capacity with the drainage pattern and slope shape factors, and the result is
used to derive the connectivity ratio. As shown in Figure 8.4, most areas of maize
cultivation in England coincide with areas with a significant risk of sediment transfer.
Furthermore, based on the erosion vulnerability map (Figure 8.5), most areas of maize
cultivation in the southern and central parts of the Southwest, the eastern part of Eastern
England, and the central part of the West Midlands occurs on the erodible area with a
net soil loss of 0.013–0.023 m3 ha-1 yr-1 for a 1-in-1 year erosion event. In addition,
other areas of maize cultivation such as in the eastern area of the Southwest, the
southern part of the West Midlands, and the western and central parts of Eastern
England also coincide with areas that can be considered risky in terms of erosion
vulnerability.
In terms of 1-in-10 year erosion events, it should be noted that the western part of the
Eastern region is among the most vulnerable areas for erosion. The potential erosion
vulnerability for this area is 0.5–1.0 m3 ha-1 yr-1. Other areas of land where the amount
of land under maize cultivation is high, for example in Devon and the eastern part of
Somerset in the Southwest region are also high in terms of erosion vulnerability, with
values in the range 0.1-1.5 m3 ha-1 yr-1.

155
Source: (a) McHugh et al. (2002) and (b) the spatial distribution of maize cultivation in England in 2000
Figure 8.3: Comparison between the spatial distribution of sediment transport capacity of overland flow
Legend ha km2
(a) (b)

156
Source: (a) and (c), McHugh et al. (2002) (b) The Edinburgh Library data (2000)
Figure 8.4: Comparison between (a) the connectivity index, (b) spatial distribution of maize cultivation in England in 2000, and (c) connectivity ratio
(a) (b) (c)
Legend ha km2

157
Source: McHugh et al. (2002)
Figure 8.5: Erosion vulnerability for (a) 1-in-1 year erosion events, and (b) for 1-in-10 year erosion events

159
8.3 Soil Types and the Distribution of Maize Cultivation
For the purpose of this study, with regard to soil types in England, the author has used
the soil classification map produced by the National Soil Resources Institute. According
to Figure 8.6, most of the area of maize cultivation in the central part of the Southwest
and the West Midlands is underlain by brown and podzolic soils. In the case of the
north-eastern part of the Southwest, Eastern, and Northwest England, the East Midlands
and the Southeast regions, the area of maize cultivation is underlain primarily by
lithormorphic and gley soils. As discussed in Chapter 4, the Southwest, the Southeast,
and the West Midlands, are the greatest areas of maize cultivation.
Brown soils in England are mostly in agricultural use. There are well-drained and can
be divided to eight groups. However, the brown calcareous sands, brown calcareous
alluvial soils, brown sands and brown alluvial soils are the groups in the brown soil
types that are most susceptible to erosion by rainfall. The lithormorphic soils, especially
sand-rankers, rendzinas and sand-pararendzinas are the groups of soils that are also
fragile. The surface-water gley soils can be divided into two groups; (1) stagnogley
soils, which occur widely in the lowlands, and (2) stagnohumic gley soils which are
found mainly in the uplands. Both groups are also vulnerable to soil erosion caused by
rainfall. Based on the above explanation, it can be concluded that most of the maize
cultivation in England is found on fragile soils. In addition, the brown soils also contain
more sands and loams, for which the rate of soil erosion has been shown to be high
(Morgan, 1985; Fullen et al., 1996).
As shown in Figure 8.6, a high density of maize growing occurs on the brown soils
especially in the southern and eastern parts of England. The trend of maize cultivation
can be expected to be increasing in this area. If environmentally friendly practises are

160
Source: (a) National Soil Resources Institute Figure 8.6: Comparison between (a) soil types and (b) the spatial distribution of maize cultivation in England in 2000
Legend ha km-2
(a) (b)

161
not implemented in the area of maize cultivation, especially in the area of high density
of maize growing, serious soil erosion on brown soils can be expected and more
sediment could be transported to nearby watercourses.
8.4 Diffuse Pollution Associated with Maize Cultivation
The previous section reviewed and discussed the links between the location of the main
areas of maize cultivation and erosion vulnerability and the potential for delivery of
mobilized sediment from maize fields to the stream network. This section focuses on
possible links between diffuse pollution of water courses in England and maize
cultivation. For this purpose, use will be made of several maps produced by DEFRA
(2004) which provide an overview of diffuse pollution in England and thus a basis for
exploring possible links with maize cultivation. Attention will be directed to the risk of
phosphorus pollution and the designation of catchments at risk from agricultural diffuse
pollution.
As indicated in the previous chapter, maize fields are highly likely to be a significant
contributor to increased phosphorus loading in rivers. Figure 8.7 indicates that areas
with the highest risk of phosphorus loss are closely linked with areas of intensive maize
cultivation. However, the area of high risk of phosphorus loss does not only coincide
with areas of denser maize cultivation, since some of the areas with high risk of
phosphorus loss are found in areas with limited maize cultivation, such as in the
northern part of the West Midlands and the eastern part of Eastern England. However, it
is also important to note that such areas are actively cultivated and this condition should
be taken into consideration when attempting to explore the possible links between
phosphorus loss and maize cultivation. However, it is known that the areas in the
northern part of the West Midlands and the eastern part of Eastern England are

162
important for vegetable growing (e.g. in Yorkshire and Nottinghamshire) and that dairy
farming is important in the South West (e.g. in Cornwall, Devon, Somerset, Dorset,
Wilsthire), and such activities could also be greater contributors of phosphorus in the
rivers (DEFRA, 2004).
Figure 8.7: (a) Areas at risk of phosphorus pollution and (b) the distribution of maize cultivation in 2000
Figure 8.8 shows that many catchments in England are at high risk from agricultural
diffuse pollution. DEFRA (2004) stated that at least 70% of the country is at medium to
high risk from agricultural diffuse pollution. However, the precise role of maize
cultivation in contributing to this pollution was not specified in the report. Figure 8.8
clearly shows that many of the catchments designated as being at risk from diffuse
source pollution are also areas with a higher density of maize cultivation, especially in
Dorset, Devon and Somerset in the Southwest, and northern part of the West Midlands.
Legend ha km2
(a) (b)
Source: DEFRA (2004)

163
Figure 8.8: (a) Catchments at risk from diffuse agricultural pollution and (b) the distribution of maize cultivation in 2000
8.5 Conclusion
This chapter attempts to provide a broad-based national-scale assessment of the
environmental impact of maize cultivation in England, in terms of soil erosion risk and
potential sediment delivery from maize fields to watercourses. The amount of rainfall
received during wet periods (November to February) is considered sufficient to promote
soil erosion (splash erosion and surface wash) on bare maize fields after harvest. In
addition, most of the area of maize cultivation in England occurs on fragile brown soils
which are vulnerable to soil erosion. The combination of rainfall amount and fragile soil
can promote serious soil erosion on bare stubble maize fields, and mobilize and transfer
sediment to the river network.
A detailed assessment of the spatial distribution of maize and potential sediment
delivery to water courses indicates that most of the denser area of maize cultivation
occurs in areas where sediment transport capacity is also higher. This could lead to
significant risk of sediment transfer from bare stubble maize fields to the river network.
Furthermore, determination of diffuse pollution, in terms of the risk of phosphorus
Legend ha km2
(a) (b) Source: DEFRA(2004a)

164
pollution, show that the highest risk of phosphorus loss seems to show a link with not
only areas of denser maize cultivation but also with low density areas.
To generalize the discussion in this chapter, it is clear that maize cultivation in England
is significant in promoting soil erosion during wet months, and potentially contributes to
diffuse pollution to the rivers by mobilizing and transferring sediment from bare stubble
maize fields to watercourses. Therefore, there is a need to control the impact of soil
erosion associated with maize cultivation in order to reduce sediment input to rivers.
The next chapter will review several agricultural policies to promote environmentally
friendly practises that could be implemented to reduce on- and off-site impacts
associated with maize cultivation in England.

165
CHAPTER 9 : MAIZE CULTIVATION MANAGEMENT
9.1 Introduction
The on-site and off-site impacts of maize cultivation, associated with increased soil
erosion, have been discussed in Chapters 6, 7 and 8, with reference to local, regional
and national scales. It is clear that maize cultivation has significant negative on-site and
off-site impacts on the environment. In the case of maize cultivation, the environmental
damage can be related to poor soil and land management practises. This is due to
improper management of maize fields during harvest and the ensuing winter by farmers
and harvest contractors.
In this chapter, the literature on erosion control associated with maize cultivation will be
reviewed. In addition, current policy associated with agricultural land management in
general, and maize cultivation in England in particular, will be reviewed. This
necessitates consideration of the Common Agricultural Policy (CAP) and the Water
Framework Directive (WFD), as such legislation has implications for the promoting of
sustainable and environmentally friendly farming aimed at reducing both the on-site and
off-site impacts of farming activities. The Diffuse Water Pollution from Agriculture
(DWPA) and Agri-Environment Scheme (AES) guidelines will also be reviewed, in the
context of the Code of Good Agricultural Practise (COGAP), and the environmental
impact of maize cultivation. More specifically, the three main drivers that are likely to
represent key influences on maize cultivation, in terms of reducing on-site and off-site
impacts, namely, the Single Farm Payment Scheme (SFPS), the Environmental
Stewardship Scheme (ESS), and Catchment Sensitive Farming (CSF) initiative, will
also be reviewed and discussed in this chapter. Figure 9.1 shows the links between the
various policies, schemes and initiatives as mentioned above.

166
Figure 9.1: The links between the various policies, schemes and initiatives which influence farming practises in England
9.2 Erosion Control Associated with Maize Cultivation
Growing maize as a fodder crop has become more popular in the Europe, and maize has
become an important source of cattle fodder in the United Kingdom, especially in
England. As shown in Chapter 4 (Sections 4.2 and 4.4), the area cultivated with silage
maize within the continent of Europe cover an area of ca. 3.86 million ha. In the case of
England, in 2004, the area under maize cultivation occupied an area of ca. 107.4
thousand ha of arable land.
The growing of maize as a fodder crop to support diary farming in England has given
rise to significant on-site and off-site problems related to increased soil erosion.
Existing reviews of soil erosion control practises on maize field show that most of the
studies covered three distinct periods i.e. (i) the seed sowing to growing period, (ii) the

167
growing period to mature period, and (iii) the post harvest period where fields are left
bare with stubble.
Clements and Donaldson (2002) worked on soil erosion control on maize field based on
a series of field experiments undertaken between 1998 and 2001 at IACR Long Ashton
(Institute of Arable Crops Research), and between 1999 and 2001 at IGER North Wyke
(Institute of Grassland and Environmental Research). Their studies showed that chisel
ploughing effectively limits soil compaction, but that it is only effective when soil
conditions allow shattering of the soil. Surface runoff from compacted soil shattered by
chisel ploughing was typically only 10 m3/ha, whereas the runoff from compacted
maize stubble averaged 433 m3/ha. In addition, the experiments also demonstrated that
an understorey of clover within the maize drilled across the slope was also effective in
reducing runoff. As an example, the combination of a white clover understorey with
drilling across the slope at Long Ashton experimental plot reduced runoff by nearly
90%. In the case of the North Wyke experimental plots, an understorey of grass was
shown only reduce runoff by 40-60%.
Measurements of surface water runoff from maize stubble during the winter of 2003/04
in a Parrett Catchment area reported by Clements and Lavender (2004) support the
findings of Clements and Donaldson (2002). In these measurements, chisel ploughing
across the slope greatly reduced total surface water runoff by ca. 87% compared with
bare stubble plots (283 m3/ha). In addition, the cover crop and Italian ryegrass
understorey had only a modest effect in limiting runoff, reducing this by ca. 41% and
8%, compared with bare stubble plots, respectively.

168
Studies undertaken in South Limburg (The Netherlands) have shown that soil tillage
after maize harvest and sowing of winter ryegrass can greatly reduce surface runoff and
soil loss during winter (Van Dijk et al. 1996a). Further investigations reported by
Kwaad et al. (1998) support this finding, where winter runoff and erosion under
continuous maize cropping were strongly reduced by autumn tillage. Their experiments
undertaken in 1992 and 1993 showed that under various cropping systems, soil erosion
was significantly reduced but did not effectively reduce runoff. The most effective
cropping system was found to be direct drilling of maize in winter rye residue. This
cropping system could reduce runoff by more than 90% in winter. In addition, the
‘straw system’ was shown to be an effective technique for reducing runoff on mulched
surfaces.
A contour grass strip was shown to be an effective approach for erosion control in an
investigation undertaken in Bedfordshire and reported by Melville and Morgan (2001).
Their studies showed that two grass treatments involving Festuca ovina and Poa
pratensis significantly (P< 0.05) lowered the runoff and soil loss compared to bare soil.
However, despite differences in density, height and leaf size between the two grasses,
there were no significant differences in their in controlling erosion. The grass strips
could operate by ponding water upslope of the barriers which leads to particulate
deposition, instead of acting as a filter with sedimentation within the barrier.
To support the above review, Table 9.1 summarise some other findings, which show
that cover crops and soil tillage can be effective in dealing with erosion control in terms
of reducing runoff and soil loss. In general, straw mulching and the growing of cover
crops are effective and good practices for erosion control on stubble maize fields as they
can significantly reduce runoff and soil loss.

169
Table 9.1: Summary of investigations aimed at controlling erosion associated with fodder maize cultivation
Methods and Result
• Cover crops that greatly reduced runoff and erosion
• Winter cover crops that reduced runoff by 88% compared with bare fallow • Clover understorey greatly reduced runoff • Winter rye, oil radish, spring or winter rape, or cocksfoot reduced soil loss, and therefore probably runoff, on maize field
• Soil tillage in autumn reduced runoff and soil erosion, and straw mulch effectively reduced runoff when used instead of winter rye as a cover crop
• Cover crops that reduce sediment production and runoff from crop land by intercepting the kinetic energy of rainfall, and by reducing the amount and velocity of runoff
Source: adaptation from Harris et al. (2004)
Beside studies focusing on controlling on-site impact of soil erosion associated with a
mitigation approach to water runoff, studies have also been carried out to reduce the off-
site impact caused by soil erosion. Hoang Fagerström et al. (2002) have shown that
planting a hedgerow at the bottom of the slope can prevent transport of sediment
directly to the river channel. The hedgerow can act as a trap by slowing the runoff and
blocking the transfer of sediment to the river channel. In addition, their study also
showed that the hedgerow species Tephrosia can improve nutrient cycling and prevent
nutrient losses by erosion on slopes. Investigations reported by Chaowen et al. (2007)
have also shows that hedgerows can significantly reduce runoff and sediment transfer.
The reduction in sediment transfer associated with a one year old hedgerow was
measured as ca. 82-86%, whilst the runoff reduction up to 63-71%.

170
Detention ponds have also been shown to be an effective technique for preventing
sediment transfer to the drainage system. Investigations reported by Fiener et al. (2005)
show that detention ponds effectively trapped sediment and reduced sediment
movement by between 54% and 85%, or by between 1.0 and 15.3 t ha-1 yr-1. The peak
runoff rate, measured from the measured outflow rates and the inflow rates, was also
reduced from 15.1 to 4.9 l s-1, whilst the total outflow volume of 894 m3 was reduced by
10%, based on integrated calculation of infiltration and evaporation rates.
Riparian buffer zones have also been identified as an effective practise for trapping
sediments and pollutants in runoff before reaching the watercourses. Permanent
vegetation such as grasses, shrubs and trees act as sponges to filter and absorb sediment
and pollutants in runoff. A study reported by Mihara (2006) showed that a weed buffer
of Humulus scandens Merrill and Poa annua L. was very effective in minimizing soil
and nitrogen losses. The buffer captured 99.6% of the soil-sediment and stored 80% of
the total nitrogen input. McKergow et al. (2003) reported that a riparian buffer zone
reduced suspended sediment concentrations associated with a median event from 147 to
9.9 mg l. However, the riparian buffer zones did not alter significantly the P and TP
concentrations after the riparian buffers were fenced and planted, probably associated
with several reasons such as (i) P losses are dominated by FRP, and (ii) hydrological
flowpaths affect the potential of riparian buffers for reducing nutrient export
(McKergow et al. 2003).
Based on above reviews, regarding to on-site control of soil erosion, clearly that the
most effective techniques for reducing runoff on bare stubble surface are chisel
ploughing, winter ryegrass and understorey of clover within the maize drilled across the
slope. In terms of mulched surfaces, the straw system seems to be the most effective

171
technique. In addition, cover crop and Italian ryegrass understorey had a modest effect
in limiting runoff. To summarize, all of these techniques can be applied on a bare
stubble surface of maize for reducing and limiting runoff on various soil types and slope
gradient.
In order to reduce sediment transfer from maize fields to nearby watercourses,
hedgerow planting at the bottom of the slope and riparian buffer zones seems to be the
most effective practises. Both of these approaches can act as a trap by slowing the
runoff and trapping sediments and pollutants in runoff before reaching the river channel.
9.3 The Common Agricultural Policy (CAP) and Maize Cultivation
The Common Agricultural Policy (CAP) was established in 1961 and originally
introduced in 1962 by the European Commission (EU) to promote intervention in the
agricultural sector among European countries. Generally, the CAP promotes three major
principles: (i) market unity, (ii) community preference, and (iii) financial solidarity;
linked to what should be grown for maintaining prices for crops, and influencing how
farming should be organized. Based on these basic principles, the CAP become an
integrated system for controlling the agriculture sector within the EU, and more
particularly, maintaining commodity price levels within the EU, based on three
mechanisms: (i) import tariffs on specified goods imported into the EU, (ii) setting an
internal intervention price, and (iii) subsidies to farmers for growing particular crops. In
terms of cultivation of crops and particularly maize, the second and third mechanisms
are crucial in the case of England since they promoted an expansion of the area of maize
cultivation and thus an increase of its off-site impacts due to diffuse water pollution
during winter.

172
According to the mid-term review of the CAP in 2003, the first CAP pillar (price and
market policy) associated with direct payment has been separated from the second pillar
(rural development and environment), which promotes more sustainable and
environmentally sensitive land management. The first pillar represents a more
consumer-focused policy, based on single farm payments, whilst the second pillar aims
to maintain and enhance the landscape and wildlife by tackling pollution from
agriculture land. This provides a clear framework for the EU agricultural policy by
focusing on maintaining the environment and promoting sustainable rural development
in more environmentally sensitive areas. In general, the first pillar is related to the
Single Farm Payment Scheme (SFPS), and the second pillar with the Environmental
Stewardship Scheme (ESS). Both pillars have affected the agriculture sectors in the UK,
and more specifically England, by encouraging a larger area of land under arable
farming and particularly maize cultivation. In more detail, in the case of England, the
implementation of these pillars is connected to the Agri-Environment Scheme (AES)
guidelines and Water Framework Directive (WFD) objectives, which aim to combat off-
site impacts, especially from arable land and area of maize cultivation.
9.3.1 Single Farm Payment (SFP) scheme
Under the CAP reform in 2003, the SFP replaced 11 schemes4 with one new single
payment. This new scheme is based upon a standard regionalized area payment,
modified to reflect historical subsidy receipts. In general, the SFP, managed by the
Rural Payment Agency (RPA), requires farmers to follow the environmental standards
of sustainable and environmentally friendly practises based on the AES and Code of
Good Agriculture Practise (COGAP). In more detail, the SPS gives farmers freedom in 4 These include (i) the Arable Area Payment Scheme, (ii) the Beef Special Premium, (iii) the Extensification Payment Scheme, (iv) the Sheep Annual Premium Scheme, (v) the Suckler Cow Premium Scheme, (vi) the Slaughter Premium Scheme, (vii) the Veal Calf Slaughter Premium Scheme, (viii) the Dairy Premium, (ix) the Dairy additional payment, (x) Hops Income Aid, and (xi) Seed Protection Aid (DEFRA, 2006a)

173
their choice of ‘agricultural activity’5 in response to consumer and market demands, but
at the same time requires farmers’ to meet a baseline standard when making their claims
for payment. This requirement must meet the Good Agricultural and Environmental
Condition (GAEC) (Table 9.2) and Statutory Management Requirements (SMRs)
standards (Table 9.3). In other words, these requirements are described in the CAP as
‘cross-compliance’, where the SFP covers the whole agricultural area of a farm’s
holding, and the SPS involves the amount of land entered into SPS claims.
Table 9.2: Good Agricultural and Environmental Condition (GAEC) in use for cross-compliance guidance for the management of habitats and landscape features in 2005
GAEC 1 GAEC 2 GAEC 3 GAEC 4 GAEC 5 GAEC 6 GAEC 7 GAEC 8 GAEC 9 GAEC 10 GAEC 11 GAEC 12 GAEC 13 GAEC 14 GAEC 15 GAEC 16 GAEC 17
General requirements (soils) Post-harvest management of land after combinable crops Waterlogged soils Burning of crop residues Environmental Impact Assessment Sites of Special Scientific Interest Scheduled Monuments Public rights of way Overgrazing and unsuitable supplementary feeding Heather and grass burning Control of weeds Eligible land which is not in agricultural production Stone walls Protection of hedgerows and watercourses Hedgerows Feeling of trees Tree Preservation Orders (TPOs)
Source: DEFRA, 2006a
The cross-compliance that requires farmers to comply with GAEC and SMRs to receive
the SFP and SPS involves two sets of requirements. These refer to (i) the maintenance
of land/farms in accordance with the GAEC, and (ii) complying with a number of
specified legal requirements of land/farms relating to the SMRs. In the case of maize
5 ‘Agricultural activity’ is defined as the production, rearing or growing of agricultural products including harvesting, milking, breeding animals and keeping animals for farming purposes (Council Regulation (EC) No 1782/2003 (Article 2(c)) (DEFRA, 2006a)

174
Table 9.3: Statutory Management Requirements regimes
SMR 1 SMR 2 SMR 3 SMR 4 SMR 5 SMR 6 SMR 7 & 8 SMR 8a SMR 9 SMR 10 SMR 11 SMR 12 SMR 13 SMR 14 SMR 15
Wild Birds Groundwater Sewage sludge Nitrate Vulnerable Zones (NVZs) Habitats Animal identification and registration - pigs Cattle identification Animal identification and registration – sheep and goats Restrictions on the use of plant protection products Restrictions on the use of substances having hormonal or thyrostatic action and beta-agonists in farm animals Food and feed law Prevention and control of Transmissible Spongiform Encephalopathies (TSEs) Control of Foot and Mouth Disease (FMD) Control of certain animal diseases Control of Bluetongue
Source: DEFRA, 2006b
cultivation, the GAEC 1 (General requirements-soils) requires farmers to fulfil the Soil
Management Plan (SMP)6 and Soil Protection Review (SPR)7 to claim the SPS based on
the cross-compliance basis under the ESS. In general, both soil requirements involve
three basic environmental reviewing processes: (i) identifying soil issues, (ii) deciding
on measures to manage and protect soils, and (iii) reviewing success. These
requirements can be generalized to minimize and reduce the risk of damaging the
environment from unsustainable farming practise.
According to the SMP, associated with maize cultivation as a specific case, all maize
growers have to prepare an erosion risk map based on the risk of water erosion and
runoff from a field. In order to establish this risk, maize growers are required to prepare
6 The SMP is guidance for Entry Level (ELS) and Organic Entry Level (OELS) of the ESS, and is a voluntary option that contributes 3 points/ha towards ELS or OELS points targets. 7 The SPR is guidance to manage and protect the soil based on GAEC standards. Details of these can be found in DEFRA (2006c).

175
a risk assessment based on three criteria: (i) soil texture, (ii) slope steepness, and (iii)
frequency of flooding. Criteria (i) and (ii) are probably the most important aspects that
maize growers in England have to take into account in the risk assessment. This
involves two aspects of erosion risk. The first is water erosion where by maize growers
have to identify signs of erosion based on four risk classes; (i) very high risk areas, (ii)
high risk areas, (iii) moderate risk areas, and (iv) lower risk areas. This can be
undertaken by referring to the guideline given in Table 9.4. The second is runoff, where
maize growers need to identify the signs of runoff based on three risk classes; (i) high
risk areas, (ii) moderate risk areas, and (iii) lower risk areas. This can be undertaken by
referring to the guidelines given in Table 9.5. Regarding the erosion risk map, maize
growers have to promote an environmentally friendly approach to minimizing and
reducing both the on-site and off-site impacts of maize fields. According to the
susceptible land use category, maize growers should be more aware that growing maize
on Very High Risk and High Risk sites is highly likely to encourage erosion, unless
suitable soil management precautions are taken, such as suggested in COGAP and
GAEC. If maize must be grown in those areas, and in order to qualify the claimant
under the SFPS and SPS, in addition to the COGAP and GAEC standards for preventing
soil erosion in high risk situations, maize growers also have to prove that their SMP
follows the EJ18 and EJ29 to gain necessary points.
8 EJ1 refers to the Management of high erosion risk on cultivated land. 9 EJ2 refers to the Management of maize crops to reduce soil erosion.
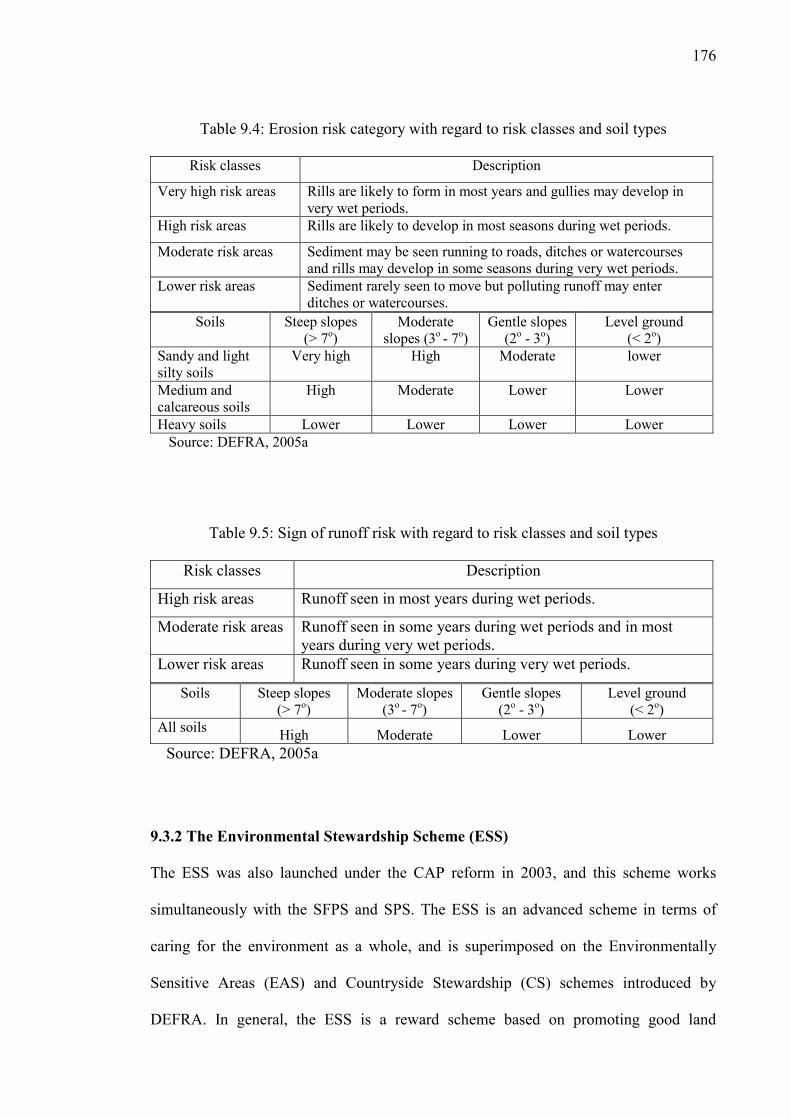
176
Table 9.4: Erosion risk category with regard to risk classes and soil types
Risk classes Description
Very high risk areas Rills are likely to form in most years and gullies may develop in very wet periods.
High risk areas Rills are likely to develop in most seasons during wet periods.
Moderate risk areas Sediment may be seen running to roads, ditches or watercourses and rills may develop in some seasons during very wet periods.
Lower risk areas Sediment rarely seen to move but polluting runoff may enter ditches or watercourses.
Soils Steep slopes (> 7o)
Moderate slopes (3o - 7o)
Gentle slopes (2o - 3o)
Level ground (< 2o)
Sandy and light silty soils
Very high High Moderate lower
Medium and calcareous soils
High Moderate Lower Lower
Heavy soils Lower Lower Lower Lower Source: DEFRA, 2005a
Table 9.5: Sign of runoff risk with regard to risk classes and soil types
Risk classes Description
High risk areas Runoff seen in most years during wet periods.
Moderate risk areas Runoff seen in some years during wet periods and in most years during very wet periods.
Lower risk areas Runoff seen in some years during very wet periods.
Soils Steep slopes (> 7o)
Moderate slopes (3o - 7o)
Gentle slopes (2o - 3o)
Level ground (< 2o)
All soils High Moderate Lower Lower Source: DEFRA, 2005a
9.3.2 The Environmental Stewardship Scheme (ESS)
The ESS was also launched under the CAP reform in 2003, and this scheme works
simultaneously with the SFPS and SPS. The ESS is an advanced scheme in terms of
caring for the environment as a whole, and is superimposed on the Environmentally
Sensitive Areas (EAS) and Countryside Stewardship (CS) schemes introduced by
DEFRA. In general, the ESS is a reward scheme based on promoting good land

177
management to address any environmental issues within and outside of the farm that
could affect the wider countryside, including soil erosion, diffuse source pollution and
the conservation of habitats. In more detail, this scheme intends to improve water
quality and reduce soil erosion, improve conditions for farmland wildlife, maintain and
enhance landscape character, and protect the historic environment of the English
countryside.
The ESS has three elements that all farm and land owners and farmers have to take into
account in order to qualify them as SFS claimants. The first is Entry Level Stewardship
(ELS), which refers to a ‘whole farm’ scheme and provides a straightforward approach
to support the good stewardship of the countryside. Under this scheme, farm owners or
land managers have to prepare a Farm Environment Record (FER) to record all farm
features. This requires them to identify where water erosion or runoff occurs, field-by-
field. They will receive a payment of £30 per hectare per year for all the land they enter
into the scheme10. In order to qualify, they have also to meet a ‘points target’ for the
land they enter into the scheme. The points target they have to achieve is 30 points per
hectare for all eligible land. However, for any land in the Less Favoured Area (LFA) in
parcels of 15 ha or more, they will only need to achieve 8 points per hectare.
The second element is Organic Entry Level Stewardship (OELS), which is in many
ways similar to the ELS but also has differences. The aim of OELS is to encourage
organic farming across a wide area of farmland, in order to deliver simple effective
environmental management. The potential for pollution and other environmental
damage will be less, as organic farming avoids the use of artificial fertilizers and
synthetic pesticides (DEFRA, 2005b). Under this scheme, the farm owners or land
10 However, this excludes land within parcels of 15 hectares or more within the Less Favoured Area, (LFA) where farm owners or land managers receive £8 per hectare per year.

178
managers will receive £60 per ha per year for all OELS eligible land. They also need to
prepare the FER for assessment. The point’s target for the OELS is 60 points per ha.
The OELS works simultaneously with ELS, but is more focused on organic farming and
‘conversion’ to organic farming. On top of the organic farming payments, farm owners
or land managers may also apply for conversion aid top up payments on established
fruit orchards11.
In association with maize cultivation, both ELS and OELS require farm owners or land
managers to manage their land, on a field-by-field basis, and to prepare the FER for
assessment. The payments will be based on the SFPS. Under the management options12
available for the ELS and OELS, maize growers have to give more attention to
protecting soils by following the COGAP and GAEC 1 guidelines regarding TO
management of maize fields during winter to reduce soil erosion risks. This also
requires maize growers to mark in their FER the risk of soil erosion (on-site impact) and
the risk of water pollution (off-site impact) associated with diffuse pollution from maize
fields, and to promote good management of high erosion risks, if maize will be grow on
risky land with a high risk, as mentioned in the SMP.
The third element of the ESS is the Higher Level Stewardship (HLS), which aims to
deliver significant environmental benefits in high priority situations and areas13. This
scheme is a combination scheme with ELS and OELS options. Under this scheme, on
11 The conversion aid top-up payments rate is £600 per ha p.a. for the first three years of OELS agreement for areas of top fruit orchards (pears, plums, cherries and apples), and £174 per ha p.a. for the first years of OELS agreement for areas of improved land. Details can be found in DEFRA (2005b) 12 The management options for ELS and OELS involve 10 options; (i) arable land, (ii) boundary features, (iii) buffer strips, (iv) encouraging a range of crop types, (v) LFA land, (vi) lowland grassland outside the LFA, (vii) management plans, (viii) protection of historic features, (ix) protection soils, and (x) trees and woodland (DEFRA, 2005b). 13 The five primary objectives of HLS are: (i) wildlife conservation, (ii) maintenance and enhancement of landscape quality and character, (iii) natural resource protection, (iv) protection of the historic environment, and (v) promotion of public access and understanding of the countryside (DEFRA, 2005c)

179
top of the FER requirements, the farm owners also have to support their application
with a Farm Environment Plan (FEP). The farm owners are required to identify features
on their farm and their condition, and to provide a guide to the most appropriate
management options, for the whole farm and field-by-field in their FEP. This involves a
process of identifying historical features, wildlife, resource protection, access and
landscape interest, and making an assessment of their condition. In order to claim the
payment under this scheme, farm owners have to register related ‘land’14 to qualify for
the payment under the SFPS.
In the case of maize growers, in addition to the FEP, they also have to provide a plan to
protect the soil from water erosion and runoff, and a plan to prevent diffuse pollution of
water courses. This can be achieved by following the guidelines for controlling soil
erosion. In general, the guidelines suggest that maize growers should control soil
erosion caused by water on susceptible soils by protecting the soil with vegetation cover
after harvest, or by promoting surface retention to maintain water infiltration rates and
to avoid the impact of rainfall. In more detail, maize growers are advised to avoid land
of high erosion risk for growing maize. They are also advised to sow an early maturing
variety of maize on all areas at risk of erosion, so that harvesting can be carried out
early and before the end of autumn. In addition, they are also encouraged to reduce the
post-harvest erosion risk by establishing a winter-cover crop or by rough ploughing
immediately after harvest, to prevent overwinter runoff and erosion, and subsoiling
along the contour to shatter the sub surface layer to improve soil infiltration and reduce
runoff (DEFRA, 2005c).
14 For the purpose of HLS, the ‘land’ refers to all land and associated boundaries registered on the Rural Land Register (RLR) which is farmed as one business enterprise, and which is included in a single application (DEFRA, 2005c)

180
The Environmentally Sensitive Areas (ESAs) scheme, which was introduced in 1987 to
all farmers in England, is connected to the ESS. This scheme also offers incentives to
farm owners and farmers to encourage them to adopt agricultural practises that are more
environmentally friendly and that will ‘safeguard and enhance parts of the country of
particularly high landscape, wildlife or historic value’ (DEFRA 2005d). However, with
the introduction of the ESS, the scheme was closed to new applicants, but still applies
for those already in the scheme before the ESS. The ESAs cover over 1.1 million
hectares of land and involve 22 areas in England (Figure 9.2). This specific scheme, will
only affect maize growers if they plan to cultivate maize within the ESAs, when they
will have to follow the same requirements as given in the COGAP and GAEC related to
preventing water erosion on the land and runoff to watercourses. The benefits of this
scheme in terms of the payment vary for each area. For example, in the South Downs
area, the payment for the land under TIER 4A category (winter stubble with
undersowing) is £125 per ha, whilst in the West Penwith area, the payment for land
under TIER 2 (winter stubbles) is £170 per ha.
9. 4 Catchment Sensitive Farming (CSF)
The Catchment Sensitive Farming (CSF) is a programme to reduce diffuse water
pollution from agriculture in England and focuses on controlling phosphorus, faecal
indicator organisms, sediments and nitrate pollution of any watercourse to meet the
Water Framework Directive (WFD) water quality targets. It is already well accepted
that the biggest threat of diffuse water pollution is from agricultural activity, especially
in terms of increases in nutrient levels caused by fertilizers and manure, and turbid
water caused by soil erosion. The CFS is a local scale programme that focuses on
changing farmer behaviour and practise in farming (Table 9.6), such as protecting
watercourses, nutrient and manure management, and land use and soil management.

181
Under this programme, farmers are encouraged to apply best practise in the use of
fertilizer, manures and pesticides, simultaneously with managing good soil structure, to
maximize infiltration of rainfall and minimize water erosion and runoff, protecting
watercourses from faecal contamination and reducing sedimentation and pesticides.
The ESAs list which involves 22 areas and will be introduced in four stages;
Stage I Stage II 1. Broads 1. Breckland 2. Pennine Dales 2. Clun 3. Somerset Levels & Moors 3. North Peak 4. South Downs 4. Suffolk River Valley 5. West Penwith 5. Test Valley
Stage III Stage IV
1. Avon Valley 1. Blackdown Hills 2. Exmoor 2. Cotswold Hills 3. Lake District 3. Dartmoor 4. North Kent Marshes 4. Essex Coast 5. South Wessex Downs 5. Shropshire Hills 6. South West Peak 6. Upper Thames Tributaries
Source: DEFRA, 2006c
Figure 9.2: The location of the ESAs programme

182
In addition to the CSF, DEFRA also introduced the England Catchment Sensitive
Farming Delivery Initiative (ECSFDI) as part of the CSF, focusing on England. As a
sub-scheme of the CSF, the main ECSFDI target is to reduce diffuse water pollution
from agriculture by encouraging CSF based on a catchment-specific approach. This
approach includes the prioritization of catchments affected by diffuse water pollution
from agriculture, the appointment of a network of dedicated Catchment Sensitive
Farming Officers each assigned to a specific priority catchment, and the establishment
of Catchment Steering Groups (DEFRA, 2008). Currently, forty catchments have been
identified as priority areas for action under the ECSFDI, involving eight river basin
districts (Figure 9.3), namely, (i) the South West river basins, (ii) the South East river
basins, (iii) the Thames river basins, (iv) the Severn river basins, (v) the Anglia river
basins, (vi) the Humber river basins, (vii) the North West river basins, and (viii) the
Solway and Tweed river basins. In more detail, DEFRA and related members in the
ECSFDI identify several environmental issues in each priority catchment via the
catchment priority approach, and some of the issues related to maize cultivation. Table
9.7 shows some example of the environmental issues associated with maize cultivation
identified by DEFRA and ECSFDI members, and provide a description and justification
of the issue.

183
Table 9.6: List of farmer objectives and practises
Objective Practices
Protecting watercourses
• Establish riparian buffer strips • Trap silt and sediment
• Fence watercourses • Provide fording/crossing points for
livestock Livestock management
• Reduce stocking densities • Reduce grazing intensity • Avoid poaching
• Move feeders and troughs at regular intervals
• Reduce N and P in livestock diets • Provide access to drinking water through
pasture pumps and troughs Manure management
• Adopt recognized manure management plan
• Export surplus manure • Adopt batch storage of slurry and of
solid manure • Compost solid manure • Change from slurry to solid manure
handling system • Site solid manure heaps away from
watecourses and field drains
• Site solid manure heaps on concrete and collect the effluent
• Do not apply manure to high risk areas • Do not spread farmyard manure, slurry
or poultry manure to fields at high-risk times
• Incorporate into soil quality or inject • Test manure spreaders and re-calibrate
as necessary
Nutrient management
• Adopt nutrient management plan • Use recognised fertilizer
recommendation system • Test soils • Keep records of applications • Seek advice from FACTS qualified
agronomists
• Integrate fertilizer and manure supply • Do not apply P fertilizer to high P index
soils • Do not apply fertilizer to high risk areas • Avoid spreading fertilizers at high risk
times • Test manure spreaders and re-calibrate
as necessary Land use / soil management
• Convert arable land to grassland • Adopt recognized soil management plan • Establish autumn cover crops • Cultivate in spring rather than autumn • Adopt minimal cultivation system • Check for and deal with sub-surface
capping and compaction • Cultivate and drill across the slope and
along contours
• Avoid winter tramlines • Leave autumn seedbeds rough • Establish in-field grass buffer strips • Reduce field size with new hedges and
beetle banks • Introduce grass leys into arable rotations • Avoid high risk crops on high risk fields • Use forestry and set aside schemes to
good effect Crop protection
• Adopt recognized crop protection management plan
• Test sprayers • Use registered operators
• Spray under optimum conditions • Handle and dispose of pesticides
responsibly
Other • Adopt phase feeding of livestock • Maintain and enhance soil organic
matter levels • Incinerate poultry litter • Relocate gates • Provide adequate slurry and manure
storage
• Separate clean from dirty water • Manage / treat dirty water • Allow field drainage to deteriorate • Establish wetland
Source: DEFRA, 2006c

184
River basin district Catchment
South West river basin district
5. River Axe 12. Somerset Levels and Moors 13. Slapton Ley 16. West Cornwall Catchments 18. Exe Estuary 20. The Frome 22. Tamar-Tavy Estuary 24. Hampshire Avon System 26. Dorset Stour 27. River Camel Valley 38. Yealm and Erme Estuaries
Anglia river basin district
1. Bure Ant and Muckfleet 2. River Wensum 4. Yare and Waveney 9. North Norfolk rivers 10. Little Ouse (Thetford area) 14. Lincolnshire Coast rivers 15. Deben, Alde & Ore 17. River Nar 31. Gipping and Orwell
Severn river basin district
3. West Midlands Meres 7. River Lugg 23. River Wye (Welsh side only) 28. River Teme 36. North Somerset Moors
Humber river basin district
6. East Riding of Yorkshire and North Lincs 8. Yorkshire Ouse, Nidd and Swale 21. Yorkshire Derwent 30. Peak District Dales of West Midlands and East Midlands 39. River Eye
South East river basin district
29. Rivers Test and Rivers Itchen 35. Eastern Rother 37. The Stour 40. Pevensey
Solway and Tweed river basin district
19. River Waver and Biglands Bog 25. Tweed Catchment rivers 32. River Eden and tributaries
Thames river basin district
33. Rivers Lambourn and Kennet of South West and South East
Figure 9.3: List and map of priority areas under the England
Catchment Sensitive Farming Delivery Initiative (ECSFDI)
Source: DEFRA, 2007

185
According to the catchment priority list in Table 9.7, many issues reported in the
ECSFDI scheme associated with maize cultivation cover both on-site and off-site
environmental problems. These include soil erosion and runoff problems from steep
slopes and lighter soils with less or no surface cover due to heavy rainfall during winter.
In addition, attention is direct to diffuse pollution in the watercourses, and especially
phosphorus, nitrogen and sediment problems, which degrade the water quality.
Furthermore, based on the justification of such problems, as well as slope gradient and
soil type, the connectivity of most maize fields to watercourses is also identified as a
main contributor to diffuse water pollution in some priority catchment priority areas. All
of these factors should be taken into account by maize growers in order to prevent soil
erosion and protect the river or other watercourses from diffuse pollution.
9.5 The Agri-Environment Scheme (AES) and Code of Good Agriculture Practise
(COGAP)
The Agri-Environment Scheme (AES) was introduced in 1987 by the Ministry of
Agriculture, Fisheries and Food (MAFF) as a voluntary scheme to enable farmers to
protect and enhance the rural environment in terms of biodiversity, landscape and
historic features, and to promote public access in designated areas of high
environmental value. In addition to this scheme is the Countryside Stewardship Scheme
(CSS), which involves a similar approach to the AES, but differs in that the CSS has no
designated areas. The AES has been reviewed and is still working simultaneously with
the ESS. The concern of the AES is for improved environmental management, rather
than greater income from farming itself, but it rewards through a ‘positive incentive’
payment approach that promotes environmentally friendly practises in farming.

186
Table 9.7: Some examples of the environmental issues associated with maize cultivation in the ECSFDI scheme.
Priority problem/issue Description Justification
4. Waveney
Soil erosion from steeper slopes/lighter soil arable fields along Waveney River terraces.
Relatively small areas of glacial sandy soil with slopes greater than 3o particularly those with maize and root cropping.
Data analysis has highlighted these areas and soil risk assessment makes them high risk.
5. Rivers Axe and Otter (Upper Otter)
Phosphates and sediment.
A steep, highly connected catchment dominated by soils with high clay and silt content. In association with high rainfall, this topography leads to poor drainage and high levels of runoff. Land use is dominated by dairy farms, some of which have manure, management and infrastructure problems. Maize is being increasingly grown for silage.
Although the RQO failure may not be as serious as it seems, this is the only stretch of river within the catchment that has failed RQO with diffuse pollution implicated as a source. This area of the catchment has received little landcare support in the past when compared to other parts and may benefit greatly from CSF interaction.
9. North Norfolk Rivers
High risk crops for soil erosion including spring-sown cereals, field vegetables, sugar beet, maize, potatoes and pigs.
These crops are considered high risk due to the nature and timing of their operating, thus resulting in land being left bare during periods of high rainfall. This may result in soil erosion and runoff into watercourses, either through field drains, onto roads, and into fords, or directly into watercourses.
Anecdotal evidence and modelled data has identified this area as high risk due to soil types, slopes, connectivity to watercourses and land use. This problem can realistically be tackled within the scope of the CSF programme, through soil erosion workshops for farmers, one to one advice and the capital grants scheme.
10. Headwaters of Wissey and Little Ouse
Sediment deposition is caused through soil erosion and soil wash from steeper slopes/lighter soil and areas of heavier soils in arable fields. Fen and sand blows occur when soils are dry and subject to a lack of crop cover.
Relatively small areas of sandy soils with slopes greater than 3o, particularly those with maize and root cropping.
Data analysis has highlighted these areas and soil risk assessment makes them high risk.
17. River Nar and Great Cressingham Fen
High risk crops for soil erosion including spring-sown cereals, field vegetables, sugar beet, maize and potatoes.
Site entering watercourses via runoff from fields / farm tracks to roads, and fords, and via under drains on heavier land. This is an issue throughout the target area.
Anecdotal evidence and modelled data has identified this area as high risk due to light soil types which are easily eroded, heavier soil types which are drained, steeper slope, high connectivity to watercourses, and high risk land uses. This problem can realistically be tackled within the scope of the CSF programme through soil erosion workshops for farmers, one to one advise and the capital grants scheme.
Continue in next page

187
19. River Waver and Wampool
Increased popularity of maize growing across the catchment.
Maize growing has become increasingly popular over the last few years with improvements in varieties. The extent to which this is occurring across the catchment has not been recorded.
With improving varieties and potential to grow maize across the catchment, it may become more prevalent on increasingly inappropriate land. Note may need to be taken on the slopes and soil types on which maize is appearing.
20. South West (Upper Frome)
Phosphorus and sediment.
A tributary much like the Hooke with more intensive agriculture, particularly higher concentration of maize and other arable.
Pollution situation in this rural catchment is uncomplicated, however there is a short and minor involvement of the Landcare programme in the past that should be built on before it becomes to old. There are existing contacts and support structures from the Landcare programme that can be built on.
21. Yorkshire Derwent (Helmsley and upper Rye catchment)
Runoff and sediment.
Extensive areas of winter wheat, maize, potatoes and other arable crops establishment on a variety of gradients including steeply sloping land, and soil types including sandy loams and shallow lime rich soils.
High rainfall (837 to 1021 mm) combined with steep gradients and the soil types of the area can result in some agricultural land generating high runoff bringing very high volumes of sediment into the River Rye and the Derwent River system.
23. River Wye (excluding Lugg)
Agricultural diffuse pollution from maize growing.
Maize is harvested in the autumn and land is left bare over the winter with just the stubble present, this land is often used as an area to dispose of slurry / muck in the winter months.
Improved management of maize ground could provide benefits with regards to less muck / slurry runoff and less soil erosion.
36. North Somerset Moors (Congressbury Yeo)
Phosphate, sediments and nitrogen.
Steep slopes on the Mendip Hills and Broadfield Down. Areas of intensive dairy pigs, poultry and maize with the high conservation value Blagdon Lake SSSI.
This sub-catchment contributes sediments and nutrients to the catchment, eventually flowing into Blagdon Lake SSSI. This catchment is relatively rural with most pollution likely to arise from agriculture. However, there are many small villages and two STW’s present. Presence of significant amounts of duckweed and algae indicate nutrient enrichment. This sub-catchment has received little targeted Diffuse Pollution advice in the past or present, so there is a real opportunity here to have an impact.
# RQO – River Quality Objective
Source: DEFRA, 2006c

188
Basically, the AES requires farmers to meet the farming management and practices
required by the Code of Good Agriculture Practice (COGAP). This code is designed to
provide practical guidance to support farming activity in terms of avoiding landscape
damage and pollution. It covers three components; (i) water, (ii) air, and (iii) soil.
Farmers, agricultural contractors and land owners are required to be more aware of their
responsibility in protecting these components from serious environmental damage and
pollution. In addition, the codes describe the main risks of causing damage and
pollution associated with different arable practises and promotes the adoption of good
agricultural practises that minimize the risk of causing damage and pollution.
In the case of maize cultivation, the codes for water and soil are the most important to
take into account in farm management and farming practices. The Code of Good
Agricultural Practise for the Protection of Soil (COGAP-POS) is a practical guide to
avoid causing long-term damage to the soils and it provides guidance to maintain and
increase the ability of soil to support plant growth. This code covers six elements; (i)
soil fertility, (ii) soil compaction, (iii) soil erosion, (iv) soil mixing, (v) soil
contamination, and (vi) restoring disturbed soils. Table 9.8 summarizes some of the
early action that farmers, contractors and farm owners have to take into account in
managing their farm and arable land. In relation to maize cultivation, maize growers
have to give more attention to the soil erosion and soil compaction elements to protect
the soil from soil erosion impact and soil compaction damage. This includes avoiding
growing maize on susceptible sites, such as steep slope and light soil, and reducing
runoff by protecting bare ground after harvest with undersown cover crops or other
practical measures15.
15 Details on soil erosion protection as suggested in COGAP-POS can be found in paragraph 63-75 from COGAP-POS guideline (MAFF, 1998a)

189
Table 9.8: A summary of the key elements in the Code of Good Agricultural Practise for the Protection of Soil (COGAP-POS)
Elements Guidance
Soil fertility • Maintain or enhance the chemical and physical fertility of the soil (Paragraphs 30-33, and 46-49)
• Aware soil acidity and liming level (Paragraphs 34-45) • Aware soil nutrient contents (Paragraph 43)
Soil compaction
• Aware land capability and soil ability to cultivate (Paragraphs 51-52)
• Avoid unsystematic harvesting practises (Paragraphs 53-54) Soil erosion • Consider possibility of soil erosion in farming processes (after
ploughing, crops growing periods, after harvested) (Paragraphs 63-65)
• Apply appropriate management to reduce the risk of water erosion and runoff (Paragraphs 66-75)
Soil mixing • Avoid deep cultivation (Paragraphs 88-91) • Plan carefully for the disturbance soil (Paragraphs 92-93)
Soil contamination
• Recognize potential of contamination sources (organic and inorganic) (Paragraphs 96-101)
• Get expert advice to manage contaminant soil (Paragraphs 102-112)
Restoring disturbed soils
• Action must be taken during agricultural after care (cropping, cultivations, lime and fertilizer, drainage, sub-soiling, grazing management and monitoring) (Paragraphs 181-201)
Source: MAFF, 1998a
The Code of Good Agricultural Practise for the Protection of Water (COGAP-POW) is
a guideline to avoid causing water pollution from different agricultural and horticultural
sources. This code covers 12 elements16 but in the case of maize cultivation, they have
to give more attention to the nitrate and phosphorus code, associated with soil erosion
and diffuse pollution from maize fields.
16 The 12 elements of the COGAP-POWs’ are; (i) farm waste management planning, (ii) slurry, (iii) dirty water, (iv) solid manure, (v) silage effluent, (vi) fertilizer, (vii) fuel oil, (viii) sheep dip, (ix) pesticides, (x) disposing of animal carcases, (xi) nitrate and phosphorus, and (xii) specialized horticulture (MAFF, 1998b)

190
9.6 The Water Framework Directive (WFD) and Diffuse Water Pollution from
Agriculture (DWPA)
It is generally accepted that the agricultural sector is a major contributor to diffuse water
pollution problems as a result of poor farm management practises. ‘Diffuse water
pollution from agriculture’ differs from ‘non-point pollution’, and Silcock et al. (2004)
defined it as “pollution arising from agricultural land-use activities that are dispersed
across a cathcment, or sub catchment, and do not arise as a process effluent, municipal
sewage effluent or effluent discharge from farm buildings.” Based on the European
Union Water Framework Directive (EUWFD), the United Kingdom WFD target is to
have ‘good ecological status’17 by 2015 rather than just water quality targets based on
chemistry indicators. Under the WFD, all water bodies, (rivers, lakes, transitional waters
and coastal waters) have to satisfy certain chemical and hydromorphological criteria set
in Annex V of the WFD. Four agencies are responsible for implementing the WFD in
the UK, and DEFRA, in cooperating with the Environment Agency (EA) are
responsible for England.18
The main water pollutants associated with agriculture that become targets in the WFD
in the UK for achieving ‘good ecological status’ are; (i) nitrogen and phosphorus, (ii)
siltation, (iii) organic waste, (iv) pesticides, (v) veterinary medicines, and (vi) micro-
organisms. To support the WFD associated with DWPA, River Basin Management
Plans (RBMPs) have been introduced and River Basin Planning Guidance (RBPG) can
be use to guide actions needed to fulfil the WFD requirements. In addition, to support
17 The ‘good ecological status’ of water quality is based on the ecological structure of natural systems, and the good ecological standards are set to the ecological conditions of reference condition, which ecological status standards and chemical standards of ‘good status’ vary between water bodies and regions or areas (MAFF, 1998b) 18 Besides England, the implementing agency of the WFD in Scotland is the Scottish Executive co-operating with the Scottish Environment Protection Agency, the Welsh Assembly Government for Wales, co-operating with EA, and the Department of the Environment Northern Ireland co-operating with Environment and Heritage Service in Northern Ireland for Northern Ireland (Green and Fernández-Bilbao, 2006)

191
reducing DWPA associated with the nutrient problem (nitrogen and phosphorus),
DEFRA also launched the Nitrate Vulnerable Zones (NVZ) in England, co-operating
with the EA to monitor the level of nutrients in surface freshwater19, groundwaters20 and
natural freshwater bodies21. In total, 55.0% of England was designated as a NVZ in
2002 and the area of the NVZ can be seen in Figure 9.4
Source: DEFRA, 2006c
Figure 9.4: Map shows the Nitrate Vulnerable Zones in England
In the context of maize cultivation, the primary concern of the WFD regarding the
DWPA is pollution by atrazine. This pesticide is the mainstay of weed control in maize
cultivation. The main problem caused by atrazine is the risk of contamination of
groundwater. In addition, as discussed in a previous section of this chapter, most maize
19 The concentration of nitrate in surface freshwaters should not be more than 50 mg/l. 20 The concentration of nitrate in groundwaters should not be more than 50 mg/l. 21 The indicator nitrates pollution in the natural freshwater is based on eutrophication.

192
fields are left bare during winter, and subject to the risk of water erosion and runoff,
which can pollute watercourses with nutrients, pesticides and sediment. These pollutants
are also of concern under the WFD to reduce the off-site impact of maize cultivation.
9.7 Discussion and Recommendation
Sections 9.2 to 9.6 review various environmentally friendly schemes in England
designed to achieve the CAP and WFD objectives, and aimed more generally at
achieving a better landscape and good ecological condition across the country. In
general, the CAP and WFD targets and requirements involve interaction between human
and physical aspects to maintain and enhance good environmental quality for both
habitats and landscape. Agriculture has become a major sector in England, contributing
to environmental problems in many ways and increasing the cost of conservation and
rehabilitation.
The SFPS-SPS, ESS-ESAs, CSF-ECSFDI, and AES schemes should be seen as
supporting schemes for the CAP and WFD targets. Each scheme is implemented
simultaneously, and farm or land managers and farmers are advised to follow several
guidelines in each scheme (GAEC, SMRs, SPR, SMP, FER, FEP, RBPG), which are
also based on COGAP-POS and COGAP-POW, to qualify their payment claims. In the
case of maize growers, all these guidelines and requirements should prove very useful in
preventing water erosion and runoff from maize fields, and should reduce diffuse
pollution to adjacent watercourses caused by soil erosion and transport of nutrients,
pesticides, and sediment by runoff. These guidelines require maize growers to establish
their cultivation plan before they start ploughing the land and sowing the seed, and to
practice post-harvest planning to avoid environmental problems associated with soil
erosion and diffuse pollution.

193
To summarize, maize growers have to avoid growing maize on fragile land susceptible
to water erosion and runoff, especially in high risk areas. Fragile land refers to light
soils, which are susceptible to soil detachment caused by rainfall impact and promotes
soil erosion. In addition, they should avoid steep slopes as this encourages runoff, and
transportation of sediments and nutrients to nearby watercourses. After harvest, maize
growers are advised to cultivate winter crops or surface cover with grass to reduce the
impact of raindrops. The risk assessment also requires maize growers to plan crop
rotations and minimize exposure of bare land to the effects of rainfall by considering the
type and timing of maize cultivation. Harvest contractors are advised to harvest maize
based on strips across the slope to reduce runoff impact.
Soil compaction can readily occur on vulnerable fields and this can also increase runoff
and soil erosion rates. In order to avoid this problem, maize growers are advised to
choose early-maturing maize varieties to allow an early harvest. Some of the top quality
early-maturing maize varieties are Caruso, Target, Pernel, Diplomat, Meribel,
Spartacus, Santiago, Kroesus, and Kwiss (Huntseeds). Huntseeds Ltd. provides a guide
to choosing the correct early-maturing varieties to meet the physical conditioning and
harvest dates for several counties in England and Wales as shown in Table 9.9. In order
to cover the bare surface after harvesting, maize growers frequently cover the surface
with animal waste to encourage grass to grow. Based on the author observation during
soil sampling, many farmers practised this method, which is a relatively easy and cheap
approach to protecting the fields based on farmers’ perception. However, this practise
may contribute to diffuse pollution through movement of organic waste to watercourses
when runoff occurs.

194
Table 9.9: An example of choosing correct early-maturing maize based on maturity score
What is your target harvest date?
Sept 15th to 22nd
3
Sept 23rd to 30th
2
Oct 1st to 7th
1
Oct 8th to 15th
0
What is your target drilling date?
April before 10th
0
April 10th to 20th
1
April 21st to 30th
2
May 1st to 10th
3
May After 10th
4
What is the altitude of the field?
Feet 0-149
0
Feet 150-299
1
Feet 300-449
2
Feet 450+
3
What type of soil do you have?
Light Fine
0
Medium Good
1
Heavy Cloddy
2
Very Heavy Very Cloddy
3
What is your annual rainfall?
Low 10" - 27"
0
Medium 28" - 39"
1
High 40" +
2
County Score County
Score
Berkshire 0 Lincolnshire
1
Buckinghamshire 0 Norfolk
0
Cambridgeshire -1 Northamptonshire
1
Cheshire 1 Nottinghamshire
1
Cumbria 2 North & Mid Wales
2
North Devon/Cornwall 2 Oxfordshire
0
South Devon/Cornwall 0 Scotland
3
Derbyshire 2 Shropshire
0
Dorset 0 Somerset
0
Durham 2 Staffordshire
1
Essex -1 South Wales
1
Gloucestershire 0 Suffolk
0
Glamorgan 1 Surrey
0
Gwent 1 Sussex
-1
Hampshire -1 Warwickshire
1
Herefordshire 0 Wiltshire
0
Hertfordshire 0 Worcestershire
1
Kent -1 Yorkshire (North)
2
Lancashire 1 Yorkshire (South)
1
Leicestershire 1 County Score Here >
Now add them up for your maturity group =
Source: Huntseeds

195
All guidelines under the above schemes are clearly useful in promoting an
environmentally friendly approach by maize growers to reduce on-site (soil erosion and
runoff) and off-site (diffuse pollution) impacts. All these requirements are considered
sufficiently environmentally friendly to conserve and rehabilitate the soil and
watercourses from soil erosion and diffuse pollution caused by maize cultivation in
England. ‘Big rewards’ are given to maize growers who participate in the AES. These
guidelines can be an important incentive in the future to encourage them and other
maize growers to take serious action in helping the country to promote sustainable
landscape and habitats.
To ensure that maize growers are fully aware of their responsibility to support the
national targets on environmentally friendly and sustainable development of both the
landscape and habitats, there is a need to raise awareness of the issue among them.
Farmers should have ready access to information regarding the environmental problems
associated with maize cultivation, to permit them to develop a clearer understanding of
these problems and potential approaches for reducing them. Based on the author’s
experience during a field programme of maize field mapping undertaken in 2004, many
farmers complained of difficulties in obtaining access to information on guidelines, and
beyond this there is a need to provide both consultation and advice, especially with
regard to managing their land using environmentally friendly approaches as mentioned
in the guidelines. Many farmers do not have access to the internet or probably do not
want to use this technology, which can provide them with a free guidelines document.
DEFRA and related agencies need to be more active in organizing meetings, probably at
the parish or community level, and for farm associations, to provide relevant
information and advice on following the guidelines. This must be seen as a first

196
approach to disseminating the information from the top or from the decision maker level
to farmers at the ground level.
In addition, maize growers need to assume greater environmental responsibility when
planning to grow maize, particularly in terms of developing a strategy to protect the soil
and reduce runoff, that suits the local soil type and slope steepness. Existing guidelines
advise maize growers to protect the soil surface during winter by growing winter crops
or grassing the surface. On top of this, with regard to winter cropping, they are
recommended to undertake chisel ploughing, which can increase water infiltration,
thereby reducing runoff, and retaining nutrients. These approaches have already proved
to be effective in reducing runoff and soil loss (Clements and Donaldson, 2002;
Clements and Lavender, 2004).
In the case of growing grass as a surface cover, based on the author’s observations and
interviews with maize growers, many of them apply animal wastes (especially cow
waste) in order to encourage grass to grow faster and as an early input of organic
fertilizer in advance of the growing season in spring. However, this practise could
increase pollution problems, as the waste could be transported by runoff to nearby
watercourses. The existing guidelines do not incorporate this matter, except in advising
farmers to apply appropriate amounts of fertilizer, including organic fertilizer, during
crop growth. Maize growers should be advised to practice a similar approach to that
which they are told to follow during the growing period. This would involve applying
animal waste at an appropriate rate to each bare maize field for the purpose encouraging
the growth of grass after harvesting. Farmers are also advised to apply ryegrass as
demonstrated by Van Dijk et al (1996a), since it is effective in reducing surface runoff
and soil loss during winter.

197
Based on the author’s observations during field mapping, maize fields are often located
in a sequence running from the top to the bottom of the slope, one below the other.
Maize growers should avoid this practise when growing maize on steep slopes, because
it could increase the volume of runoff and also promote channelization and thus
increased flow velocity when runoff from upslope reaches the second field. This could
increase surface erosion and transfer more sediment to adjacent watercourses. The
author’s observations also indicated that many maize growers plant maize from the top
to the bottom edges of the field. At the bottom of the slope, especially for steep slopes,
maize growers are advised to leave a strip of vegetation cover to act as a sediment trap.
This natural trap can also slow down the runoff before it reaches a watercourse. Maize
growers can also construct detention ponds between two fields to reduce runoff on the
second field.
In order to reduce the impact of soil compaction on soil erosion caused by heavy harvest
machinery, farmers are advised to deal with harvest contractors who to avoid the use of
wheel tractors and employ rubber-tracked vehicles. Keller et al. (2002) demonstrated
that rubber-tracked reduced subsoil compaction by reducing vertical stress and soil
displacement. However, farmers are also advised to consult with their harvest contractor
regarding use of rubber-tracked vehicles, in order to take account of the soil type and
field conditions.
9.8 Conclusion
This chapter has reviewed and discussed current policy associated with maize
cultivation management in England. The CAP and the WFD are considered to represent
the key legislative drivers in terms of protecting soil from water erosion and runoff, and
in reducing diffuse pollution into watercourses. In order to support both areas of

198
legislation, various environmentally friendly schemes have been introduced under the
agri-environment scheme. This scheme offers very big rewards, in terms of payment,
for maize growers that can practise environmentally friendly approaches, as suggested
in various schemes under the AES. However, the effectiveness of these schemes in
preventing and protecting land and soil, and watercourses, especially rivers, from soil
erosion and diffuse pollution associated with maize fields will be heavily dependent on
the attitude of land managers, farmers and harvester contractors in understanding the
targets of the CAP and the WFD, and co-operation within DEFRA, EA and other related
agencies to support the AES. In addition, maize growers and harvesters also have to
change their current unfriendly environmental practises in growing maize, as
emphasised by the government and recommended by the author.

199
CHAPTER 10: CONCLUSION
10.1 Introduction
The main objective of this research was to investigate the soil erosion problem
associated with maize cultivation in England. Maize cultivation, generally has been
identified as a key cause of river pollution during the winter period and more
particularly of increasing fine sediment loads which cause degradation of aquatic
habitats and ecosystems. These problems are frequently linked to land mismanagement
and environmentally unfriendly attitudes among farmers and harvest contractors.
Growing maize as a fodder crop has expanded rapidly in England, especially between
1990 to 2000. Furthermore, maize cultivation is primarily undertaken to support dairy
farming where maize silage is used to feed dairy cows.
Most of the areas of major expansion of maize cultivation and its intensive production
during the 1970s to the early part of the 2000s were located in the Southwest and
Southeast regions. Together, these regions accounted for ca. 61% of the area of maize
cultivation in England in 2003. This study was also narrowed down to the catchment
scale and analysed the spatial and temporal patterns of maize cultivation in the Culm
Catchment in Devon and the Tone Catchment in Somerset, both in the Southwest
Region. Spatially, most of the maize fields in the Culm and Tone catchments occurred
in the middle and downstream parts of the catchments, and ca. 60% of the maize fields
can be found located within 100 m from the river systems. This could in itself be a key
factor in any investigation of the link between sediment input for maize fields and
increased suspended sediment loads in the river systems.

200
In order to understand the soil erosion problems associated with maize cultivation in
England, this research has attempt to quantify the magnitude of the soil erosion rates
associated with maize cultivation. This investigation of soil erosion rates was at the field
level using fallout radionuclide techniques. 7Be measurements were used to obtain
estimates of short-term erosion rates associated with previously harvested maize fields
during the winter of 2004-5, and 137Cs measurements were used to obtain estimates of
longer-term (i.e. ca. 45 years) average rates of soil loss from the same fields under the
more traditional land use of the past. Comparison of the two erosion rate estimates
afforded a means of assessing the magnitude of the increase in erosion rates associated
with maize cultivation. The study focused on six fields, with three located in the Culm
catchment in Devon and three in the Tone Catchment in Somerset.
In addition, a further investigation of suspendent sediment problems in the River Culm
and River Tone was undertaken, in order to assess the likely contribution of the
sediment contribution from the maize fields in these two river basins to their suspended
sediment loads. A river monitoring programme was undertaken at the outlets of the two
study catchments during the winter period extending from November 2004 to March
2005. This monitoring programme provided further information on the likely role of
maize cultivation in contributing to the suspended sediment loads of the Rivers Culm
and Tone.
This final chapter aims to summarize the research findings of the study and their
potential contribution to the agriculture sector, especially in England and the United
Kingdom, in terms of management aspects associated with preventing soil erosion and
reducing sediment inputs to river systems caused by maize cultivation. In addition, this

201
chapter will discuss some recommendations which might be followed in the future to
obtain an improved understanding of the impact of maize cultivation in England.
10.2 Maize Cultivation in England: Spatial and Temporal Characteristics and
Trends
In this component of the study, spatial and temporal patterns of maize cultivation were
analysed at the national and regional scales. Data on maize cultivation were obtained
from the EDINA data centre at Edinburgh University, for selected years during the
period extending from the 1970 to 2000 and these data were analysed using the
Geographical Information System (GIS) of ArcMap, version 8.3, to characterize the
spatial and temporal patterns of maize growing in England. For the analysis of temporal
patterns, data were also obtained from the DEFRA website and were in Excel for trend
analysis.
The results of the analysis undertaken showed that over the past ca. 15 years since 1990,
the area under maize cultivation had increased by 223% by 2004. Compared to 1970,
the increase in the area under maize had increased 10,640% by 2004. Several factors
were identified as a major causes of expansion of the area under maize cultivation in
England, however, the EU Common Agricultural Policy (CAP) appeared to be the most
important. This can be related to market price support and aid in terms of income
support, in the form of area payments under various schemes, such as the Arable Area
Payments Scheme (AAPS) and the Single Payment Scheme (SPS). In addition,
expansion of dairy farming in the United Kingdom, and also England, since the 1970s,
was identified as a further cause of the expansion. This can be related to the increased
demand for forage to support ca. 2 million dairy cows in the 1990s and ca. 1.5 million
dairy cows in the early 2000s.

202
Although maize has been grown as a fodder crop in England since 1970, the area
involved was initially small, covering an area of less than 10,000 ha. However, the area
of maize cultivation expanded rapidly in the 1980s, 1990s and 2000s, with decadal
increases of ca. 87%, 297% and 63%, respectively. It is also important to note that the
area of maize cultivation in England evidenced very rapid expansion between 1990 and
1995, when all regions in England, with the exception of the eastern region, showed a
greater than 100% increase in their area under maize cultivation. The Southwest,
Southeast and West Midlands regions were identified as an important area of maize
growing in England since the 1970s.
In the context of maize cultivation in the Southwest region, the counties of Somerset,
Dorset and Devon had the largest areas cultivated with maize in the 1990s and 2000s.
However, in the 1970s and 1980s, maize growing was only important in Somerset,
Dorset and Wiltshire. By 2000, the area of maize cultivation in the Southwest region
had expanded by 182%, when compared to 1990. In addition, the increase in the density
of maize cultivation in the three most important counties in the 2000s, showed a similar
trend to the increase in the number of dairy cows, which increased by ca. 3,587%
between 1990 and 2000 (see Table 4.2).
10.3 Rates of Soil Loss Associated with Maize Cultivation in England
Fallout radionuclide measurements have been used to assess the magnitude of soil
erosion rates associated with winter rainfall on bare post-harvest maize fields in six
study fields located in the Culm and Tone catchments. Measurements of short-term
rates of soil erosion have been undertaken using 7Be fallout, whilst the 137Cs
measurements have provided estimates of longer-term (i.e. ca. 45 year) erosion rates
associated with more traditional land use. Soil sampling was conducted on maize fields

203
which had been used for maize cultivation for at least three years in a row since 2002. A
profile distribution model was used to convert the 7Be measurement into estimates of
soil redistribution rates and a mass-balance model (Mass Balance Model 3 of Walling
and He (1999)) was used to derive the estimates of longer-term erosion rates from the
137Cs measurements. The findings suggested that on average maize cultivation caused
the gross and net erosion rates to increase by ca. 4 and 8 times, respectively, with the
associated sediment delivery ratio increasing by ca. 2 times (refer to Table 6.7). The
increase in the sediment delivery ratio and thus the greater increase in net erosion rates
is of particular significance in terms of increasing delivery of sediment to the stream
channels. However, it is important to recognize that these results relate only to a specific
year i.e. the winter of 2004-5. Both higher and lower values of soil loss could be found
on the maize fields in other years, depending on the winter rainfall conditions.
Conditions in 2004-5 were judged to be ‘average’ and the results are therefore seen to
provide a worthwhile general indication of the rates of soil loss involved. Equally, it
must be recognized that the estimates of longer-term soil loss associated with the 137Cs
measurements themselves include several recent years with increased soil loss resulting
from maize cultivation and thus that the estimates of the degree to which maize
cultivation has increased soil losses could be seen as underestimates. Overall, the results
of this component of the study highlight the potentially high rates of soil loss associated
with bare maize fields after harvest and thus their potential significance as a source of
increased sediment input to stream channels.
In considering the wider implications of the results outlined above, it is important to
consider key features of maize cultivation in England, which appear to increase the
potential for high rates of soil loss and sediment delivery to stream channels. As noted
in Chapter 8, most of the area of maize cultivation in England occurs on soils (e.g.

204
sandy loam types) that are particularly susceptible to erosion by rainfall. In addition,
many maize fields are located relatively close to watercourses and are characterized by
relatively steep and long slopes. These factors are likely to increase the erosion risk and
the efficiency of sediment delivery to watercourses.
10.4 The Contribution of Maize Cultivation to the Suspended Sediment Loads of
Local Rivers
An investigation of the suspended sediment loads transported by the Rivers Culm and
Tone was conducted during the winter of 2004-5. The investigation attempted to
provide an assessment of the likely importance of sediment inputs mobilized from
eroding maize fields to the sediment loads exported during the winter period from the
two catchments. This has been achieved by establishing a sediment monitoring and
sampling programme at the downstream gauging station over the period November
2004 to March 2005.
The findings confirmed that values of suspended sediment concentration (SSC) and
turbidity (T) are closely related for the River Culm and River Tone, with high r2 values
of ca. 0.98. Average values of SSC estimated for both rivers were ca. 30-50 mg l-1,
indicating that the rivers are relatively turbid and that they transport a considerable
amount of suspended sediment during the winter period. The records of SSC obtained
for both rivers were used to estimate the suspended sediment loads for the study period.
These were in the range 2,600-3,200 tonnes, and therefore equivalent to suspended
sediment yields of 14.2 t km-2 and 12.8 t km-2 for the catchments of the River Culm and
Tone, respectively.

205
Any attempt to compare these estimates of the sediment load of the Culm and Tone
catchments with the likely sediment input from the maize fields in the two catchments,
based on the estimates of rates of net soil obtained from the 7Be measurements must
attempt to take account of both the conveyance losses associated with transfer of
sediment from the field boundary to the stream and the reduction in the sediment load of
the river due to conveyance losses associated with sediment deposition within its
channel. By taking these losses into account and also by considering the relative
magnitude of rates of net soil loss from the maize fields and fields under other land use
in the study catchments, it was tentatively concluded that potentially ca. 50% of the
suspended sediment loads transported by the Rivers Tone and Culm during the winter
period could be contributed by eroding maize fields. However, further work is required
to substantiate and refine these estimates and calculations.
In an attempt to confirm the above conclusions regarding the importance of maize fields
as a source of the suspended sediment loads transported by the two study rivers, the
geochemical properties of representative samples of surface soil collected from maize
fields were compared with those of the suspended sediment transported by the two
rivers. Problems of comparability associated with contrasts in grain size composition
and organic matter content between the suspended sediment and source materials
samples, as well as the limited number of geochemical properties that it was possible to
consider, necessarily limited the degree to which any definitive conclusions could be
drawn regarding the importance of sediment contributions from maize fields. The
information on Cr, Cu, Fe, Pb-206, Pb-207 and Pb-208 concentrations, nevertheless,
provided some evidence that the sediment transported by the two rivers could have been
mobilized from the maize fields during the winter periods. Overall, the conclusions
based on a comparison of the geochemical properties of sediment transported by the
206
rivers and those of potential source material from the maize fields proved inconclusive,
but equally the findings were generally consistent with a scenario where the maize
fields were an important source.
10.5 The Environmental Impact of Maize Cultivation in England
This study also attempted to provide a general national-scale assessment of the
environmental impact of maize cultivation in England, with particular emphasis on
increased sediment inputs to rivers. This assessment was linked with the national-scale
information on the efficiency of sediment delivery from agricultural land provided by
McHugh et al. (2002). Based on the national scale maps of connectivity index and
connectivity ratio, it was clear that there is a clear link between those areas where the
maize cultivation is denser, and those areas with a high sediment delivery efficiency and
thus an increased risk of sediment transfer to watercourses. Similar analysis involving
erosion vulnerability maps also demonstrated that most areas of maize cultivation in the
Southwest, Eastern and West Midlands were located in areas with erodible soils that are
accepted to be vulnerable to the risk of erosion.
Further analysis was conducted to analyse possible links between diffuse pollution of
rivers and maize cultivation. The results indicated that, in general, the areas with the
highest risk of phosphorus loss are also closely linked with areas of intensive maize
cultivation and thus increased transfer of fine sediment to local watercourses. In the case
of Southwest England, where dairy farming is important, the high concentration of
phosphorus in the rivers could be, at least in part, directly related to maize cultivation.
207
10.6 Maize Cultivation Management in England
As demonstrated by the review of existing understanding and information and the
results obtained from this study, it is clear that maize cultivation has significant negative
impacts on the environment. This negative impact is associated with soil erosion
problems at the field level and increased transport of suspended sediment by local
rivers. The study therefore attempted to review current policy associated with
agricultural land management in England, in general, and maize cultivation, in
particular. This review focused on the Common Agricultural Policy (CAP) and the
Water Framework Directive (WFD). These aim to promote sustainable and
environmentally friendly approaches to land management, in order to reduce both the
on-site and off-site impacts of farming activities and maintain good ecological status in
rivers and aquatic ecosystems, rather than being specifically directed at maize
cultivation.
Many schemes, such as the Single Farm Payment Scheme (SFPS), the Environmental
Stewardship Scheme (ESS) and the Catchment Sensitive Agri-Environment Scheme
(AES) are directed to achieving and supporting CAP and WFD targets. Thus specific
schemes and environmentally friendly guidelines, such as the Good Agricultural and
Environmental Condition (GAEC) and the Soil Protection Review (SPR) could prove
very useful in preventing water erosion and runoff from maize fields and therefore
reduce suspended sediment inputs to nearby watercourses.
10.7 The Wider Contribution of the Study
Although the general problem has been recognized for more than a decade, soil erosion
and diffuse pollution of watercourses associated with maize cultivation in England has
not been well documented, when compared with work on other crops. Only very few

208
studies have been undertaken in England in order to understand the environmental
impact of maize cultivation. These include the work reported by Walling et al. (1999a),
Clements and Donaldson (2002), and Clements and Lavender (2004). The study by
Walling et al. (1999a) was in many respects more advanced, since their study involved
investigation of both on-site and off-site impacts of maize cultivation in Devon, whereas
the studies by the other two authors focused primarily on on-site impact in terms of soil
erosion control.
This study can be seen as providing additional scientific evidence and results to support
previous findings by other researchers, in order to develop an improved understanding
of the environmental problems caused by maize cultivation in England. As well as using
the fallout radionuclide 137Cs to provide estimates of longer-term erosion rates, this
study also involved the use of 7Be to estimate short-term erosion rates. Although others
such as Blake et al. (1999) and Walling et al. (1999a) have used 7Be to document short-
term erosion rates associated with maize cultivation, that work involved only a single
field and a short period of heavy rainfall. In this study, measurements were undertaken
on six different fields located in the two study catchments and the timescale involved
was longer, in order to capture the main period of heavy winter rainfall in December
2004 and January 2005. The increased number of study fields in this study provided a
meaningful basis for obtaining representative information on likely gross and net
erosion rates associated with post-harvest maize fields during the winter period, in the
Culm and Tone catchments. The study has also provided further confirmation of the
potential for using the short-lived cosmogenic fallout radionuclide, 7Be, in soil erosion
and sediment delivery investigations and particularly its conjunctive use with 137Cs
which is able to provide a longer-term perspective.

209
The findings from this study must be seen as important in terms of current land
management agendas in England. As indicated in Chapter 9, the EU Common
Agricultural Policy (CAP) and Water Framework Directive (WFD) are aimed at
reducing both the on-site and off-site impacts of farming activities more generally,
rather than maize cultivation in particular. However, in this wider context, the findings
of this study clearly confirm the negative on-site and off-site impacts of maize
cultivation in England and demonstrate the need for urgent action to avoid further
environmental damage that could be caused by the poor land management practises of
maize growers and harvest contractors. The various environmentally friendly schemes
and guidelines that are being introduced in England should incorporate measures aimed
specifically at reducing erosion on maize fields and thereby limiting the associated
suspended sediment problems in river systems.
Furthermore, the findings of this study could also provide agricultural policy makers
with clear evidence of the detrimental effects of maize cultivation in England on both
soil erosion and diffuse source water pollution in river systems associated with maize
cultivation in England. In general, the findings show that most of the areas of denser
maize cultivation in England coincide spatially with soils that are susceptible to erosion
and that maize fields are frequently located very close to watercourses. Since this study
has demonstrated a close link between increased suspended sediment loads in rivers and
sediment inputs from eroding maize fields, policy makers should recognize that there is
an urgent need to ensure that farmers are actively advised not to grow maize too close to
watercourses.

210
10.8 Recommendations for Future Work
Although this study is deemed to have fulfilled its original aims and objectives, it is also
recognized that it has a number of limitations that could be addressed by additional
work. Equally, the work undertaken has pointed to others areas of work related to the
general topic and approach taken, which could usefully be developed. In these two
contexts, some areas that could be addressed by future work include the following.
(1) The current detailed study of erosion rates and sediment transfer to rivers
undertaken in the catchments of the River Culm and Tone is limited to a single
winter. This represents an important limitation when viewed againts the natural
variability of weather conditions from year to year. Further studies aimed at
documenting additional years would provide more representative information
on the magnitude of erosion rates associated with the exposure of bare post-
harvest maize fields to heavy winter rainfall. In this context, it is important to
consider both the conditions at the time of harvest, which will influence the
degree of compaction and soil damage caused by harvesting machinery and the
magnitude and timing of the subsequent winter rainfall.
(2) The quantitative assessment of erosion rates associated with eroding maize
fields undertaken in this study was based on six fields. Although this number of
fields was considerably greater than those involved in other work, it must
nevertheless still be seen as limited. It was, however, not possible to increase
the number of fields sampled within the constraints of the time and laboratory
facilities available to the current study. However, provision of more resources,
including both manpower and gamma counting facilities could in the future
permit a greater number of fields to be studied. Investigation of a greater
211
number of fields would in turn provide more representative results.
Furthermore, by covering a greater range of soil types, field sizes and
topographic conditions it should be possible to develop a typology which could
be used to extrapolate the findings to other fields and thereby obtain a more
reliable assessment of the likely erosion rates associated with the entire area of
maize cultivation within the study catchments. Furthermore, application of
recent developments in the methodology for using 7Be measurements to obtain
estimates of rates of soil loss over longer periods, extending to several months
(see Walling et al., 2009) would usefully provide information on soil loss for
the entire winter period, rather than the main period of winter rain.
(3) It is accepted that the component of the study related to documenting the
sediment loads of the two study rivers and attempting to link these to estimates
of the sediment input to the river systems from maize fields involved a number
of important limitations and uncertainties that precluded definitive conclusions.
Further work is clearly required to expand the geochemical source
fingerprinting component of the study that aimed to compare the properties of
suspended sediment with those of source material collected from eroding maize
fields. This should involve a greater range of source fingerprints, as well as
greater attention to standardizing the grain size distribution and organic matter
content between sediment and source material samples, in order to permit more
definitive discrimination of maize fields as a potential sediment source.
Equally, sampling of other potential sources would permit the use of a mixing
model to provide quantitative estimates of the relative contribution of maize
fields and other potential sources (e.g. Walling, 2005) and thus a more
definitive assessment of the importance of eroding maize fields as a sediment

212
source. The uncertainties regarding the conveyance losses associated with field
to river and in-channel/floodplain conveyance losses must similarly be seen as
an important limitation of the current study. Further work could usefully
attempt to establish a sediment budget for a small (e.g. 1 km2) catchment in
order to quantify the fields to channel conveyance losses for several maize
fields. The information provided by the mapping of the location of the
individual fields within the study catchments should also be incorporated into
any assessment of field to channel conveyance losses, since these will clearly
be influenced by the location of individual fields relative to the nearest water
course.
(4) The work undertaken on the Culm and Tone Catchments is necessarily rather
site specific and there is a needs to develop this further to use as a basis for a
more general model of the contribution of eroding maize fields to catchment
sediment yields for application within England. This modelling could usefully
integrate new empirical field data on erosion rates associated with maize fields
with existing information on the key controls of erosion rates (e.g. soil type,
topography, annual rainfall etc.) to provide a basis for predicting rates of soil
loss from eroding maize fields in different areas of the country. This could, in
turn, be combined with an improved representation of slope-channel
connectivity based on the empirical evidence assembled from further work in
the study catchments. It should prove possible to substantially refine and
improve the general approach adopted by McHugh et al. (2002) to take account
of the particular conditions found in most maize growing areas and the
magnitude of the potential soil losses. In their case, the estimation of
conveyance loss was largely independent of the magnitude of the erosion rate.

213
(5) Although some suggestions for improved land management and erosion
reduction measures have been made in this study, they are necessarily based
primarily on a general appraisal of measures currently used across a range of
land use types, although informed by some experimental work on maize fields
(e.g. Clements and Donaldson, 2002; Clements and Lavender, 2004). However,
if a strong case is to be made to implement such measures, it is important that
clear empirical evidence of their efficacy should be made available. Farmers
need proof that what they are asked to do will actually make a difference. Any
future study could therefore usefully include some experimental work aimed at
demonstrating the efficacy of various measures for reducing erosion and
sediment delivery from maize fields.
10.9 Concluding Remarks
Maize cultivation has become one of the main causes of river pollution in England, in
terms of increased sediment loads. This study has provided evidence of the high rates of
both gross and net soil loss that can be associated with eroding maize fields and the
links between such erosion and increased sediment loads in rivers. An eroding maize
field caused by heavy rainfall during the winter period can lead to significant sediment
inputs to the local river system and this increased sediment load can degrade the
ecological status of the river. Because many of the areas of intensive maize cultivation
in England coincide with areas of increased erosion risk, due the local soil type and of
increased sediment delivery efficiency which increases the potential for eroded
sediment to reach the river system, it is important that there should be a nationally
coordinated strategy, underpinned by legislation, to control this important
environmental problem.

214
REFERENCES
Advanta. http://www.advanta.fr/performa.cfm. Allen, S.E. 1989. Chemical analysis of ecological materials. Blackwell, Oxford. Alloway, B.J. and Ayres, D.C. 1997. Chemical principles of environmental pollution.
Blackie Academic & Professional, London. Anil, L., Park, J. and Phipps, R.H. 2000. The potential of forage-maize intercrops in
ruminant nutrition. Animal Feed Science and Technology, 86(3): 157-164. Ankers, C., Walling, D.E and Smith, R.P. 2003. The influence of catchment
characteristics on suspended sediment properties. Hydrobiologia, 494: 159-167. Basher, L.R. and Ross, C.W. 2001. Role of wheel tracks in runoff generation and
erosion under vegetable production on a clay loam soil at Pukekohe, New Zealand. Soil & Tillage Research, 62: 117-130.
Bell, M. and Boardman, J. 1992. Past and present soil erosion: An archaeological and
geographical perspective. Oxbow Books, Oxford. Blagoeva, R. and Zikovsky, L. 1995. Geographic and vertical distribution of Cs-137 in
soils in Canada. Journal of Environmental Radioactivity, 27(3): 269-274. Blake, W.H. 2000. The use of 7Be as a tracer in sediment budget investigations.
Geography Department, University of Exeter. Unpublished PhD thesis. Blake, W.H., Walling, D.E. and He, Q. 1999. Fallout beryllium-7 as a tracer in soil
erosion investigations. Applied Radiation and Isotopes, 51: 599-605. Boardman, J. 1984. Erosion on the South Downs. Soil and Water, 12(1): 10-21. Boardman, J. 1995. Damage to property by runoff from agricultural land, South Downs,
southern England, 1976-93. The Geographical Journal, 161(2): 177-191. Boardman, J., Evans, R. and Ford, J. 2003. Muddy floods on the South Downs, southern
England: Problem and responses. Environmental Science & Policy, 6: 69-83. Bonniwell, E.C., Matisoff, G. and Whiting, P.J. 1999. Determining the times and
distances of particle transit in a mountain stream using fallout radionuclides. Geomorphology, 27: 75-92.
Brassley, P. 2000. Output and technical change in twentieth-century British agriculture.
The Agricultural History Review, 48(1): 60-84.

215
Brazier, R. 2004. Quantifying soil erosion by water in the UK: A review of monitoring
and modelling approaches. Progress in Physical Geography, 28(3): 340-365. Brigstocke, T. 2004. The future strategy for dairy farming in the UK. The Royal
Association of British Dairy Farmers. Brost, R.A., Feicher, J. and Heimann, M. 1991. Three-dimensional simulation of 7Be in
a global climate model. Journal of Geophysical Research, 96(12): 423-445. Cambray, R.S., Playford, K., Lewis, G.N.J. and Carpenter, R.C. 1989. Radioactivity
fallout in air and rain: Results to the end of 1998. AERE-R-13575. UK Atomic Energy Authority, Harwell.
Chaowen, L., Shihua, T., Jingjing, H. and Yibing, C. 2007. Effects of plant hedgerows
on soil erosion and soil fertility on sloping farmland in the purple soil area. Acta Ecological Sinica, 27(6): 2191-2198.
CIA. https://www.cia.gov/library/publications/the-world-factbook/index.html. Clements, R.O and Donaldson, G. 2002. Soil erosion control in maize. EA R&D
Technical Report P2-123/1 (April). Clements, R.O. and Lavender, R.H. 2004. Measurement of surface water runoff from
maize stubbles in the Parrett Catchment area (Somerset): Winter 2003/04. Report to FWAG, 13 July 2004.
Collins, A.L., Walling, D.E. and Leeks, G.J.L. 1997. Source type ascription for fluvial
suspended sediment based on a quantitative composite fingerprinting technique. Catena, 29: 1-27.
Davis, J.J. 1963. Caesium and its relationship to potassium in ecology. In V. Schultz &
A.W. Klement Jr. (Eds.). Radioecology, Reinhold, New York: 539-556. DEFRA. 2001. Shifting support from the 1st to the 2nd pillar of the Common Agriculture
Policy (CAP). DEFRA. 2004. Mapping the problem-risks of diffuse water pollution from agriculture. DEFRA. 2005a. Controlling soil erosion: A manual for the assessment and
management of agricultural land at risk of water erosion in lowland England. DEFRA. 2005b. Organic Entry Level Stewardship handbook: Terms and conditions and
how to apply. DEFRA. 2005c. Higher Level Stewardship handbook: Terms and conditions and how to
apply. DEFRA. 2005d. Producing a soil management plan for environmental stewardship.

216
DEFRA. 2006a. Single Payment Scheme: Cross-compliance guidance for soil
management. DEFRA. 2006b. Single Payment Scheme: Cross compliance soil protection review. DEFRA. 2006c. River basin planning guidance. DEFRA. 2007. ECSFDI: The first phase-A compendium of advice activity examples. DEFRA. 2008. England Catchment Sensitive Farming Delivery Initiative 2008-2015. DEFRA. National Statistics. http://statistics.defra.gov.uk. ECN. http://www.ecn.ac.uk. El-Swaify, S.A. 1997. Factors effecting soil erosion hazards and conservation needs for
tropical steeplands. Soil Technology, 11(1): 3-16. Evans, D.J., Gibson, C.E and Rossell, R.S. 2006. Sediment loads and sources in heavily
modified Irish catchments: A move towards informed management strategies. Geomorphology, 79: 93-113.
Evans, R. 1990.Soils at risk of accelerated erosion in England and Wales. Soil Use and
Management, 6: 125-131. Evans, R. 1992. Erosion in England and Wales-the present the key to the past. In M.
Bell, & J. Boardman (Eds.). Past and present soil erosion: an archaeological and geographical perspective. Oxbow Books, Oxford: 53-66.
FAO. 2003. http://faostat.fao.org/site/377/default.aspx#ancor. Fiener, P., Auerswald, K. and Weigand, S. 2005. Managing erosion and water quality in
agricultural watersheds by small detention ponds. Agriculture, Ecosystems and Environment, 110: 132-142.
Findlay, D.C., Colborne, G.J.N., Cope, D.W., Harrard, T.R., Hogan, D.V. and Staines,
S.J. 1984. Soils and their use in South West England. Harpenden. Fitzgerald, J.J., Murphy, J.J., O’Mara, F.P. and Culleton, N. 1998. Maize silage for milk
production. Teagasc Project Report 4148-1. Irish Agricultural and Food Development.
Fox, D.M. and Bryan, R.B. 1999. The relationship of soil loss by interrill erosion to
slope gradient. Catena, 38: 211-222. Fox, D.M., Bryan, R.B. and Price, A.G. 1997. The influence of slope gradient on
infiltration rate for interrill conditions. Geoderma, 80: 181-194.

217
Fullen, M.A. 1985. Compaction, hydrological processes and soil erosion on loamy sands in east Shrosphire, England. Soil & Tillage Research, 6: 17-29.
Fullen, M.A. 1992. Erosion rates on bare loamy soils in east Shropshire, UK. Soil Use
and Management, 8: 157-162. Gabriels, D. 1999. The effect of slope length on the amount and size distribution of
eroded silt loam soils: Short slope laboratory experiments on interrill erosion. Geomorphology, 28: 169-172.
Green, C. and Fernández-Bilbao, A. 2006. Implementing the Water Framework
Directive: How to define a “competent authority”. Journal of Contemporary Water Research & Education, 135: 65-73.
Harris, G.L., Clements, R.O., Rose, S.C., Parkin, A. and Shepherd, M., 2004. Review of
impacts of rural land use and management on flood generation: Impact study report-appendix C-current state of managed rural land and mitigation measures. EA & DEFRA R&D Technical Report FD2114/TR.
He, Q. and Walling, D.E. 1997. The distribution of fallout 137Cs and 210Pb in
undisturbed and cultivated soils. Applied Radiation and Isotope, 48: 677-690. Heywood, M.J.T and Walling, D.E. 2003. Suspended sediment fluxes in chalk streams
in the Hampshire Avon catchment, U.K. Hydrobiologia, 494: 111-117. Hoang Fagerström, M.H., Nilsson, S.I., van Noordwijk, M., Phien, T., Olsson, M.,
Hansson, A. and Svensson, C. 2002. Does tephrosia candida as fallow species, hedgerow or mulch improve nutrient cycling and prevent nutrient losses by erosion on slopes in northern Viet Nam? Agriculture, Ecosystems and Environment, 90: 291-304.
Huang, C. and Bradford, J. 1993. Analyses of slope and runoff factors based on the
WEPP erosion model. Soil Science Society of America Journal, 57: 1176-1183. Huntseeds. http://www.huntseeds.co.uk. Inman, A. 2006. Soil erosion in England and Wales: Causes, consequences and policy
options for dealing with the problem. Discussion paper prepared for WWF. (http://www.wwf.org.uk).
Keller, T., Trautner, A. and Arvidsson, J. 2002. Stress distribution and soil displacement
under a rubber-tracked and a wheeled tractor during ploughing, both on-land and within furrows. Soil & Tillage Research, 68: 39-47.
Kenworthy, S.T and Rhoads, B.L. 1995. Hydrologic control of spatial patterns of
suspended sediment concentration at a stream confluence. Journal of Hydrology, 168: 251-263.
218
Kiss, J.J., de jong, E. and Martz, L.W. 1988. The distribution of fallout Cs-137 in
southern Saskatchewan, Canada. Journal of Environmental Quality, 17(3): 445-452.
Kwaad, F.J.P.M., van der Zijp, M. and van Dijk, P.M. 1998. Soil conservation and
maize cropping systems on sloping loess soils in The Netherlands. Soil & Tillage Research, 46: 13-21.
Lal, D., Malhorta, P.K. and Peters, B. 1958. On the production of radio isotopes in the
atmosphere by cosmic ray radiation and their application to meteorology. Journal of Atmospheric and Terrestrial Physics, 12: 306-328.
Lal, R. 1988. Effects of slope length, slope gradient, tillage methods and cropping
systems on runoff and soil erosion on a tropical Alfisol: Preliminary results. In M.P. Bordas and D.E.Walling (Eds.). Sediment budgets. Proceedings of the Porto Alegre Symposium, IAHS Publ. No. 174: 79-88.
Livens, F.R. and Loveland, P.J. 1988. The influence of soil properties on the
environmental mobility of caesium-137 in Cumbria. Soil Use and Management, 4: 69-75.
Loughran, R.J., Campbell, B.L. and Walling, D.E. 1987. Soil erosion and sedimentation
indicated by caesium-137: Jackmoor Brook catchment, Devon, England. Catena, 14: 201-212.
MAFF. 1998a. Code of Good Agricultural Practice for the Protection of Soil. MAFF. 1998b. Code of Good Agricultural Practice for the Protection of Water. Maisadour semences.
http://www.maisadour-semences.fr/global/an-maisadour-semences.php. Mathier, L., Roy, A. and Pare, J. 1989. The effect of slope gradient and length on the
parameters of a sediment transport equation for sheetwash. Catena, 16: 545-558. McHugh, M., Wood, G., Walling, D.E., Zhang, Y., Anthony, S. and Hutchins, M. 2002.
Prediction of sediment delivery to watercourses from land-phase II. R R&D Technical Report No. P2-209. Environment Agency, Bristol.
McKergow, L.A., Weaver, D.M., Prosser, I.P., Grayson, R.B. and Reed, A.E.G. 2003.
Before and after riparian management: Sediment and nutrient exports from a small agricultural catchment, Western Australia. Journal of Hydrology, 270: 253-272.
Melville, N. and Morgan, R.P.C. 2001. The influence of grass density on effectiveness
of contour grass strips for control soil erosion on low angle slopes. Soil Use and Management, 17: 278-281.

219
Mihara, M. 2006. The effect of natural weed buffers on soil and nitrogen losses in Japan. Catena, 65: 265-271.
Minh, N.H., Minh, T.B., Kajiwara, N., Kunisue, T., Iwata, H., Viet, P.H., Cam Tu, N.P.,
Tuyen, B.C and Tanabe, S. 2007. Pollution sources and accurrences of selected persistent organic pollutants (POPs) in sediments of the Mekong River delta, South Vietnam. Chemosphere, 67: 1794-1801.
Mokhtar, J. and Walling, D.E. 2008. Documenting soil erosion associated with a bare
maize stubble field in Devon, UK. In P. Zdruli and E. Costantini (Eds.). Proceedings of the 5th International Conference on Land Degradation-Moving ahead from assessments to actions: could we win the struggle with land degradation? (Valenzano, Bari, Italy): 297-301.
Morgan, R.P.C. 1985. Soil erosion measurement and soil conservation research in
cultivated areas of the UK. The Geographical Journal, 151(1): 11-20. National Soil Resources Institute.
http://www.swenvo.org.uk/environment/land_graphs.asp#soil_england_map. Olsen, C.R. and Dean, L.A. 1965. Phosphorus. In C.A. Black (Ed.). Methods of soil
chemical analysis Part 2. American Society of Agronomy, Madison-Wisconsin: 1035-1049.
Olsen, C.R., Larsen, I.L., Lowry, P.D., Cutshall, N.H., Todd, J.F., Wong, G.T.F. and
Casey, W.H. 1985. Atmospheric fluxes and marsh-soil inventories of 7Be and 210Pb. Journal of Geophysical Research, 90(D6): 10,487-10,495.
Owens, P.N., Walling, D.E. and He, Q. 1996. The behavior of bomb-derived caesium-
137 fallout in catchment soils. Journal of Environmental Radioactivity, 32(3): 169-191.
Pimentel, D. and Kounang, N. 1998. Ecology of soil erosion in ecosystems. Ecosystems,
1: 416-426. Pimentel, D., Harvey, C., Resosudarmo, P., Sinclair, K., Kurz, D., McNair, M., Crist, S.,
Shpritz, L., Fitton, L., Saffouri, R. and Blair, R. 1995. Environmental and economic costs of soil erosion and conservation benefits. Science, 267(5201): 1117-1123.
Porto, P., Walling, D.E., Tamburino, V. and Callegari, G. 2003. Relating caesium-137
and soil loss from cultivated land. Catena, 53: 303-326. Pretty, J.N., Brett, C., Gee, D., Hine, R.E., Mason, C.F., Morison, J.I.L., Raven, H.,
Rayment, M.D. and van der Bijl, G. 2000. An assessment of the total external costs of UK agriculture. Agricultural Systems, 65: 113-136.
Qui, X.C. and Zhu, Y.Q. 1993. Rapid analysis of cation exchange properties in acidic
soils. Journal of Soil Science, 155: 301-308.

220
Quine, T.A. 1989. Use of a simple model to estimate rates of soil erosion from caesium-137 data. Journal of Water Resources, 8: 54-81.
Reed, A.H. 1979. Accelerated erosion of arable soils in the United Kingdom by rainfall
and runoff. Outlook on Agriculture, 10: 41-48. Ritchie, J.C. and McHenry, J.R. 1990. Application of radioactive fallout cesium-137 for
measuring soil erosion and sediment accumulation rates and patterns: A review. Journal of Environmental Quality, 19: 215-233.
Robinson, D.A. 1999. Agricultural practice, climate change and the soil erosion hazard
in parts of southeast England. Applied Geography, 19: 13-27. Robinson, D.A. and Blackman, J.D. 1990. Some costs and consequences of soil erosion
and flooding around Brighton and Hove, autumn 1987. In J. Boardman, I.D.L. Foster and J.A. Dearing (Eds.). Soil erosion and agricultural land. Wiley Chichester: 369-382.
Rogowski, A.S. and Tamura, T. 1970. Environmental mobility of cesium-137.
Radiation Botany, 10: 35-45. Silcock, P., Swales, V., Smith, G. and Sealy, K. 2004. Impacts of CAP reform
agreement on diffuse water pollution from agriculture. Final Report for DEFRA-GRP-P-175.
Smith, B.P.G., Naden, P.S., Leeks, G.J.L. and Wass, P.D. 2003. The influence of storm
events on fine sediment transport, erosion and deposition within a reach of the River Swale, Yorkshire, UK. The Science of the Total Environment, 314-316: 451-474.
Solomon, D. 1997. Identification of cropping areas at risk to soil erosion in England.
Proceeding of the 21th ESRI European User Conference (29 Sept.-1 Oct. 1997). Copenhagen, ESRI.
Sutherland, R.A. 1992. Caesium-137 estimates of erosion in agricultural areas.
Hydrological Processes, 6: 215-225. Tamura, T. and Jacobs, D. 1960. Structural implications in cesium sorption. Health
Physics, 2: 391-398. Unwin, R.J. 2001. New initiatives to control soil erosion in England. In D.E. Stott, R.H.
Mohtar and G.C. Steinhardt (Eds.). Sustaining the global farm. Selected papers from the 10th International Soil Conservation Organization Meeting (24-29 May 1999) at the Purdue University and the USDA-ARS National Soil Erosion Research Laboratory: 426-430.
van Dijk, P.M., Kwaad, F.J.P.M. and Klapwijk, M. 1996a. Retention of water and
sediment by grass strips. Hydrological Processes. 10: 1069-1080.

221
van Dijk, P.M., van der Zijp, M., and Kwaad, F.J.P.M. 1996b. Soil erodibility parameters under various cropping systems of maize. Hydrological Processes, 10: 1061-1067.
Vanacker, V., Molina, A., Govers, G., Poesen, J and Deckers, J. 2007. Spatial variation
of suspended sediment concentrations in a tropical Andean river system: The Paute River, southern Ecuador. Geomorphology, 87: 53-67.
Wallbrink, P.J. and Murray, A.S. 1996. Distribution of 7Be in soils under different
surface cover conditions and its potential for describing soil redistribution processes. Water Resources Research, 32: 467-476.
Wallbrink, P.J., Walling, D.E. and He. Q. 2002. Radionuclide measurement using HPGe
gamma spectrometry. In F. Zapata (Ed.). Handbook for the assessment of soil erosion and sedimentation using environmental radionuclides. Dordrecht, Kluwer Academic Publishers: 67-96.
Walling, D.E. 1988. Erosion and sediment yield research-some recent perspectives.
Journal of Hydrology, 100: 113-141. Walling, D.E. 2005. Tracing suspended sediment sources in catchments and river
systems. Science of the Total Environment, 344: 159-184. Walling, D.E. 2008. The changing sediment loads of the world’s rivers. Proceedings of
the Sediment Dynamics in Changing Environments. Christchurch, New Zealand (December): 323-338.
Walling, D.E. and Collins, A.L. 2000. Integrated assessment of catchment sediment
budgets: A technical manual. Produced within the framework of UK Department for International Development Research Project R6868. University of Exeter and Department for International Development.
Walling, D.E. and He, Q. 1993. Towards improved interpretation of 137Cs profiles in
lake sediments. In J. McManus and R.W. Duck (Eds.). Geomorphology and sedimentology of lakes and reservoirs. Chichester, John Wiley and Sons Ltd.: 31-53.
Walling, D.E. and He, Q. 1997. Use of fallout 137Cs in investigations of overbank
deposition on river floodplains. Catena, 29: 263-282. Walling, D.E. and He, Q. 1999. Improved models for estimating soil erosion rates from
cesium-137 measurements. Journal of Environmental Quality, 28: 611-622. Walling, D.E. and Quine, T.A. 1990. Calibration of 137Cs measurements to provide
quantitative erosion rate data. Land Degradation and Rehabilitation, 2: 161-175.

222
Walling, D.E. and Quine, T.A. 1991. The use of caesium-137 measurements to investigate soil erosion on arable fields in the UK: Potential applications and limitations. Journal of Soil Science, 42: 147-165.
Walling, D.E. and Quine, T.A. 1993. Use of caesium-137 as a tracer of erosion and
sedimentation: Handbook for the application of the caesium-137 technique. Exeter, Department of Geography, University of Exeter.
Walling, D.E. and Quine, T.A. 1995. The use of fallout radionuclides in soil erosion
investigations. In IAEA (Ed.). Proceedings of the FAO/IAEA International Symposium on Nuclear and Related Techniques in Soil Plant Studies on Sustainable Agriculture and Environmental Preservation, Nuclear Techniques in Soil Plant Studies for Sustainable Agriculture and Environmental Preservation. Vienna, Austria: 597-619.
Walling, D.E. and Woodward, J.C. 1995. Tracing sources of suspended sediment in
river basins: A case study of the River Culm, Devon, UK. Marine Freshwater Research, 46: 327-336.
Walling, D.E., Collins, A.L., Jones, P.A., Leeks, G.J.L. and Old, G. 2006. Establishing
fine-grained sediment budgets for the Pang and Lambourne LOCAR catchments, UK. Journal of Hydrology. 330: 126-141
Walling, D.E., He, Q. and Appley, P.G. 2002. Conversion models for use in soil-
erosion, soil-redistribution and sedimentation investigations. In F. Zapata (Ed.). Handbook for the assessment of soil erosion and sedimentation using environmental radionuclides. Kluwer Academic Publishers, Dordrecht: 111-164.
Walling, D.E., He, Q. and Blake, W.H. 1999a. Use of 7Be and 137Cs measurements to
document short- and medium-term rates of water-induced soil erosion on agricultural land. Water Resources Research, 35: 3865-3874.
Walling, D.E., Owens, P.N. and Leeks, G.J.L. 1999b. Fingerprinting suspended
sediment sources in the catchment of the River Ouse, Yorkshire, UK. Hydrological Processes, 13: 955-975.
Walling, D.E., Schuller, P., Zhang, Y. and Iroumé, A. 2009. Extending the timescale for
using beryllium 7 measurements to document soil redistribution by erosion. Water Resources Research, 45(W02418): 1-13.
Wass, P.D., Marks, S.D., Finch, J.W., Leeks, G.J.L and Ingram, J.K. 1997. Monitoring
and preliminary interpretation of in-river turbidity and remote sensed imagery for suspended sediment transport studies in the Humber catchment. The Science of the Total Environment, 194/195: 263-283.
Wiebe, K.D. 2003. Land degradation and agricultural productivity. In K.D. Wiebe,
Linking land quality, agricultural productivity, and food security. Agricultural Economic Report No. 823. Resource Economic Division, Economic Research Service, U.S. Department of Agriculture: 28-34.

223
Wilson, C.G., Matisoff, G. and Whiting, P.J. 2003. Short-term erosion rates from a 7Be inventory balance. Earth Surface Processes and Landforms, 28: 967-977.
Zapata, F. 2003. The use of environmental radionuclides as tracers in soil erosion and
sedimentation investigations: Recent advances and future developments. Soil & Tillage Research, 69: 3-13.
Zapata, F., Garcia-Agudo, E., Ritchie, J.C. and Appleby, P.G. 2002. Introduction. In F.
Zapata (Ed.). Handbook for the assessment of soil erosion and sedimentation using environmental radionuclides. Kluwer Academic Publishers, Dordrecht: 1-13.
Zhang, X.B., Higgit, D.L. and Walling, D.E. 1990. A preliminary assessment of the
potential for using caesium-137 to estimate rates of soil erosion in the Loess Plateau of China. Hydrological Science Journal, 35: 267-276.