soil corrosivity assessment in the pre-design of sub
TRANSCRIPT

Geosciences 2016, 6(1): 13-20 DOI: 10.5923/j.geo.20160601.02
Soil Corrosivity Assessment in the Pre-Design of Sub-Surface Water Pipe Distributary Network in Yenagoa,
South-South Nigeria Using Electrical Resistivity
Oki O. A.1,*, Egai A. O.2, Akana T. S.1
1Department of Geology, Niger Delta University, Nigeria 2Department of Geology, University of Benin, Nigeria
Abstract Investigation of the degree of corrosivity of the sub-soil in Yenagoa with a view to aiding pre-design of subsurface steel pipe network was conducted. Fifteen (15) Vertical Electrical Sounding using Schlumberger array was done at an average station interval of 2km. Resistivity data was processed using Interpex and IP2 win software’s. The degree of corrosivity of the soil was assigned based on the modelled resistivity value of each geologic layer with respect to depth in the study area. The soil aggressiveness in the area was categorized into very highly corrosivity (less than 50 Ohms), high corrosivity (50-100 Ohms), low corrosivity (100-200 Ohms) and greater than (200 Ohms) negligible corrosivity. The geoelectrical results show four subsurface layers with respect to their resistivity, depth and corrosivity; Layer one (1) 32.000Ωm with a thickness that ranged between 0.37m and 1.57m, the top soil which is interpreted as having very highly corrosivity. Layer two (2) which had a resistivity of 115.441 Ωm and a thickness that ranged between 0.8m and 32.8m, was categorized as having low corrosivity; Layer three (3) had a resistivity of 244.268 Ωm with a thickness that ranged between 4.1m and 48.7m, categorized as having a negligible corrosivity, and layer four (4) with a resistivity of 1709.56 Ωm and a thickness of 6.2m to 48.5m had negligible corrosivity. Soil aggressiveness of the layer resistivity indicated very high corrosivity to a depth 2m from the ground level and abrupt decline in corrosivity as depth increased, as such; the top layer was characterized as having very high corrosivity. Water piping networks are usually done within 2m of the top soil, which is zone of “very high corrosivity”. This should be taken into consideration during pipe network design, as it will guide in the determination of the type of subsurface steel pipes to be used to forestall economic waste and health risks associated with rupture of corroded pipes.
Keywords Soil Corrossivity, Resistivity, Subsurface pipe network, Yenagoa
1. Introduction The application of geophysics in the investigation of the
corrosivity of the earth material prior to sub-surface pipe laying has become a standard practice in recent times. Environmental Impact Assessment (EIA) requires knowledge of subsurface distribution of resistivity in construction projects that would involve burial of steel pipes and cables, and other sub-surface network of piping (Agunloye, 1984). The electrical resistivity method is highly significant in in-situ determination of the degree of corrosiveness of soils, its application is hinged on the fact that the electrical resistivity of earth materials depends on environmental parameters such as mineral and fluid content, degree of water saturation in the rock/soil, permeability,
* Corresponding author: [email protected] (Oki O. A.) Published online at http://journal.sapub.org/geo Copyright © 2016 Scientific & Academic Publishing. All Rights Reserved
temperature, grain size, degree of grain cementation, concentration of saturating fluids, conductivity of matrix and soil porosity. Low resistivity in soil can be directly related to a high corrosivity/aggressiveness index of the soil material (Agunloye, 1984; Othman, 2005; Adesida et al, 2002; Gopal 2010).
This research investigates soil corrosivity across Yenagoa Metropolis which falls within longitude 5° 20.0’- 4° 50.0’ N and latitude 6° 10.0’ E - 6° 40.0’ E. Resistivity survey using Schlumberger array was carried out at Igbogene, Okaki, Agudama, Akenfa, Etegwe, Opolo, Biogbolo, Kpansia, Azikoro, Ox-Bow lake, Swali, Ogu, Ovom, Okaka, Okutukutu (VES stations 1 – 15 respectively) with a view to delineating the subsurface geologic layers and determining their degrees of corrosivity. The significance of the research study is to highlight the extent and degree of corrosivity of the underlying soil material within a depth interval of 0 – 2m, as this zone or depth would host the proposed subsurface water pipe network distribution in Yenagoa. Corrosion and eventual rupture of subsurface pipes would lead to the

14 Oki O. A. et al.: Soil Corrosivity Assessment in the Pre-Design of Sub-Surface Water Pipe Distributary Network in Yenagoa, South-South Nigeria Using Electrical Resistivity
contamination of the transported water; this could pose a health risk to the teeming populace utilizing such water.
2. Study Area Description The study area fall under the Niger Delta sedimentary
basin of Southern Nigeria, bordering the Atlantic Ocean (fig. 1). Although the stratigraphy of the Niger Delta clastic wedge has been documented during oil exploration and production, most stratigraphic schemes remain proprietary to the major oil companies operating concessions in the Niger Delta Basin. Stratigraphic evolution of the Tertiary Niger Delta and underlying Cretaceous strata is described by Short
and Stauble, (1967). The three major lithostratigraphic units defined in the subsurface of the Niger Delta, these are the Akata, Agbada and Benin Formations (Evamy et al., 1978; Doust and Omatsola, 1990). Decrease in age basin ward, reflecting the overall regression of depositional environments within the Niger Delta clastic wedge. Stratigraphic equivalent units to these three formations are exposed in southern Nigeria. The formations reflect a gross coarsening-upward progradational clastic wedge (Short and Stauble, 1967), deposited in marine, deltaic, and fluvial environments. Yenagoa lies within the low deltaic and freshwater swamps.
Figure 1. Location map of study area

Geosciences 2016, 6(1): 13-20 15
3. Materials and Methods Resistivity was measured by injecting a well-defined
signal current into the ground through the two current electrodes (C1, C2). The resulting voltage change (potential difference or drop in potential) is measured between the potential electrodes (P1, P2). This arrangement measures the mean resistivity between the voltage electrodes (P1, P2 ) up to a depth equal to about 1/3 of the distance between C1 and C2 (total electrode spread) and a width equal to about 2/3 of the distance C1 and C2 (Reynolds 1998). As the electrode spread (C1, C2) increases, depth of the probe increases. The potential-drop-ratio method is a variation on this procedure used for determining resistivity. Vertical Electrical Soundings (VES) was carried out in the study area. The Schlumberger array was used for the VES survey with maximum electrode spacing AB varies between 2 and 300m.
The study area was geo- referenced by using Garmin Global Positioning System (GPS). A total of fifteen (15) VES points were acquired with an average station spacing of 3 kilometers. The instrument used was an Abem Terrameter SAS 3000, a digital self averaging instrument for DC resistivity work. A portable 12 V battery was used as the power source while four stainless metal stakes were used as electrodes. A critical explanation of how the method works can be found in the literature Loke, 1997. Some precautions taken in the field to ensure high resolution data included shielding resistivity meter from direct sunlight and other heat sources to maintain its optimal, temperature, firm grounding of electrodes, tight coupling of cables to electrodes, prevention of cross-talking of cables, good clearance of electrodes and cables from water logged areas.
Table 1. Summary of VES model parameters and corrosion status
Station No Layer No Resistivity (Ωm) Thickness (m) Depth (m) Lithology Curve type Corrosive status
1. 1. 25.605 0.7795 0.7795 Top soil KQ Very high
2. 337.33 11.697 12.477 Sandy clay Negligible
3. 77.001 38.842 51.319 Clay High
4. 14.220
2. 1. 57.501 0.7444 0.7444 Top soil HKHA High
2. 19.485 0.8060 1.5505 Clay Very high
3. 138.24 4.0838 5.6343 Sandy clay Low
4. 26.386 6.2195 11.854 Clay Very
5. 825.86 38.441 50.295 Sand Negligible
6. 4284.4
3. 1. 23.487 0.7307 0.7307 Top soil AK Very high
2. 23.904 2.5559 3.2867 Clay Very high
3. 736.93 31.217 34.504 Clayey sand Negligible
4. 16.615
4. 1. 16.575 0.6411 0.6411 Top soil HA Very high
2. 5.1045 4.3359 4.9770 Clay Very high
3. 186.35 26.933 31.910 Sandy clay Low
4. 3963.2
5. 1. 48.855 0.8762 0.8762 Top soil KH Very high
2. 359.97 19.854 20.730 Clayey sand Negligible
3. 88.364 32.946 53.676 Clay high
4. 2494.2
6. 1. 15.195 1.0444 1.0444 Top soil AA Very high
2. 52.224 1.8776 2.9220 Clay High
3. 198.36 48.700 51.622 Sandy clay Low
4. 3336.0
7 1. 41.879 0.7234 0.72348 Top soil KH Very hlgh

16 Oki O. A. et al.: Soil Corrosivity Assessment in the Pre-Design of Sub-Surface Water Pipe Distributary Network in Yenagoa, South-South Nigeria Using Electrical Resistivity
Station No Layer No Resistivity (Ωm) Thickness (m) Depth (m) Lithology Curve type Corrosive status
2. 615.75 9.4800 10.203 Clayey sand Negligible
3. 81.549 29.995 40.198 Clay High
4. 11334.
8. 1. 36.735 0.6125 0.61257 Top soil HK Very high
2. 12.647 1.8775 2.4901 Clay Very high
3. 207.44 23.922 26.412 Sandy clay Negligible
4. 7.0535
9. 1. 17.405 0.5043 0.50434 Top soil HKQ Very high
2. 15.888 2.0837 2.5880 Clay Very high
3. 535.75 25.027 27.615 Clayey sand Negligible
4. 13.163 48.564 76.179 Clay Very high
5. 7.0261
10. 1. 19.581 1.5192 1.5192 Top soil A Very high
2. 220.25 32.827 34.346 Sandy clay Negligible
3. 8628.0
11 1. 23.587 0.4617 0.46179 Top soil HK Very high
2. 16.432 2.3906 2.8524 Clay Very high
3. 195.55 48.275 51.128 Sandy clay Low
4. 123.96
12. 1. 40.727 1.5726 1.5726 Top soil HA Very high
2. 2.4354 2.0745 3.6471 Clay Very high
3. 489.60 32.849 36.496 Clayey sand Negligible
4. 3992.9
13. 1. 28.968 0.3745 0.37456 Top soil HAA Very high
2. 17.179 1.6299 2.0045 Clay Very high
3. 57.877 10.101 12.105 Clay High
4. 234.36 39.998 52.103 Sandy clay Negligible
5. 1073.7
14. 1. 44.020 0.6583 0.65833 Top soil HA Very high
2. 21.485 2.6126 3.2709 Clay Very high
3. 195.09 25.850 29.121 Sand Low
4. 243.66
15. 1. 22.568 0.7195 0.71953 Top soil HK Very high
2. 20.541 1.5052 2.2247 Clay Very high
3. 475.93 26.918 29.142 Sandy clay Negligible
4. 87.399

Geosciences 2016, 6(1): 13-20 17
(a)
(b)
1 10 100 1000
10
100
1000O -A G U D A M A
Apparen
t Resis
tivity (O
hm-m)
E lectrode Spacing (A B /2) (m )
1 10 100
10
100
1000O -B I O G B O L O
Apparen
t Resisti
vity (Oh
m-m)
E lectrode Spacing (A B /2) (m )

18 Oki O. A. et al.: Soil Corrosivity Assessment in the Pre-Design of Sub-Surface Water Pipe Distributary Network in Yenagoa, South-South Nigeria Using Electrical Resistivity
(c)
(d)
1 10 100 1000
10
100
1000O - O G U
Apparen
t Resisti
vity (Oh
m-m)
E lectrode Spacing (A B /2) (m )
1 10 100 1000
1
10
100
1000O -O K A K A EST A T E
Apparen
t Resisti
vity (Oh
m-m)
E lectrode Spacing (A B /2) (m )
Geosciences 2016, 6(1): 13-20 19
(e)
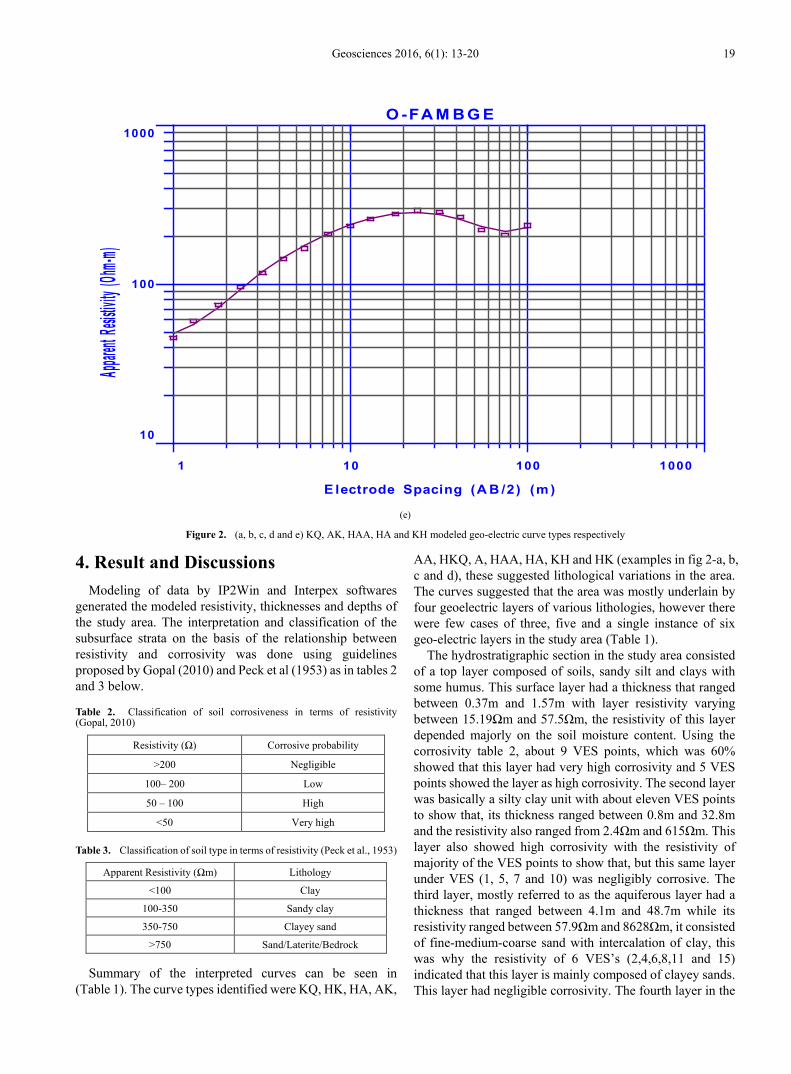
Figure 2. (a, b, c, d and e) KQ, AK, HAA, HA and KH modeled geo-electric curve types respectively
4. Result and Discussions Modeling of data by IP2Win and Interpex softwares
generated the modeled resistivity, thicknesses and depths of the study area. The interpretation and classification of the subsurface strata on the basis of the relationship between resistivity and corrosivity was done using guidelines proposed by Gopal (2010) and Peck et al (1953) as in tables 2 and 3 below.
Table 2. Classification of soil corrosiveness in terms of resistivity (Gopal, 2010)
Resistivity (Ω) Corrosive probability
>200 Negligible
100– 200 Low
50 – 100 High
<50 Very high
Table 3. Classification of soil type in terms of resistivity (Peck et al., 1953)
Apparent Resistivity (Ωm) Lithology
<100 Clay
100-350 Sandy clay
350-750 Clayey sand
>750 Sand/Laterite/Bedrock
Summary of the interpreted curves can be seen in (Table 1). The curve types identified were KQ, HK, HA, AK,
AA, HKQ, A, HAA, HA, KH and HK (examples in fig 2-a, b, c and d), these suggested lithological variations in the area. The curves suggested that the area was mostly underlain by four geoelectric layers of various lithologies, however there were few cases of three, five and a single instance of six geo-electric layers in the study area (Table 1).
The hydrostratigraphic section in the study area consisted of a top layer composed of soils, sandy silt and clays with some humus. This surface layer had a thickness that ranged between 0.37m and 1.57m with layer resistivity varying between 15.19Ωm and 57.5Ωm, the resistivity of this layer depended majorly on the soil moisture content. Using the corrosivity table 2, about 9 VES points, which was 60% showed that this layer had very high corrosivity and 5 VES points showed the layer as high corrosivity. The second layer was basically a silty clay unit with about eleven VES points to show that, its thickness ranged between 0.8m and 32.8m and the resistivity also ranged from 2.4Ωm and 615Ωm. This layer also showed high corrosivity with the resistivity of majority of the VES points to show that, but this same layer under VES (1, 5, 7 and 10) was negligibly corrosive. The third layer, mostly referred to as the aquiferous layer had a thickness that ranged between 4.1m and 48.7m while its resistivity ranged between 57.9Ωm and 8628Ωm, it consisted of fine-medium-coarse sand with intercalation of clay, this was why the resistivity of 6 VES’s (2,4,6,8,11 and 15) indicated that this layer is mainly composed of clayey sands. This layer had negligible corrosivity. The fourth layer in the
1 10 100 1000
10
100
1000O -FA M B G E
Apparen
t Resisti
vity (Oh
m-m)
E lectrode Spacing (A B /2) (m )

20 Oki O. A. et al.: Soil Corrosivity Assessment in the Pre-Design of Sub-Surface Water Pipe Distributary Network in Yenagoa, South-South Nigeria Using Electrical Resistivity
area sampled composed of more clay (VES 2 and 9), with VES 2 indicating sandy clay, the thickness of this layer was between 6.2m to 48.5m while its resistivity is between 13.4Ωm to 58Ωm, this showed the layer to be of high corrosivity. The fifth layer seen on VES 2 had a thickness of 38.4m and a resistivity of 828Ωm, this layer was basically composed of sand, hence, it was categorized as having negligible corrosivity.
5. Conclusions The study established the use of electrical resistivity
method to investigate soil corrosivity in Yenagoa. The geo-electrical sections delineated four distinct layers. A top soil which was interpreted as having very high corrosivity, the second layer was interpreted as a low corrosive layer; the third and forth layers had negligible corrosivity. Soil corrosiveness of the modeled resistivity showed a very high corrosivity within a depth interval of 0-2m, with a progressive decrease in soil corrosiveness as depth increased. Considering the fact that pipe network distribution in Yenagoa was proposed to be at a depth of not more than 2m from ground level (top soil) which falls squarely within the “very high corrosivity” zone, corrosion resistant pipes are strongly recommended to forestall problems associated with rupture of corroded pipes.
REFERENCES [1] Adesida, A., Faleye, E.T and Fatoba, J. (2002): Electrical
Resistivity Survey for Corrosive Soils at WAPCO, Ewekoro
Factory, Ogun State, Nigeria. Journal of Science and Technology research, Vol. 1(1), pp. 22-32.
[2] Agunloye, O. (1984). Soil aggressivity along Steel Pipeline route at Ajaokuta, South-western Nigeria. Nigerian Journal of Mining and Geology.Vol.21 (1 and 2), pp. 97-101.
[3] Doust, H and Omatsola, E. (1990). Niger delta: in J. D. Edwards and P.A. Santogrossi, eds., Divergent/passive margin basins: AAPG Memoir 48, pp. 239-248.
[4] Evamy, B. D., Haremboure, J., Kammerling, R., Knaap, W. A., Molloy, F. A and Rowlands, P. H. (1978). Hydrocarbon habitat of tertiary Niger Delta: AAPG Bulletin, Vol. 62, pp. 1-39.
[5] Gopal, M. (2010). Corrosion Potential Assessment. The Geology of part of South-western Nigeria. Geological Survey of Nigeria 31-87.
[6] Loke, M.H. (1997). Electrical imaging surveys for environmental and engineering studies – a practical guide to 2D and 3D survey, Penang, Malaysia, Universiti Sains Malaysia, unpublished short training course lecture notes.
[7] Othman, A.A.A. (2005). Construed geotechnical characteristics of foundation beds by seismic measurements. Journal. Geoph. Eng.2, pp. 16 –138.
[8] Peck, R. B., Hanson, W. E and Thornburn, T. H. (1953). Foundation Engineering. New York, John Willey and Sons.
[9] Reynolds, J.M. (1998). An introduction to Applied and Environmental Geophysics. John Wiley and Sons, London, pp. 650.
[10] Short, K.C and Stauble, A. J. (1967), Outline of geology of Niger Delta: American Association of Petroleum Geologist Bulletin, vol.51 (5), pp.764-772.