real time oil corrosivity measurement using radioactive
TRANSCRIPT
Real Time Oil Corrosivity MeasurementUsing
Radioactive Tracer Technology
Southwest Research InstituteSan Antonio, TX
Douglas C. EberleSenior Research Engineer
Filtration and Fine Particle Technology, San Antonio, TX(210)522-5260
Southwest Research Institute
1,200 Acres
2M square feet ofLaboratories and Offices
2,700 Employees
$340M Revenue in FY02
11 Technical Divisions
1/3 Dedicated toAutomotive R&D
Overview
SwRI Has Used Internal Funds to Developa Unique Method to Measure CorrosivityUsing Radioactive Tracer TechnologyHighly Sensitive Time ResolvedCorrosivity Measurement Under SimulatedRefinery Conditions to Measure the TrueCorrosivity of an Oil Sample
Background
Crude Oil Corrosivity TypicallyPredicted Through ProprietaryCorrelation Models Involving TAN, %Sor Other ParametersWell Known That These Models AreExpensive to Develop, Are Not Reliableand Can Be Very Misleading
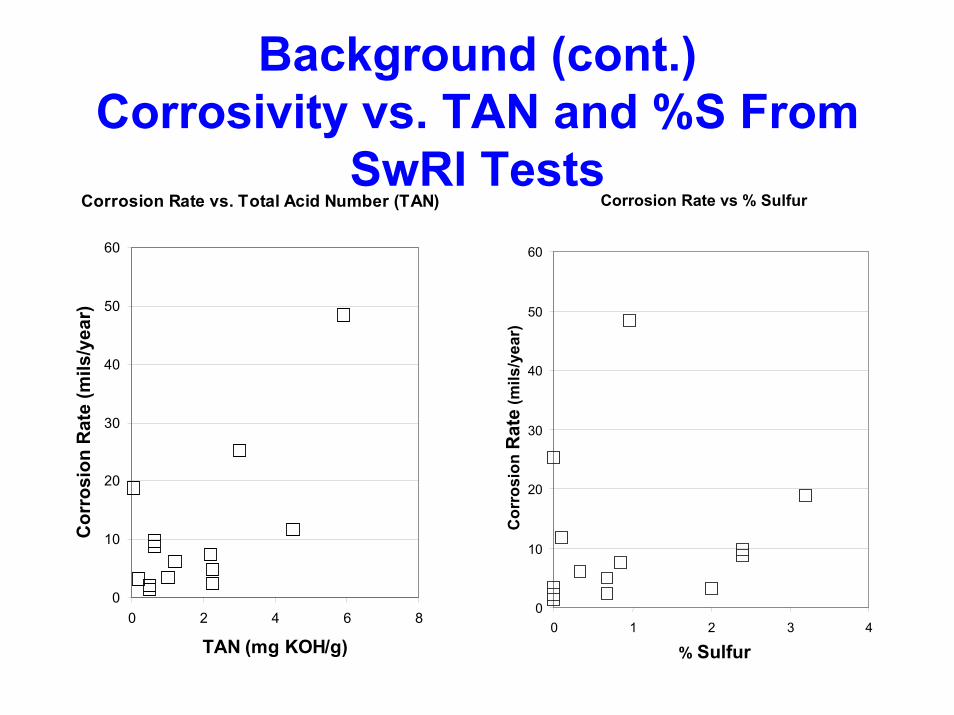
Background (cont.)Corrosivity vs. TAN and %S From
SwRI TestsCorrosion Rate vs. Total Acid Number (TAN)
0
10
20
30
40
50
60
0 2 4 6 8
TAN (mg KOH/g)
Cor
rosi
on R
ate
(mils
/yea
r)
Corrosion Rate vs % Sulfur
0
10
20
30
40
50
60
0 1 2 3 4
% Sulfur
Cor
rosi
on R
ate
(mils
/yea
r)
Background (cont.)
Corrosivity Typically Measured UsingMass Loss Coupons in an AutoclaveMass Loss Measurement Proven to beUnreliable
Likely Significant Changes in Oil Corrosivity Over LengthyTest (24 hrs or longer) due to Thermal Degradation ofNaphthenic AcidRequires Subtraction of Two Relatively Large Numbers(Before and After Coupon Mass) to Measure RelativelySmall Mass, Resulting in InaccuraciesCan Actually Show Weight Gain
Radioactive Tracer Technology(RATT)
SwRI Has Been Using Radioactive TracerTechnology (RATT) for Over 40 YearsPrincipally Used at SwRI for MeasuringReal Time Wear In Internal CombustionEnginesProven to be Highly Sensitive Time-Resolved Wear Measurement Technique
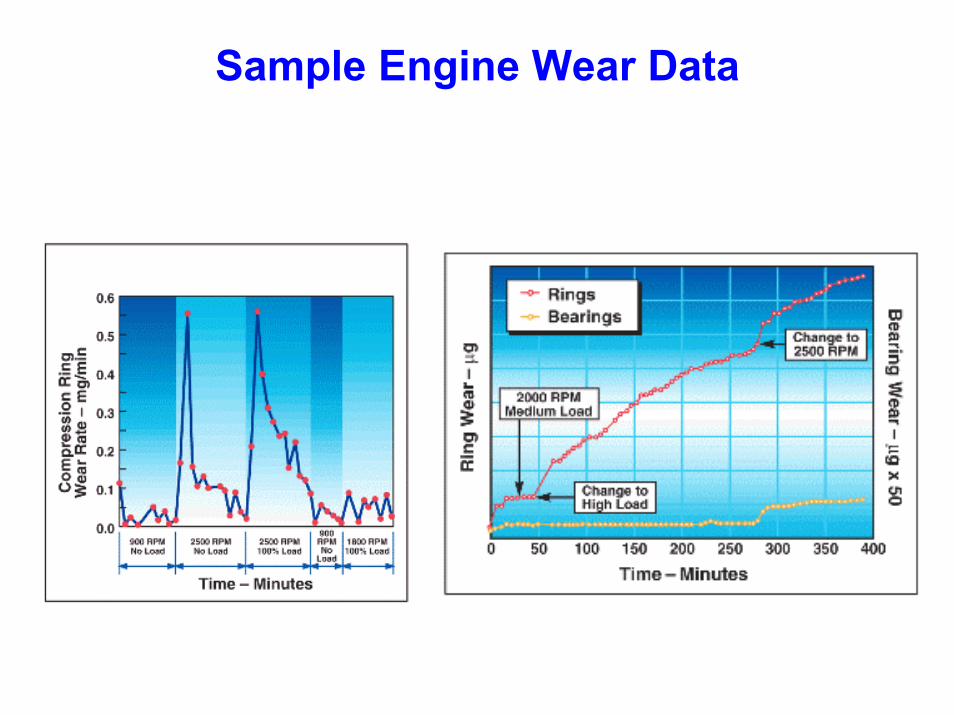
Sample Engine Wear Data

RATT Method-General Overview
Activate Corrosion Coupons In NuclearReactor (Thermal Neutron Activation)
Conversion of Stable Fe-58 Isotope to Radioactive Fe-59Fe-59 Emits Detectable Gamma Rays at 1099 and 1292 keVHalf-life of 44.6 days
Calibrate Coupon Activity to CorrelateMeasured Corrosion Product Activity inOil to Coupon Mass LossInstall Corrosion Coupon in Flow Loopand Run at Simulated RefineryConditions

Simplified System Schematic
Corrosion Coupon
Gamma RayDetector
Lead Shield
Pump
Pressure Gauge

Corrosivity Test Setup
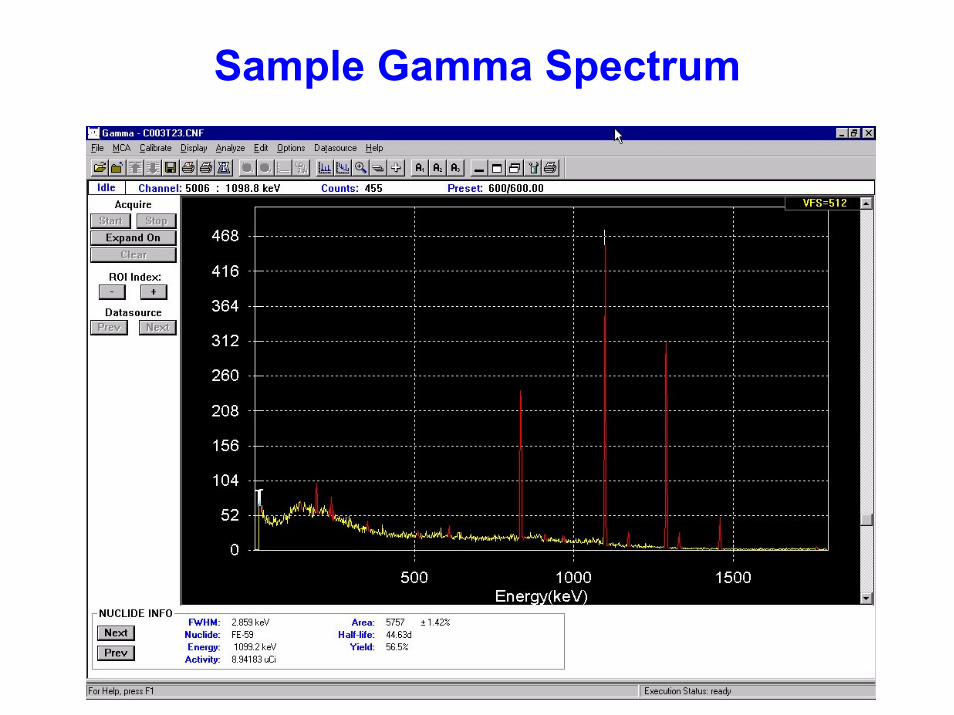
Sample Gamma Spectrum

RATT Method (cont.)
Monitor Oil in Real-time (at 10-minuteIncrements) for Accumulation ofRadioactive Corrosion ProductsRelate Measured Radioactivity toCumulative Corrosion Product MassDifferentiate Cumulative Corrosion Massto Obtain Corrosion Rate

Features and Benefits
Time Resolved Corrosivity DataTypically 10-minute ResolutionShows Features Unable To Obtain With Weight LossAbility to Capture Initial and Longer Term Corrosion Rates
Short Term TestTotal Test Time Typically 5 hoursOil Properties Less Likely to Change Significantly inShorter Term

Features and Benefits(cont.)
Recirculating Flow LoopAbility to Tailor Tests for Specific Conditions
AccurateRepeatableHighly Sensitive
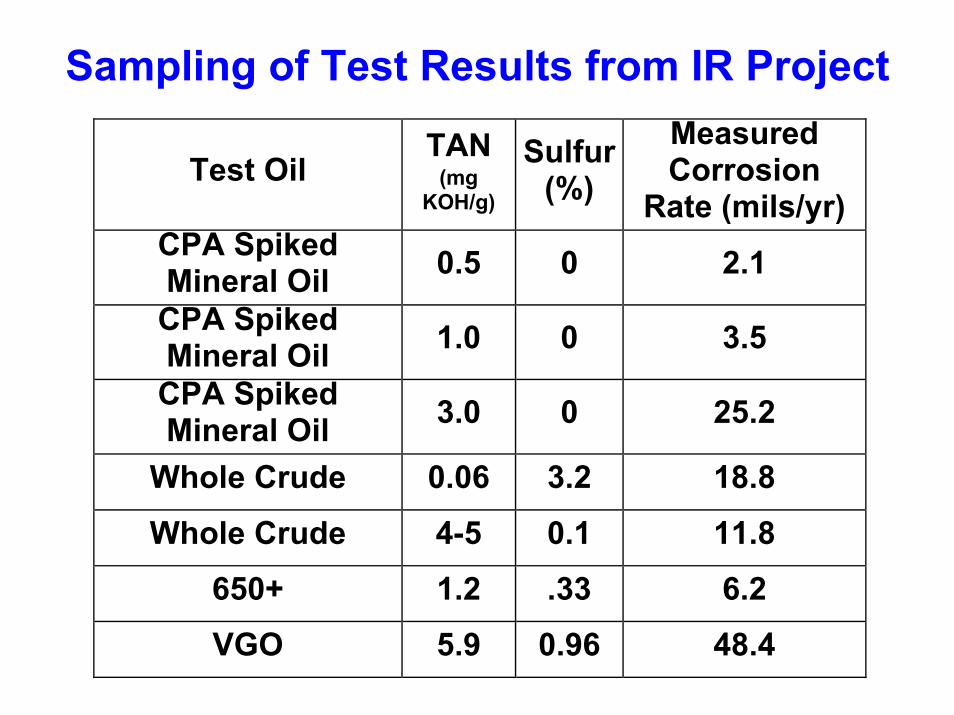
Sampling of Test Results from IR Project
Test OilTAN
(mgKOH/g)
Sulfur(%)
MeasuredCorrosion
Rate (mils/yr)CPA SpikedMineral Oil 0.5 0 2.1CPA SpikedMineral Oil 1.0 0 3.5CPA SpikedMineral Oil 3.0 0 25.2
Whole Crude 0.06 3.2 18.8Whole Crude 4-5 0.1 11.8
650+ 1.2 .33 6.2VGO 5.9 0.96 48.4

Corrosivity vs. TimeCPA (TAN=3.0) Spiked Oil Test
0
500
1000
1500
2000
2500
3000
0 1 2 3 4 5 6
Time (hours)
Cum
ulat
ive
Cou
pon
Mas
s Lo
ss (µ
g)
0
100
200
300
400
500
600
700
Oil
Tem
pera
ture
(°F)
Data Points Fitted Data Oil Temperature
Corrosion Rate = 25.2 mils/year
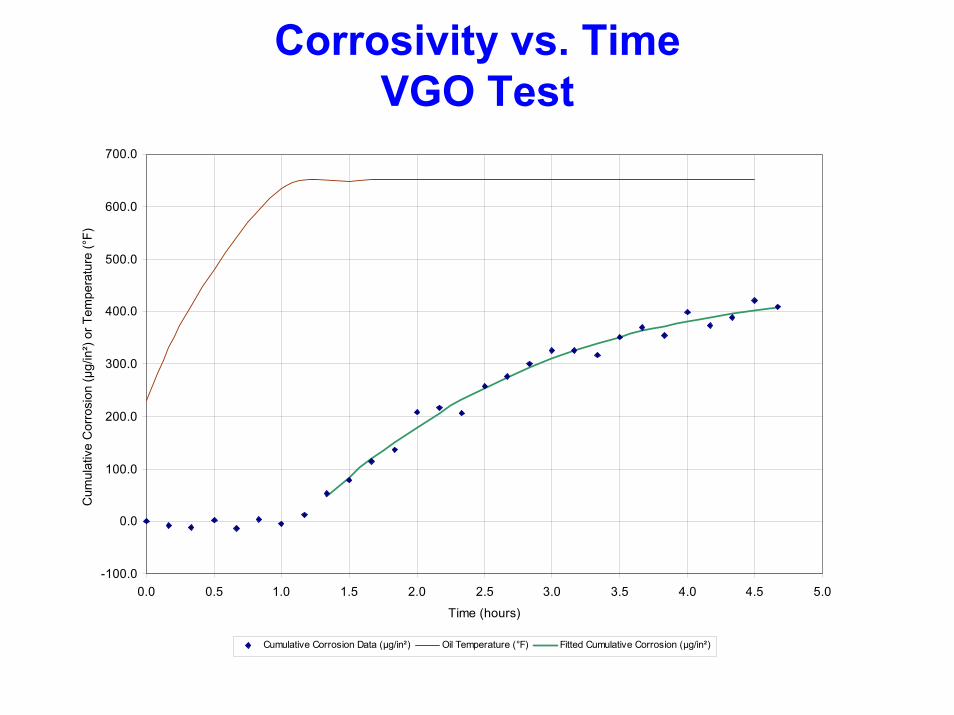
Corrosivity vs. TimeVGO Test
-100.0
0.0
100.0
200.0
300.0
400.0
500.0
600.0
700.0
0.0 0.5 1.0 1.5 2.0 2.5 3.0 3.5 4.0 4.5 5.0
Time (hours)
Cum
ulat
ive
Cor
rosi
on (µ
g/in
²) or
Tem
pera
ture
(°F)
Cumulative Corrosion Data (µg/in²) Oil Temperature (°F) Fitted Cumulative Corrosion (µg/in²)
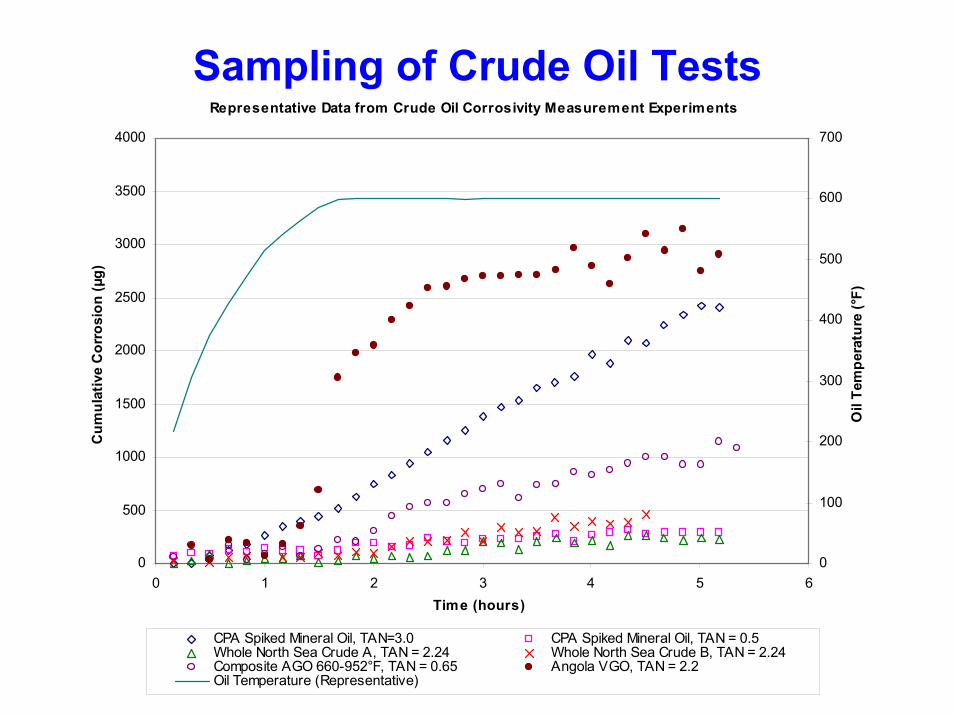
Sampling of Crude Oil TestsRepresentative Data from Crude Oil Corrosivity Measurement Experiments
0
500
1000
1500
2000
2500
3000
3500
4000
0 1 2 3 4 5 6Time (hours)
Cum
ulat
ive
Cor
rosi
on (µ
g)
0
100
200
300
400
500
600
700
Oil
Tem
pera
ture
(°F)
CPA Spiked Mineral Oil, TAN=3.0 CPA Spiked Mineral Oil, TAN = 0.5Whole North Sea Crude A, TAN = 2.24 Whole North Sea Crude B, TAN = 2.24Composite AGO 660-952°F, TAN = 0.65 Angola VGO, TAN = 2.2Oil Temperature (Representative)
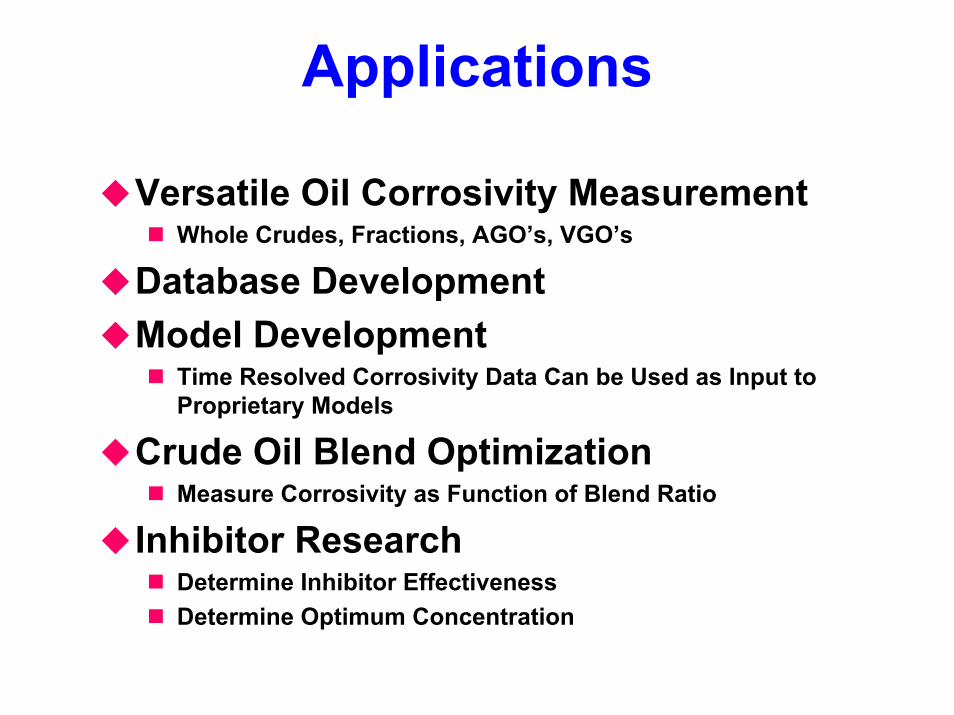
Applications
Versatile Oil Corrosivity MeasurementWhole Crudes, Fractions, AGO’s, VGO’s
Database DevelopmentModel Development
Time Resolved Corrosivity Data Can be Used as Input toProprietary Models
Crude Oil Blend OptimizationMeasure Corrosivity as Function of Blend Ratio
Inhibitor ResearchDetermine Inhibitor EffectivenessDetermine Optimum Concentration
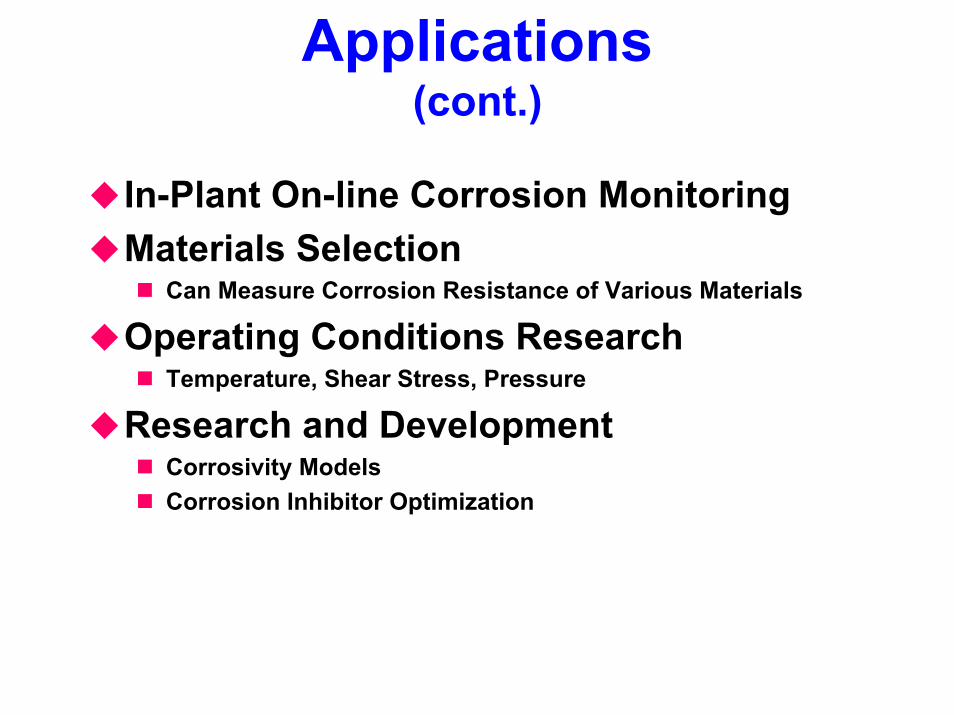
Applications(cont.)
In-Plant On-line Corrosion MonitoringMaterials Selection
Can Measure Corrosion Resistance of Various Materials
Operating Conditions ResearchTemperature, Shear Stress, Pressure
Research and DevelopmentCorrosivity ModelsCorrosion Inhibitor Optimization
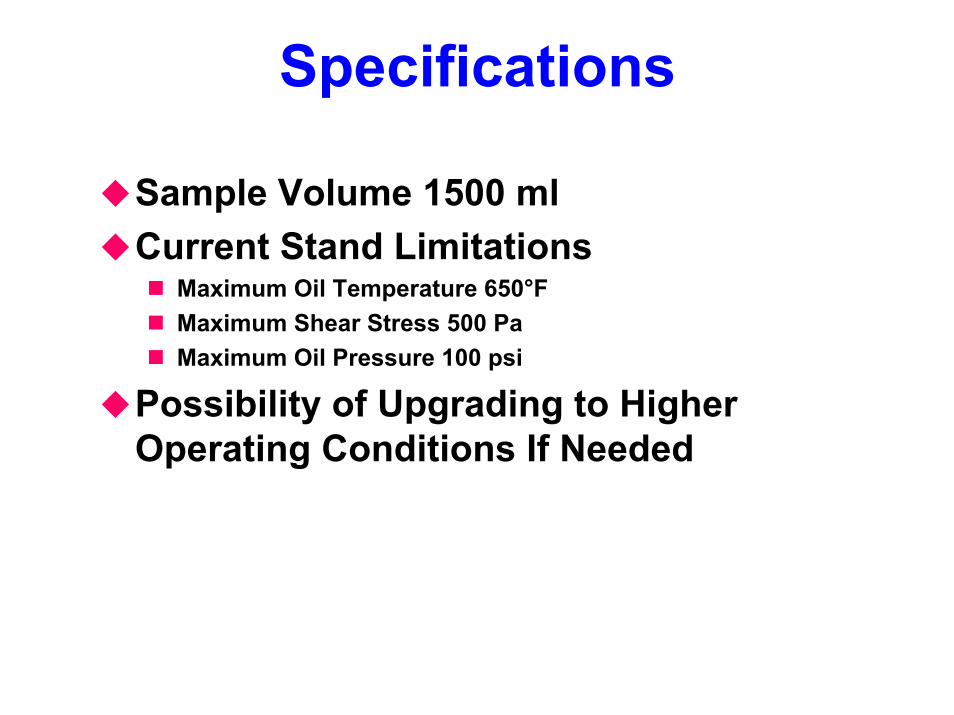
Specifications
Sample Volume 1500 mlCurrent Stand Limitations
Maximum Oil Temperature 650°FMaximum Shear Stress 500 PaMaximum Oil Pressure 100 psi
Possibility of Upgrading to HigherOperating Conditions If Needed
ConclusionsSwRI has developed a unique, versatileand highly sensitive method toaccurately determine the corrosion rateof oils.This method is designed as a tool toallow the buyer or seller of opportunitycrudes to make informed decisions oncrude values and for the refiner toassess crude corrosivity before it isrefined.

Conclusion (cont.)
Interested in forming a Joint IndustryProject (JIP) to further develop thistechnology.
Investigation of– Shear Stress Effects– Temperature Effects– Other Refinery Conditions
Standardization of Corrosivity MeasurementProcedureDevelopment of an Oil Corrosivity Index