atmospheric corrosivity estimation at electrical … corrosivity estimation at electrical control...
TRANSCRIPT

Atmospheric Corrosivity Estimation at Electrical Control Unit Roomby Multichannel Quartz Crystal Microbalance Corrosion Sensors
Kazumi Fujii1, Kenya Ohashi1, Tadahiko Hashimoto2 and Nobuyoshi Hara3
1Department of Materials Research for Power Plants, Hitachi Research Laboratory, Hitachi, Ltd., Hitachi 319-1292, Japan2Information and Control Systems Division, Hitachi, Ltd., Hitachi 319-1293, Japan3Department of Materials Science, Graduate School of Engineering, Tohoku University, Sendai 980-8579, Japan
In order to evaluate the atmospheric corrosivity in an electrical control unit room in a steelmaking plant by using quartz crystalmicrobalance (QCM) sensors, the temperature, relative humidity and corrosion rates of metals on QCM were monitored for five months. Themetals employed for sensing corrosive gases were silver, copper and cobalt. The concentrations of the corrosive gases were estimated from thedata of corrosion rates for these metals considering relative humidity. The temperature, relative humidity, and the corrosion rates in a given daywere distributed according to the normal probability law. The concentrations of H2S, SO2 and NO2 were estimated from the mean values of therelative humidity and the corrosion rates of silver, copper and cobalt, which derived from the normal probability plots. The concentrations thusobtained were roughly close to those analyzed by conventional analytical methods. The atmospheric corrosivity will be able to estimate based onthe monitoring of the corrosion rate with multichannel QCM sensors. [doi:10.2320/matertrans.M2011238]
(Received August 9, 2011; Accepted November 17, 2011; Published January 18, 2012)
Keywords: electrical control unit, temperature, relative humidity, corrosion rate, silver, copper, cobalt, quartz crystal microbalance, inverseestimation, hydrogen sulfide, sulfur dioxide, nitrogen dioxide, normal probability distribution
1. Introduction
The service environment of the electrical control unit in afactory contains corrosive gas that is generated in manufac-turing process occasionally. The traffic monitoring systemmight be suffered automobile exhaust emission. Theseelectronic and electric facilities must work stably for a longtime. When a metallic component in such equipments isdamaged by corrosion, malfunctioning or failure might occur.In the standards issued by the Japanese Industrial Standards(JIS),1) the International Electrotechnical Commissions(IEC),2) and the Japanese Electronic Industry DevelopmentAssociation (JEIDA),3) the severity of a corrosive environ-ment is classified according to the concentration of corrosivegas species in the atmosphere. On the other hand, thestandard issued by the Instrument Society of America (ISA)4)
defines the severity of environments on the basis of therate of corrosion on a copper test piece measured in theenvironment.
The evaluation of the severity of corrosive environmentsfor electronic and electric equipments is sometimes carriedout by analyzing specific gases in the air sampled. However,it is sometimes the case that the severity of the evaluatedcorrosive environment does not correspond well to thedetected degree of the corrosion damage. For instance, acopper migration occurred although the atmosphere in theelectrical control room of a steelmaking plant was moderatelycorrosive.5)
By combining a quartz crystal microbalance (QCM)6) andgas analyzer, Forslund et al.6) monitored the atmosphericenvironment in the paper manufacturing plant and illustrateda correlation between the metallic corrosion rate and thecorrosive gas concentration fluctuation pattern. On the otherhand, Todo et al.7) analyzed the correlation of measuredcopper corrosion with the atmospheric temperature, relativehumidity, corrosive gas concentration, and airborne sea saltparticle concentration. They confirmed the validity of the
severity classification issued by JEIDA-63-2000 standard,3)
claiming that a reliable copper corrosion weight lossevaluation could be achieved referring to the JEIDAstandard.
QCM is used for continuous in situ monitoring of metalcorrosion in ambient atmosphere. In fact, QCM was used formetal corrosion monitoring at the telephone exchange room,8)
at electrical control unit room in steelworks plant,5) and atthe paper manufacturing plant.6) In the past research,6) thecorrosion rate of the metal with QCM sensors and thecorrosive gas concentrations were independently measured.Then corrosion environment was analyzed from the corrosionrate of the measured metal compared with the concentrationof the corrosive gas. In a previous study,9) the corrosion rateswere monitored using QCM sensors containing differentmetal thin films in the well-controlled corrosive atmospherechamber. And corrosion rate equations of metals as functionof the corrosive species were derived from the regressionanalysis. Then, the corrosive gas concentration was inverselyestimated from the corrosion rate equations.
The purpose of this study is to examine the possibility ofevaluating the atmospheric corrosivity of actual electricalcontrol unit room in a steelmaking plant with the reverseestimation for the gas concentration by the multichannelquartz crystal microbalance sensors.
2. Experimental
The monitoring system5) consisting of QCM, temperatureand humidity sensors were set up at an air-conditionedelectrical control unit room in a steelmaking plant. Monitoreddata were gathered for five months from November 1998 toMay 1999. The data were sampled at 6min intervals andstored in the hard disk of a personal computer. The QCMsensor was made from an AT-cut quartz crystal substrate(supplied by Meidensha Corporation) with a diameter of8mm and a fundamental frequency of 10MHz. Both sides of
Materials Transactions, Vol. 53, No. 2 (2012) pp. 412 to 416©2012 The Japan Institute of Metals
the quartz crystal substrates were deposited directly withsilver, copper or cobalt thin films by radio frequency (RF)magnetron spattering. The sputtering equipment was suppliedby Anelva (SPF-313H) and the sputtering target materialswith 99.98% or 99.998% purity were supplied by theKojundo Chemical Laboratory Co. Ltd. The chamber of thesputtering system was evacuated to the level lower than2.0 © 10¹4 Pa. After evacuation, a metal thin film wasdeposited with the thickness of about 300 nm by sputteringwith RF power of 800W at ambient temperature. Thesubstrate temperature was not controlled. Then the quartzcrystal with a sputter-deposited metal thin film was insertedin a lead socket supplied by Meidensha Corporation. Finallythe electrical contact between the quartz crystal and the leadsocket was ensured by applying Ni dispersed electro-conductive adhesive supplied by ThreeBond (3381). Themonitored frequency change was converted into the masschange using the Zauerbrey equation10) and the corrosion ratewas estimated from the evaluated mass change.
3. Results and Discussion
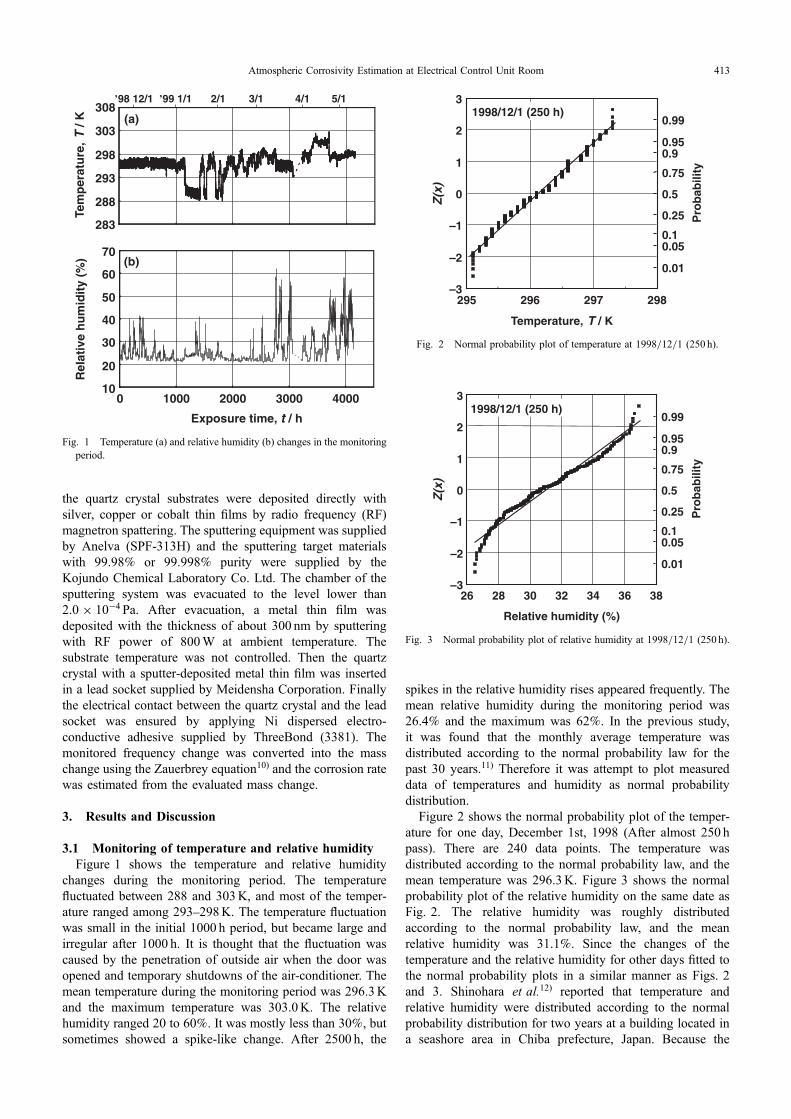
3.1 Monitoring of temperature and relative humidityFigure 1 shows the temperature and relative humidity
changes during the monitoring period. The temperaturefluctuated between 288 and 303K, and most of the temper-ature ranged among 293298K. The temperature fluctuationwas small in the initial 1000 h period, but became large andirregular after 1000 h. It is thought that the fluctuation wascaused by the penetration of outside air when the door wasopened and temporary shutdowns of the air-conditioner. Themean temperature during the monitoring period was 296.3Kand the maximum temperature was 303.0K. The relativehumidity ranged 20 to 60%. It was mostly less than 30%, butsometimes showed a spike-like change. After 2500 h, the
spikes in the relative humidity rises appeared frequently. Themean relative humidity during the monitoring period was26.4% and the maximum was 62%. In the previous study,it was found that the monthly average temperature wasdistributed according to the normal probability law for thepast 30 years.11) Therefore it was attempt to plot measureddata of temperatures and humidity as normal probabilitydistribution.
Figure 2 shows the normal probability plot of the temper-ature for one day, December 1st, 1998 (After almost 250 hpass). There are 240 data points. The temperature wasdistributed according to the normal probability law, and themean temperature was 296.3K. Figure 3 shows the normalprobability plot of the relative humidity on the same date asFig. 2. The relative humidity was roughly distributedaccording to the normal probability law, and the meanrelative humidity was 31.1%. Since the changes of thetemperature and the relative humidity for other days fitted tothe normal probability plots in a similar manner as Figs. 2and 3. Shinohara et al.12) reported that temperature andrelative humidity were distributed according to the normalprobability distribution for two years at a building located ina seashore area in Chiba prefecture, Japan. Because the
0 1000 2000 3000 400010
20
30
40
50
70
60(b)
283
288
293
298
303
308(a)
2/1 3/1 4/1 5/1
Exposure time, t / h
Rel
ativ
e h
um
idit
y (%
)Te
mp
erat
ure
, T
/ K
’98 12/1 ’99 1/1
Fig. 1 Temperature (a) and relative humidity (b) changes in the monitoringperiod.
–3
–2
–1
0
1
2
3
0.01
0.050.1
0.25
0.5
0.75
0.90.95
0.99
295 296 297 298
1998/12/1 (250 h)
Temperature, T / K
Pro
bab
ility
Z(x
)
Fig. 2 Normal probability plot of temperature at 1998/12/1 (250 h).
28 32 36–3
–2
–1
0
1
2
3
0.01
0.050.1
0.25
0.5
0.75
0.90.95
0.99
26 30 34 38
Relative humidity (%)
1998/12/1 (250 h)
Pro
bab
ility
Z(x
)
Fig. 3 Normal probability plot of relative humidity at 1998/12/1 (250 h).
Atmospheric Corrosivity Estimation at Electrical Control Unit Room 413

temperature and humidity showed similar distribution, it wasconcluded that the normal probability plots was useful toobtain the mean temperature and humidity for given daythrough the monitoring period.
3.2 Quartz crystal microbalance monitoringThe mass gain of silver, copper and cobalt films was
derived from frequency changes of QCM sensors during themonitoring period.
Figure 4 shows the changes in the mass gain as a functionof exposure time. The measured mass gain represents the sumof the weight of the corrosion products of the metal, the dustparticles deposited on the sensor surface, and water adsorbedon the surface. In the following analysis, it was consideredthat the influences of the other factors except for thecorrosion products are constant and thus the increase in themeasured mass gain is due to the increase in the massof corrosion products. The total mass gain through themonitoring period was estimated to be 2.5 © 10¹5 g·cm¹2 forAg, 6.0 © 10¹6 g·cm¹2 for Cu, and 4.5 © 10¹6 g·cm¹2 for Co.Figure 5 shows the corrosion rate for silver (a), copper (b)and cobalt (c) evaluated from the mass gain for every 24 h.The corrosion rate here is defined as an increase rate ofthe mass of the corrosion products. The maximum corrosionrate was 3.33 © 10¹8 g·cm¹2·h¹1 for silver, 1.11 © 10¹8
g·cm¹2·h¹1 for copper and 1.48 © 10¹8 g·cm¹2·h¹1 forcobalt.
Figures 6, 7 and 8 show normal probability plots of thecorrosion rate for silver, copper and cobalt on December 1st,1998. The corrosion rate for each metal was roughlydistributed according to the normal probability law. Themean corrosion rates were 1.16 © 10¹8 g·cm¹2·h¹1 forsilver, 3.59 © 10¹9 g·cm¹2·h¹1 for copper and 2.09 © 10¹9
g·cm¹2·h¹1 for cobalt. The distribution of the corrosion rateanalyzed for other days also obeyed the normal probabilitylaw.
3.3 Estimation of the atmospheric corrosivityAs the relative humidity and corrosion rate were distribut-
ed according to the normal probability distribution, the meanvalues for the relative humidity and the corrosion rate of eachmetal for a given day were estimated from the normalprobability plots. Figure 9 shows the change of the dailymean values for relative humidity and the corrosion rates as a
function of exposure time. The corrosion rate of cobalt seemsto have changed corresponding to the change in relativehumidity excluding a part of data, while the corrosion rates ofsilver and copper are thought to have changed independent ofthe change in relative humidity. In the previous study,9) it wasfound that the corrosion rates of silver and copper areindependent of the relative humidity. The corrosion rate ofsilver depends on the corrosive gas concentration of nitrogendioxide and hydrogen sulfide, and that of copper on theconcentration of sulfur dioxide and hydrogen sulfide.
From these statistical evaluations, it is possible to assumethat the corrosion rate changes not only with the relative
’98.11 ’99.5
3.0
6.0
9.0
Ag
0 1000 2000 3000 4000
10
20
30
0
Cu
Co
Exposure time, t / h
Mas
s g
ain
, M
/ 10
–6–2
Δ
Mas
s g
ain
, M
/ 10
Δ
g
cm
–6–2
g
cm
Fig. 4 Mass gains on QCM sensors of silver, copper and cobalt in themonitoring period.
’98.11 ’99.5
0 1000 2000 3000 4000
2
6
–2
0
4(a) Ag
(b) Cu
(c) Co
1
3
–1
0
2
1
3
–1
0
2
Exposure time, t / h
Co
rro
sio
n r
ate,
Vco
rr /
10
g c
m
h–8
–2–1
Fig. 5 Corrosion rate changes on QCM sensors of silver (a), copper (b) andcobalt (c) in the monitoring period.
–3
–2
–1
0
1
2
3
0.01
0.050.1
0.25
0.5
0.75
0.90.95
0.99
0.8 1.0 1.2 1.6
Pro
bab
ility
1.4
Ag / 1998/12/1 (250 h)
Corrosion rate, Vcorr / 10–8 . g .
cm–2 .
h–1
Z(x
)
Fig. 6 Normal probability plot of corrosion rate on QCM sensor of silver at1998/12/1 (250 h).
K. Fujii, K. Ohashi, T. Hashimoto and N. Hara414
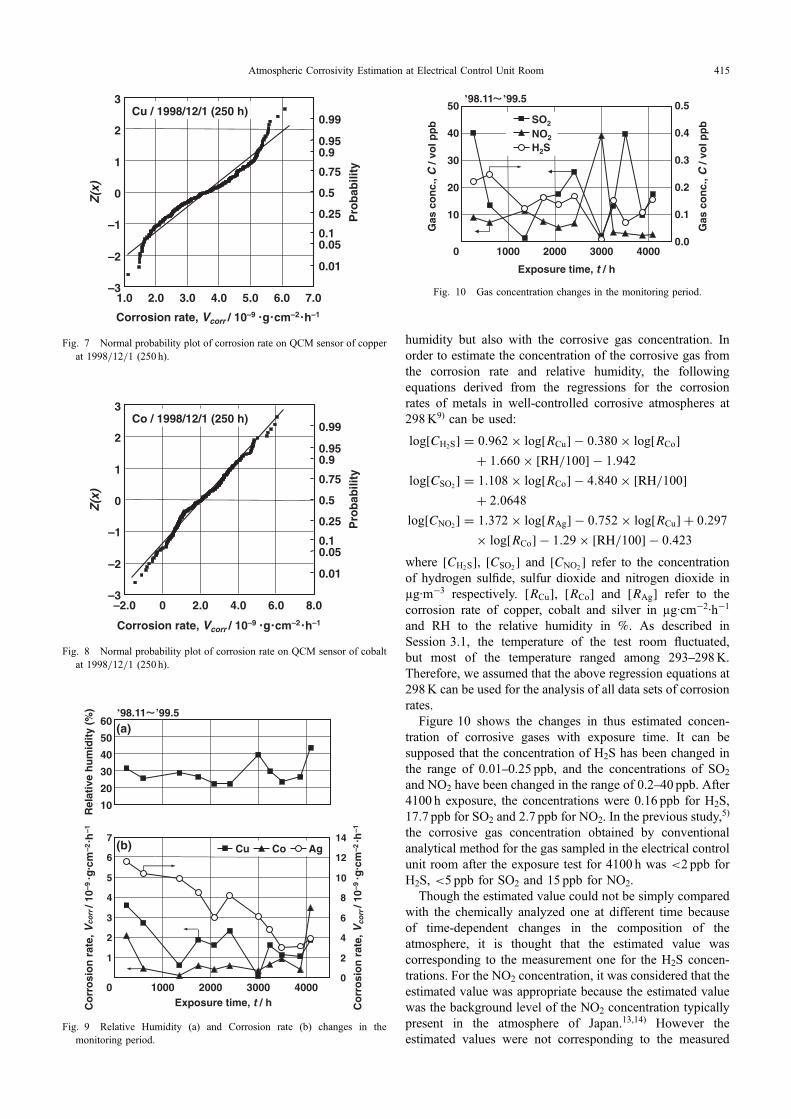
humidity but also with the corrosive gas concentration. Inorder to estimate the concentration of the corrosive gas fromthe corrosion rate and relative humidity, the followingequations derived from the regressions for the corrosionrates of metals in well-controlled corrosive atmospheres at298K9) can be used:
log½CH2S� ¼ 0:962� log½RCu� � 0:380� log½RCo�þ 1:660� ½RH=100� � 1:942
log½CSO2� ¼ 1:108� log½RCo� � 4:840� ½RH=100�
þ 2:0648
log½CNO2� ¼ 1:372� log½RAg� � 0:752� log½RCu� þ 0:297
� log½RCo� � 1:29� ½RH=100� � 0:423
where ½CH2S�, ½CSO2� and ½CNO2
� refer to the concentrationof hydrogen sulfide, sulfur dioxide and nitrogen dioxide inµg·m¹3 respectively. ½RCu�, ½RCo� and ½RAg� refer to thecorrosion rate of copper, cobalt and silver in µg·cm¹2·h¹1
and RH to the relative humidity in %. As described inSession 3.1, the temperature of the test room fluctuated,but most of the temperature ranged among 293298K.Therefore, we assumed that the above regression equations at298K can be used for the analysis of all data sets of corrosionrates.
Figure 10 shows the changes in thus estimated concen-tration of corrosive gases with exposure time. It can besupposed that the concentration of H2S has been changed inthe range of 0.010.25 ppb, and the concentrations of SO2
and NO2 have been changed in the range of 0.240 ppb. After4100 h exposure, the concentrations were 0.16 ppb for H2S,17.7 ppb for SO2 and 2.7 ppb for NO2. In the previous study,5)
the corrosive gas concentration obtained by conventionalanalytical method for the gas sampled in the electrical controlunit room after the exposure test for 4100 h was <2 ppb forH2S, <5 ppb for SO2 and 15 ppb for NO2.
Though the estimated value could not be simply comparedwith the chemically analyzed one at different time becauseof time-dependent changes in the composition of theatmosphere, it is thought that the estimated value wascorresponding to the measurement one for the H2S concen-trations. For the NO2 concentration, it was considered that theestimated value was appropriate because the estimated valuewas the background level of the NO2 concentration typicallypresent in the atmosphere of Japan.13,14) However theestimated values were not corresponding to the measured
–3
–2
–1
0
1
2
3
0.01
0.050.1
0.25
0.5
0.75
0.90.95
0.99
1.0 3.0 5.0 7.0
Pro
bab
ility
Cu / 1998/12/1 (250 h)
2.0 4.0 6.0
Corrosion rate, Vcorr / 10–9 . g .
cm–2 .
h–1
Z(x
)
Fig. 7 Normal probability plot of corrosion rate on QCM sensor of copperat 1998/12/1 (250 h).
–3
–2
–1
0
1
2
3
0.01
0.050.1
0.25
0.5
0.75
0.90.95
0.99
–2.0 2.0 6.0 8.0
Pro
bab
ility
Co / 1998/12/1 (250 h)
4.00
Corrosion rate, Vcorr / 10–9 . g .
cm–2 .
h–1
Z(x
)
Fig. 8 Normal probability plot of corrosion rate on QCM sensor of cobaltat 1998/12/1 (250 h).
’98.11 ’99.5
10
20
30
40
50
60
Rel
ativ
e h
um
idit
y (%
)
(a)
1
2
3
4
5
6
7
0
2
4
6
8
10
12
14Cu Co Ag
0 2000 3000 4000
(b)
1000Exposure time, t / hC
orr
osi
on
rat
e, V
corr
/ 10
Co
rro
sio
n r
ate,
Vco
rr /
10
–2–1
–9
g c
m h
–2–1
–9
g c
m h
Fig. 9 Relative Humidity (a) and Corrosion rate (b) changes in themonitoring period.
10
20
30
40
50
0 1000 2000 3000 40000.0
0.1
0.2
0.3
0.4
0.5SO2
NO2
H2S
’98.11 ’99.5
Gas
co
nc.
, C /
vol p
pb
Gas
co
nc.
, C /
vol p
pb
Exposure time, t / h
Fig. 10 Gas concentration changes in the monitoring period.
Atmospheric Corrosivity Estimation at Electrical Control Unit Room 415

ones for SO2 concentration. The contribution coefficients ofthe approximation equations were 0.97 for hydrogen sulfide,0.78 for nitrogen dioxide and 0.64 for sulfur dioxide.9)
The reason why the estimated values for SO2 were notcorresponding to the measurement ones was that the accuracyof the approximation equation was insufficient. It is thoughtthat the estimation of the gas concentration can be improvedby advancing the accuracy of the approximation equation.If considering the daily variations in the corrosive gasconcentration, there exits a correspondence between theconcentration estimated by the present QCM method andthat obtained by the conventional method. As a result,it is thought that there is possibility that the atmosphericcorrosivity can be estimated based on the monitoring of thecorrosion rate with multichannel QCM sensors.
4. Conclusions
The corrosion rates of silver, copper and cobalt weresimultaneously monitored with temperature and humidity inthe electrical control unit room in a steelmaking plant. Thedata obtained were analyzed to utilize them for the estimationof the concentrations of the corrosive gases. The followingconclusions were drawn.(1) The fluctuation of the temperature, relative humidity,
and corrosion rates were roughly distributed accordingto the normal probability law.
(2) The mean values of the relative humidity and thecorrosion rates of the three metals, derived from thenormal probability plots, can be used for estimating theconcentration of SO2, NO2 and H2S.
(3) It is considerable that the corrosion rates of silver,copper and cobalt fluctuated since the corrosive factorslike relative humidity and concentration of the corrosive
gas change in the electrical control unit room.(4) The atmospheric corrosivity will be able to estimate
based on the monitoring of the corrosion rate withmultichannel QCM sensors.
Acknowledgments
The authors acknowledge the invaluable advice providedby Mr. Y. Saito, Mr. M. Tanji and Mr. T. Aono of Hitachi Ltd.
REFERENCES
1) Japanese Standards Association, JIS (Japanese Industrial Standards)C0116 (1998).
2) International Electrotechnical Commission, IEC 60721-3-3 Ed.2.2:2002 (b) (2002).
3) Japanese Electronic Industry Development Association, JEIDA-63-2000 (2000).
4) Instrument Society of America, ISA-S71.04-1985 EnvironmentalConditions for Process Measurements and Control Systems: AirborneContaminants, Instrument Society of America (1985).
5) K. Fujii, K. Ohashi and T. Aono: Zairyo-to-Kankyo 56 (2007) 215.6) M. Forslund, J. Majoros and C. Leygraf: J. Electrochem. Soc. 144
(1997) 2637.7) Y. Todo, K. Kanehira, K. Kimura and J. Fukakura: Zairyo-to-Kankyo
51 (2002) 153.8) R. Schubert, B. Meagher and C. C. Chung: J. Electrochem. Soc. 142
(1995) 3157.9) K. Fujii, K. Ohashi and T. Hashimoto: Zairyo-to-Kankyo 56 (2007)
458.10) G. Zauerbrey: Z. Phisik. 155 (1959) 206.11) M. Ochiai: HEAT & ENVIRONMENT 45 (1995) 1.12) T. Shinohara, S. Motoda, K. Nabeshima, Y. Suzuki and S. Tsujikawa:
Zairyo-to-Kankyo 48 (1999) 796.13) Japan Society of Corrosion Engineering (ed.): Corrosion Databook
(Jpn.), (Maruzen, Tokyo, 1995) p. 477.14) Chemical Society of Japan (ed.): Kagaku Binran (Ouyoukagakuhen 1)
6th Ed., (Maruzen, Tokyo, 2003) p. 402.
K. Fujii, K. Ohashi, T. Hashimoto and N. Hara416