soil and plant contamination by textile industries at...
TRANSCRIPT

Soil and plant contamination by textile industries at ZFILM, Managua
Linus Hagberg Erik Löfgren
Arbetsgruppen för Tropisk Ekologi Minor Field Study 126 Committee of Tropical Ecology ISSN 1653-5634 Uppsala University, Sweden
March 2007 Uppsala

Soil and plant contamination
by textile industries at ZFILM, Managua
Linus Hagberg Erik Löfgren
Project work in Aquatic and Environmental Engineering, 10 ECTS, Uppsala University Project course, 10 ECTS, Swedish University of Agricultural Sciences


3
Abstract
In Nicaragua’s largest Free Trade Zone, Zona Franca Industrial Las Mercedes (ZFILM) in Managua, 22 textile industries operate with jeans washing, bleaching and sewing. Some of the processes involved consume considerable quantities of water and produce large quantities of environmentally hazardous wastewater. The wastewater, known as Agua Azul due to its distinct blue color, has for 15 years been released untreated into an existing river with Lake Managua as final recipient. Only the last two years treatment plants have been installed, slightly improving the quality of the wastewater. The aim of this study was to examine how the environment and the local farmers are affected by the wastewater from ZFILM. Focus was on soil characterization and heavy metal concentrations in soils adjacent to the wastewater channel and in edible crops cultivated there. Two main problems for the farmers living next to the wastewater channel associated with the wastewater and ZFILM were identified. First; shortage of clean water for drinking and irrigation since the establishment of ZFILM. Second; inundations of the wastewater. The river/channel is under-dimensioned and the wastewater inundates the surrounding cultivations during the rain periods with severe effects on crop growth and the possibilities for cultivation. Comprehensive physical-chemical soil analyses were carried out on soil samples from three sites along the wastewater channel that often get inundated and from one site that is never inundated as reference. No difference could be observed between wastewater-affected and the not affected site regarding the cation balance, pH, sodicity or salinity. All soils are highly alkaline, show an imbalance of exchangeable K and Mg and none of them seem to be severely salt or sodium affected. However, significantly higher levels of available Fe, Cu, Mn and Zn as well as available phosphorous (P-Olsen = 0.5 M, pH 8.5 NaHCO3 solution) were found in the three sites exposed to the wastewater compared to the reference. This can probably be due to the impact of wastewater. The sites were also analysed for heavy metals. The cadmium concentration exceeds the Swedish EPA limit value for polluted soils at least four times at all sites, including the reference. The concentrations of cobalt, lead and mercury were well under the limit values at all sites. An incubation experiment was also carried out for 15 days on soils from the three sites plus reference to determine the microbial activity in the soils. The produced CO2 (respiration) from the microbial decomposition of organic matter were collected and measured through titration. The results show a tendency of higher accumulated respiration after 7 days in the reference than in the three wastewater affected soils, but no difference could be proved statistically due to too few replicas and too high internal variance within the replicas. The distribution of the heavy metals Cu, Ni, Zn, Cr total and Cr VI were determined in the soils along the wastewater channel. By means of ArcMap and a GPS-unit, the heavy metal concentration was determined and visualized at 20 sites. The results show toxic levels of copper at all sites, mostly above 200 mg/kg. Correlation to wastewater impact is, however, unclear. Toxic levels of Cr VI were found at three sites and toxic levels of Ni at two sites. The highest levels of Ni, Cr total and Cr VI seem to be concentrated to the downstream area close to Lake Managua. This is more likely linked to wastewater impact through pollutant transport with groundwater movements towards the lake, but other explanations are possible.

Five samples of edible plants cultivated on sites exposed to the wastewater were analysed on heavy metal content. Concentrations of Pb, Cd, Ni and Cr were under detection limits. Zn concentrations were low in all samples. Concentration of Cu with toxic effects for plants was found in one sample (Basil). There does not seem to be any risk for human consumption of the crops at the study sites regarding heavy metals. The study states that an improved treatment of the wastewater is needed and that measures need to be taken from the government and ZFILM to ensure that the malfunctioning sewage system and the treatment plants have the required capacity. The national regulations should be more stringent and include more parameters. The lumber and crap originating from the ZFILM area that during rain periods get flushed down to the study site and cause severe inundations of the wastewater must be collected.
4

5
Resumen Dentro de la zona mas grande de exportación en Nicaragua, Zona Franca Industrial Las Mercedes (ZFILM) en Managua, 22 industrias textileras estan operando con lavado, blanqueo y costura de pantálones. Algunas de las industrias consumen considerables cantidades de agua y producen aguas residuales que constituyen un riesgo para el medio ambiente. El agua residual, conocida como “Agua Azul” por su color azul, ha sido vertida por 15 años a un rio que desemboca en el Lago Managua. Los dos ultimos años plantas de tratamiento han estado operando, mejorando un poco la calidad de las aguas residuales. El propósito de este estudio es examinar como el medio ambiente ha sido afectado por las aguas residuales de la ZFILM. Para esto,se ha caracterizado el suelo y las concentraciones de metales pesados cerca del canal de las aguas residuales y las consumibles. Dos problemas principalmente afectan a los campesinos que viven cerca de el canal de aguas residuales. Uno, la cercancia de agua potable para tomar e irrigar desde el establecimiento de ZFILM. Dos, inundacíones de aguas residuales. El canal es sub-dimensionado y las aguas residuales inundan los cultivos de los alrededor con effectos serios para el crecimiento de las cosechas y la possibilidad de cultivar. Amplios análisis físico-químicos fueron realizado de muestras del suelo en tres sitios a lo largo del canal de aguas residuales donde inunda y de un sitio que nunca inunda como referencia. No es possible ver una differencia entre los sitios afectados y el sitio de referencia con respecto a el balance de cationico, sodisidad, salinidad y pH. Todos las muestras del suelo tiene alta alkalinidad, tiene una inbalance de K y Mg y ningun es significante sal o sodio. Sin embargo, significantes altos niveles de accessible Fe, Cu, Mn, Zn y P (P-Olsen = 0.5 M, pH 8.5 NaHCO3 solucíon) fueron encontrados en los tres sitios expuestas a las aguas residuales. Probablemente a causa del impacto de las aguas residuales. Los sitios fueron tambien analizados en busca metales pesados. Los niveles de cadmio exceden el límite establecido por la Agencia Protectíon Ambiental (APA) en Suecia por lo menos 4 veces en todos los sitios incluyendo la referencia. Los niveles de cobre también exceden el limité en todos los sitios. Los niveles de cobalto, arsenico, plomo y mercurio estan bien bajo el límite en todos sitios. Un experimento de incubacíon fue también realizado por 15 días en suelos de los tres sitios y la referencia para determinar la actividad delos microorganismos en los suelos. El dióxido de carbono (respiracíon) de la decomposicíon microbiológica fue recolectado y medido por titracíon. Los resultados muestran una tendencía a la alta accumulacíon de respiracíon después 7 diás en la referencía de los sitios expuestos aguas residuales. Pero, la falta de una significante diferencía podría mostrar la falta de sufficiente replicas y alta variedad interna las de las replicas. La distribución de los metales pesados Cu, Ni, Cr total y Cr VI fue determinada en suelos a lo largo de la canal de aguas residuales. Con ayuda de ArcMap y una GPS, concentracíones de 20 sitios fueron determinadas y visualizadas. Los resultados muestran niveles tóxicos de cobre en todos los sitios, por lo general encima de 200mg/kg. Pero, la correlacíon del impacto del agua azul no es nítida. Niveles tóxicos de Cr VI fueron encontrados en tres sitios y de Ni en dos sitios. Los más altos niveles de Ni, Cr total y Cr VI parecen estar concentrados en el area cerca Lago Managua. Esto es probablemente un impacto de las aguas residuales mediante el movemiento del agua subterránea al lago. Otra explicación es tambien possible.

6
Cinco muestas de cosechas comestibles cultivadas en sitios expuestos a agua residuales fueron analizadas para el contenido de metales pesados. Concentracíones de Pb, Cd, Ni y Cr fueron bajo límites detectables. Niveles de Zn fueron bajos en todas mueastras. Concentracíon tóxica en plantas fue encontrado en una muestra (albahaca). No hay riesgo de consumo humano de cosechas en el sitio del estudio por metales pesados. El estudio concluye que el tratamiento de las aguas residuales necesita mejorar y que el gobierno y ZFILM tienen que asegurar que el mal-funcionamiento del sistema de alcantarillado y plantas de tratamiento tiene la capacidad requerida. Las regualcíones nacíonales deben ser más severas e incluir más parametros. La basura del area de ZFILM que enjuaga durante las lluvias fuertes el sitio de estudio y causa inundacíones serias, tiene que ser recogida.

Preface This study was conducted partly as a Minor Field Study (MFS) funded by the Swedish International Development Cooperation Agency (Sida) and partly under the programme ALFA (Latin America Academic Training) of the European Union. The study was carried out during September - December 2006 in Managua, Nicaragua at Universidad Nacional Agraria (UNA) in cooperation with the Swedish University of Agricultural Sciences (SLU).
7

Acknowledgements This study was possible thanks to support from the Swedish International Development Cooperation Agency (Sida) through the Committee of Tropical Ecology at Uppsala University and the European Union ALFA programme. Thanks for the opportunity to go to Nicaragua and carry out this project. The study was also possible due to the 25 years long cooperation between SLU in Uppsala and UNA in Managua. We would in particular like to thank our supervisor and inspirer Professor Erasmus Otabbong at the Department of Soil Sciences, SLU. You gave us the first idea and the inspiration to do this project and have been a good support throughout the project. It was a pleasure to work with you and to share your laughs. Gerhard Bax at the Department of Earth Sciences at Uppsala University has also been of great help by providing us with equipment and supervising the GIS analysis. Special thanks to Jannette Gutiérrez Barrera at Gestión Ambiental, that from the moment we arrived gave us invaluable help at UNA. You gave us our own office, introduced us to important people and helped us with in all kinds of ways during our stay at UNA. Thank you and the other Profesoras at Gestión Ambiental for your friendliness and your valuable feedback on the project. Thanks Luis Hernández for showing us the study site and sharing your knowledge about the Agua Azul problem with us. You always gave us your time and valuable support with the study, and a lot of laughs. Great thanks to Manuel Morán al Bizú, Cruz Mendoza, Manuel Silva Espinoza and others living at the study site for explaining to us about Agua Azul and its implications, and for welcoming us into your homes. Many thanks also to Leonardo Garcia Centeno at LABSA for letting us use the laboratory and to all of you at LABSA for your help. Especially to Gustavo Valverde, for always giving us your time and becoming our friend. Luz Esmelda Reynosa, Bismarck Mendoza, Andrés Lopez and all others at UNA, thanks for your support and smiles. We also would like to thank Freddy Alemán for helping us with accommodation and transportation whenever we wanted. You were our first contact in Nicaragua. And Benito Zapata and the analysts at LAQUISA for the analytic work. And last but not the least, thanks to all friends we made in Managua. Glenda, Mario, Travis and many more! In Nicaragua we have met so many helpful and friendly people that we will remember the rest of our lives! You all made our stay there an unforgettable experience. Thank you!
8

Contents Abstract ...................................................................................................................................... 3 Resumen ..................................................................................................................................... 5 Preface........................................................................................................................................ 7 Acknowledgements .................................................................................................................... 8 Contents...................................................................................................................................... 9 1 Introduction ..................................................................................................................... 13
1.1 Aims and Objectives ................................................................................................ 13 1.1.1 Specific objectives............................................................................................ 13
2 Background ..................................................................................................................... 14 2.1 Study site .................................................................................................................. 14
2.1.1 Location............................................................................................................ 14 2.1.2 Climate data...................................................................................................... 14 2.1.3 Soil types .......................................................................................................... 15
2.2 Environmental impacts of textile industries............................................................. 15 2.3 Free trade zones and ZFILM.................................................................................... 16
2.3.1 Zona Francas .................................................................................................... 16 2.3.2 ZFILM.............................................................................................................. 16 2.3.3 Aqua Azul ........................................................................................................ 17
2.4 Former studies .......................................................................................................... 20 2.4.1 Potential contamination risk from ZFILM....................................................... 20 2.4.2 Characterization of Agua Azul......................................................................... 20
2.5 Laws and regulations regarding textile industries.................................................... 20 2.6 Heavy metals ............................................................................................................ 21
2.6.1 Lead.................................................................................................................. 22 2.6.2 Chromium......................................................................................................... 22 2.6.3 Copper .............................................................................................................. 23 2.6.4 Zinc................................................................................................................... 23 2.6.5 Nickel ............................................................................................................... 23 2.6.6 Cadmium .......................................................................................................... 24 2.6.7 Cobalt ............................................................................................................... 24 2.6.8 Mercury ............................................................................................................ 24 2.6.9 Arsenic ............................................................................................................. 25 2.6.10 Norms and guideline values ............................................................................. 25
2.7 Soil composition and structure................................................................................. 27 2.8 Exchangeable cations and CEC................................................................................ 28
2.8.1 CEC .................................................................................................................. 28 2.8.2 Desirable cation ratios...................................................................................... 28
2.9 Salinity and sodicity ................................................................................................. 29 2.9.1 Effects of salt accumulation and high sodium levels ....................................... 29 2.9.2 Measuring salinity and sodicity........................................................................ 29 2.9.3 Saline, saline-sodic and sodic soils .................................................................. 30
2.10 Soil microorganisms................................................................................................. 30 2.10.1 Measuring microbial activity ........................................................................... 30 2.10.2 Effects on microorganisms of heavy metals .................................................... 31
3 Materials and methods .................................................................................................... 32 3.1 Initial investigation................................................................................................... 32 3.2 Sampling................................................................................................................... 32
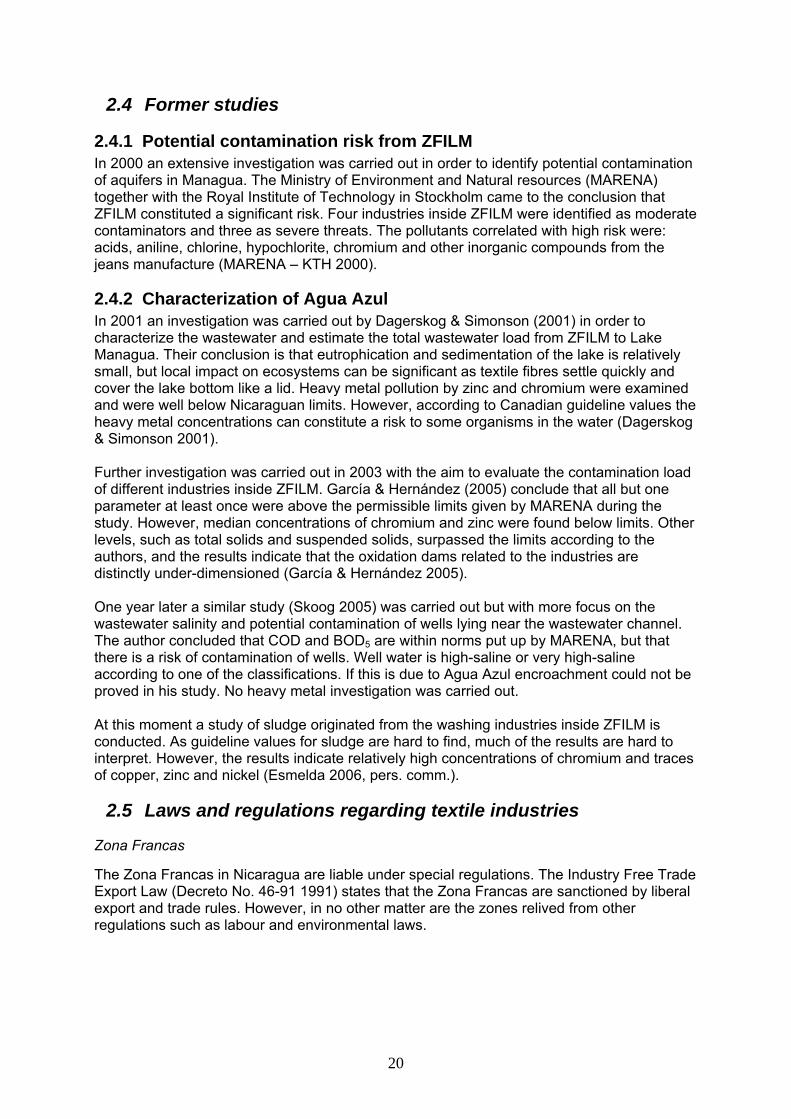
3.2.1 Soil samples...................................................................................................... 32 3.2.2 Plant samples.................................................................................................... 34
9

3.2.3 Wastewater sample........................................................................................... 34 3.3 Analyses ................................................................................................................... 35
3.3.1 Soil and plant samples...................................................................................... 35 3.3.2 Wastewater sample........................................................................................... 35
3.4 Incubation experiment.............................................................................................. 35 3.4.1 Soil preparation ................................................................................................ 35 3.4.2 Water content determination ............................................................................ 35 3.4.3 Water holding capacity (WHC) determination ................................................ 35 3.4.4 Experimental set up.......................................................................................... 35 3.4.5 Determination of microbial respiration ............................................................ 36
4 Results ............................................................................................................................. 37 4.1 Soil fertility .............................................................................................................. 37
4.1.1 Soil composition and pH.................................................................................. 37 4.1.2 CEC and cation nutrient ratios ......................................................................... 37 4.1.3 Micronutrients .................................................................................................. 38 4.1.4 Salinity and sodicity ......................................................................................... 38 Table 4-4 Electric conductivity (EC), exchangeable sodium percentage (ESP) and soil classification (according to Table 2-2)............................................................................. 39 4.1.5 Phosphorous ..................................................................................................... 39
4.2 Heavy metals in soil ................................................................................................. 39 4.3 Heavy metal distribution .......................................................................................... 40
4.3.1 Copper .............................................................................................................. 40 4.3.2 Nickel ............................................................................................................... 41 4.3.3 Zinc................................................................................................................... 42 4.3.4 Total and hexavalent chromium....................................................................... 43 4.3.5 Toxic and high levels ....................................................................................... 44
4.4 Heavy metals in the wastewater ............................................................................... 44 4.5 Heavy metals in plants ............................................................................................. 45 4.6 Microbial activity ..................................................................................................... 45
5 Discussion ....................................................................................................................... 47 5.1 Soil fertility .............................................................................................................. 47
5.1.1 Conclusions ...................................................................................................... 47 5.2 Heavy metals in soil ................................................................................................. 48
5.2.1 Conclusions ...................................................................................................... 48 5.3 Heavy metal distribution .......................................................................................... 48
5.3.1 Copper .............................................................................................................. 48 5.3.2 Nickel ............................................................................................................... 48 5.3.3 Zinc................................................................................................................... 48 5.3.4 Total and hexavalent chromium....................................................................... 48 5.3.5 Conclusions ...................................................................................................... 49
5.4 Heavy metals in wastewater ..................................................................................... 49 5.4.1 Conclusions ...................................................................................................... 50
5.5 Heavy metals in plants ............................................................................................. 50 5.5.1 Conclusions ...................................................................................................... 50
5.6 Microbial respiration ................................................................................................ 50 5.6.1 Conclusions ...................................................................................................... 51
6 Recommendations ........................................................................................................... 52 References ................................................................................................................................ 54 Abbreviations ........................................................................................................................... 57 Appendices ............................................................................................................................... 59
10

Appendix 1 Map of study site and oxidation dams.................................................................. 59 Appendix 2 Companies operating in ZFILM 2006.................................................................. 59 Appendix 3 Summary of analytical methods for soil, water and plant samples ...................... 60 Appendix 4 Titration results from the incubation experiment ................................................. 61 ml HCl (0.05 M) required to neutralize 2 ml CO2-trap. Averages of two titrations for each treatment................................................................................................................................... 61 Appendix 5 Calculated average respiration in mg C for each treatment type.......................... 62 Appendix 6 Summary of ANOVA test criterions .................................................................... 62 Appendix 7 ANOVA test results.............................................................................................. 62 Appendix 8 Test for difference between Ref and the other three soils (Incub 1, Incub 2, and Incub 3) .................................................................................................................................... 63 Appendix 9 Total concentrations of heavy metals (mg/kg) in soil samples for heavy metal distribution determination ........................................................................................................ 63 Appendix 10 Additional results from wastewater analysis ...................................................... 63 Appendix 11 Summary of all results from soil characterization (including Ref 2) ................. 64 Figures Figure 2-1 Location of the study site. ...................................................................................... 14 Figure 2-2 Average precipitation (mm) and temperature (ºC) in Managua. ............................ 15 Figure 2-3 Waste originating from the area around ZFILM flashes down through the wastewater channel during the rainy period and causes inundations in the surrounding cultivations. Photo: Linus Hagberg 16 Nov. 2006. .................................... 19 Figure 2-4 A banana field inundated by Aqua Azul. Photo: Linus Hagberg 16 Nov. 2006. ........................................................................................................................................ 19 Figure 4-1 Concentrations of available micronutrients of Iron, Copper, Manganese and Zinc (mg/kg).................................................................................................................... 38 Figure 4-2 Total copper concentration. .................................................................................... 40 Figure 4-3 Total nickel concentration. ..................................................................................... 41 Figure 4-4 Total zinc concentration. ........................................................................................ 42 Figure 4-5 Concentrations of total chromium and hexavalent chromium. .............................. 43 Figure 4-6 High and toxic levels of heavy metals. High level is defined as > 75 % of the limit value set by the Swedish EPA and toxic level when the limit value is exceeded. ................... 44 Figure 4-7 Accumulative microbial respiration (mg C) of the three wastewater affected soils (Incub 1, Incub 2 and Incub 3) and a not affected soil (Ref) with 100 mg glucose added. From averages of the two replicas of each soil.................................................................................. 46 Tables Table 2-1 Maximum permitted daily average limits for discharged wastewater from textile industries (Decreto No.33-95 2000) ........................................................................ 21 Table 2-2 Critical concentrations of various heavy metals in soils (mg / kg air dry soil). ...... 26 Table 2-3 Critical concentration of various heavy metals in plants (mg/kg dry matter). ........ 26 Table 2-4 Limit values for heavy metals in wastewater from textile industries, according to Nicaraguan law and the World Bank. ...................................................................................... 27 Table 2-5 Desirable cation ranges as % of CEC for intensive grazing and horticulture in clay loam - sandy loam soils according to ABSA (2006) and NSW (2006). .................................. 28 Table 2-6 EC and ESP ranges for saline, sodic and saline-sodic soils..................................... 30 Table 3-1 Treatment scheme for the incubation experiment.................................................... 36 Table 4-1 pH, soil density, organic matter percentage, textural composition and USDA texture class. .............................................................................................................. 37
11

Table 4-2 Cation exchange capacity, cation percentages and comparative desirable levels according to ABSA (2006)....................................................................................................... 37 Table 4-3 Cation ratios and recommended ratios..................................................................... 38 Table 4-4 Electric conductivity (EC), exchangeable sodium percentage (ESP) and soil classification (according to Table 2-2)..................................................................................... 39 Table 4-5 Total P and available P in mg/kg. ............................................................................ 39 Table 4-6 Total concentrations of heavy metals (mg/kg) and critical concentration for polluted soils set up by the Swedish EPA (Naturvårdsverket 2006)...................................................... 39 Table 4-7 Heavy metal concentrations in the wastewater........................................................ 45 Table 4-8 Concentrations of heavy metals in plants (mg/kg) and limit concentrations for toxic effects on plants according to Saurbeck (Mengel & Kirkby 1987).......................................... 45
12

1 Introduction Nicaragua is one of the poorest countries in Latin America and was ravaged by civil war throughout the 1980s. The political situation stabilized during the 1990s but attempts to rebuild the country’s economy met a severe setback in the form of Hurricane Mitch in 1998. Social and economic underdevelopment as well as corruption is still very evident. Nicaragua traditionally depends much on agricultural products, but in the past decade foreign companies have started to invest in new industries, and the textile industry has become one of the most important employers in the country. These industries are often established within a Free Trade Zone (Zona Franca) with beneficial tax regulations. However, the Zona Franca does not allow space for the government to introduce stringent regulations to protect the environment. Without proper management, textile industries may have a great impact on the environment. The processes involved are very water consuming and the large quantities of wastewater often contain high levels of toxic substances. Zona Franca Industrial Las Mercedes, on the outskirts of the capital Managua, employs 35 000 people in textile industries. It is identified as a potential threat to the already damaged groundwater basin and the heavily polluted Lake Managua. The wastewater, known as the “blue water” from the jeans washing processes, has caused environmental damage in the surroundings on its way to Lake Managua. Stunted crop growth and destroyed cultivations due to inundations of the wastewater show that there are reasons to expect high levels of heavy metals or other pollutants in the soils affected by the wastewater. New Free Trade Zones with textile industries are established every year throughout Nicaragua. To avoid an irreversible environmental degradation of Nicaragua’s natural resources and to protect human health, it is important to examine their environmental impacts and to enforce effective environmental control.
1.1 Aims and Objectives The aim of this study was to examine how the environment and the locals are affected by the wastewater from the Las Mercedes Free Trade Zone (ZFILM). Focus was on determining whether or not the soils adjacent to the wastewater channel and the crops cultivated there contain levels of heavy metals that can be hazardous for health and/or the environment and on trying to explain the stunted growth of crops and the deaths of livestock in the area.
1.1.1 Specific objectives 1. Identify direct environmental and economic impacts from ZFILM and the wastewater
to the local society 2. Determine the distribution of heavy metals in the soil 3. Determine the levels of heavy metals in crops 4. Determine the wastewater impact on soil fertility 5. Determine wastewater impact on microbial activity in the soil 6. Determine levels of toxic substances in the wastewater, e. g. heavy metals, phenols
and detergents 7. Establish a GIS-database constituting geographical information of the area, sampling
sites positioning and analytical data
13

2 Background
2.1 Study site
2.1.1 Location The study site is located at the north-eastern outskirts of Managua, Nicaragua between the southern shores of Lago Xólotlan (Lake Managua) and ZFILM (Zona Franca Industrial Las Mercedes), as shown in Figure 2-1. The lake is at 38.3 m above sea level and the flat study area raises maximally a few metres above the lake.
Figure 2-1 Location of the study site.
2.1.2 Climate data The area is used for cultivation and stock farming by local small scale farmers. The climate is hot and sub-humid with rain in summer; AW according to Köppen. Annual precipitation is 1119.8 mm, most of which falls during the rainy season (May-October). Average monthly temperature varies between 25.8 ºC and 28.9 ºC and relative humidity averages 74 % (INITER 2006). A summary of the climate data is found in Figure 2-2. Occasionally major hurricanes cause extensive rainfall in the area. During the hurricane Mitch in October 1998 a major part of the study area was inundated and Lake Managua rose almost 4 metres, causing the shore to move about 150 metres. The water level did not decrease to normal levels until the year 2003 (Briones et al. n d).
14

Average precipitation and temperature in Managua
0
50
100
150
200
250
J F M A M J J A S O N D
month
mm
2424,52525,52626,52727,52828,52929,5
ºC
PrecipitationTemperature
Figure 2-2 Average precipitation (mm) and temperature (ºC) in Managua.
2.1.3 Soil types The soil in the study area can be divided into two different types according to the USDA classification carried out 1972 (Parsons Corporation et al. 1972). The soil in the southern part belongs to the La Calera series. The soil order is Mollisol with suborder Ustoll. Great group is Haplaquoll and subgroup is Typic Haplaquoll. Family: Fine Loamy, montmorillonitic. Mollisols are among the most productive and fertile soils, although some fertilization is generally required (Brady & Weil 1996). La Calera soils, however, consist of poorly drained, black, shallow, calcareous soils that contain salts and are high in exchangeable sodium. They are slightly too strongly saline. They are derived from lacustrine and alluvial sediments. The soil in the northern part flanking Lake Managua is part of the Managua series, derived from alluvial sediments from Lake Managua and differs slightly from that of the La Calera.
2.2 Environmental impacts of textile industries. The textile industry requires large quantities of water and discharge large volumes of waste in comparison to many other industries. For this reason its impact on its surroundings is important to consider. Environmental impact is common and as it likely will influence the people and nature nearby, regulations and control programs are urgent measures. The textile processing stages are many and each requires its proper waste management. They can be referred to as fibre production, fibre processing and spinning, yarn preparation, fabric production, bleaching, dyeing, printing and finishing (World Bank 1998). The wastewater discharged from textile industries is typically alkaline, has high levels of biodegradable organic matter and contains volatile organic compounds (VOCs). The latter originate mainly from the textile finishing, drying process and solvent use (World Bank 1998). There are also generally concentrations of oil, solids, and toxic organics like phenols from dying and finishing as well as halogenated organics from bleaching. Most of these parameters are not to be analysed within this project due to a former investigation carried out at ZFILM. It is more important to focus on additional contaminators which can possibly explain stunted growth and deaths of livestock in the area. Another possible pollutant from textile industries is heavy metals, mainly originating from the dyeing process. The main problem with the compounds used for colouring is the fact that they are often highly toxic and carcinogenic (Slater 2003). Copper, chromium, nickel and
15

lead are common inorganic pigments and are for instance elements found in textile wastewater (Slater, 2003; World Bank, 1998). Even though textile industries at ZFILM import tinted fabrics, they wash and bleach jeans as a step in finishing. In this process rejected dyes from former process stages are released which gives the wastewater its distinct blue colour. Preservative chemicals like arsenic and mercury based pesticides may also be released through washing. Referencing to World Bank guideline values (World Bank 1998) and Nicaraguan law (Decree 33-95) other heavy metals such as cobalt, zinc and nickel might also be present in textile process water. Air emission from textile industries are also common, e.g. acid vapours, odours, dust and boiler exhausts. Cleaning and production stages do also result in sludge from tanks and spent process chemicals, which needs its proper management (World Bank 1998) Lack of information of chemicals used in the past and today makes it reasonable to think that other heavy metals can be connected to ZFILM. Dyes used 15 years ago were surely under fewer jurisdictions than today. This is important to consider as soils, sediments and animals are long-term accumulators of heavy metals and can therefore reflect chemical history use.
2.3 Free trade zones and ZFILM
2.3.1 Zona Francas The free trade zones of Nicaragua, so called Zona Francas, were introduced by the government in 1976 as a way of attracting foreign investment. The leaders were struggling with high unemployment and were hoping that beneficial labour and export laws would make way for foreign industries. However, the first operating industries hardly saw daylight. The Sandinistas, that were about to govern the country for the coming decade, did not agree with the free trade law and soon the new American garment industries were closed and moved to other countries. In this era, the Sandinista government had to face a series of political and social conflicts and before long the country was dragged down by civil war and instability. The 90’s started up with elections following new leadership. And as soon as the country had emerged from the war the Zona Francas were reintroduced. The growth of the free trade zones was exceptionally rapid and in two years time the export value from the industries was 3 million dollars. Today there are 25 Zona Francas in Nicaragua. Together they create 78 000 work opportunities distributed among around 100 companies. They also stand for a large part of the Nicaraguan export with a total export value for 2006 estimated to 850 million dollars (La Prensa 26 September 2006).
2.3.2 ZFILM The state owned Zona Franca Industrial Las Mercedes (ZFILM) in the outskirts of Managua is by far the largest and most important free trade zone in Nicaragua. The zone is situated near the international airport of Managua at Carretera Norte km 8 and employs near 35.000 people (CZF 2006). The 22 companies there are all but one involved in garment manufacturing. The largest industries, e.g. Henry Garment, Chih Hsing Garments and Nien Hsing International, are denim factories which manufacture process stages which simply can be referred to as sewing, washing and drying (Simonsson & Dagerskog, 2002). The washing is by far the most water consuming process at ZFILM and therefore contributes to most of the wastewater in the zone. The companies operating in ZFILM 2006 are listed in Appendix II.
16

Each of the mentioned industries also has their own treatment plant in operation since 2004, which outlet is connected to the common sewer system. The latter is separated into domestic and industrial wastewater and leaves the ZFILM through sub-terrain tubes surfacing 1.6 km north of the zone. Here the domestic wastewater is treated through oxidation dams and then intersects with the textile industrial water. For a better overview of the study site, see Appendix I.
2.3.3 Aqua Azul The wastewater leaving the enclosed oxidation area (fenced and guarded since April 2006) is by locals referred to as “Agua Azul” (the blue water). Its distinct blue colour is an odd contribution to the surrounding environment and connects to an existing river near the oxidation dams with Lake Managua as the final recipient 2 km further north. According to people living near the channel the wastewater has been blue since the reintroduction of ZFILM in 1992 and has in many ways been disastrous to them and their livelihood (Morán; Silva; Cruz 2006, pers. comm.) Many can also testify that the wastewater has been far more contaminated (bluer) in the past, something that former studies (Simonsson & Dagerskog 2001; Skoog 2005) confirm. The latter of these suggests that the treatment plants of the larger textile industries should be subject to investigation. These are under long periods inefficient or are not even operating. Further sources do confirm that the treatment plants were malfunctioning in the past. However, a new control program initiated by MARENA (Ministry of Environment and Natural Resources) seem to have an effect on the wastewater and the management of the industries has shown a greater will to cooperate (Palacio; Perez 2006, pers. comm.). MARENA has been able to fine industries that do not comply with the norms. However, MARENA is seen as an administrative authority and relatively powerless. Economic interests and other governmental institutions with higher status are given priority, which undermines effective environmental control. The authors’ first encounter with Agua Azul was made in September 2006. At this time the wastewater was typically blue. However, during the following months its tint diminished. Staff at UNA and local farmers suggest that this has to do with the authors’ presence and that the wastewater will go back to blue once they leave (Morán; Hernandez; Esmelda 2006, pers. comm.). Problems caused by Agua Azul are many, and in order to identify them qualitative interviews were conducted with affected farmers and staff at UNA, ZFILM and MARENA. The two following problem areas were distinguished:
1. Shortage of clean water
With the introduction of ZFILM big dwells were dug to be able to provide the garment industries with water. This interference caused heavy damage to many farmers when their irrigating channels went dry and the ground water level in their dwells was reduced. When farmers tried to use the Agua Azul as irrigation water, the plants immediately dried out and died. Sick cattle is also an extensive problem. As there is no protection from the exposed channel and the pasture surrounding it, livestock have been drinking the water and ended up sick. There are even cases of death (Morán; Silva 2006, pers. comm.). The establishment of ZFILM has also affected tourism and recreational activity near the study site. A popular river that passed just north of UNA (Universidad Nacional Agraria) with rich fauna, including crocodiles, and swimming pools supplied by natural springs has now dried out, forcing the recreation area to shut down.
17

2. Inundation of wastewater channel
Problems related to Agua Azul are also caused by an under-dimensioned wastewater channel. This problem occurs during rains. The river connecting to Agua Azul close to the oxidation area brings rubbish from the ZFILM-area when it is fed by rain water. Plastic bottles, tyres and other floating objects, mainly originating from ZFILM employees and industries, clog the Agua Azul when arriving and hence inundate its surroundings. The extent of this problem is mainly related to the rainy season characteristics (generally inundation 3-5 times a year) and the study site’s variation in topography. Proofs of the fierceness of the inundations are many, e.g. big tractor tyres lying relatively far from the channel, littering is very obvious and farmers strive to build protecting walls. The fields that stretch along the wastewater channel are today mainly cultivated by banana and maize. However, before the ZFILM was introduced, the crops used were far more diverse. Farmers cultivated melon, tomato, union, cucumber, pepper etc., i.e. crops more advantageous economically at the market. But due to Agua Azul inundation, these crops can not be used anymore. As the blue water inundates the fields, low lying crops die instantly. The long term effects of the inundations are identified as follows:
• Farmers have ended up without yield. Small margins make them depend upon profit from the harvest to be able to budget for the coming season. The drawback can therefore push them into a severe economical situation.
• Soil might degrade as contaminants are accumulated. A decomposed aggregate
structure has been observed by the authors. Farmers state that crops on fields that often inundate grow less.
• The inundation might have contaminated wells. Fresh and drinkable water once taken
from wells near Agua Azul are now undrinkable. This forces farmers to depend upon potable water. As the latter is restricted, animals are given the contaminated water, the effect of which so far is unknown. However, former studies state that the contamination of the wells is not alarming. The investigation carried out by Skoog (2005) does not show critical levels of contaminants, but state the water to be highly saline. However, there are more parameters that can be investigated.
18

Figure 2-3 Waste originating from the area around ZFILM flashes down through the wastewater channel during the rainy period and causes inundations in the surrounding cultivations. Photo: Linus Hagberg 16 Nov. 2006.
Figure 2-4 A banana field inundated by Aqua Azul. Photo: Linus Hagberg 16 Nov. 2006.
19
2.4 Former studies
2.4.1 Potential contamination risk from ZFILM In 2000 an extensive investigation was carried out in order to identify potential contamination of aquifers in Managua. The Ministry of Environment and Natural resources (MARENA) together with the Royal Institute of Technology in Stockholm came to the conclusion that ZFILM constituted a significant risk. Four industries inside ZFILM were identified as moderate contaminators and three as severe threats. The pollutants correlated with high risk were: acids, aniline, chlorine, hypochlorite, chromium and other inorganic compounds from the jeans manufacture (MARENA – KTH 2000).
2.4.2 Characterization of Agua Azul In 2001 an investigation was carried out by Dagerskog & Simonson (2001) in order to characterize the wastewater and estimate the total wastewater load from ZFILM to Lake Managua. Their conclusion is that eutrophication and sedimentation of the lake is relatively small, but local impact on ecosystems can be significant as textile fibres settle quickly and cover the lake bottom like a lid. Heavy metal pollution by zinc and chromium were examined and were well below Nicaraguan limits. However, according to Canadian guideline values the heavy metal concentrations can constitute a risk to some organisms in the water (Dagerskog & Simonson 2001). Further investigation was carried out in 2003 with the aim to evaluate the contamination load of different industries inside ZFILM. García & Hernández (2005) conclude that all but one parameter at least once were above the permissible limits given by MARENA during the study. However, median concentrations of chromium and zinc were found below limits. Other levels, such as total solids and suspended solids, surpassed the limits according to the authors, and the results indicate that the oxidation dams related to the industries are distinctly under-dimensioned (García & Hernández 2005). One year later a similar study (Skoog 2005) was carried out but with more focus on the wastewater salinity and potential contamination of wells lying near the wastewater channel. The author concluded that COD and BOD5 are within norms put up by MARENA, but that there is a risk of contamination of wells. Well water is high-saline or very high-saline according to one of the classifications. If this is due to Agua Azul encroachment could not be proved in his study. No heavy metal investigation was carried out. At this moment a study of sludge originated from the washing industries inside ZFILM is conducted. As guideline values for sludge are hard to find, much of the results are hard to interpret. However, the results indicate relatively high concentrations of chromium and traces of copper, zinc and nickel (Esmelda 2006, pers. comm.).
2.5 Laws and regulations regarding textile industries
Zona Francas
The Zona Francas in Nicaragua are liable under special regulations. The Industry Free Trade Export Law (Decreto No. 46-91 1991) states that the Zona Francas are sanctioned by liberal export and trade rules. However, in no other matter are the zones relived from other regulations such as labour and environmental laws.
20

The environment and waste discharge
The general environmental law of Nicaragua (Law No. 217), regulated in Decree No. 9-96, was passed by the National Assembly in 1997 as an instrument to protect the environment and natural resources (Environmental law 1997). The fourth chapter in Section I treats environmental quality and states the government’s responsibility: “the state has to guarantee the prevention of unfavourable environmental factors that affect the health and quality of life for the population” (Environmental Law 1997). Furthermore, the fourth chapter regulates contamination of soil, water and atmosphere and strongly prohibits dumping of contaminated substances or waste to soil and water resources. Direct regulations on industry wastewater, including the textile sector, are moreover given in the Decree No. 33-95 (Decreto No. 33-95 2000). Article 40 gives the maximum allowed discharge from textile industries, directly or indirectly. The limits are shown in Table 2-1 below. Table 2-1 Maximum permitted daily average limits for discharged wastewater from textile industries (Decreto No.33-95 2000) MaximumpH 6-9 Total suspended solids (mg/l) 100 Sedimented soil (mg/l) 1.0 BOD5(mg/l) 100 COD ( mg/l) 250 Chromium, total (mg/l) 1 Chromium, hexavalent (mg/l) 0.1 Sulphide (mg/l) 0.2 Fat and oil (mg/l 20 Sulphite (mg / l) 3 Zinc (mg/l) 2 The Decree No. 33-96 also states that responsibility lies at each industry management to take measures to comply with these norms. They are also obliged, in the case of textile industries, to present results to MARENA every three months (composite samples). Sanctions are regulated in Chapter VI.
2.6 Heavy metals The term heavy metals refers to metals with a density higher than 5 g/cm3 and most of them exist naturally in water, soils, sediments and organisms. Arsenic is normally also included in this group due to its similar behaviour patterns and environmental impact, even though its density is lower. The heavy metal concentrations in soils are governed by the mineralogy at the site and the weathering ability of these minerals. Other influencing parameters are pH, clay, organic material and competition between other metal ions (Alloway 1995). Generally, availability to plants decreases as pH rises and as clay and humus content increases. All kinds of human activity also contribute to the spreading of heavy metals into air, water and soil. Some heavy metals such as nickel and chromium are essential to living organisms but not to plants. Others such as lead and mercury do not have any known effect and can be detrimental for plants even in very low concentrations. These are by the Swedish Environmental Protection Agency (EPA) classified as inorganic environmental hazards
21

(Naturvårdsverket 2000) and much effort has been put into understanding their effect on nature. Many heavy metals can be stored in living tissues and accumulate through the food chain. Heavy metal soil contamination does not generally cause immediate effects on the ecosystem. However, eventually pollutants are likely to get bio-available or to leave the soil through leaching. The latter can contribute to pollution of downstream water systems. The risk for leaching increases, if: - the soil has received a heavy load of contaminating metals for a long time so that the adsorption sites become nearly saturated, e.g. on shooting ranges. - the soil has a comparably low concentration of adsorbing particle surfaces, as for example coarse-textured soils without a mor layer, and coarse filling materials (Gustafson et al. 2005).
2.6.1 Lead Lead is a major chemical pollutant of the environment and is highly toxic to humans. 80 % of the total lead in the atmosphere originates from petrol combustion. Another source is batteries. Lead is found in two oxidation states in the soil, Pb2+ and Pb4+, where the former normally forms organic/inorganic compounds and the latter is stable in the Pb4+ state. The Pb2+ has the same metabolic behaviour as calcium and can therefore displace it. The organic compounds are most toxic due to their high mobility. Even as low levels as 10 mg/kg have detrimental impact on plant growth (Mengel & Kirkby 2001). The enrichment of lead in soil is an irreversible process; hence lead concentration can be high even though enrichment has declined. Accumulation normally occurs in clay fractions through ionic sorption or in humus substances. Background values for lead in uncontaminated soils are around 20 mg/kg and higher concentrations may restrict plant growth (Alloway 1995). EU guideline values for lead contamination are 0.1-0.2 mg/kg, depending on type of consumable crop (EG 2001) Human uptake of lead normally occurs through inhalation or through diet. Lead is harmful for the kidney, the intestines, and the cardiovascular system and is transported through the blood.
2.6.2 Chromium Chromium does not play any essential role in plants, but can have a positive effect on growth in low concentrations. However, soils do naturally contain sufficient levels of chromium and an enrichment of the metal will have negative impact on the plant. Chromium is generally present in soil in different chemical compounds and has many oxidation states. The most common and stable form is Cr3+. It is often found in the mineral structure of chromite or in strong complexes with organic compounds. The solubility of Cr3+ is relatively low above pH 4 and it precipitates at pH 5.5. Most toxic is Cr6+, which is mobile in both acid and alkaline soils and adsorbs readily to clay particles. The availability of Cr6+
increases with high pH and thereby its toxicity. Total chromium generally exists in the soil at concentrations between 15 to 100 mg/kg soil, increasing with clay content. Background values for chromium in plants are around 0.23 mg/kg and regardless of soil concentration they seldom exceed 1 mg/kg (Alloway 1995).
22

The human exposure of chromium is likely to be through food intake. However, most plants are likely to die before levels get toxic to consumers. Chromium is carcinogenic for humans in high doses and chromium allergy is not rare in cement and welding industry (Brady & Weil 1996). Chromium is commonly used as protection against corrosion of metals and is also used in alloys for textile industry processes like printing and dyeing
2.6.3 Copper Copper is a micronutrient essential for plants, humans and animals as it has a role in many vital biological functions and as a compound in amino acids and proteins. A large fraction of copper in soil is bound to sulphides, sulphates, carbonates and oxides and also forms strong complexes with soil organic matter. Copper is therefore one of the least mobile trace metals. The availability of copper is related to pH, soil type and parent material. The average soil concentration of copper is reported as 30 mg/kg. Since plant accumulation differs strongly between species it is hard to specify deficiency and toxic limits. Concentrations above 30 mg/kg in plants are probably a consequence of contamination. Due to the low mobility of copper, accumulation will mostly occur in the roots. Copper is together with cadmium considered as the most toxic heavy metal to soil microorganisms (Alloway 1995). High soil concentrations are often a result of application of copper containing fertilizers, sewage sludge and other wastes, as well as fungicides, bactericides or manures from swine and poultry (Alloway 1995). Copper is also used in water pipes and as a pigment (Slater 2003; World Bank 1998). High human intake of copper leads to acute toxicity. Kidney, liver and spleen get damaged through ingestion. Inhalation leads to muscle and joint pain, coughs and fever.
2.6.4 Zinc Zinc is an essential micronutrient to plants and animals, and deficiency of the metal is relatively common in soils. It is present as free Zn2+ or bound to the lattice structure of primary and secondary minerals or adsorbs to organic matter. Zn2+ radius is very similar to those of Fe2+ and Mg2+, which makes displacement of these possible. Redox potential, pH, and the amount of exchange sites are factors determining in which state zinc is present. Zinc availability increases drastically with low pH (Alloway 1995). Zinc uptake in plants is a rather common phenomenon and as zinc is phototoxic the effects will most likely be correlated with reduced crop yield and soil fertility degradation. Zinc and cadmium are the heavy metals most readily accumulated in plants due to their high mobility and bio-availability. Common soil concentrations of zinc are in the order of 10-300 mg/kg, with a global average of 50 mg/kg. Toxic effects on plants may occur with zinc concentrations above 400 mg/kg dry matter (in mature leaf) (Alloway 1995). Zinc is used commercially in brass, pigments, manufacturing of batteries and cosmetic products (Zink i miljön 1988).
2.6.5 Nickel Nickel has no known biological function but can, in low soil concentrations, have a good impact on plant growth. The metal is globally present in soils at concentrations around 34 mg/kg which is generally sufficient to fulfil its catalytic function (Alloway 1995).
23

The toxic effect of nickel is correlated with its ability to displace essential elements from physiological important centres. Acute toxicity in plants gives rise to chlorose and human exposure can cause irritation, itching and even wounds. Concentrations in plants growing in non-contaminated soils are generally in the range of 0.1 – 5 mg/kg. Nickel has many anthropogenic sources and therefore it constitutes a threat to the environment. 80 % of all nickel in the atmosphere comes from the use of fossil fuels and long term application of sewage sludge and nickel-containing fertilizers are particularly soil contaminating (Mengel & Kirkby 2001).
2.6.6 Cadmium Cadmium has no known essential function in plants or animals and is toxic to both. It is present in soils at very low levels and has many characteristics similar to zinc. This makes it possible for cadmium to mimic the behaviour of zinc and disturb its uptake and metabolic functions (Mengel & Kirkby 2001). Even though acute toxicity is rare to humans, chronic health effects occur when cadmium accumulates in body organs. The toxicity lies in cadmiums affinity for so called thiol grouping in enzymes and other proteins. Cadmium is present in the soil solution as highly mobile Cd2+ and uptake in consumable crops can be critical. Plants can handle excessive cadmium without showing any signs of stress and can therefore contain toxic levels for humans (Alloway 1995). EU has put up guideline values for cadmium in crops. For most crops critical concentrations are between 0.1-0.2 mg/kg (EG 2001). Cadmium pollution of the environment has been relatively significant in the industry as it is used in pigments, batteries, fertilizers, and alloys as well as added to the environment through metal refine, fossil fuel combustion and incineration (Alloway 1995).
2.6.7 Cobalt Cobalt is essential to animals and microorganisms and deficiency is a more common problem than excess. Similar to Fe, Mn, Zn and Cu, cobalt is bound to organic molecules as chelate and has the ability to displace cations from important binding sites (Brady & Weil 1996; Mengel & Kirkby 2001). Soil concentrations are in the range of 1 – 40 mg/kg but may reach levels of 100-200 mg/kg in soils of volcanic origin. The bio-availability of cobalt is generally low in the soil solution and decreases with high pH. Cobalt toxicity is low to all species. Important microorganisms for nitrogen fixation need good supply of cobalt. Therefore cobalt is a necessity for nitrogen uptake in plants (Alloway 1995). To humans it is also important as it constitutes 4.4 % of vitamin B-12, necessary for the production of red blood cells in the bone marrow. Cobalt is used for manufacture of special steel and has traditionally been used in pigments. Cobalt is also used as a catalyser in sulphur removal from oil.
2.6.8 Mercury Mercury belongs to those heavy metals which can have severe effects on humans and the environment. It has no known biological function and almost all chemical compounds of Hg are toxic even in very low concentrations (Alloway 1995). As mercury phototoxicity is small, it
24

is relatively easily accumulated in plants and can reach levels not acceptable for human intake (Mengel & Kirkby 2001). Mercury in gaseous state can transit to ions, bind to particles and water drops and deposit in the soil through precipitation. In the soil, mercury readily forms highly mobile complexes with organic compounds which increase bio-availability and the risk for leaching to nearest water course. Hg2+ is also one of the metal ions that appear to be highly toxic to soil microorganisms (Alloway 1995) Even though principal uses of Hg have changed since the discovery of mercury’s heavy environmental impact, it is still used in a number of activities. The largest source is chlorine alkali and metal industries, incineration and coal combustion. Soil contamination generally originates from air deposition, fertilizers and sewage sludge use.
2.6.9 Arsenic Arsenic is a common pollutant and notoriously known for its ability to form toxic compounds. It differs from many other heavy metals in the sense that the organic compounds are less toxic than the inorganic ones. Arsenic is not essential for plants or animals and does accumulate in plants, but to a relatively small extent (Alloway 1995). Even though the presence of toxic compounds is relatively common, there is a big difference in how they affect the environment. Most of the arsenic compounds are of no direct harm. Arsenic is present in soils in the range of 1-40 mg/kg and does naturally originate from mineralization. Arsenate, a redox form of arsenic, has similar adsorption properties to phosphate and therefore readily forms complexes with Fe oxides. However, the other redox form, arsenite, is bound more weakly, especially at low pH, and will therefore possibly leach to ground waters (Gustafsson e t al. 2005). Excessive amounts of arsenic are toxic but the true reason for that is not known. However, studies indicate that arsenic replaces the essential nutrient phosphate, which results in disturbance of photosynthesis and energy transfer processes. Anthropogenic sources are arsenic-based pesticides and herbicides, wood preservatives, mining and industrial activities (Alloway 1995).
2.6.10 Norms and guideline values
Soil contamination
The Swedish EPA has put up limit values regarding heavy metals for polluted soils (Naturvårdsverket 2006). They are based on Swedish conditions, which are totally different from Nicaraguan. However, these values were found useful as metal resistance of plant and soil fauna are likely to be similar. Further limit values have been put up by Saurbeck for German soils (Mengel & Kirkby 2001). The limit values are summarized in Table 2-2.
25

Table 2-2 Critical concentrations of various heavy metals in soils (mg / kg air dry soil). Higher levels are toxic. Swedish EPA Saurbeck Arsenic 15 - Lead 80 100 Cadmium 0,4 3 Cobalt 30 - Copper 100 100 Chromium (no IV) 120 100 Chromium VI 5 - Mercury 1 2 Nickel 35 50 Zinc 350 300
Plant contamination
There are limit values for heavy metal concentrations in plants put up by EU (EG 2001) regarding cadmium and lead, but additional values for consumable products studied in this report, e.g. banana, maize and basil, are hard to find. However, Swedish EPA (Naturvårdsverket 2006) and Saurbeck (Mengel & Kirkby 2001) have formulated general limit values for heavy metals in plants. These are showed in Table 2-3. Table 2-3 Critical concentration of various heavy metals in plants (mg/kg dry matter). Saurbeck (1982) EU (food) Swedish EPACadmium 5 -10 0,1 – 0,2 1 Mercury 2 - 5 - 1 Cobalt 20 - 30 - - Chromium 1 - 2 - - Copper 15 - 20 - 50 Nickel 20 - 30 - 30 Lead 10 - 20 0,1-0,2 50 Zinc 150 - 200 - 150
Water contamination
Wastewater discharge from Nicaraguan textile industries is regulated by national law. Decree 33-95 states limit values for wastewater regarding different parameters, including chromium and zinc. Further limit values for textile industries have been set up by the World Bank (1998). These include highest recommended concentrations in process wastewater for additional heavy metals such as nickel and copper. The limit values with relevance to this study are summarized in Table 2-4.
26

Table 2-4 Limit values for heavy metals in wastewater from textile industries, according to Nicaraguan law and the World Bank. Nicaraguan regulation World BankpH 6 - 9 6 – 9 Chromium (total) 1 0,5 Chromium (VI) 0,1 - Zinc 2 2 Nickel - 0,5 Copper - 0,5 Cobalt - 0,5
2.7 Soil composition and structure A soil is typically composed of about 45 percent mineral, 25 percent air, 25 percent water, and 5 percent organic matter (Whiting et al. 2005). Soil structure describes how the basic soil materials (sand, silt and clay) by chemical and biological processes are arranged into soil aggregates and the pore spaces between them (ABSA 2006). Primary factors that influence soil structure are:
• Texture (the proportions of sand, silt and clay) • Activity of soil mycorrhizae, earthworms and other soil microorganisms. • Organic matter content. • Soil moisture (year round). • The freezing/thawing cycle. • Cultivation – Tilling a soil has a direct impact on structure because it breaks apart
aggregates and collapses pore spaces. • Soil compaction
To provide the roots with sufficient water, air and growing space, a good soil structure with small soil aggregates which do not break down when wetted, with good pore spaces between the aggregates is needed. In the right conditions, soil particles will cluster together and become stabilized by organic matter, fungal hyphae, bacterium secretions and organo-metallic complexes. (ABSA 2006).
Structural decline may occur due to the presence of sodic soils, salinity, use of poor quality water or if soils are low in clay and organic matter (RPDC 2003) Soil hardening is due to a dispersion of soil particles. Sodium in abundance displaces calcium and magnesium, ions that normally saturate the soil and help maintain its structure. Sodium which has only one positive charge is unable to form the bridges between soil particles and, consequently, the soil structure deteriorates. To regain the soil structure, calcium must be added to the soil to displace the sodium, but that can be problematic (Cihacek 2006; Rengasamy & Olsson 1991). Structural problems are typical in tropical black soils which are high in montmorillonite clay, as is the case at the study site. In the wet season these soils swell and become sticky whereas in the dry season they dry out to such an extent that they may become rock-hard and crack. Despite the high nutrient status of these soils the poor structure limits their agricultural potentials because of the difficulty to cultivate them. Ca2+ has an important flocculating ability and contributes to the formation of stable aggregates with clay minerals and humic acids. In montmorillonitic soils Ca saturation should be in the order of 60-80% of the cation exchange capacity (CEC) (Mengel & Kirkby 1987).
27

Soil structure damage restricts plant performance through poor soil-water and soil-air relations and indicates reduced crop yields, worse water permeability and increased run-off and soil erosion (RPDC 2003).
2.8 Exchangeable cations and CEC Exchangeable cations refer to the positively charged ions which are loosely attached to the edge of negatively charged clay particles or organic matter in the soil. The cations include calcium (Ca2+), magnesium (Mg2+), potassium (K+), sodium (Na+), hydrogen (H+) and aluminium (Al3+). Concentrations of cations are expressed in centimoles of positive charge per kilogram of soil (cmolc/kg). In soils with high pH the concentrations of H+ and Al3+ are almost negligible.
2.8.1 CEC The total number of these positively charged ions is known as the cation exchange capacity (CEC). The CEC gives an indication of the number of sites where positive ions can attach and hence the higher the figure the greater the potential fertility of a soil. High proportion of clay increases the surface area of soil particles and therefore can attract more ions (Mengel & Kirkby 1987). Where CEC < 5 cmolc/kg the soil is considered inherently infertile (ABSA 2006). The exchangeable cations can also be expressed as percentages of CEC. The desirable ranges for them are difficult to determine scientifically. However, the cation ranges according to NSW (2006) and ABSA (2006) displayed in Table 2-5 below, can be seen as a rule of thumb. Table 2-5 Desirable cation ranges as % of CEC for intensive grazing and horticulture in clay loam - sandy loam soils according to ABSA (2006) and NSW (2006). NSW ABSA Calcium 65-80 60-80 Magnesium 10-15 10-20 Potassium 1-5 3-8 Sodium 0-1 <6
2.8.2 Desirable cation ratios The cations Ca2+, Mg2+, K+ and Na+ are essential nutrients for plants, although the latter is needed in much smaller amounts for most plants. Deficiency of Ca2+, Mg2+ or K+ leads to slow growth rate and there are visible symptoms at a more severe stage (Mengel & Kirkby 1987). Deficiency of Ca2+ is rare and in clayey soils the Mg2+ is normally present in sufficient amounts (Havlin et al. 2005). However, since they compete in the plant uptake there are recommended relative ratios of the cations for productive cultivation, known as nutrient ratios. These are K/Mg, Ca/Mg and K/(Ca + Mg). They indicate if there is an imbalance between Ca2+, Mg2+ and K+ in the soil. Demands and critical levels differ between plants. Too high levels of exchangeable Ca+ can lead to deficiency of magnesium in certain plants, that is if Ca/Mg > 7 (Havlin et al. 2005). High K+ levels may also interfere with magnesium uptake and the recommended K/Mg ratio is above 2 (Havlin et al. 2005). Fruits and vegetables are more sensitive for imbalances than cereals. ABSA (2006) recommends K/(Ca + Mg) < 0.7 for intensive grazing and horticulture.
28

High Na+ levels of more than 6% of CEC can lead to soil dispersion and/or sodicity (ABSA 2006). The recommended cation ratios are estimated from concentrations determined with the Al-method.
2.9 Salinity and sodicity Salt accumulation in the surface layer can occur naturally when rainfall is not sufficient to flush soluble salts out of the upper layer or when rising groundwater containing salts is near the soil surface (in low lying areas). High salt levels can also be correlated to salt deposits from old lake and ocean beds that become dissolved in the groundwater. Irrigation with salt containing water can also result in salt accumulation, especially if the internal soil drainage is poor. Soil salinity can increase to intolerable levels, as can the exchangeable sodium level. As indicated by Furn & Hultgren (2004) effluents from dyeing and bleaching textile industries often contain very high levels of salts that affect the groundwater in the surroundings. When the water then is used for irrigation, the soils become saline with detrimental effects on crop growth.
2.9.1 Effects of salt accumulation and high sodium levels Salt accumulation in soils results in a poor development in crop growth and both the yield and quality of crops become low (Mengel & Kirkby 1987). Sensitivity to saline soils differs widely among plant species. Fruit trees and many root vegetables as onion, carrot and potato are among the most sensitive crops to salty soils. Soybeans, cotton and wheat are more tolerant. The high concentrations of soluble salts in the soil affect the osmosis of the root cells. Due to loss of water the cells collapse. The ionic composition of the soil solution of salt affected soils is also often imbalanced in relation to normal plant growth requirements, showing low levels of Ca2+ and K+. Toxic concentrations of other ion species may occur, such as borate, and possibly bicarbonate, chloride, Na+ and Mg2+. If the sodium accumulation is severe the soil can become sodic. This can lead to extremely high pH values (> 7.5) and the dispersal of soil colloids that then plug the soil’s drainage pores, which prevents good drainage and soil air conditions. The high levels of sodium in sodic soils have a detrimental effect on plants in many ways, such as caustic influence due to the high pH and oxygen deficiency due to breakdown of soil structure (Brady & Weil 1996). As mentioned above Na+ levels greater than 6% of CEC can lead to soil dispersion and/or sodicity (ABSA 2006).
2.9.2 Measuring salinity and sodicity Soil salinity can be determined in laboratory by measuring the electrical conductivity (EC) of the soil solution. Salts that dissolve in the soil solution conduct electricity that can be measured in decisiemens per metre (dS/m). The exchangeable sodium percentage (ESP) identifies the degree to which the exchange complex is saturated with sodium: Exchangeable Na+ (cmolc/kg)
ESP = ______________________________________
CEC (cmolc/kg)
29

2.9.3 Saline, saline-sodic and sodic soils Using EC and ESP soils are classified as saline, saline-sodic and sodic as shown in Table 2-6. Table 2-6 EC and ESP ranges for saline, sodic and saline-sodic soils.
EC (dS/m) ESP (%) Saline > 2-4 < 15 Sodic < 4 > 15 Saline-Sodic > 4 > 15
Saline soils
A soil is considered saline if the EC value is more than 4 dS/m. However, some scientists recommend a lower limit at 2 dS/m as some fruits and vegetables are adversely affected with EC values below 4 dS/m. Critical level for beans is for instance 1 dS/m.
Sodic soils
Sodic soils have ESP above 15 % of CEC. Even though the EC value is below 4 dS/m plant growth is considerably disturbed by the adverse physical and chemical characteristics of sodic soils as described above.
Saline-sodic soils
A soil is classified as saline-sodic if EC > 4 dS/m and the ESP values are greater than 15 %. In saline-sodic soils crop growth can be adversely affected by both excess salts and high sodium levels. The soil structure collapsing effect of high sodium levels is, however, somewhat counterbalanced by the salts that help to hold aggregates together (Brady & Weil 1996).
2.10 Soil microorganisms A handful of soil is likely to contain billions of organisms, with a huge diversity of species. Macrofauna and mesofauna as earthworms, insects and mites are responsible for mechanical incorporation of organic residues into the soil and help forming a good soil structure. Microorganisms such as fungi, actinomycetes and bacteria are responsible for most breakdown of organic matter and cycling of nutrients in the soil. They supply the plants with important nutrients as nitrogen and phosphorous through organic decomposition and nitrogen fixation, and aid in the production of humus. Major factors influencing the types present and the growth of microorganisms are supplies of oxygen and moisture, temperature, pH, the amount and nature of the soil organic matter and the amount of exchangeable calcium present. Beneficial conditions for most microorganisms are moist, well-aired soils with high pH and calcium content, at temperatures of 20-40 ºC (Brady & Weil 1996).
2.10.1 Measuring microbial activity The activity of the soil microorganisms can be determined in an incubation experiment by measuring the microbial respiration of CO2. When a sample with meshed air-dried soil gets wetted and supplied with organic matter, the microorganisms get active and start to decompose the organic matter. The CO2 produced in the process can be trapped in sodium hydro-oxide solution and determined by titration with chloric acid. With constant conditions, the microbial activity of different soil samples can be compared.
30

2.10.2 Effects on microorganisms of heavy metals High concentrations of various heavy metals in soils have an inhibitory effect on microbial biomass growth and activity. This leads to reduced crop growth due to macronutrient deficiency in the plants. Especially nitrogen fixing bacteria have been shown sensitive to high heavy metal concentrations. The diversity of microorganisms may also get reduced. Some species develop tolerance and others die out under long-term heavy metal stress. This can also be detrimental for plant growth and soil fertility. Studies have shown a decreasing order of toxicity as being: Cu > Cd > Ni > Zn. Other studies have shown that Cd, Cr, Cu, Ni and Pb all inhibit organic decomposition, where Cu and Cd have the greatest inhibitory effect and Pb the least (Alloway 1995).
31

3 Materials and methods
3.1 Initial investigation An initial investigation was carried out during the first weeks to solicit opinions and to examine how the local farmers and the environment on the pathway of the wastewater channel are affected. This was done through excursions, qualitative conversation-interviews with farmers and by collecting information about former studies done in the area. Based on the initial investigation and financial restrictions the final specific objectives and sampling plans were determined.
3.2 Sampling All sampling was carried out by the authors during October 2006, which is within the rainy season in the area. Some sites were flooded with wastewater overflowing the channel at the time of sampling. At each sampling point, a site description including GPS positioning data and photo was recorded and stored in a GIS database.
3.2.1 Soil samples
Incubation experiment and soil characterization
In total 5 samples were taken for an incubation experiment and for comprehensive soil characterizations. 3 samples (Incub1, Incub 2 and Incub 3) were taken at sites that often get inundated by the wastewater, and 1 reference sample (Ref) was taken at a site not affected by the wastewater. Each sample consisted of 10 sub-samples taken within a 10×10 m square at the site. The sub-samples constitute the first 20 cm of the top soil and were collected with auger with a diameter of 5 cm and were put in a plastic bag. The sampling was carried out on the 4th of October. The sampling sites are illustrated in Figure 3-1.
32
Figure 3-1 Map of the sampling sites for soil characterization and incubation, plant analysis and wastewater analysis.
About the reference sample
Originally 2 reference samples, i. e. Ref 1 and Ref 2, was collected and used in incubation test and analysis. They were chosen as reference samples since they were collected at sites not likely to be affected by the wastewater. Ref 1, which was collected upstream directly adjacent to the study site, is subject to similar land use and belongs to the same soil type area as the other samples. Ref 2 on the other hand was collected about 2 km from the study site to ensure that it was not object to any latent impact of the wastewater, e.g. through groundwater movement. This sample showed to be inappropriate for comparisons due to a different soil type with distinct properties. Ref 2 was therefore not taken into account in the evaluation of the results. Throughout the report only Ref 1 is therefore taken into account, and is simply referred to as Ref.
Heavy metal distribution
In the second step, in total 20 soil samples, of which 2 can be considered as reference samples, were taken for determination of heavy metal distribution. Sampling sites were decided strategically to cover as much of the study area as possible obliged to a restricted number of samples. This was done by means of the GIS software package ArcGIS and a GPS positioning unit. One of the soil samples and one of the reference samples correspond to samples taken in step one. Each sample consists of 5 sub-samples taken within a 5×5 m square at the site. The sub-samples constitute the first 20 cm of the top soil and were collected with auger with a diameter of 5 cm and were put in a plastic bag. The sampling was carried out on the 24th of October. The sampling sites are illustrated in Figure 3-2.
33

Figure 3-2 Map of the sampling sites for heavy metal distribution.
3.2.2 Plant samples In total 5 plant samples were collected from fields close to the channel that are often flooded by the wastewater:
• 2 samples of banana (Musa sp.) from different fields. Each sample consisted of two bananas (almost ripe) from the same tree.
• 2 samples of maize (Zea mays) from different fields. Each sample consisted of a few maize cobs (still not ripe) collected from different plants in the field.
• 1 sample of basil (Ocimum basilicum) collected from different plants in one field.
All samples were put in paper bags. The sampling was carried out on the 25th of October. The sampling sites are illustrated in Figure 3-1 above.
3.2.3 Wastewater sample One water sample (ca 3 L) was collected directly from the wastewater (Agua Azul) and consists of sub-samples taken every hour from 10 am to 4 pm. Each sub-sample was collected with a plastic cup and then poured into a plastic container. The container was stored in a cool box with ice during field work. The sampling was carried out 18th of October. The sampling site is illustrated in Figure 3-1.
34
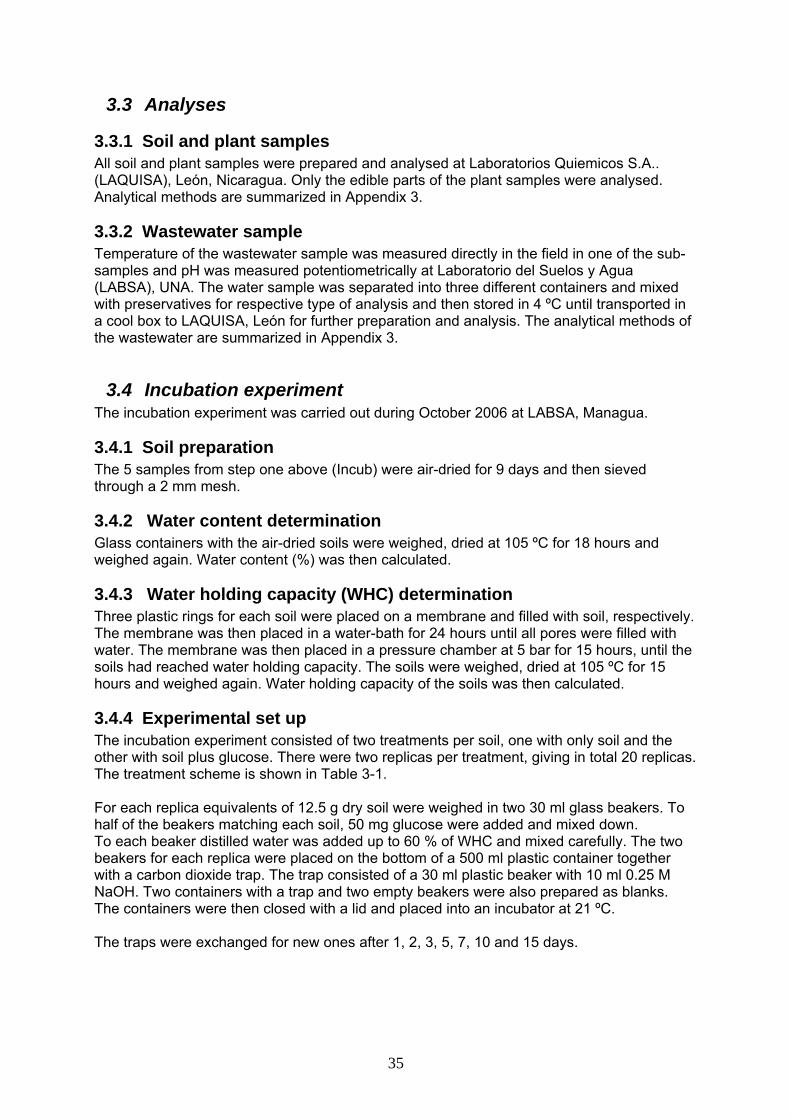
3.3 Analyses
3.3.1 Soil and plant samples All soil and plant samples were prepared and analysed at Laboratorios Quiemicos S.A.. (LAQUISA), León, Nicaragua. Only the edible parts of the plant samples were analysed. Analytical methods are summarized in Appendix 3.
3.3.2 Wastewater sample Temperature of the wastewater sample was measured directly in the field in one of the sub-samples and pH was measured potentiometrically at Laboratorio del Suelos y Agua (LABSA), UNA. The water sample was separated into three different containers and mixed with preservatives for respective type of analysis and then stored in 4 ºC until transported in a cool box to LAQUISA, León for further preparation and analysis. The analytical methods of the wastewater are summarized in Appendix 3.
3.4 Incubation experiment The incubation experiment was carried out during October 2006 at LABSA, Managua.
3.4.1 Soil preparation The 5 samples from step one above (Incub) were air-dried for 9 days and then sieved through a 2 mm mesh.
3.4.2 Water content determination Glass containers with the air-dried soils were weighed, dried at 105 ºC for 18 hours and weighed again. Water content (%) was then calculated.
3.4.3 Water holding capacity (WHC) determination Three plastic rings for each soil were placed on a membrane and filled with soil, respectively. The membrane was then placed in a water-bath for 24 hours until all pores were filled with water. The membrane was then placed in a pressure chamber at 5 bar for 15 hours, until the soils had reached water holding capacity. The soils were weighed, dried at 105 ºC for 15 hours and weighed again. Water holding capacity of the soils was then calculated.
3.4.4 Experimental set up The incubation experiment consisted of two treatments per soil, one with only soil and the other with soil plus glucose. There were two replicas per treatment, giving in total 20 replicas. The treatment scheme is shown in Table 3-1. For each replica equivalents of 12.5 g dry soil were weighed in two 30 ml glass beakers. To half of the beakers matching each soil, 50 mg glucose were added and mixed down. To each beaker distilled water was added up to 60 % of WHC and mixed carefully. The two beakers for each replica were placed on the bottom of a 500 ml plastic container together with a carbon dioxide trap. The trap consisted of a 30 ml plastic beaker with 10 ml 0.25 M NaOH. Two containers with a trap and two empty beakers were also prepared as blanks. The containers were then closed with a lid and placed into an incubator at 21 ºC. The traps were exchanged for new ones after 1, 2, 3, 5, 7, 10 and 15 days.
35

Table 3-1 Treatment scheme for the incubation experiment. Incub 1 Incub 2 Incub 3 Ref 1 Ref 2 Total
replicas Only soil 2 2 2 2 2 10 Soil + 100 mg glucose 2 2 2 2 2 10
Total replicas 4 4 4 4 4 20
3.4.5 Determination of microbial respiration From each carbon dioxide trap (with 0.25 M NaOH) 2 ml were put into a 30 ml glass beaker. 2 ml of 3 N BaCl2 and two drops of phenolphthalein were added and the solution was then titrated with 0.05 M HCl. Two titrations per trap were done and the average was calculated. The respiration (mg C) was calculated with the formula:
nV
VMMWHClHClmgC HClcsampleblank
××××−
=2
1)( (1)
where mgC = microbial respiration = carbon mineralization in the soil (mg) HClblank = amount HCl consumed in titration of the blank (ml) HClsample = amount HCl consumed in titration of the sample (ml) MWC = molar weight of C = 12.01 g/mol MHCl = mole of the HCl-solution = 0.05 mol/L V1 = volume 0.25 M NaOH in the trap (ml) = 10 ml V2 = volume 0.25 M NaOH (carbon dioxide trap) used in titration (ml) = 2 ml n = ratio NaOH/CO2 = HCl molecules consumed per CO2 in Reaction 1-3 =2
Reactions: Reaction in the trap CO2 + 2 NaOH → Na2CO3 + H2O (1) Precipitation Na2CO3 + BaCl2 → BaCO3 (s) + 2 NaCl (2) Titration NaOH + HCl → NaCl + H2O (3)
36

4 Results Complete results from the soil characterization are presented in Appendix 11. A summary of the results from the heavy metal distribution samples is presented in Appendix 9. Additional results from the wastewater analysis is presented in Appendix 10.
4.1 Soil fertility
4.1.1 Soil composition and pH The organic matter content, textural composition, soil density and pH of the soil samples are displayed in Table 4-1. Organic matter content of the soils is between 2.2 and 3.3 %. The reference soil is a silt loam whereas the other soils are sandy loams, but close to be classified as silt loams, according to the USDA texture classification triangle. Soil density is somewhat lower in the Ref (1g/ml versus 1.07-1.12 g/ml). All soils are highly alkaline with pH between 7.2 and 7.8. Table 4-1 pH, soil density, organic matter percentage, textural composition and USDA texture class.
Unit Incub 1 Incub 2 Incub 3 Ref pH - 7,9 7,2 7,7 7,8
Soil density g/ml 1,1 1,1 1,1 1,0 Organic matter % 3,3 2,2 2,8 3,2
Clay % 4,5 2,5 2,5 6,5 Silt % 46,0 48,0 50,0 70,0
Sand % 49,5 49,5 47,5 23,5 Texture - Sandy loam Sandy loam Silt loam/Sandy loam Silt loam
4.1.2 CEC and cation nutrient ratios The cation exchange capacity (CEC) was rather high for all samples, in the range 33.7-48.1 cmolc/kg as shown in Table 4-2. The fractions of each cation are also presented as % of CEC and compared with desirable values according to ABSA (2006). The results indicate a deficiency of K and far too high levels of Mg for all samples, including Ref. The sodium concentration in Incub 1 is > 6 % of CEC, which may have a negative impact on soil structure and crop growth. Table 4-2 Cation exchange capacity, cation percentages and comparative desirable levels according to ABSA (2006).
Incub 1 Incub 2 Incub 3 Ref Desirable level
CEC (cmolc/kg) 48,1 33,7 38,2 36,7 - % Ca of CEC 61,3 72,7 71,2 65,1 60-80 % K of CEC 6,9 8,3 7,3 9,8 10-20
% Mg of CEC 24,9 16,9 16,5 22,9 3-8 % Na of CEC 6,9 2,1 5,0 2,2 <6
The cation ratios in the soil samples shown in Table 4-3 clearly indicate an imbalance between K and Mg for all soils. There is a risk of K deficiency since the K/Mg ratio is far below the recommended minimum value of 2.
37

Table 4-3 Cation ratios and recommended ratios
Incub 1 Incub 2 Incub 3 Ref Recommended ratio
K/(Ca+Mg) 0,08 0,09 0,08 0,11 < 0,7 * Ca/Mg 2,46 4,30 4,32 2,85 < 7 ** K/Mg 0,28 0,49 0,44 0,43 > 2 **
* ABSA (2006) ** Havlin et al. (2005)
However, concerning cation composition no significant difference can be observed between Incub 1-3 and Ref.
4.1.3 Micronutrients Figure 4-1 shows the concentrations of available Fe, Cu, Mn and Zn for the three soils and Ref. In the three affected soils the concentrations are considerably higher for all elements than in the Ref.
0
20
40
60
80
100
120
140
160
180
200
mg/kg
Incub 1 Incub 2 Incub 3 RefSoil
Micronutrients
Fe
Cu
Mn
Zn
Figure 4-1 Concentrations of available micronutrients of Iron, Copper, Manganese and Zinc (mg/kg).
4.1.4 Salinity and sodicity As shown in Table 4-4, none of the soils can be classified as saline, sodic or saline-sodic. EC values range between 0.74 and 1.55 dS/m and ESP varies between 2.1 and 6.9 % of CEC. Incub 1 is most saline and sodic but is still in the range of a normal soil.
38

Table 4-4 Electric conductivity (EC), exchangeable sodium percentage (ESP) and soil classification (according to Table 2-2).
Unit Incub 1 Incub 2 Incub 3 Ref EC dS/m 1,55 0,74 0,83 1,08
ESP % 6,9 2,1 5,0 2,2 Classification - normal normal normal Normal
4.1.5 Phosphorous The total P concentration is high for all soils (Otabbong 2007, pers. comm.), between 1378.7 and 1733.7 mg/kg, as shown in Table 4-5. The available phosphorous (P-Olsen) is on the other hand considerably higher in the soils exposed to wastewater than in the reference. Table 4-5 Total P and available P in mg/kg.
Incub 1 Incub 2 Incub 3 Ref P -Olsen 75,1 69,4 74,9 13 P -Total 1733,7 1378,7 1513,8 1687,7
4.2 Heavy metals in soil The total concentrations of heavy metals in Incub 1-3 and Ref are shown in Table 4-6. The copper concentrations are very high, above 200 mg/kg, for all soils. That is two times the critical concentration for polluted soils in Sweden. Also the cadmium concentration, 1.8-2.0 mg/kg, is at least four times above the critical value of 0.4 mg/kg. For chromium VI, the concentration is toxic in Incub 1 but well below the limit for the other soils. The proportion Cr VI of Cr total is significantly higher in Incub 1-3 than in Ref. The concentrations of cobalt, lead, zinc, mercury, nickel, arsenic and chromium total are all within normal ranges. Table 4-6 Total concentrations of heavy metals (mg/kg) and critical concentration for polluted soils set up by the Swedish EPA (Naturvårdsverket 2006). Incub 1 Incub 2 Incub 3 Ref Swedish
EPA Copper 233,1 201,4 218,1 251,3 100 Chromium 10,6 8,3 8 8 120 Chromium hexavalent 8,8 1,6 1,6 0,8 5 Nickel 18,3 15,3 15 14,7 35 Zinc 132,2 129,4 140,2 137,7 350 Mercury <0.002 <0.002 <0.002 <0.002 1 Lead 14,9 15,6 17,9 18,3 80 Cobalt 22,2 21,6 22,6 23,6 30 Cadmium 2 2 1,8 2 0,4 Arsenic 1,81 1,41 1,52 1,8 15
39
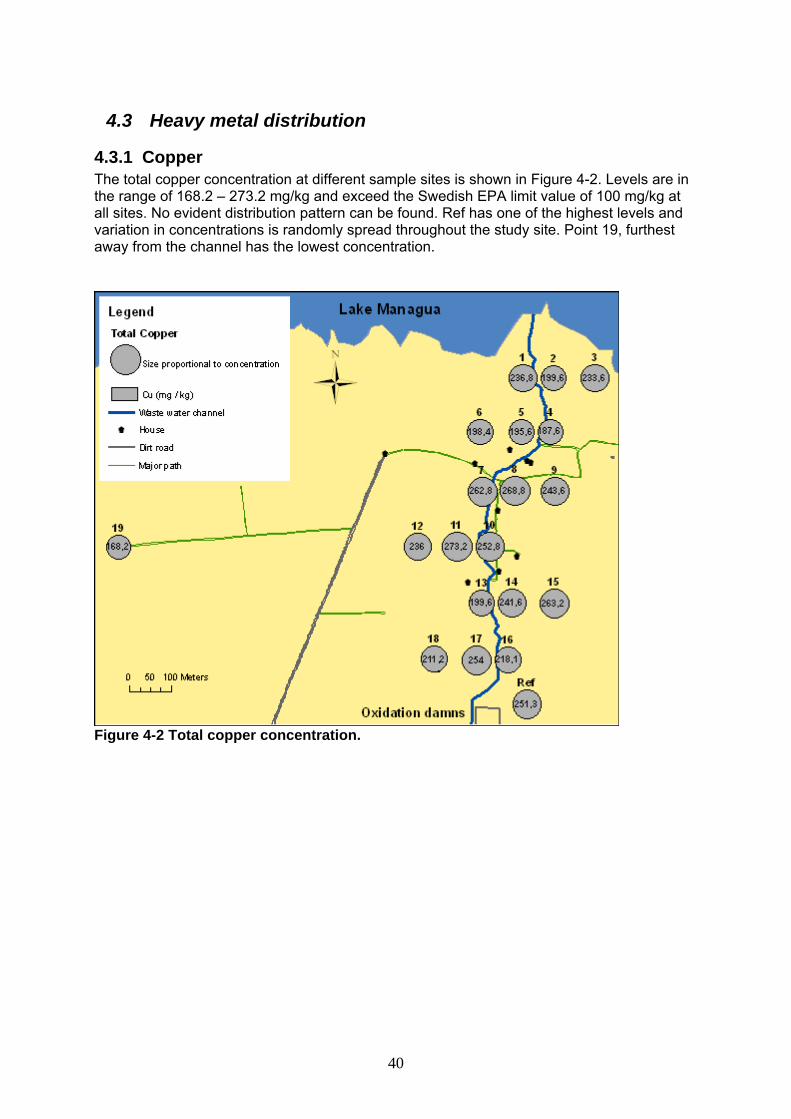
4.3 Heavy metal distribution
4.3.1 Copper The total copper concentration at different sample sites is shown in Figure 4-2. Levels are in the range of 168.2 – 273.2 mg/kg and exceed the Swedish EPA limit value of 100 mg/kg at all sites. No evident distribution pattern can be found. Ref has one of the highest levels and variation in concentrations is randomly spread throughout the study site. Point 19, furthest away from the channel has the lowest concentration.
Figure 4-2 Total copper concentration.
40

4.3.2 Nickel The total nickel concentrations at different sample sites are shown in Figure 4-3. Levels are in the range of 13.8 – 42.3 mg/kg. The Swedish EPA limit value of 35 mg/kg is exceeded at two sites, point 4 and 5. There is no evident pattern indicating that high levels are correlated with distance to the channel. However, the highest levels are all found downstream closer to the lake, at points 2-6 and 8.
Figure 4-3 Total nickel concentration.
41

4.3.3 Zinc The total zinc concentrations at different sample sites are shown in Figure 4-4. Levels are in the range of 86.5 – 140.2 mg/kg and therefore well below the Swedish EPA limit value of 350 mg/kg at all sites. No evident pattern can be found that indicates higher levels close to the waste channel. However, there is a tendency of higher concentrations close to oxidation dams. Point 16-17 and Ref have relatively high levels and are all positioned to the south.
Figure 4-4 Total zinc concentration.
42

4.3.4 Total and hexavalent chromium Total chromium concentrations at different sample sites are shown in Figure 4-5. Levels are in the range of 7.1 – 24.3 mg/kg and are well below the Swedish EPA limit value of 120 mg/kg for all sites. As is the case for nickel, the highest levels of total chromium are found in the downstream area. Levels of hexavalent chromium are also shown in Figure 4-5. Levels are in the range of 0.8 -16.3 mg/kg. The Swedish EPA limit value of 5 mg/kg is exceeded at three sites, points 4, 5 and 19. A high level, just below the limit value, is also found at point 3. Furthermore, the hexavalent fraction at points 4 and 19 is very high and constitutes most of the total chromium at these sites. In comparison, Ref has low total chromium concentration and the smallest hexavalent fraction.
Figure 4-5 Concentrations of total chromium and hexavalent chromium.
43

4.3.5 Toxic and high levels Figure 4-6 shows a summary over the sites where any toxic or high levels of heavy metals were found. Toxic level is here defined as a heavy metal concentration exceeding the Swedish EPA limit values for polluted soils. If the heavy metal concentration is more than 75 % of the limit value, it is defined as high level.
Figure 4-6 High and toxic levels of heavy metals. High level is defined as > 75 % of the limit value set by the Swedish EPA and toxic level when the limit value is exceeded. Toxic levels of copper are found at all sample sites, including Ref. For nickel, toxic levels are found at points 3 and 4. Toxic levels of hexavalent chromium were found at points 4, 5 and 19, and high levels at points 3 and 6. For total chromium and for zinc, the concentrations were low at all sites.
4.4 Heavy metals in the wastewater The heavy metal concentrations in the wastewater sample are shown in Table 4-7. The copper concentration exceeds the limit value for textile industry wastewater of 0.5 mg/l, as defined by the World Bank (1998). The zinc concentration is well below Nicaraguan regulations. Only trace concentration of arsenic was found and remaining heavy metals were under the detection levels.
44

Table 4-7 Heavy metal concentrations in the wastewater. Copper mg/l 0.51Zinc mg/l 0.60Chromium (total) mg/l < 0.06Chromium (VI) mg/l < 0.06Nickel mg/l < 0.1Cobalt mg/l < 0.05Arsenic µg/l 0.003Mercury µg/l < 0.002Cadmium mg/l <0.02Lead mg/l <0.1
4.5 Heavy metals in plants The heavy metal concentrations in the plant samples are presented in Table 4-8. Only detectable values of copper and zinc were found. The copper concentration in basil, 23.1 mg/kg is toxic. The zinc concentration is within acceptable values for all samples. Table 4-8 Concentrations of heavy metals in plants (mg/kg) and limit concentrations for toxic effects on plants according to Saurbeck (Mengel & Kirkby 1987). 1 (Banana) 2 (Banana) 3 (Corn) 4 (Corn) 5 (Basil) Toxic
effects Copper 8,7 9,3 9,2 11,5 23,1 15-20 Zinc 2,9 3,2 22,1 34,1 40,1 150-200 Chromium < 0,06 < 0,06 < 0,06 < 0,06 < 0,06 1-2 Nickel < 0,1 < 0,1 < 0,1 < 0,1 < 0,1 20-30 Cadmium < 0,02 < 0,02 < 0,02 < 0,02 < 0,02 5–10 Lead < 0,1 < 0,1 < 0,1 < 0,1 < 0,1 10-20
4.6 Microbial activity Figure 4-7 shows the accumulated microbial respiration of the soils with 100 mg glucose added, i.e. three soils that often are inundated by the wastewater (Incub 1, Incub 2 and Incub 3) compared with a non-affected soil (Ref). The second reference soil (Ref 2) that also was run in the incubation test is here eliminated since it proved to be of a very different type of soil, why it is hard to compare. Only the first 7 days of the incubation is presented below since most of the replicas showed negative respiration from day 10 to 15 compared to the blanks.
45
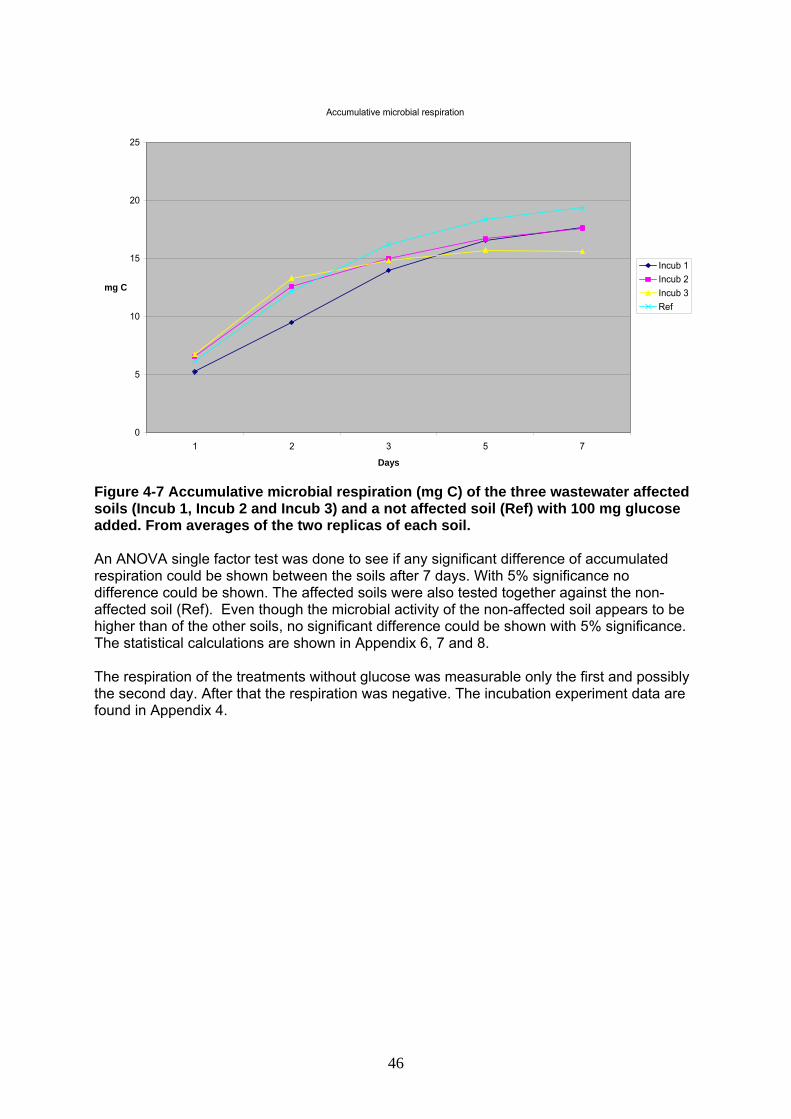
Accumulative microbial respiration
0
5
10
15
20
25
1 2 3 5 7
Days
mg C
Incub 1Incub 2Incub 3Ref
Figure 4-7 Accumulative microbial respiration (mg C) of the three wastewater affected soils (Incub 1, Incub 2 and Incub 3) and a not affected soil (Ref) with 100 mg glucose added. From averages of the two replicas of each soil. An ANOVA single factor test was done to see if any significant difference of accumulated respiration could be shown between the soils after 7 days. With 5% significance no difference could be shown. The affected soils were also tested together against the non-affected soil (Ref). Even though the microbial activity of the non-affected soil appears to be higher than of the other soils, no significant difference could be shown with 5% significance. The statistical calculations are shown in Appendix 6, 7 and 8. The respiration of the treatments without glucose was measurable only the first and possibly the second day. After that the respiration was negative. The incubation experiment data are found in Appendix 4.
46

5 Discussion To draw conclusions is complicated due to a number of reasons. Soil management and pollution sources in the past are unknown and major hurricanes such as Mitch cause inundation and contribute to the spreading of pollutants. Background values of heavy metals and salts in the soils are not truly investigated. To draw conclusions is also more difficult due the absence of good and clear reference samples. As explained in Section 3.2.1, a second reference sample was cancelled due to its different characteristics and unknown soil type. The appropriateness for comparisons with the remaining reference sample, Ref, is also a subject for discussion. It is not clear how affected this sampling site might be of the wastewater. According to the farmer Manuel Morán this point never gets inundated by the wastewater. However, the proximity to the wastewater channel and the other sampling sites could imply a latent influence from the wastewater through groundwater movements. This is particularly the case when it comes to more soluble substances, such as cations. The groundwater level is rather high. The texture of the Ref might also differ too much for reliable comparisons with the other sites. To draw reliable conclusions on wastewater impact on soil fertility, more samples are needed and more standardized reference samples.
5.1 Soil fertility It seems like the site closest to Lake Managua, Incub 1, has more imbalance between the cations than the rest. The sodium concentration is 6.9 % of CEC which may have a negative impact on soil structure and crop growth, and the K/Mg ratio is more below the desirable compared to the other sites. As shown in Section 4.3, this site is close to the area with highest levels of various heavy metals. This may indicate that the wastewater impact is greatest in this area. However, this area was probably under water after hurricane Mitch when Lake Managua rose, which also may have brought pollutants.
5.1.1 Conclusions Due to the small number of samples and the uncertainties concerning the reference sample, conclusions are hard to draw. The results show, however, some tendencies. No difference can be observed between sites exposed to the wastewater and the not affected site regarding the cation balance, pH, sodicity or salinity. All soils are highly alkaline, show an imbalance of exchangeable K and Mg, and none of them seem to be severely salt or sodium affected. Wastewater impact probably explains the significantly higher levels of available Fe, Cu, Mn and Zn in Incub 1-3 than in Ref. Since Ref has a more fine-textured soil, the values there should, if anything, be higher if there was no impact from the wastewater. The same conclusions can be drawn about the considerably higher concentrations of available P in Incub 1-3. The large quantity of available P probably originates from the detergents in the washing processes at ZFILM. The wastewater sample analysis shows a detergent concentration of 0.4 mg/l, and the levels have probably been much higher before the introduction of the treatment plants.
47

5.2 Heavy metals in soil
5.2.1 Conclusions The toxic levels of cadmium found in all four soil samples, including the reference, are remarkable. It can, however, probably not be related to the wastewater. The levels of cobalt are rather high, but do not exceed the Swedish EPA limit value for polluted soils. The levels of arsenic, lead and mercury are well below the limit value. The other five heavy metals investigated are discussed in section 5.3.
5.3 Heavy metal distribution
5.3.1 Copper The high levels of copper at the study site are hard to explain. There is no evident pattern showing where the copper originates from and arguments for ZFILM as a possible source are weak. Copper levels vary randomly and the reference (Ref) that should be unaffected by wastewater, contains one of the highest copper levels. However, a possible explanation for the latter could be contamination through the groundwater. The wastewater does apparently contain high levels of copper (see section 4.4), and possible influx of the wastewater into the groundwater is yet not investigated for heavy metals. The point furthest away from the channel has the lowest copper concentration, which could indicate less contamination with distance from the channel. But still, copper is a relatively immobile metal, hence the risk for leaching is relatively low. Since the copper concentration is very high at all sites, the explanation is probably high background values in the soil.
5.3.2 Nickel High levels of nickel seem to be concentrated to the northern part of the study area, near the lake. Two sample sites there have concentrations exceeding the Swedish EPA limit value, implying toxic levels for animals and plants. Whereas the contamination is correlated to ZFILM or other sources is hard to distinguish. There is no correlation between high nickel levels and the distance from the channel, and sites in the south, which also often inundate, have relatively low nickel levels. However, the accumulation found in the area downstream may be correlated to wastewater impact through groundwater movement towards the lake. Another explanation can be former contamination of lake sediments. The area close to the present waterfront was under water for a long time after hurricane Mitch and the lake level has been higher even before that. Hence, the polluted lake could have contributed to nickel in the soil.
5.3.3 Zinc Zinc does not seem to be contaminating the area. All levels are well below the Swedish EPA limit value. There is a tendency of higher levels in the south but as they are far from toxic this could rather be correlated to natural fractions, differing with soil type.
5.3.4 Total and hexavalent chromium Contamination of chromium does not seem to be a problem, considering the total concentration. All levels are well below the Swedish EPA limit value and constitute no short term threat. There are higher concentrations in the north, close to the lake, but as they are still low this could be correlated to natural variations or old lake sediments. The most toxic stage of chromium (Cr VI) is, a bit unexpectedly, found in toxic quantities at three sample sites. At one of the sites, point 4, it is three times higher than the Swedish EPA limit value. However, there is no strong evidence that the wastewater is the contaminator, as levels further south are low even though the risk for inundation is high. And the fact that one
48

of the contaminated and toxic sites is far away from the channel, point 19, does also point toward another explanation for the contamination. However, there is a tendency that the highest values for both total and hexavalent chromium are found in the downstream area, which may, again, indicate latent wastewater impact through groundwater movements towards the lake. Another probable explanation of the higher levels of chromium in the northern area can be correlated to contaminated lake sediments. As mentioned above the lake level was higher a long time back and rose for a time during hurricane Mitch.
5.3.5 Conclusions The heavy metal concentrations are generally higher in the northern part of the study site, near the lake. Particularly at sites 4 and 5 where there are toxic levels of hexavalent chromium, copper and nickel. As discussed above, this could be a consequence of latent wastewater impact through downstream movements of pollutants through the groundwater. Another explanation could be surface wastewater that deposits in this area during inundations. This is, however, not so probable, since other sites that often become inundated with the wastewater do not have high concentrations. The high levels in the north can also originate from lake sediments. The polluted Lake Managua rose 4 metres during hurricane Mitch and it took a long time for its surface to decrease. The history of the lake does also tell us about a higher water surface in the past. The toxic copper concentrations found at all sites are probably not correlated to the wastewater, but to high background values in these soils. However, these concentrations are also too high to be natural in these soils (Valverde 2006, pers. comm.), which makes it reasonable to suspect human influence. All sample sites were also categorized by their probability to inundate, based on interviews and the topography. High risk areas did not seem to be correlated with high concentrations of heavy metals. This also indicates that there could be other explanations than wastewater inundation. However, there are two things worth to consider: - There is no reliable information of where the channel used to inundate in the past. There could have been bigger problems 10-15 years ago and the area in the north could have been more exposed to inundation. This could explain the high levels in the north. - There is more than the inundation to consider when it comes to the wastewater impact on the groundwater system. The wastewater channel is built of dirt and does leach to the ground water constantly. This could explain why the distribution does not seem to be correlated with distance to the wastewater channel, but a tendency of high levels to be concentrated close to the lake.
5.4 Heavy metals in wastewater The only wastewater sample that was analysed is not very representative and is only aimed at giving a hint of possible pollutants present. The colour of the wastewater changes from day to day and thereby probably also the presumed concentrations of pollutants. More samples during a long period would better cover the different process stages in the factories as well as the reported disturbances in the wastewater treatment.
49

5.4.1 Conclusions The copper concentration exceeds the limit value, but the other heavy metals showed low or not detectable values. Earlier studies indicate higher concentrations of for instance chromium. Copper, zinc, nickel and high levels of chromium have earlier been found in sediments within ZFILM. This may indicate that the treatment of the wastewater has improved, but it could also be due to cleaner wastewater just that particular day of sampling. One month before the wastewater was significantly bluer than at the time of sampling. Detergents and phenols were also found in the wastewater, and the sodium concentration was as high as 256.3 mg/l. These results are presented in Appendix 10.
5.5 Heavy metals in plants The plant species analyzed in this study were selected on the basis on what was cultivated for consumption close to the wastewater channel at the time of sampling. Heavy metal accumulation in the plant normally decreases from root over stem and leaf to the fruit. This could explain the higher values of zinc and copper in basil than in maize and, especially, banana. However, it may also be a consequence of the higher soil concentrations of the metals at the basil sampling site, downstream close to Lake Managua.
5.5.1 Conclusions The copper level in basil is high enough for detrimental effects on the plant. All other concentrations of heavy metals are well under toxic levels. The heavy metal concentrations in the plants do not constitute any risk for human consumption.
5.6 Microbial respiration The results from the incubation experiment are confusing. When no glucose was added a small respiration was measured only the first days, to become negative on the rest of the 15 days. Obviously, CO2 accumulation in the traps of the blanks is higher than in the treatments with soils. The same is true after 7 days for the treatments with glucose. It is common with odd values after around 10 days when the glucose is decomposed. Respiration peaks can come and go, depending on the organic matter content and the type of soil. But this can probably not explain the negative values that occur almost immediately for the soils without glucose. A possible explanation for the negative respiration values is that this type of incubation test is not suited for alkaline soils with pH values between 7.2 and 7.8 (Kirchmann 2006, pers. comm.). As indicated in the Nicaraguan soil survey from 1972 and shown in the soil characterization of this study, the soil is calcareous and contains high levels of salts. The CO2 released from the microbial activity may be trapped in the soil as bicarbonates with calcium and other cations to a higher degree than what is released during the microbial mineralization. In the soils without added organic matter (glucose) this happens already after a day or two, and for the glucose-mixed soils when a major part of the glucose is decomposed (around 7 days). The rather high levels of total copper in the soils may also have disturbed the organic decomposition. Copper is the most toxic heavy metal to microorganisms. The proportion of available copper was shown to be lower in Ref than in Incub 1-3. This could, even though not significant, correlate to the higher accumulated respiration in Ref. However, the surprising results may have other explanations. Methodological errors in the experiment can not be excluded. The temperature in the incubator may have increased now and then due to power failures and condensation was observed regularly on the inside of the lids of the plastic beakers. There might also have been some leakage from the plastic
50

beakers since the lids were not of screw-type. The preparation of the solutions also constitutes a source of error as well as the titration procedure itself.
5.6.1 Conclusions The results from the incubation experiment may indicate a small negative impact of the wastewater on the microbial activity, but the visible higher respiration of the Ref compared to the affected soils could be random. The internal variance within the two replicas of each soil is too large in relation to the possible difference between the soils to show a significant impact. More replicas would be needed to show statistically if the microbial activity is lower in the affected soils than in the non-affected soil (Engdahl, pers. comm.).
51
6 Recommendations
1. The textile industries inside ZFILM must comply with the norms put up by MARENA regarding the industrial wastewater. The control program directed by MARENA is a crucial initiative for the industries to do this and it seems to have an effect. However, more can be done to increase the efficiency and reliability of the treatment plants and ZFILM’s will to cooperate to avoid further contamination of rivers, land and Lake Managua.
2. MARENA should revise the regulation regarding textile industry wastewater in
Nicaragua. Decree 33-95 is found relatively insufficient as it does not include several important parameters. Copper is found in toxic amounts in the wastewater, according to World Bank guidelines. Excessive copper concentrations are also found in soils in the study area, confirming that copper is a potential pollutant. Further parameters that should be included are nickel and salts, as high levels are found in the area. There should also be some regulations regarding the colour of the wastewater and other hazardous pollutants associated with textile industries, such as organic substances.
3. Former studies have shown that the oxidation dams are substantially under-
dimensioned. The information was brought up with the ZFILM administration and MARENA many years ago, but still no measures have been taken. The oxidation dams were originally constructed to handle domestic wastewater from 10.000 people. Today, the free trade zone has around 35.000 employees, implying a totally unsustainable situation. ZFILM must therefore extend the treatment of the domestic wastewater, either by constructing larger oxidations dams including a functional and reliable pump system (far from reality today) or by looking into other technologies for treatment of domestic wastewater.
4. ZFILM should review their whole pipe system for industrial wastewater. Excessive
amounts of wastewater in the under-dimensioned system make inundations common inside ZFILM and particularly at the study site where the system connects to an existing dirt channel. The wastewater has to be able to leave the industries without affecting its surroundings in this way. One measure that should be taken is to extend the pipe, today surfacing at the oxidation dams, all the way to Lake Managua. The domestic wastewater could, once treated in the oxidation dams, connect to the sub-terrain pipe. This solution would imply a smaller amount of water in the existing dirt channel, crucial to handle the excessive rain water. An extinction of the detrimental inundations would make way for the farmers to be able to cultivate their soils again and the ecosystems to recover.
5. The administration of ZFILM and MARENA must take the responsibility for the
littering inside and outside the free trade zone. Excessive amounts of bottles, tyres and other wastes get accumulated in the river passing the zone. During rains it gets flushed away and ends up downstream near Lake Managua, leading to clogging of the rivers and inundations that spread the wastes. If ZFILM could rectify the littering caused by its workers, the wastewater impact through inundations would probably decrease and the wastes would not impact the nature.
6. As a consequence of the extensive use of groundwater, the groundwater level
has decreased substantially in the area since the introduction of ZFILM. Effort
52

should be put on decreasing the water use at ZFILM and recycling of residual waters should be considered.
7. Further studies are needed to fully understand the environmental impacts of
ZFILM and the wastewater, and they should focus on pollutants still not covered, such as organic compounds. The wastewater’s long term effects on Lake Managua and the groundwater should also be investigated carefully.
A comprehensive survey that covers a wide area is recommended, to investigate the extent and sources of the soil pollution of heavy metals shown in this study, particularly regarding copper and cadmium.
53

References Literature Alloway, BJ, 1995, Heavy metals in soils, 2nd edition, Chapman and Hall, Glasgow, UK. Brady, NC and Weil, RR, 1996, The Nature and Properties of Soils, Prentice-Hall, New Jersey, USA. Dagerskog, L and Simonsson, D, 2001, Investigation of the wastewater situation at Nicaragua’s largest free zone for industries, Zona Franca Industrial Las Mercede, Minor Field Study No.166, Swedish University of Agricultural Sciences, Uppsala, Sweden. Furn, K and Hultgren, J, 2004, Effects of dyeing and bleaching industries on the area around the Orathupalayam Dam in southern India, Minor Field Study 278, Swedish University of Agricultural Sciences, Uppsala, Sweden. García, PI and Hernández, L, 2005, Caracterización de las aguas residuales industriales textileras del complejo industrial de zona franca “Las Mercedes” (Managua). PhD Thesis, Universidád Nacionál Agraria, Managua, Nicaragua. Gustafson, JP, Jacks, G, Simonsson, M, Nilsson, I, 2005, Soil and water chemistry, Department of Soil Sciences, Swedish University of Agricultural Sciences, Uppsala, Sweden. Havlin, JL, Tisdale, SL, Beaton JD, Nelson, WL, 2005, Soil Fertility and Fertilizers. An introduction to nutrient management, Pearson Education Inc., New Jersey, USA. MARENA-KTH, 2000, Estimación del peligro potencial de contaminación en el acuífero de Managua - Estrategia de Protección para el Acuífero de Managua. Proyecto Uso Sostenible de los Recursos Hídricos (SUWaR-NICARAGUA), Nicaragua. Mengel, K and Kirkby EA, 1987, Principles of Plant Nutrition, International Potash Institute, Bern, Switzerland. Mengel, K and Kirkby EA, 2001, Principles of Plant Nutrition, 5th edition, International Potash Institute, Bern, Switzerland. Naturvårdsverket, 1999, Bedömningsgrunder för miljökvalitet; Odlingslandskapet, Rapport 4916, Naturvårdsverket Förlag. Naturvårdsverket, 1988, Zink i miljön : en kunskapsöversikt, Rapport 3429, Naturvårdsverket Förlag Parsons Corporation, Marshall & Stevens Incorporated, International Aero Service Corporation, 1972, Soil survey of the pacific region of Nicaragua, Volume II, Tax improvement and Natural Resources Inventory Project, Nicaragua. Skoog, K, 2005, Evaluación de efectos posibles de las aguas residuales (aguas azules) de la Zona Franca Industrial Las Mercedes (Managua, Nicaragua) sobre el agua subteránea, Universidád Nacionál Agraria, Managua, Nicaragua and Swedish University of Agricultural Sciences, Uppsala, Sweden. Slater, K, 2003, Environmental impact of textiles, Woodhead Publishing Ltd.
54

World Bank, 1998, Pollution Prevention and Abatement: Textiles Industry, Draft Technical Background Document, 1996, Effective July 1998, Environment Department, Washington D.C., USA.
World Wide Web
ABSA (Agricultural Bureau of South Australia), 2006, Better Soils. Retrieved November 13 2006 from http://www.bettersoils.com.au Briones, D, Castellón, D, Chávez, AL, Chávez, FO, García, C, García, F, n d, Lago Xolotlán- Niveles Históricos. Retrieved November 14 2006 from http://xolotlan.dax76.com/ NSW, 2006, Cation exchange capacity, State of New South Wales, Department of Primary Industries. Retrieved November 13 2006 from http://www.ricecrc.org/reader/soil-types-structure/ Cihacek, L, 2002, Coping with Hard Soils, North Dakota State University NDSU Extension Service, Water spouts No. 199, September 2002. Retrieved November 13 2006 from http://www.ext.nodak.edu/ CZF (Comisión de Zonas Francas), 2006. Retrieved October 30 2006 from www.czf.com.ni INETER (Instituto Nicaragüense de Estudios Territoriales), 2006, Climate of Nicaragua. Retrieved November 14 2006 from www.ineter.gob.ni Naturvårdsverket, 2006, Föroreningar, tungmetaller. Retrived August 2006 from www.naturvardsverket.se Rengasamy, R and Olsson, KA, 1991, Sodicity and soil structure, Australian Journal of Soil Research,Volume 29, Number 6. Retrieved November 13 2006 from http://publish.csiro.au/nid/84/paper/SR9910935.htm)
RPDC (Resource Planning and Development Commission), 2003, Soil Structure Decline and Compaction, SoE Tasmania 2003. Retrieved November 13 2006 from http://www.rpdc.tas.gov.au
Whiting, D, Wilson, C and Card, A, 2005, Managing Soil Tilth: Texture, Structure and Pore Space, Colorado State University Cooperative Extension. Retrieved November 13 2006 from http://www.ext.colostate.edu Laws Decreto No.33-95, 2000, Disposiciones para el control de la contaminación proveniente de lasdescaragas de aguas residuales domésticas, industriales y agropecuarias, Decreto no.33-95, La Gaceta Diario Oficial, Managua, June 26 1995, Presidencia de la Republica de Nicaragua. Decree. No 46-91, 1991, The Industry free trade export law, Nicaragua. EG, 2001, KOMMISSIONENS FÖRORDNING (EG) nr 466/2001 om fastställande av högsta tillåtna halt för vissa främmande ämnen i livsmedel.
Environmental law, 1997, Nicaragua.
55
Personal communication Esmelda Reynosa Luz, Profesora at UNA. Hernández Luis, Profesor at UNA. Valverde Gustavo, Profesor at LABSA, UNA. Palacio Alejandro, Chief of operations at ZFILM. Roger Pérez, Calidad ambiental, MARENA, Managua. Cruz Mendoza, Farmer living at the study site. Morán al Bizu Manuel, Farmer living at the study site. Silva Espinoza Manuel, Farmer living at the study site. Engdahl Gunnar, Institution of Mathematic Science, Royal Institute of Technology, Stockholm. Kirchmann Holger, Institution of Soil Science, Swedish University of Agricultural Science, Uppsala. Otabbong Erasmus, Department of Soil Sciences, SLU.
56

Abbreviations CNZF Comisión Nacional de Zonas Francas CZF Comisión de Zonas Francas EU European Union FARENA Facultad de Recursos Naturales y del Ambiente KTH Royal Institute of Technology LABSA Laboratorio de Suelo y Agua MARENA Ministerio del Ambiente y los Recursos Naturales Sida Swedish International Development Cooperation Agency SLU Swedish University of Agricultural Sciences UNA Universidad Nacional Agraria USDA United States Department of Agriculture ZFILM Zona Franca Industrial Las Mercedes BOD5 Biochemical Oxygen Demand CEC Cation Exchange Capacity COD Chemical Oxygen Demand EPA Environmental Protection Agency EC Electric conductivity ESP Exchangeable sodium percentage GPS Geographical Positioning System GIS Geographic Information System WHC Water Holding Capacity
57


Appendices
Appendix 1 Map of study site and oxidation dams
Appendix 2 Companies operating in ZFILM 2006 Name of company Activity Origin Corporación de Zonas Francas Operación Nicaragua Chih Hsing Garment´s (Managua), S.A. I y II Pantalones Taiwan Henry Garment, S.A. Pantalones Taiwan Nien Hsing International (Managua), S.A. Pantalones Taiwan Ropa de las Mercedes, S.A. (ROCEDES ) Pantalones USA Rocedes Apparel, S. A. Pantalones USA China Unique Garments, MFG Nicaragua Corp, S.A. Prendas de Vestir Taiwan China United Garments, MFG Nicaragua Corp, S.A. Camisas de tejido plano Taiwan Fortex Industrial Nicaragua, S.A. Camisas de tejido plano Taiwan Command Medical Nicaragua S.A. Accesorios Medico USA Formosa Textile, S.A. Ropa deportiva e invernal Pantalones Taiwan Hansae Nicaragua, S.A. Ropa de punto Corea HLL Chiang Garments, MFG Pijamas/camisas Taiwan Istmo Textil Nicaragua, S.A. Camisas de punto Corea Metro Garments, S.A. Camisas de punto Hong Kong Maquiladora D&M, S.A. Ropa de tejido Plano USA Sinonica Industrial, S.A. Camisas / Pantalones Taiwan Uno Garments, S.A. Prendas de Vestir Deportiva Corea Sun Star Nicaragua, S. A. Servicios - Venta de Repuestos Corea FINOTEX S.A. Etiquetas Calcomanias Honduras
SINAI REPUESTOS S.A. Repuestos Maq. Industriales El Salvador
59

Appendix 3 Summary of analytical methods for soil, water and plant samples
Element Extraction method Analytic method Soil analyses
Texture Sodium oxalate (C2O4Na2) and 1 M NaOH Bouyounce
pH Water Potentiometrically % Organic matter Wet combustion Walkey & Black
Micronutrients: Available Fe, Mn, Cu and Zn
Olsen (NaHCO3) modified with EDTA and superfloc
(HUNTER)
Atomic Absorption Spectrometry
Exchangeable Ca and Mg NH4OAc (1 M, pH 7) Atomic Absorption
Spectrometry Exchangeable
K and Na NH4OAc (1 M, pH 7) Flame Atomic Absorption Spectrometry
Total N Wet combustion Keldahl
Total P Percloric acid (HClO4) and by the molybdate-vanadate
procedure Photo spectrometry
Available P Olsen (0.5 M NaHCO3) and by the ascorbin-molybdate
procedure Photo spectrometry
Total Cd, Cr, Cr(VI), Cu, Ni, Pb, Zn
Digestion with 3:1 concentrated
NH4:destillated water
Atomic Absorption Spectrometry with graphite
background
Total As As trivalent and pentavalent As through hydrolysis and
oxidation procedure
Atomic Absorption Spectrometry
Hg (organic) 5 M HCl and cold vapour procedure
Atomic Absorption Spectrometry
Hg (inorganic) NH4:HCl Atomic Absorption Spectrometry
Water analyses
Pb Pirrolidine ditiocarbonate-cloroform procedure
Atomic Absorption Spectrometry
Zn, Cu NH4Atomic Absorption
Spectrometry
Remaining metals Direct As described for soil analysis above for respective metal
Phenols Aminoantipyrine procedure (pH 7.9) and cloroform Photo Spectrometry
Detergents Cloroform-methylene blue procedure Photo Spectrometry
Na Direct Flame Atomic Absorption Spectrometry
Plant analyses Cd, Pb, Zn, Ni, Cu 1:3 NH4
Co 1:1 NH4:HCl Cr H2SO4
Atomic Absorption Spectrometry
60

Appendix 4 Titration results from the incubation experiment ml HCl (0.05 M) required to neutralize 2 ml CO2-trap. Averages of two titrations for each treatment.
Treatment number Soil Titratio
n A Titratio
n B Titratio
n C Titratio
n D Titratio
n E Titratio
n F Titratio
n G 1 Incub 1 8,42 9,18 9,20 8,32 9,24 9,19 9,57 2 Incub 1 8,10 8,91 8,97 7,90 8,64 8,77 8,01 3 Incub 1 100mg 5,57 6,53 5,93 6,27 8,28 8,40 8,12 4 Incub 1 100mg 4,99 6,09 5,70 5,84 7,16 6,88 6,28 5 Incub 2 8,93 9,49 9,47 9,19 9,43 9,67 9,78 6 Incub 2 8,22 8,66 8,37 7,11 8,00 8,71 6,99 7 Incub 2 100mg 4,41 5,23 7,08 6,34 7,52 7,39 5,47 8 Incub 2 100mg 4,37 5,06 7,32 6,98 8,09 7,42 6,47 9 Incub 3 8,66 9,25 9,29 8,95 9,02 9,54 9,68
10 Incub 3 8,38 9,00 8,93 8,29 9,04 9,23 8,57 11 Incub 3 100mg 4,33 4,83 7,75 7,35 8,61 8,96 9,12 12 Incub 3 100mg 4,24 4,71 7,85 7,02 8,38 8,43 8,35 13 Ref 1 8,05 8,62 8,56 7,84 8,50 8,33 7,51 14 Ref 1 8,10 8,55 8,65 8,13 8,49 8,47 7,50 15 Ref 1 100mg 4,67 5,17 6,43 6,49 7,96 7,99 7,50 16 Ref 1 100mg 4,67 5,17 5,71 6,26 7,56 7,16 6,13 17 Ref 2 8,67 9,01 8,75 8,29 8,78 7,98 6,80 18 Ref 2 9,11 9,54 9,05 8,56 8,89 9,26 8,27 19 Ref 2 100mg 7,08 7,74 7,84 5,72 6,12 6,57 5,85 20 Ref 2 100mg 7,42 8,02 8,16 6,26 6,66 7,17 7,37 21 Blank 8,74 9,17 8,81 7,90 8,32 7,53 6,10 22 Blank 8,80 9,13 8,80 7,66 8,53 7,73 6,56
Time for change of CO2 trap
Start 16 oct 17:00
17 oct 14:00
18 oct 12:00
19 oct 14:00
21 oct 14:00
23 oct 12:30
26 oct 13:00
31 oct 10:00
Day 0 1 2 3 5 7 10 15 Hours 0 21 43 69 117 163,5 236 353
61
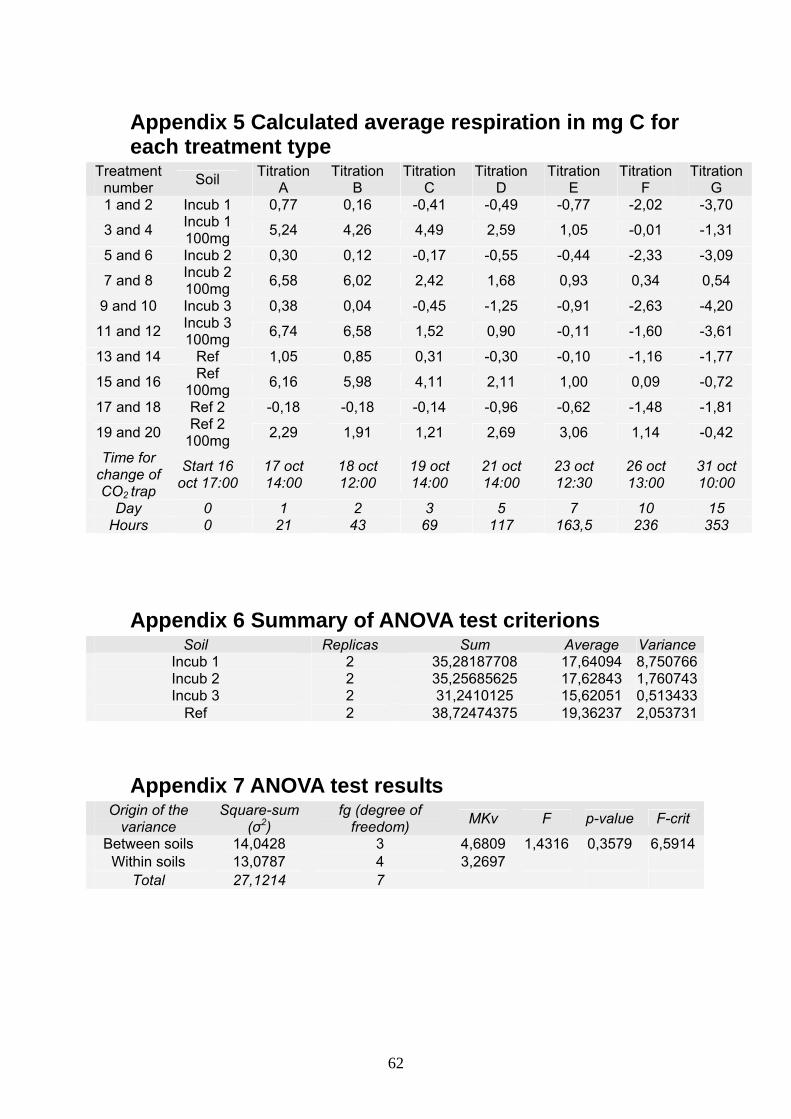
Appendix 5 Calculated average respiration in mg C for each treatment type
Treatment number Soil Titration
A Titration
B Titration
C Titration
D Titration
E Titration
F Titration
G 1 and 2 Incub 1 0,77 0,16 -0,41 -0,49 -0,77 -2,02 -3,70
3 and 4 Incub 1 100mg 5,24 4,26 4,49 2,59 1,05 -0,01 -1,31
5 and 6 Incub 2 0,30 0,12 -0,17 -0,55 -0,44 -2,33 -3,09
7 and 8 Incub 2 100mg 6,58 6,02 2,42 1,68 0,93 0,34 0,54
9 and 10 Incub 3 0,38 0,04 -0,45 -1,25 -0,91 -2,63 -4,20
11 and 12 Incub 3 100mg 6,74 6,58 1,52 0,90 -0,11 -1,60 -3,61
13 and 14 Ref 1,05 0,85 0,31 -0,30 -0,10 -1,16 -1,77
15 and 16 Ref 100mg 6,16 5,98 4,11 2,11 1,00 0,09 -0,72
17 and 18 Ref 2 -0,18 -0,18 -0,14 -0,96 -0,62 -1,48 -1,81
19 and 20 Ref 2 100mg 2,29 1,91 1,21 2,69 3,06 1,14 -0,42
Time for change of CO2 trap
Start 16 oct 17:00
17 oct 14:00
18 oct 12:00
19 oct 14:00
21 oct 14:00
23 oct 12:30
26 oct 13:00
31 oct 10:00
Day 0 1 2 3 5 7 10 15 Hours 0 21 43 69 117 163,5 236 353
Appendix 6 Summary of ANOVA test criterions Soil Replicas Sum Average Variance
Incub 1 2 35,28187708 17,64094 8,750766Incub 2 2 35,25685625 17,62843 1,760743Incub 3 2 31,2410125 15,62051 0,513433
Ref 2 38,72474375 19,36237 2,053731
Appendix 7 ANOVA test results Origin of the
variance Square-sum
(σ2) fg (degree of
freedom) MKv F p-value F-crit
Between soils 14,0428 3 4,6809 1,4316 0,3579 6,5914 Within soils 13,0787 4 3,2697
Total 27,1214 7
62

Appendix 8 Test for difference between Ref and the other three soils (Incub 1, Incub 2, and Incub 3)
95 % confidence interval = 1/3(Avg(Incub1) + Avg(Incub2) + Avg(Incub3) - Avg(Ref) +/- f0.025(fg) * σ2*(1/6+1/2) = -2.4 +/- f0.025(4) *13.09*(1/6+1/2) = -2.4 +/- 4.1 Since the confidence interval includes 0, no significant difference between Ref and the other soils can be shown.
Appendix 9 Total concentrations of heavy metals (mg/kg) in soil samples for heavy metal distribution determination
Sample Row Distance f. WW (m) Copper Zinc Nickel Chromiu
m Chromium
(VI) 1 1 10 236,8 112,6 16,6 12,7 3,5 2 1 50 199,6 112,1 22,6 8,4 2,6 3 1 150 233,6 114 21,3 12,2 4,7 4 2 10 187,6 97,2 40,2 24,3 16,3 5 2 50 195,6 90 42,3 19,9 6,8 6 2 150 198,4 86,5 18,9 11,1 3,8 7 3 10 262,8 125,1 16,2 8,8 2,5 8 3 50 268,8 98,8 20,5 7,8 2,4 9 3 150 243,6 96,9 14,5 8,5 2
10 4 10 252,8 102,1 18,1 10,2 3 11 4 50 273,2 103,2 17,5 10,1 3 12 4 150 236 92 16,5 7,9 2,5 13 5 10 199,6 104,7 14,4 7,1 2,2 14 5 50 241,6 107,7 14,2 7,5 2,3 15 5 150 263,2 104,5 14,6 7,8 2,4
16 (Incub 3) 6 10 218,1 140,2 15 8 1,6 17 6 50 254 117 13,8 7,1 1,6 18 6 150 211,2 124,5 15,9 9,1 2,6
19 (Ref) 4 1300 168,2 89,5 13,9 13 11,6 Ref - 100 251,3 137,7 14,7 8 0,8
Appendix 10 Additional results from wastewater analysis
Temperature 35 ºC pH 8,15 Sodium 256,3 mg/l Detergents 0,4 mg/l Phenols 0,0001 mg/l
63

Appendix 11 Summary of all results from soil characterization (including Ref 2)
Unit Incub 1 Incub 2 Incub 3 Ref Ref 2
pH - 7,9 7,2 7,7 7,8 8 Organic Matter % 3,32 2,2 2,8 3,2 4,44 Density g/ml 1,07 1,12 1,11 1 1,16 Clay % 4,48 2,48 2,48 6,48 6,48 Silt % 46 48 50 70 26 Sand % 49,52 49,52 47,52 23,52 67,52
Texture* - Sandy loam
Sandy loam
Sandy loam/silt
loam Silt loam Sandy
loam
Phosphorous available (P)(Olsen) mg/kg 75,1 69,4 74,9 13 55,2
Phosphorous total (P) mg/kg 1733,7 1378,7 1513,8 1687,7 1880,8
Nitrogen total (N) mg/kg 0,21 0,14 0,17 0,21 0,3 Electric Conductivity (EC) µs/cm 1553 744 833 1083 343
Cation Exchange Capacity (CEC) cmolc/kg 48,1 33,7 38,2 36,7 48,4
Potassium (K) cmolc/kg 3,3 2,8 2,8 3,6 5,9 Calcium (Ca) cmolc/kg 29,5 24,5 27,2 23,9 27,8 Magnesium (Mg) cmolc/kg 12 5,7 6,3 8,4 9,7 Sodium (Na) cmolc/kg 3,3 0,7 1,9 0,8 5 Iron (Fe) mg/kg 103,5 189,5 179,5 32,6 102 Copper (Cu) mg/kg 25,9 26,9 24,8 14,8 30,8 Zinc (Zn) mg/kg 5 7 7,9 2 4,8 Manganese (Mn) mg/kg 13,9 8 10,9 5,9 9,6 Copper total (Cu) mg/kg 233,1 201,4 218,1 251,3 247,2 Zinc total (Zn) mg/kg 132,2 129,4 140,2 137,7 105,8 Mercury total (Hg) mg/kg <0.002 <0.002 <0.002 <0.002 <0.002 Lead total (Pb) mg/kg 14,9 15,6 17,9 18,3 12 Chromium total (Cr) mg/kg 10,6 8,3 8 8 7,7 Chromium hexavalent (Cr VI) mg/kg 8,8 1,6 1,6 0,8 1
Nickel total (Ni) mg/kg 18,3 15,3 15 14,7 15,8 Cobalt total (Co) mg/kg 22,2 21,6 22,6 23,6 21,7 Cadmium total (Cd) mg/kg 2 2 1,8 2 2 Arsenic total (As) mg/kg 1,81 1,41 1,52 1,8 1,04 Analyst at LAQUISA Lic. Mario Benito Ortiz Avendaño
64