soil acidification: a provisional model for new zealand pastoral systems
TRANSCRIPT

This article was downloaded by: [UOV University of Oviedo]On: 04 November 2014, At: 01:32Publisher: Taylor & FrancisInforma Ltd Registered in England and Wales Registered Number: 1072954 Registeredoffice: Mortimer House, 37-41 Mortimer Street, London W1T 3JH, UK
New Zealand Journal of AgriculturalResearchPublication details, including instructions for authors andsubscription information:http://www.tandfonline.com/loi/tnza20
Soil acidification: A provisional modelfor New Zealand pastoral systemsC. A. M. de Klein a , R. M. Monaghan a & A. G. Sinclair aa Invermay Agricultural Centre , AgResearch , Private Bag 50034,Mosgiel, New ZealandPublished online: 17 Mar 2010.
To cite this article: C. A. M. de Klein , R. M. Monaghan & A. G. Sinclair (1997) Soil acidification: Aprovisional model for New Zealand pastoral systems, New Zealand Journal of Agricultural Research,40:4, 541-557, DOI: 10.1080/00288233.1997.9513277
To link to this article: http://dx.doi.org/10.1080/00288233.1997.9513277
PLEASE SCROLL DOWN FOR ARTICLE
Taylor & Francis makes every effort to ensure the accuracy of all the information (the“Content”) contained in the publications on our platform. However, Taylor & Francis,our agents, and our licensors make no representations or warranties whatsoever as tothe accuracy, completeness, or suitability for any purpose of the Content. Any opinionsand views expressed in this publication are the opinions and views of the authors,and are not the views of or endorsed by Taylor & Francis. The accuracy of the Contentshould not be relied upon and should be independently verified with primary sourcesof information. Taylor and Francis shall not be liable for any losses, actions, claims,proceedings, demands, costs, expenses, damages, and other liabilities whatsoever orhowsoever caused arising directly or indirectly in connection with, in relation to or arisingout of the use of the Content.
This article may be used for research, teaching, and private study purposes. Anysubstantial or systematic reproduction, redistribution, reselling, loan, sub-licensing,systematic supply, or distribution in any form to anyone is expressly forbidden. Terms &Conditions of access and use can be found at http://www.tandfonline.com/page/terms-and-conditions

New Zealand Journal of Agricultural Research, 1997, Vol. 40: 541-5570028-8233/97/4004-0541 $7.00/0 © The Royal Society of New Zealand 1997
541
Soil acidification: a provisional model for New Zealandpastoral systems
C. A. M. de KLEINR. M. MONAGHANA. G. SINCLAIR*
AgResearchInvermay Agricultural CentrePrivate Bag 50034Mosgiel, New Zealand
Abstract Soil acidification is a major probleminternationally and occurs in pastoral systems as aresult of nitrate leaching, nutrient transfer/removal,and soil organic matter (SOM) accumulation.Existing mechanistic models on soil acidificationcalculate acidification rates retrospectively, basedon quantitative information on these acidifyingprocesses. This paper presents an outline of apredictive soil acidification model that includessub-models for estimating the extent of nitrateleaching, nutrient transfer/removal, and soil organicmatter accumulation. The model was used to predictacidification rates in a fertiliser trial on sheep-grazed pastures, receiving superphosphate fertiliserfor 35 years. The predicted rates ranged from 1.46to 3.83 kmolc/ha.year, which was in moderateagreement with acid additions rates of 3.09 to 3.43kmolc/ha.year as calculated from measured changesin soil pH and the pH buffer capacity (pHBC).Further development of the model is needed toinclude a SOM accumulation sub-model and torefine the various relationships within the existingsub-models. In addition, accurate information onthe pHBC of soils is needed to convert soil pHchange into acid addition rate, which will be crucialfor validating the model.
*Dr A. G. Sinclair died on 2 December 1996 while thispaper was in preparation.
A97035Received 28 April 1997; accepted 18 August 1997
Keywords Acidification; dairy; grass/cloverpasture; model; New Zealand; sheep
INTRODUCTION
Soil acidification is the net production of protonsin the soil, which occurs as a result of variousbiological and chemical soil and plant processes.The rate of these acidifying processes is slow undernatural conditions, but generally accelerates underagricultural practices (Helyar & Porter 1989). Ofparticular concern to New Zealand pastoral farmingis the process of acidification which occurs inlegume-based pastures as a result of nitrate leaching.Nitrogen enters these systems mainly as N2 andwhen this nitrogen is lost as NO3~ it causes a netincrease in H+ in the soil (Bolan et al. 1991).
Soil acidification can result in production lossfrom the toxic effects of mainly aluminium andmanganese on plant growth (Ritchie 1989), and istherefore usually ameliorated with the applicationof lime. The current method for calculating limerequirements in pastoral soils (Edmeades et al.1984), based on the relationship between soil pHand response to lime, has severe limitations mainlybecause this relationship is rather poor (Sinclair1995) and is derived empirically rather than fromknowledge of the underlying mechanisms ofacidification. The incorporation of a mechanisticmodel for predicting soil acidification rates intothe current lime requirement method is expected toenhance the accuracy of this approach. Furthermore,in situations where the optimum soil pH is known,a soil acidification model can be used to calculatethe amount of lime required to maintain the soil pHat the desired level. In addition, in hill and highcountry farming, where the full extent of soilacidification is not known and where liming isthought to be uneconomic because of highapplication costs, a predictive soil acidificationmodel will help in defining pastoral sustainabilityfor these areas.
The main processes responsible for soilacidification are nitrate leaching, nutrient transfer,
Dow
nloa
ded
by [
UO
V U
nive
rsity
of
Ovi
edo]
at 0
1:32
04
Nov
embe
r 20
14

542 New Zealand Journal of Agricultural Research, 1997, Vol. 40
and soil organic matter accumulation. Theacidifying mechanisms of these processes are fairlywell understood and have been incorporated inexisting soil acidification models (Helyar & Porter1989; Bolan et al. 1991; Sinclair 1995). Helyar &Porter (1989) presented a framework for estimatingthe net input of protons into a system from processesinvolving the various nutrient cycles that occur inthe soil. Bolan et al. (1991) reviewed the effect ofnitrogen cycle processes on soil acidification, andpresented a simple mathematical model forcalculating soil acidification rates in pastoral soilsin which all N has entered the system via N2fixation. Sinclair (1995) considered nitrate leachingand nutrient transfer as the two main causes of soilacidification, and presented a model for estimatingthe animal-induced acidification based on stockingrate. The main limitations of these models is that,unless nitrate leaching, nutrient transfer, and soilorganic matter accumulation can be adequatelypredicted, they require quantitative information onthese processes to calculate soil acidification rates,which makes them retrospective rather thanpredictive.
This paper presents a provisional model forestimating soil acidification in New Zealandpastoral soils, which is based on the theoreticalbackground of the existing models and expands onthe approach suggested by Sinclair (1995). Themodel includes sub-models for predictingacidification rates resulting from soil organic matteraccumulation, nitrate leaching, nutrient transfer/removal, and fertiliser use, and requires easilyobtainable input variables, such as stocking rateand type, pasture production and composition,fertiliser use, temperature, and rainfall.
THEORY
Soil acidification occurs when the rate of H+
production exceeds the rate of H+ consumption inthe soil (Van Breemen et al. 1983; Russell 1988).The H+ producing and consuming processes,involving both the soil and the plant system, includecation/anion uptake, mineralisation of soil organicmatter, nitrification, dissociation of organic acids,and oxidation/reduction processes (Van Breemenet al. 1983). Although these processes include manyof the nutrient cycles, it is believed that underagricultural pastures processes within the carbonand the nitrogen cycle are the main causes of soilacidification (Helyar & Porter 1989).
Carbon cycle effectsThe two main sources of H+ from the carbon cycleare i) the dissolution of CO2 to produce carbonicacid (H2CO3) and the subsequent dissociation intoHCO3", CO32- and H+, and ii) the synthesis oforganic acids during photosynthesis and theirsubsequent dissociation into H+ and organic anions(Van Breemen et al. 1983). The H+ productionfollowing the dissociation of carbonic acid willincrease when CO2 production from soil and rootrespiration increases (Bolan et al. 1991) or whenHCO3- leaches (Ridley et al. 1990a). Some studieshave indicated that the acidity generated throughthese processes is very small relative to other H+
generating processes (e.g., Oenema 1990; Ridleyet al. 1990b; Dolling et al. 1994), although resultspresented by Parfitt et al. (1997) suggest that HCO3~leaching could be important.
The H+ ions that are generated in the plantfollowing the dissociation of organic acids willaffect the acidity of the soil when the plant takesup cations. Cation uptake by the plant results inexcretion of H+ ions into the soil solution, tomaintain charge neutrality. However, since OH" orHCC>3~ ions are excreted following the uptake ofanions, soil acidification only occurs when cationuptake exceeds anion uptake. The extent to whichthe H+ ions from the dissociated organic acidsaffect a soil's acidity, thus depends on thecation:anion uptake ratio, which differs from plantto plant (Sinclair et al. 1993). Plants that formlarge quantities of organic acids have a greatercation:anion uptake ratio and thus acidify the soilmore than plants with a smaller cation:anion uptakeratio.
Another factor that can affect the cation: anionuptake ratio is the form of nitrogen absorbed by theplant. As plants require large quantities of nitrogen,the form in which N is absorbed has a big influenceon the cation:anion uptake ratio. If absorbed fromthe soil as NH4"1", N uptake makes a largecontribution to cation uptake and is likely to leadto a large excess of cations over anions. If N istaken up as NO3-, the excess cation uptake is muchsmaller or there might even be an excess anionuptake (Haynes 1983). Plants that obtain their Nthrough N2 fixation generally take up an excess ofcations over anions and, as this atmosphericnitrogen makes no contribution to ionic imbalance,the excess cation uptake equals the differencebetween the non-nitrogenous cation and the non-nitrogenous anion uptake. However, even when
Dow
nloa
ded
by [
UO
V U
nive
rsity
of
Ovi
edo]
at 0
1:32
04
Nov
embe
r 20
14

de Klein et al.—Soil acidification: a provisional model 543
NO3 or NH4"1" absorption does occur, the excesscation content is often solely calculated from thenon-nitrogenous cations and anions (e.g., Jarvis &Robson 1983a, 1983b) as it is impossible toestablish from plant analysis, the form in which Nis absorbed by the plant. As a result, the excesscation content of the plants analysed by Jarvis &Robson (1983a, 1983b) was greater when nitrogenwas absorbed as NO3" than when N was absorbedas NH4
+.Although NO3" and NH4
+ uptake are not likelyto affect the plant's alkalinity, as they both will beconverted in the plant to NH3 (Bolan et al. 1991),their uptake will affect the soil's acidity. To accountfor the effect of N absorption by the plant on soilacidification, the net acidity or alkalinity generatedfrom NO3" and NH4
+ uptake is dealt with as part ofthe total nitrogen cycle of the system (Helyar &Porter 1989).
When cation uptake exceeds anion uptake thesoil will become more acid. When all the plantmaterial is returned evenly to the soil andcompletely mineralised, the acidifying effect ofexcess cation uptake will be neutralised. However,if the plant material accumulates in the soil asorganic matter, or if, following grazing, it is
removed from the system (product or excretaremoval) or transferred to the non-productive areaof the pasture (e.g., stock-camps), then theacidifying effect of excess cation uptake will notbe neutralised and the soil will acidify. The amountof acidity generated by the formation anddissociation of organic acids can thus be estimatedby quantifying the net amount of excess cations(i.e., the amount of organic anions) accumulated inor removed from the system (Helyar & Porter 1989;Bolan etal. 1991).
Nitrogen cycle effectsNitrogen transformations within the system caneither produce or consume H+ (Table 1). In a closedsystem, H+ consuming processes will counter-balance H+ producing processes and no netacidification will occur (Helyar 1976; Van Breemenet al. 1983). However, a system's acidity willchange when the H+ producing and consumingprocesses are uncoupled (Bolan et al. 1991) andnitrogen leaves the system in a different form and/or quantity than how it entered the system (Table2). Nitrogen enters an ecosystem mainly throughbiological N2 fixation or fertilisation, and is lostfrom the system via NO3" leaching, denitrification,
Table 11991).
H+ producing and consuming nitrogen processes (Van Breemen et al. 1983; Bolan et al.
Process Reaction equationH+ productiona
(molc/mol N)
N2 fixationMineralisation of org.NUrea hydrolysisNH4+ assimilationNH3 volatilisationNitrificationNO3" assimilationDenitrificationaNegative H+ production
N2 + H2O + 2 ROH ->RNH2 + H+ + H2O ->(NH2)2CO + 3 H2O ->NH4
+ + ROH -»NH4
+ ->NH4
+ + 2 O2 ->NO3- + ROH + H+ ->2 NO3 + 2 H+ ->
represents H+ consumption.
RNH2 + 3/2 O2
ROH + NH4+
2 NH4+ + 2 OH" + CO2
RNH2 + H2O + H+
NH3 + H+
NO3- + H2O + 2 H+
RNH2 + 2 O2N2 + 2V2O2 + H2O
0- 1- 1+ 1+ 1+ 2- 1- 1
Table 2 Net amount of H+ produced (kmol H+per kg of N lost) for various forms of N inputs andN losses from a pasture.
N loss processN2
fixationUrea
fertilisation
N input via
NH4+
fertilisationNO3 Soil organic N
fertilisation mineralisation
NO3 leachingDenitrificationNH3 volatilisationRemoval or storage
of assimilated N
0.07000
0.07000
0.140.070.070.07
0-0.07-0.07-0.07
0.07000
Dow
nloa
ded
by [
UO
V U
nive
rsity
of
Ovi
edo]
at 0
1:32
04
Nov
embe
r 20
14

544 New Zealand Journal of Agricultural Research, 1997, Vol. 40
NH3 N2 Fig. 1 A schematic diagram ofthe acidity generated from thenitrogen cycle under grazing. Thenumbers in the shaded boxesindicate molc of H+ produced (+)or consumed (-) per mole of Ntransferred.
NH3 volatilisation, and product removal (i.e.,removal of assimilated N). Although organic matteraccumulation (i.e., storage of assimilated N) willnot remove N from the system, this process willimmobilise N and is, therefore, also regarded as a'loss' process (Table 2). Similarly, nitrogen releasedue to the mineralisation of soil organic matter isconsidered a nitrogen 'input'.
When N2 is biologically fixed, acidificationwill occur only if the fixed N is lost through NC>3~leaching (Fig. 1). N2 fixation itself does not produceor consume H+ (Table 1) and if the assimilated N isremoved in products or accumulates in the soil asorganic nitrogen, no net acidification occurs.However, the release of NH4+ from urea hydrolysisor the breakdown of plant material will consume 1mol H+ per mole NH4
4" formed. If N is thenassimilated back into soil organic matter andremoved or stored, or lost via NH3 volatilisation,which produces 1 mol H+ per mole N, there is nonet acidifying effect. If NH4+ is nitrified to NC>3~,producing 2 mol H+ per mole N, followed by theassimilation or denitrification of the formed NC>3~,consuming 1 mol H+ per mole N, there is again nonet acidifying effect. If, however, NC>3~ is lost vialeaching, there will be a net H+ production of 1mol H+ per mole NO3" leached, or 0.07 mol H+ perkg NO3- -N leached (Table 2).
Nitrogen can also enter a system via urea andammonium- or nitrate-based fertilisers. Bycalculating a proton balance of the N processes asdescribed above for N2 fixation inputs, it can beseen that urea fertilisers will affect soil acidificationonly if N is lost via leaching, whereas acidification
from NH4+ fertilisers will occur from all N lossprocesses (Table 2). Nitrate fertilisers will have analkaline effect if N is lost via denitrification, NH3volatilisation, or removal or storage of assimilatedN. If N is applied as ammonium nitrate the netacidifying effect of the fertiliser equals that of ureafertiliser.
Examples of other nutrient cycles that mayaffect soil acidification are the phosphorus (P) andsulphur (S) cycles and redox reactions involvingtransformations of iron (Fe) and manganese (Mn).
The P and S cycles are influenced mainlythrough fertilisation, which can have both a directand an indirect effect on soil acidification. Theindirect effect of fertilisers results from theirinfluence on the carbon and nitrogen cycles withina system (e.g., increased production and N2 fixationresulting in increased product removal and NO3~leaching), which has been described above. Thedirect effect of fertiliser application on soilacidification resulting from the interactions of thefertilisers with the soil is well documented bySinclair etal. (1993).
Reduction reactions involving the transform-ations of Fe (Fe(OH)3 + 3H+ -» Fe2+ + 3H2O) andMn (MnO2 + 4H+ -> Mn2+ + 2H2O) can beimportant under alternately aerobic and anaerobicconditions, such as rice production systems (Helyar& Porter 1989) or some very poorly drained soils,but are thought to be of minor importance in mostpastoral systems. In addition, as the reductionreactions are caused through the oxidation of carboncompounds, their effect on soil acidification willbe incorporated in the carbon cycle.
Dow
nloa
ded
by [
UO
V U
nive
rsity
of
Ovi
edo]
at 0
1:32
04
Nov
embe
r 20
14

de Klein et al.—Soil acidification: a provisional model 545
Temperature
OM INDUCED ACIDIFICATION
Organic Matter accumulation
/
ANIMAL INDUCED ACIDIFICATION
\
Nitrate leaching & Nutrient transfer
• • • : . . . . . >
FERTILISER tNDUCED ACIDIFICATION
P & S Fertilisation
Sub models
Fig. 2 A schematic diagram of a conceptual soil acidification model.
Input variables
PRESENT SOIL ACIDIFICATION MODELS
Previous soil acidification models (Helyar & Porter1989; Bolan et al. 1991; Sinclair 1995) calculatedsoil acidification rates based on quantitativeinformation on nitrate leaching, nutrient transfer,and soil organic matter accumulation, and aretherefore retrospective rather than predictive.Sinclair's (1995) approach provided the best scopefor further development into a predictive modelfor estimating soil acidification rates at a farmscale. Expanding on this approach and using thetheoretical background of the models by Helyar &Porter (1989) and Bolan et al. (1991), a conceptualdiagram for a soil acidification model wasdeveloped (Fig. 2).
The model requires easily obtainable inputvariables, which feed into 3 sub-models forestimating the soil organic matter (SOM)-induced,the animal-induced, and the fertiliser-inducedacidification. The sum of these three sources ofacidification will give the total soil acidificationrate. The animal-induced sub-model incorporatessoil acidification from both nutrient transfer andnitrate leaching and is expected to represent themajor part of the total acidification, with stockingrate being the most important input variable.Acidification from soil organic matter accumulationor the direct effects of fertilisers on the soil
chemistry can, however, be of significantimportance. In the following sections the SOM-induced, the animal-induced, and the fertiliser-induced acidification are described in more detail,in the context of sheep and dairy farming in NewZealand. It should be noted here that the excesscation uptake is regarded as being the differencebetween the uptake of non-nitrogenous cations andnon-nitrogenous anions. The acidity or alkalinitygenerated from NH4
+ or NC>3~ uptake by the plantsis calculated as part of the total nitrogen balance ofthe system.
Sub-model 1: Soil organic matter-inducedacidificationAs discussed above, the accumulation of soilorganic matter results in soil acidification becauseits constituent excess cations (or organic anions)are not released to neutralise the acidifying effectof their uptake by the herbage. To allow calculationof the organic matter-induced acidification, boththe rate of soil organic matter accumulation andthe proton production per unit of SOM accum-ulation are needed. To be fully predictive, the SOM-induced sub-model should be able to estimate therate of soil organic matter accumulation. However,the actual development of a relatively simple sub-model that would be generally applicable with an
Dow
nloa
ded
by [
UO
V U
nive
rsity
of
Ovi
edo]
at 0
1:32
04
Nov
embe
r 20
14

546 New Zealand Journal of Agricultural Research, 1997, Vol. 40
acceptable degree of accuracy proved to beimpossible, because of the lack of available dataand the complexity of the process. Until simplifiedversions of complex soil organic matter models,such as CENTURY (Parton et al. 1987; Metherellet al. 1993), become available the soil acidificationmodel therefore requires actual data on the rate ofSOM accumulation.
To translate the rate of SOM accumulation intoproton production, the excess cation content or theorganic anion content of the SOM must beestimated. Since these parameters are not easilymeasured, Helyar & Porter (1989) presented anequation for calculating the SOM-induced acidaddition (AASOM in kmol H+/ha):AASOM = BD * V * a * (pH,,-l.5) * (SOMt2 - SOM,,)
0)where, BD is bulk density (kg/dm3), V is the volumeof the soil (dm3/ha), a is the electrical charge ofsoil OM (kmolc/kg SOM), pHt] is the initial soilpH, and SOMt] and SOMt2 are the soil organicmatter contents at the start and the end of themeasurement period (kg OM/kg soil). Therelationship between the organic anion content andthe cation exchange capacity of the soil organicmatter (CECSOM) is expressed in the a * (pHt)-l .5)term in equation (1): CECSOM ~ a * (pHti-1.5).This relationship was derived from measurementsof the CEC of 60 Wisconsin soils at various pHvalues (Helling et al. 1964) and from humic acidtitration curve data presented by Kononova (1966),and suggests a pH for zero charge of the soil organicmatter of 1.5. From the data of Helling et al. (1964)an average a value of 0.32 molc/kg SOM was thencalculated for the 60 soils, which Helyar & Porter(1989) regarded as representative for many soils.The initial soil pH (pHt0 is used in equation (1) toaccount for organic acids that were undissociatedat the final (lower) soil pH, but that would havebeen dissociated into H+ and organic anions at theinitial soil pH.
The soils that were used in the study by Hellinget al. (1964) had organic C contents ranging from0.4 to 4 %, which is low compared with most NewZealand soils (e.g., Edmeades et al. 1985). The avalue and the pH of zero charge might, therefore,be different for New Zealand soils. Results byParfitt et al. (1995) indicated that the CEC of 347A horizons of New Zealand soils at pH 7 was 2.2molc/kg C, i.e., 1.3 molc/kg SOM. At pH 5, thevalue was closer to 1 molc/kg C, or 0.58 molc/kgSOM (Parfitt 1992). These results suggest a pH for
zero charge of the soil organic matter of about 3,and an a value of 0.35 molc/kg SOM, or 0.00035kmolc/kg SOM. Thus, the SOM-induced acidaddition (AASOM
m kmol HVha) in New Zealandpastoral soils might be more accurately calculatedusing:
AASOM = BD * V * 0.00035 * (pH,,-3) * (SOMt2
- SOM,,) (la)
Sub-model 2: Animal-induced acidification—nutrient transferAs discussed above, the grazing animal is likely tohave a large impact on soil acidification throughnutrient transfer/removal and NO3~ leaching. OtherN processes such as denitrification, NH3 volatil-isation, and removal or storage of assimilated Nwill have a minor impact on soil acidification, andonly if N enters the system as NH4"1" or NO3~(Table 2). These processes are therefore notincluded in the initial model.
Bolan et al. (1991) calculated the removal ortransfer of excess cations (EC) by using the ratio ofEC content over N content of the herbage, basedon the assumption presented by Nyatsanga & Pierre(1973) that this ratio is relatively constant in legumecrops. Although a constant excess cation over Nratio has been shown for legumes gaining their Nsolely from fixation, in non-legume species and inlegumes gaining N from the soil this ratio largelydepends on the form in which N is absorbed (Jarvis& Robson 1983b). Alternatively, soil acidificationfrom nutrient transfer and product removal couldbe calculated from the excess cation contents ofthe transferred or removed materials (Helyar &Porter 1989). For pastoral systems this involvesthe estimation of the amount of excess cation intakeby the grazing animal, and the extent to which thisingested (alkaline) plant material is removed inproducts or transferred from the productive area ofthe pasture.
Information on the excess cation (EC) contentof herbage is scarce, but the data that are availablesuggest that the EC content can vary widely betweenspecies and with N fertilisation rate (Table 3). TheEC contents of legumes were generally greaterthan for ryegrass, which in turn seemed to beaffected by N fertiliser form and rate. In NewZealand pastoral systems the most common speciesare perennial ryegrass and white clover. Apart fromthe value reported by Goh et al. (1979), the ECcontent of ryegrass, receiving between 0 and 200kg N/ha as either NH4+ or urea, varied between
Dow
nloa
ded
by [
UO
V U
nive
rsity
of
Ovi
edo]
at 0
1:32
04
Nov
embe
r 20
14

de Klein et al.—Soil acidification: a provisional model 547
0.40 and 0.47 molc/kg DM (Table 3). Since urea isthe most common form of N fertiliser used andrates greater than 200 kg N/ha are uncommon inNew Zealand, the EC content of ryegrass wasassumed to be 0.44 molc/kg DM. The EC contentfor white clover was assumed to be 1.43 molc/kgDM.
To estimate the acidity generated by excesscation transfer or removal it was further assumedthat:
acidification occurs from both nutrient transferand product removal;any grass removed from the pasture as hay orsilage was fed to the animals;
the excess cation production in excreta equalsthe excess cation intake via herbage minus theexcess cation removal in products;an 'excreta loss factor' represents a proportionof the excess cations in the excreta that was lostfrom the productive area of the pasture.
The excess cation intake (ECin in kmolc/SU)for both sheep and dairy farming can be calculatedfrom the DM intake, the excess cation content ofthe herbage, and the percentage of clover and grassin the herbage:
ECin = DMin * (CC*ECc + (1 -CC)*ECg) (2)
where DMin is the dry matter intake (kg/SU), CC
Table 3 Excess cation content (non-nitrogenous cations minus non-nitrogenous anions) of theshoots of various legumes species and perennial ryegrass receiving different rates of N fertiliser,and of grass/clover pastures.
Species
Subterranean clover
White clover
Caucasian clover
Red clover
Lotus
LucerneLucerne hay
Ryegrass
Grass/clover pasture
Fertilisation
000
00
0
0
0
00
0285684
1120
100200300400174174
0162324648
n/ac
n/a
(kg N/ha)
NO3" -Na
NO3~ -Na
NO3- -Na
NO3- -Na
NO3- -NNO3- -NNO3- -NNO3- -NNCV -NNH4
+ -N
urea-Nurea-Nurea-N
EC content(molc/kg DM)
1.291.371.10 to 1.35
1.491.38
1.61
1.39
0.92
1.370.59
0.480.630.760.981.101.241.141.361.341.581.040.400.44b
0.42b
0.53b
0.51b
0.870.97
Reference
Jarvis & Robson (1983a)Jarvis & Robson (1983b)Jarvis & Robson (1983c)
Jarvis & Robson (1983b)R. M. Monaghan (unpubl. data)
R. M. Monaghan (unpubl. data)
Mengel & Steffens (1982)
R. M. Monaghan (unpubl. data)
R. M. Monaghan (unpubl. data)Sinclair (1995)
Dijkshoora(1957)Dijkshoorn(1957)Dijkshoorn(1957)Dijkshoorn(1957)Dijkshoorn(1957)Gohetal. (1979)Gohetal. (1979)Gohetal. (1979)Gohetal. (1979)Gohetal. (1979)Jarvis & Robson (1983b)Jarvis & Robson (1983b)Monaghan et al. (1996)Monaghan et al. (1996)Monaghan et al. (1996)Monaghan et al. (1996)
Sinclair (1995)Carran & Theobald (1995)
aIn mg NO3" -N per kg soil.bWhen an additional 150 kg MCP-P was applied, the EC contents were 0.64, 0.54, 0.47, and 0.42
molc/kg DM for the 4 N rates, respectively.cn/a = not available.
Dow
nloa
ded
by [
UO
V U
nive
rsity
of
Ovi
edo]
at 0
1:32
04
Nov
embe
r 20
14

548 New Zealand Journal of Agricultural Research, 1997, Vol. 40
is the clover content of the herbage (kg/kg DM),and ECc and ECg are the excess cation content ofclover and grass, respectively (kmolc/kg DM).
To calculate the EC production of sheep anddairy excreta (ECex (s) and ECex (d), respectively,in kmolc/SU) it was assumed that 15% of thenutrients ingested by sheep were removed inproducts (Saggar et al. 1990), and that the excesscation removal for dairying depends on the milkproduction and the excess cation content of themilk. From data on the composition of cow milkthe excess cation content was estimated at 0.054molc/l (Jennes & Patton 1959; Webb et al. 1974;Rosenthal 1991).
ECex (s) = ECin - 0.15 * ECin = 0.85 * ECin (3)
ECex (d) = ECin - MILK * ECm (4)where MILK is the milk production (1/SU) andECm is the excess cation content of milk (kmolc/l).
The excreta loss factors for sheep farming weretaken from Metherell et al. (1995), who presentedanimal transfer coefficients for different farmingsystems and topographies (Table 4) as part of a Pfertiliser decision support model (OUTLOOK™).These coefficients represent the proportion of theexcretal nutrients that is transferred away from theproductive area within the paddock.
The excreta loss factors for dairy farming wereestimated from the results of Zegwaard (1995),who investigated the distribution of dung and urineon a dairy farm. He concluded that on average 9%of the total amount of excreta produced wasdeposited outside the paddock. Of the remaining91% of the excreta that were returned to the
Table 4 Excreta loss factors for calculating the amountof excreta lost from the productive area of a grazedpasture, for different farming systems and topography(Metherell et al. 1995; Zegwaard 1995).
Fanningsystem
Sheepc
Dairyd
Flat
0.050.14
Border-dyke
0.150.23
Topography
Rolling
0.150.23
Easyhill"
0.250.32
SteephilF
0.50
aHill country contains no large areas with slopes greaterthan 25°.
bSteep hill country contains about 33% of slopes greaterthan 35°.
cFrom Metherell et al. (1995).dFrom Zegwaard (1995); includes within paddock
transfer and excreta loss to yards and races.
paddock, a percentage was deposited at gates,around troughs, or at ridges. The extent of thistransfer of excreta within the paddock dependedon the topography of the farm and was estimated at5%, 15%, and 25% for flat, rolling, and easy hillland, respectively. The total amount of excreta lostfrom the productive area of the paddock thereforeamounted to 14%, 23%, and 32% for flat, rolling,and easy hill land, respectively (Table 4). It shouldbe noted that these values may be greater forfarming systems in which the cows are kept onfeeding pads during certain times of the years, andsmaller when dairy shed effluent is returned to thepasture.
The acidity generated from nutrient transferunder sheep and dairy farming (AANUT (S)
a ndAANUT (d), respectively, in kmol H+/ha) can thenbe calculated as follows:
AANUT (S) = (EXloss * ECex + 0.15*ECin) * SR (5)AANUT (d) = (EXloss * ECex + MILK * ECm) * SR
(6)or,AANUT (s) = (EXloss * 0.85 * DMin * (CC*ECc
+ (l-CC)*ECg) + 0.15 * DMin * (CC*ECc+ (l-CC)*ECg))*SR (7)
AANUT (d) = (EXloss * (DMin * {CC* ECc+ (l-CC)*ECg} - MILK*ECm)+ MILK * ECm) * SR (8)
where EXloss is the excreta loss factor (kg/kgproduced; Table 4), DMin is the dry matter intake(kg/SU), CC is the clover content of the herbage(kg/kg DM), ECc and ECg are the excess cationcontents of clover and grass, respectively (1.43 * 10~3 and 0.44* 10-3 kmolc/kg DM), MILK is the milkproduction (1/SU), ECm is the excess cation contentof milk (0.054* 10-3 kmolc/l), and SR is the stockingrate (SU/ha).
Sub-model 2: Animal-induced acidification—nitrate leachingNitrate leaching is likely to be one of the majorcauses of soil acidification in pastoral soils (Sinclair1995), but obtaining accurate estimates of NO3~leaching is hampered by the large spatial andtemporal variability of this process. This variabilityarises largely from the grazing animal, whichreturns a large amount of the ingested N to the soilin small concentrated patches, mainly as urine,from which large NO3~ leaching losses have beenmeasured (Field et al. 1985; Williams & Haynes1994). In addition, soil and climatic factors affect
Dow
nloa
ded
by [
UO
V U
nive
rsity
of
Ovi
edo]
at 0
1:32
04
Nov
embe
r 20
14

de Klein et al.—Soil acidification: a provisional model 549
NO3 leaching, which hampers the generalapplication of the results of short-term leachingstudies.
This lack of information on NO3" leaching isthe most important drawback for the application ofcurrent soil acidification models. For example,Helyar & Porter (1989) calculated NO3~ leachingfrom the difference between the total acid addition,as calculated from changes in pH and the pH buffercapacity, and the acid addition from mechanismsother than NC>3~ leaching (e.g., Ridley et al. 1990a).Thus, their model has mainly been used to estimateNC>3~ leaching, rather than to predict the amount ofacidification that will occur. As a consequence,any errors made when measuring changes in pHand pHBC and in estimating the acidification effectof the known mechanisms will add to errors inestimating NO3" leaching. These errors in the NC>3~leaching estimates are likely to be substantialbecause of the large inaccuracies that occur indetermining changes in pH and pHBC.
A predictive soil acidification model wouldtherefore require a nitrate leaching sub-model thatcan predict NC>3~ leaching losses from easilyobtainable input variables. Such a nitrate leachingsub-model is not readily available for the NewZealand situation. Therefore, for the purpose ofthe present tentative soil acidification model, acrude NO3~ leaching sub-model has been developedwith data that are currently available. This sub-model uses stocking rate and type and N fertiliserinput as variables. Although rainfall is recognisedas being an important factor, it is not included inthis initial model, because of lack of data. The sub-model is based on the results of the study byLedgard et al. (1996a, 1996b), which is the onlylong-term study of nitrate leaching losses underdairying. Paddocks received nominal fertiliser Ninputs of 0, 200, and 400 kg urea-N/ha.year andwere grazed at a stocking rate of 3.2 cows/ha.year,i.e., about 20 SU/ha.year. Over a 3 year period, themean nitrate leaching losses were 40, 81, and 152kg N/ha.year, or 2.0, 4.1, and 7.6 kg N/SU fortreatments receiving an average fertiliser N inputof 0, 215, and 413 kg N/ha.year, respectively(Ledgard et al. 1997). These results suggest that anexponential relationship between fertiliser N inputand NO3" leaching per stock unit exists, which canbe expressed as follows:
NO3- L s u = 2.0 * e 0.06*FertNin (9)where NO3" Lsu is the amount of nitrate leached(kg N/SU) and FertNin is the fertiliser N input (kg
N/SU/year). The total amount of NO3' leachedfrom a dairy farm (NO3" L (d) in kg N/ha.year) cannow be calculated from equation (9) and thestocking rate (SR in SU/ha.year):NO3- L (d) = 2.0 * (e 0.06*FertNin )* S R ( J Q)
However, to account for nitrate leaching thatoccurs from N sources other than fertiliser N, thenitrate leaching results of Ledgard et al. (1996b)were also related to the total N input per stock unit,i.e., fertiliser plus fixed N input. In Ledgard's studythe average N2 fixation over 3 years for the ON,200N, and 400N was estimated at 174, 117, and 40kg N/ha.year, giving a total N input of 174, 332,and 453 kg N/ha.year, respectively. Using thesedata the exponential relationship between total Ninput and NO3" leaching per stock unit can beexpressed as follows:
NO3- L (d) = 0.9 * (e °-' *TotalNin )* S R ( J I)
where TotalNin is the total N input per stock unit(kgN/SU.year).
To estimate NO3- leaching from sheep farmingit was assumed NO3" leaching occurs from urinepatches and that NC>3~ leaching from sheep urinepatches occurs at a fixed percentage of that fromcattle urine patches. To calculate the ratio of NO3""leaching from sheep urine over cattle urine perstock unit, the following data from Williams &Haynes (1994) were used for cattle and sheep,respectively:
the number of urinations per animal per day are11 and 19;the areas covered by each urine patch are 0.38and 0.05 m2;the amounts of urine-N applied are equivalentto 37 and 29 g N/m2;the amounts of NC>3~ -N leached are 11% and6% of the urine-N applied.From these data, and from the 'excreta loss
factors' (EXlosSdairy and Exlosssheep, i.e., theproportion of urinations that were made outsidethe productive area of the pasture; Table 4) itfollows that for cattle and sheep, respectively:
the total pasture areas covered by urine are(l-EXlossdairy)*4.2 and (l-EXlosssheep)*0.95 m2
per animal per day (assuming no overlap);the total amounts of urine-N applied to thepasture are (l-EXlossdajry)*155 and(l-EXlosssheep)*27 g N per animal per day;the total amounts of NC>3~ -N leached are(l-EXlossdairy)*17 and (l-EXlosssheep)*1.6 gN per animal per day.
Dow
nloa
ded
by [
UO
V U
nive
rsity
of
Ovi
edo]
at 0
1:32
04
Nov
embe
r 20
14
550 New Zealand Journal of Agricultural Research, 1997, Vol. 40
Assuming that cattle represent the equivalentof 6 stock units per animal, it follows that:
the total amounts of NC>3~-N leached from thepasture are (l-EXlossdajry)*2.8 and (1-EXlosssheeP)*l-6 g N per SU per day, and theamount of NC>3~ -N leached from sheep urine isabout 63% of the amount leached from cattleurine.Incorporating this percentage into equations (10)
and (11) gives:N(>f L (S) = 0.63 * 2.0 * (e 0.06'FertNin )* S R ( 1 2 )
andNO3" L (s) = 0.63 * 0.9 * (e o.i*TotaiNin)* S R ( 1 3 )
where NO3" L (s) is the total amount of NO3"leached under sheep farming (kg N/ha.year),FertNin is the fertiliser N input per stock unit (kgN/SU.year), TotalNin is the total N input per stockunit (kg N/SU.year), and SR is the stocking rate(SU/ha.year).
To test the accuracy of equations (10) to (13)for predicting NC>3~ leaching, the results of thestudies by Lambert et al. (1985), Brock et al. (1990),
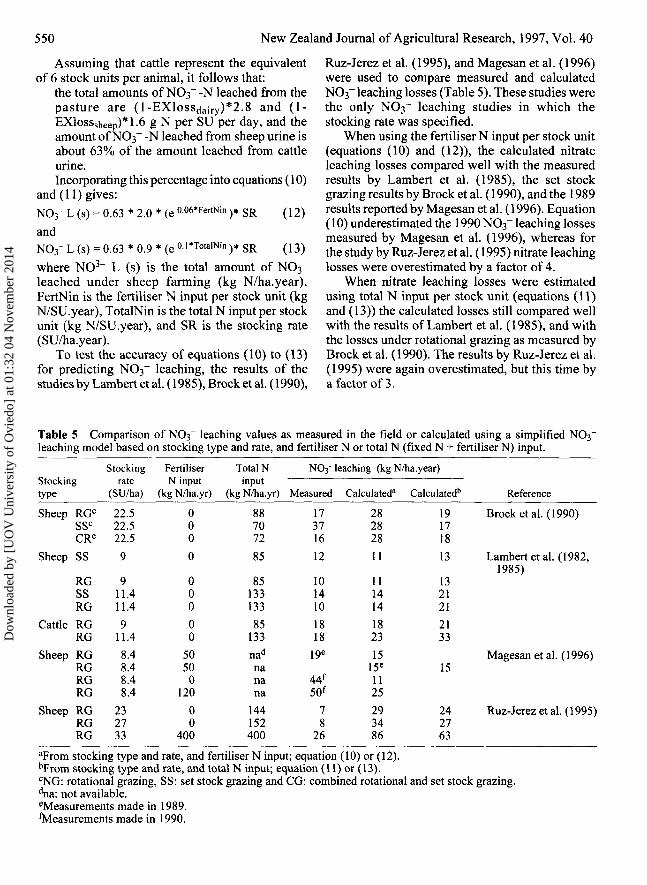
Ruz-Jerez et al. (1995), and Magesan et al. (1996)were used to compare measured and calculatedNO3"" leaching losses (Table 5). These studies werethe only NC>3~ leaching studies in which thestocking rate was specified.
When using the fertiliser N input per stock unit(equations (10) and (12)), the calculated nitrateleaching losses compared well with the measuredresults by Lambert et al. (1985), the set stockgrazing results by Brock et al. (1990), and the 1989results reported by Magesan et al. (1996). Equation(10) underestimated the 1990 NO3" leaching lossesmeasured by Magesan et al. (1996), whereas forthe study by Ruz-Jerez et al. (1995) nitrate leachinglosses were overestimated by a factor of 4.
When nitrate leaching losses were estimatedusing total N input per stock unit (equations (11)and (13)) the calculated losses still compared wellwith the results of Lambert et al. (1985), and withthe losses under rotational grazing as measured byBrock et al. (1990). The results by Ruz-Jerez et al.(1995) were again overestimated, but this time bya factor of 3.
Table 5 Comparison of NO3 leaching values as measured in the field or calculated using a simplified NC>3~leaching model based on stocking type and rate, and fertiliser N or total N (fixed N + fertiliser N) input.
Stockingtype
Sheep
Sheep
Cattle
Sheep
Sheep
RGC
SSC
CRC
SS
RGSSRG
RGRG
RGRGRGRG
RGRGRG
Stocking
rate(SU/ha)
22.522.522.5
9
911.411.4
911.4
8.48.48.48.4
232733
Fertiliser
N input(kg N/ha.yr)
000
0
000
00
50500
120
00
400
Total N
input(kg N/ha.yr)
887072
85
85133133
85133
nad
nanana
144152400
NO3"
Measured
173716
12
101410
1818
19e
44f
50f
78
26
leaching (kg N/ha.year)
Calculateda
282828
11
111414
1823
1515e
1125
293486
Calculated15
191718
13
132121
2133
15
242763
Reference
Brock etal. (1990)
Lambert etal. (1982,1985)
Magesan et al. (1996)
Ruz-Jerez etal. (1995)
aFrom stocking type and rate, and fertiliser N input; equation (10) or (12).bFrom stocking type and rate, and total N input; equation (11) or (13).°NG: rotational grazing, SS: set stock grazing and CG: combined rotational and set stock grazing.dna: not available.Measurements made in 1989.fMeasurements made in 1990.
Dow
nloa
ded
by [
UO
V U
nive
rsity
of
Ovi
edo]
at 0
1:32
04
Nov
embe
r 20
14

de Klein et al.—Soil acidification: a provisional model 551
Although equations (10) to (13) are only crudemodels for calculating NO3~ leaching losses, theygenerally provide reasonable estimates of nitrateleaching losses, with the equations based on totalN input per stock unit giving slightly better results.However, if N2 fixation data are not available,estimating nitrate leaching from fertiliser N inputper stock unit can give comparable results.
The difference between the measured and thecalculated losses in these studies is probably mainlyattributable to variables, such as drainage or rainfall,that were not included in the model but are likelyto have an impact on the amount of NO3~ leached.In the study by Ruz-Jerez et al. (1995), for example,the amount of drainage was about 250 mm,compared with about 600 mm in the study byLedgard et al. (1996a, 1996b). These results suggestthat a drainage or rainfall parameter needs to beincluded in a further development of the NC>3~leaching model. In addition, the results by Brock etal. (1990) and Lambert et al. (1985) suggest thatgrazing management is another parameter that canaffect nitrate leaching losses and should beconsidered for inclusion into a future model.
From the estimates of NC>3~ leaching and theamount and form of N input to the system, the netamount of acidity resulting from NC>3~ leaching(AANCB in kmolc/ha) can be calculated as follows(Table 2):
AANO3 = 0.07 * (N2 fix/total N) * NO3" L+ 0.07 * (urea/total N) * NO3- L+ 0.14 * (NH4
+/total N) * NO3" L+ 0.07 * (OrgN/total N) * NO3- L (14)
where, N2 fix, urea, NH4"1" , OrgN, and total N arethe amounts of N2 fixation, urea application, NH4"1"application, soil organic N mineralisation, and totalN input, respectively, and NO3~ L is the amount ofNO3" leached; all units in kg N/ha. Total N input =N2 fix + urea + NH4
+ + NO3" + OrgN.
Sub-model 3: Fertiliser-induced acidificationThe effect of N fertilisers on soil acidificationneeds to be considered in light of all the H+
consuming and producing processes (Table 1). Thenet acidifying effect of N fertilisers depends on theform in which N is lost from the system (Table 2).The N loss processes are largely affected by thegrazing animal and the soil acidification occurringfrom these processes is included in the animal-induced acidification sub-model.
P and S fertilisers can have both a direct and anindirect effect on soil acidification, which has been
discussed above. The indirect effects of P and Sfertilisers result mainly from their effect on herbageproduction and soil organic matter accumulationand are included in the SOM-induced and theanimal-induced acidification. The direct effect ofP and S fertilisers on soil acidification, because oftheir interaction with the soil solution, can becalculated from the amount and the form of fertiliserused (Table 6):
AAFERT = jt*P + o*S (15)
where, n and a are the acidity produced per kg of Pand S fertiliser, respectively (kmol H+/kg P or S;see Table 6), and P and S are the amounts offertiliser applied (kg P or S/ha).
Total soil acidificationThe total soil acidification (AAJOT in kmolc/ha)can now be calculated from the summation of theSOM-induced, the animal-induced and thefertiliser-induced acidification:
AATOT = + AANUT + AANO3 + AAFERT (16)
Case studiesData from a ryegrass cutting trial at AgResearchWoodlands (Monaghan et al. 1996), and from along-term trial at Winchmore (Nguyen et al. 1989;Nguyen 1990), were used to test the theory and torun the model.
Case study 1
In January 1995, a trial was established atAgResearch Woodlands to examine ryegrass yield
Table 6 Proton production from the direct interactionof various fertilisers with the soil solution.
Fertiliser form
P fertilisersSuperphosphateSingle superphosphate containing
14% H3PO4-PMono-calcium phosphateDi-calcium phosphateMono-ammonium phosphate3
Di-ammonium phosphatea
Reactive phosphate rock
S fertilisersSuperphosphateCalcium sulphateElemental S
H+ production
kmol H+/kg P0
0.0040
-0.0320
-0.032-0.064
kmol H+/kg S00
0.063aH+ production from phosphate ion only.
Dow
nloa
ded
by [
UO
V U
nive
rsity
of
Ovi
edo]
at 0
1:32
04
Nov
embe
r 20
14
552 New Zealand Journal of Agricultural Research, 1997, Vol. 40
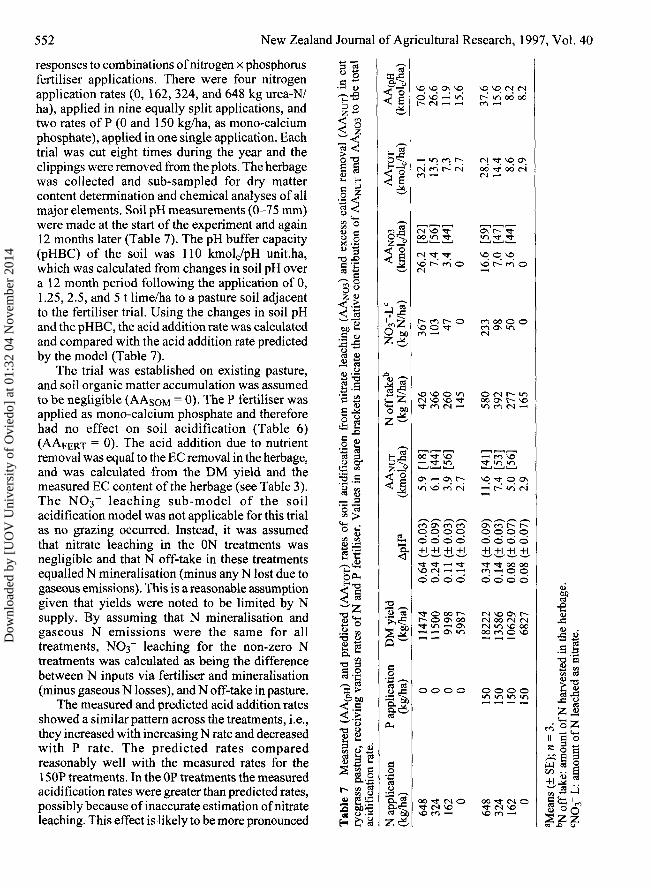
responses to combinations of nitrogen X phosphorusfertiliser applications. There were four nitrogenapplication rates (0, 162, 324, and 648 kg urea-N/ha), applied in nine equally split applications, andtwo rates of P (0 and 150 kg/ha, as mono-calciumphosphate), applied in one single application. Eachtrial was cut eight times during the year and theclippings were removed from the plots. The herbagewas collected and sub-sampled for dry mattercontent determination and chemical analyses of allmajor elements. Soil pH measurements (0-75 mm)were made at the start of the experiment and again12 months later (Table 7). The pH buffer capacity(pHBC) of the soil was 110 kmolc/pH unit.ha,which was calculated from changes in soil pH overa 12 month period following the application of 0,1.25, 2.5, and 5 t lime/ha to a pasture soil adjacentto the fertiliser trial. Using the changes in soil pHand the pHBC, the acid addition rate was calculatedand compared with the acid addition rate predictedby the model (Table 7).
The trial was established on existing pasture,and soil organic matter accumulation was assumedto be negligible (AASOM
= 0). The P fertiliser wasapplied as mono-calcium phosphate and thereforehad no effect on soil acidification (Table 6)(AAFERT
= 0)- The acid addition due to nutrientremoval was equal to the EC removal in the herbage,and was calculated from the DM yield and themeasured EC content of the herbage (see Table 3).The NO3" leaching sub-model of the soilacidification model was not applicable for this trialas no grazing occurred. Instead, it was assumedthat nitrate leaching in the ON treatments wasnegligible and that N off-take in these treatmentsequalled N mineralisation (minus any N lost due togaseous emissions). This is a reasonable assumptiongiven that yields were noted to be limited by Nsupply. By assuming that N mineralisation andgaseous N emissions were the same for alltreatments, NO3" leaching for the non-zero Ntreatments was calculated as being the differencebetween N inputs via fertiliser and mineralisation(minus gaseous N losses), and N off-take in pasture.
The measured and predicted acid addition ratesshowed a similar pattern across the treatments, i.e.,they increased with increasing N rate and decreasedwith P rate. The predicted rates comparedreasonably well with the measured rates for the150P treatments. In the OP treatments the measuredacidification rates were greater than predicted rates,possibly because of inaccurate estimation of nitrateleaching. This effect is likely to be more pronounced
•if
0 0 <-5 «
2 !
Is -S5 «
o 1-
P
n-g-2 5"3-9<-.£;'—' <u
13 g
m r
ate.
acid
inc
Xferur
o
im
QZ
£N
o:
II
IO
ta
>5
(km
olc
IC,O
"a
z(k
g
"5Q
cou
" 3 .a .ntOH
ion
ts
N a
ppli
(km
ol
Xa.
1
(kg/
ha
O^c-^v» t^ m oo oor- tN -1 -1 m —
32.
13.
th
[44]
28.
O\I
so
14.
o
OO CN
[44]
^O
m 1
o r-4OO O \
18]
ON
oo+1
SO
o
44]
,
ONO
±0
So
56]
ON
moo+1^o
mo ±
0
o
SO
—
C N
oo+ 1• " *
oo+ 1
o o
56]
o ON
w-i rsi
oo+100
oo
OO+100
oo
CN SO ON I - .(N OO CN (N
oooo OOOO
SOcs voCl —1
op
• 9 . 1
di
II C OKg I
S 1
Dow
nloa
ded
by [
UO
V U
nive
rsity
of
Ovi
edo]
at 0
1:32
04
Nov
embe
r 20
14

de Klein et al.—Soil acidification: a provisional model 553
at the 0 P rate, where large amounts of surplus Nwere expected because P was limiting pasturegrowth, and thus N uptake. In general, nitrateleaching and EC removal generated approximatelyequal amounts of acidity. However, in the 648N-OP treatment, where P limitation was likely to bemost pronounced, the N surplus was largest andabout 80% of the total acidification was due tonitrate leaching. In contrast, in the 648N-150Ptreatment, the DM yield increased substantiallycompared with the OP, resulting in an increase inEC removal and a decrease in nitrate leaching.
Case study 2
In 1952, a long-term grazing trial was establishedat Winchmore Research Station, in a 2-year-oldpasture sown with perennial ryegrass and whiteclover (Nguyen et al. 1989). Super-phosphate
fertiliser was applied annually at 3 rates: 0, 188,and 376 kg/ha. In 1972, each treatment received alime application of 4 t/ha. Data from this trial wereused to run the acidification model and to comparethe predicted acid addition rates with measuredrates, which were calculated from observed changesin soil pH and the pHBC (Table 8). The pHBC ofthe soil was calculated from the pH increase (from5.9 to 6.6) following the application of 4 tonnes oflime/ha (i.e., 80 kmolc/ha) in 1972, and estimatedat 80/0.7 = 114 kmolc/ha per pH unit.
The predicted acid addition rates were 1.46,3.42, and 3.83 kmolc/ha.year for 0, 188, and 376kg super/ha.year, respectively. In the 0 supertreatment, the 3 components of soil acidificationcontributed approximately equally to the total acidaddition rate. In the 188 and 376 super treatments,the relative contribution of soil organic matter
Table 8 Soil acidification rates in sheep grazed pastures receiving 3 rate of superphosphate fertiliser (0, 188, 376kg super/ha.year) from 1952 to 1987.
Variables
Organic Matter tl (kg/kg)Organic Matter t2 (kg/kg)pHtlpHt2BD (kg/dm3)Volume (dm3/ha)SR (SU/ha.year)CC (kg/kg DM)EXloss (kg/kg)ECc (kmolc/kg DM)ECg (kmolc/kg DM)NO3~ L (kg N/ha.year)
Control
0.04670.0655
6.155.90.9
750 0006
0.130.15
0.001430.00044
8
188 Super
0.04650.0707
6.155.80.9
750 00014
0.260.15
0.001430.00044
20
376 Super
0.04570.0707
6.155.80.9
750 00016
0.260.15
0.001430.00044
22
Source
Nguyen (1990)Nguyen & Goh (1992b)Metherell pers. comm.Nguyen & Goh (1992b)Metherell pers. comm.
Nguyen etal. (1989)Rickard & McBride (1987)Table 4Table 3Table 3Equation (12)
EquationsAASOM = BD * V * 0.00035 * (pHu-3) * (SOMt2 - SOMti)/yearsAANUT (s) = [EXloss * 0.85 * 550 * (CC*ECc + (l-CC)*ECg) + 0.15 * 550 *(CC*ECc + (l-CC)*ECg)] * SRAAN03 = 0.07 * (N2 fix/total N) * NO3" LAAT 0 T = AASOM + AANUT + AANO3
Acid addition from model Control 188 Super 376 Super
AASOM (kmolc/ha.year)AANUT (kmolc/ha.year)AANCO (kmolc/ha.year)
AATOT (kmolc/ha.year)
Acid addition from (pH
0.400.500.56
1.46
Control
0.511.521.39
3.42
188 Super
0.531.721.57
3.83
376 Super Source
(pH (pH units/year) -0.007 -0.010 -0.010pHBC (kmol H+/ha7 5cm.pH) 114 114 114AA(pH (kmolc/ha.year) 0.80 1.14 1.14Added lime (kmolc/ha.year) 2.29 2.29 2.29
(kmolc/ha.year) 3.09 3.43 3.43
see text= (pH x pHBCNguyen etal. (1989)
Dow
nloa
ded
by [
UO
V U
nive
rsity
of
Ovi
edo]
at 0
1:32
04
Nov
embe
r 20
14

554 New Zealand Journal of Agricultural Research, 1997, Vol. 40
accumulation, nitrate leaching, and nutrient transferto the total acidification was about 1 : 3 : 3 .
The acid addition rates calculated from themeasured pH change and the pHBC (AA ( PH) were0.80 and 1.14 kmolc/ha.year, for the control andboth super treatments, respectively. However, anadditional 2.29 kmolc/ha.year would have beenrequired to counterbalance the added lime, whichsuggested a total acid addition of 3.09 and 3.43kmolc/ha.year, for the control and super treatments,respectively. These values compared reasonablywell with the model calculations, although themodel predicted a lower acid addition rate for thecontrol treatment. As stocking rate is the maininput variable in the model, the differences in thepredicted acidification rates between the treatmentsare largely a result of the greater stock numbers inthe super treatments. The modelled acid additionrates per stock unit were the same for all treat-ments: 0.24 kmolc/SU.year. This stocking rate effecton soil acidification was not reflected in theobserved changes in soil pH, which resulted in onlysmall differences in AA A P H between the treatments.
Another possible explanation for the differencebetween the modelled and the measured acidaddition rate in the control treatment could be thatthe values of the variables used in the model actuallydiffered between the treatments. For example, databy Nguyen & Goh (1992a), suggested that the'excreta loss factor' (EXloss) in the controltreatment was much higher than in the supertreatments (0.25 compared with 0.16, respectively),while the model uses the same value for eachtreatment (0.15). However, even when these valueswere used in the calculations, the predicted acidaddition rate for the control treatment was 1.76kmolc/ha.year, which is still well below theacidification rate calculated from the change insoil pH.
CONCLUSIONS
The presented soil acidification model calculatessoil acidification rates from the soil organic matter-induced, the animal-induced, and the fertiliser-induced acidification, and uses easily obtainableparameters as input variables.
The soil organic matter-induced acidificationis calculated from the soil organic matteraccumulation and the initial soil pH. Although atruly predictive soil acidification model shouldinclude a sub-model for estimating the rate of soilorganic matter accumulation, the development of a
relatively simple sub-model proved to be impossibleat this stage and actual data on the rate of SOMaccumulation are required for the calculation.
The sub-model for calculating the animal-induced acidification includes components forestimating acidification from nutrient transfer/removal (AANUT) andNC>3~ leaching (AAN03) anduses stocking rate and type, topography of thefarm, clover content of the herbage, and fertiliseror total N input. For dairying, milk production perstock unit is also used as an input variable. TheAANUT is calculated by assuming that the dominantclover species is white clover, which has an excesscation content of 1.43 molc/kg DM, and that theremaining herbage consists mainly of perennialryegrass, with an excess cation content of 0.44molc/kg DM. Further studies of the excess cationcontent of the various herbage components areneeded to investigate the validity of theseassumptions. The current crude NC>3~ leachingmodel predicted NC>3~ leaching reasonably well,but the AANC>3 estimations can be improved byfurther development of the NO3" leaching model,which is likely to include the incorporation ofrainfall or drainage as input variables.
The fertiliser-induced acidification is calculatedfrom the amount and form of P and S fertilisersused. The acidifying effect of N fertilisers shouldbe considered in light of all N processes in thesystem and is incorporated into the animal-inducedsub-model.
Although the data from the ryegrass cuttingtrial could not be used to fully test the model, thedata did indicate the importance of excess cationremoval and nitrate leaching as acidifyingprocesses. The data from the Winchmore trialshowed that the model predicted acidification ratesreasonably well, although the model predicted alower rate for the control treatment. The differencesin the predicted values between the treatments werelargely determined by stocking rate, which was notreflected in measured differences in soil pH change.
In conclusion, the results show that the tentativemodel predicted soil acidification rates reasonablywell. Further development is needed to include asub-model for estimating SOM accumulation ratesand to refine the relationships within the existingsub-models, especially with regard to the nitrateleaching sub-model. In addition, accurateinformation on the pHBC of soils is needed toconvert soil pH change into acid addition rate,which will be crucial for validating the soilacidification model.
Dow
nloa
ded
by [
UO
V U
nive
rsity
of
Ovi
edo]
at 0
1:32
04
Nov
embe
r 20
14

de Klein et al.—Soil acidification: a provisional model 555
ACKNOWLEDGMENTS
We thank A. K. Metherell and R. A. Carran for helpfulcomments on a draft version of the paper, A. K. Metherellfor providing some of the Winchmore data, and theFoundation for Research, Science and Technology forfinancial support.
REFERENCES
Bolan, N. S.; Hedley, M. J.; White, R. E. 1991: Processesof soil acidification during nitrogen cycling withemphasis on legume based pastures. Plant andsoil 134: 53-63.
Brock, J. L.; Ball, P. R.; Carran, R. A. 1990: Impacts ofmanagement on leaching of nitrate from pastures.Proceedings of the New Zealand GrasslandsAssociation 52: 207-210.
Carran, R. A.; Theobald, P. W. 1995: Nitrogen cycleprocesses and acidification of soils in grazedpastures receiving or not receiving excreta for23 years. Australian journal of soil research 33:525-534.
Dijkshoorn, W. 1957: A note on the cation-anionrelationships in perennial ryegrass. Netherlandsjournal of agricultural science 5: 81-85.
Dolling, P. J.; Porter, W. M ; Rowland, I. C. 1994:Acidification rates in the central wheatbelt ofWestern Australia. 2. On a deep yellow sand.Australian journal of experimental agriculture34: 1165-1172.
Edmeades, D. C.; Wheeler, D. M.; Waller, J. E. 1985:Comparison of methods for determining limerequirements of New Zealand soils. New Zealandjournal of agricultural research 28: 93-100.
Edmeades, D. C.; Pringle, R. M.; Shannon, P. W.;Mansell, G. P. 1984: Effects of lime on pastureproduction on soils in the North Island of NewZealand. 4. Predicting lime responses. NewZealand journal of agricultural research 27:371-382.
Field, T. R. O.; Theobald, P. W.; Ball, P. R.; Clothier,B. E. 1985: Leaching losses of nitrate from cattleurine applied to a lysimeter. ProceedingsAgronomy Society of New Zealand 15: 137-141.
Goh, K. M.; Haynes, R. J.; Kee, K. K. 1979: Ionicbalance and composition of perennial ryegrass(Lolium perenne L.) as influenced by nitrogenand sulphur fertilisation. New Zealand journalof agricultural research 22: 319-327.
Haynes, R. J. 1983: Soil acidification induced byleguminous crops. Grass and forage science 38:1-11.
Helling, C. S.; Chesters, G.; Corey, R. B. 1964:Contribution of organic matter and clay to soilcation-exchange capacity as affected by the pHof the saturating solution. Soil Science Societyof America proceedings 28: 517-520.
Helyar, K. R. 1976: Nitrogen cycling and soilacidification. The journal of the AustralianInstitute of Agricultural Science 42: 217-221.
Helyar, K. R.; Porter, W. M. 1989: Soil acidification, itsmeasurement and the processes involved. In:Robson, A. D. ed. Soil acidity and plant growth.Marrickville, Academic Press. Pp. 61-101.
Jarvis, S. C ; Robson, A. D. 1983a: The effects ofnitrogen nutrition of plants on the developmentof acidity in Western Australian soils. I Effectswith subterranean clover grown under leachingconditions. Australian journal of agriculturalresearch 34: 341-353.
Jarvis, S. C.; Robson, A. D. 1983b: The effects ofnitrogen nutrition of plants on the developmentof acidity in Western Australian soils. II Effectsof differences in cation/anion balance betweenplant species grown under non-leachingconditions. Australian journal of agriculturalresearch 34: 355-365.
Jarvis, S. C.; Robson, A. D. 1983c: A comparison of thecation/anion balance often cultivars of Trifoliumsubterraneum L., and their effects on soil acidity.Plant and soil 75: 235-243.
Jennes, R.; Patton, S. 1959: Principles of dairy chemistry.New York, Wiley & Sons.
Kononova, M. M. 1966: Soil organic matter. Its nature,its role in soil formation and in soil fertility.London, Pergamon Press.
Lambert, M. G.; Luscombe, P. C.; Clark, D. A. 1982:Soil fertility and hill country production.Proceedings of the New Zealand GrasslandAssociation 43: 153-160.
Lambert, M. G.; Devantier, B. P.; Nes, P.; Penny, P. E.1985: Losses of nitrogen, phosphorus andsediment in runoff from hill country underdifferent fertilizer and grazing managementregimes. New Zealand journal of agriculturalresearch 28: 371-379.
Ledgard, S. F.; Penno, J. W.; Sprosen, M. S. 1997:Nitrogen balances and losses on intensive dairyfarms. Proceedings of the New ZealandGrassland Association 59.
Ledgard, S. F.; Clark, D. A.; Sprosen, M. S.; Brier, G.J.; Nemaia, E. K. K. 1996a: Nitrogen lossesfrom grazed dairy pasture, as affected by nitrogenfertiliser application. Proceedings of the NewZealand Grassland Association 57: 21-25.
Ledgard, S. F.; Thom, E. R.; Singleton, P. L.; Thorrold,B. S.; Edmeades, D. C. 1996b: Environmentalimpacts of dairy systems. Ruakura FarmersConference Proceedings: 26-33.
Magesan, G. N.; White, R. E.; Scotter, D. R. 1996:Nitrate leaching from a drained, sheep-grazedpasture. I. Experimental results and environ-mental implications. Australian journal of soilresearch 34: 55-67.
Dow
nloa
ded
by [
UO
V U
nive
rsity
of
Ovi
edo]
at 0
1:32
04
Nov
embe
r 20
14

556 New Zealand Journal of Agricultural Research. 1997, Vol. 40
Mengel, K.; Steffens, D. 1982: Relationship betweencation/anion uptake of red clover and release ofprotons by the roots. Zeitschrift für Pflanzener-nahrung und Bodenkunde 145: 229-236.
Metherell, A. K.; Cole, C. V.; Parton, W. J. 1993:Dynamics and interactions of carbon, nitrogen,phosphorus and sulphur cycling in grazedpasture. Proceedings of the XVII InternationalGrassland Congress, New Zealand II. Pp.1420-1421.
Metherell, A. K.; McCall, D. G.; Woodward, S. J. R.1995: OUTLOOK™: A phosphorus fertiliserdecision support model for grazed pastures.Fertilizer & Lime Research Centre occasionalreport no. 8. Massey University, PalmerstonNorth. Pp. 24-39.
Monaghan, R. M.; Smith, L. C.; Sinclair, A. G. 1996:The effect of nitrogen fertiliser on soilacidification. Unpublished internal report,AgResearch Invermay Agricultural Centre,Mosgiel.
Nguyen, M. L. 1990: Sulphur cycling in soil-plant-animal systems under grazed, irrigated pasturesin Canterbury, New Zealand and its implicationson pasture sulphur requirements. UnpublishedPhD thesis, Lincoln University, Lincoln, NewZealand.
Nguyen, M. L.; Goh, K. M. 1992a: Nutrient cycling andlosses based on a mass-balance model in grazedpastures receiving long-term superphosphateapplications in New Zealand. 2. Sulphur. Journalof agricultural science 119: 107-122.
Nguyen, M. L.; Goh, K. M. 1992b: Status and distributionof soil sulphur fractions, total nitrogen andorganic carbon in camp and non-camp soils ofgrazed pastures supplied with long-termsuperphosphate. Biology and fertility of soils14: 181-190.
Nguyen, M. L.; Rickard, D. S.; McBride, S. D. 1989:Pasture production and changes in phosphorusand sulphur status in irrigated pastures receivinglong-term applications of superphosphatefertiliser. New Zealand journal of agriculturalresearch 32: 245-262.
Nyatsanga, T.; Pierre, W. H. 1973: Effect of nitrogenfixation by legumes on soil acidity. Agronomyjournal 65: 936-940.
Oenema, O. 1990: Calculated rates of soil acidificationof intensively used grassland in the Netherlands.Fertilizer research 26: 217-228.
Parfitt, R. L. 1992: Surface charge in some New Zealandsoils measured at typical ionic strength.Australian journal of soil research 30: 331-341.
Parfitt, R. L.; Giltrap, D. J.; Whitton, J. S. 1995:Contribution of organic matter and clay mineralsto the cation exchange capacity of soils.Communications in soil science & plant analysis26: 1343-1355.
Parfitt, R. L.; Percival, H. J.; Dahlgren, R. A.; Hill, F. F.1997: Soil and solution chemistry under pastureand radiata pine in New Zealand. Plant and soil191: 279-290.
Parton, W. J.; Schimel, D. S.; Cole, C. V.; Ojima, D. S.1987: Analysis of factors controlling soil organicmatter levels in Great Plains grasslands. SoilScience Society of America journal 51:1173-1179.
Rickard, D. S.; McBride, S. D. 1987: Long-termapplication and residual effects of super-phosphate and effects of reactive phosphate rockon irrigated pasture. Winchmore IrrigationResearch Station technical report no. 22.
Ridley, A. M.; Slatterly, W. J.; Helyar, K. R.; Cowling,A. 1990a: The importance of the carbon cycle toacidification of a grazed pasture. Australianjournal of experimental agriculture 30: 529-537.
Ridley, A. M.; Slatterly, W. J.; Helyar, K. R.; Cowling,A. 1990b: Acidification under grazed annualand perennial grass based pasture. Australianjournal of experimental agriculture 30: 539-544.
Ritchie, G. S. P. 1989: The chemical behaviour ofaluminium, hydrogen and manganese in acidsoils. In: Robson, A. D. ed. Soil acidity andplant growth. Marrickville, Academic Press. Pp.1-60.
Rosenthal, I. 1991: Milk and dairy products. Propertiesand processing. Weinheim, Balaban publishers.
Russell, E. W. 1988: Russell's soil condition and plantgrowth. 11th edition. Wild, A. ed. UK, LongmanScientific & Technical.
Ruz-Jerez, B. E.; White, R. E.; Ball, P. R. 1995: Acomparison of nitrate leaching under clover basedpastures and nitrogen-fertilised grass grazed bysheep. Journal of agricultural science 125:361-369.
Saggar, S.; MacKay, A. D.; Hedley, M. J.; Lambert, M.G.; Clark, D. A. 1990: A nutrient-transfer nodelto explain the fate of phosphorus and sulphur ina grazed hill-country pasture. Agriculture,ecosystems and environment 30: 295-315.
Sinclair, A. G. 1995: Modelling soil acidification inpastoral farming. In: Currie, L. D.; Loganathan,P. ed. Fertiliser requirements of grazed pastureand field crops. Palmerston North, Fertiliser andLime Research Centre, Massey University. Pp.198-205.
Sinclair, A. G.; Edmeades, D. C.; Ledgard, S. F. 1993:The influence of phosphorus, sulphur andnitrogen fertilisers on acidification in pastoralsoils. Proceedings of the New Zealand FertiliserManufacturers' Research AssociationConference. Pp. 106-116.
Van Breemen, N.; Mulder, J.; Driscoll, C. T. 1983:Acidification and alkalinization of soils. Plantand soil 75: 283-308.
Dow
nloa
ded
by [
UO
V U
nive
rsity
of
Ovi
edo]
at 0
1:32
04
Nov
embe
r 20
14

de Klein et al.—Soil acidification: a provisional model 557
Webb, B. H.; Johnson, A. H.; Alford, J. A. 1974:Fundamentals of dairy chemistry. Westport,Connecticut, The AVI Publishing Company.
Williams, P. H.; Haynes, R. J. 1994: Comparison ofinitial wetting pattern, nutrient concentrationsin soil solution and the fate of 15N-labelledurine in sheep and cattle urine patch areas ofpasture soil. Plant and soil 162: 49-59.
Zegwaard, K. 1995: Phosphorus losses from pasturedue to uneven dung distribution by grazing dairycows. Department of Earth Sciences, Universityof Waikato, Hamilton.
Dow
nloa
ded
by [
UO
V U
nive
rsity
of
Ovi
edo]
at 0
1:32
04
Nov
embe
r 20
14