socio-economic profile, pero & mero cfo forum 06 september 2013
TRANSCRIPT

Socio-economic Profile, PERO & MEROCFO Forum 06 SEPTEMBER 2013

2
REGIONAL DEVELOPMENT PROFILE: 2013

3
Regional Development Profile 2013
SECTION 1 BACKGROUND: REGIONAL DEVELOPMENT ROFILE 2013
SECTION 2 PURPOSE: REGIONAL DEVELOPMENT PROFILE 2013
SECTION 3 CONTENT: REGIONAL DEVELOPMENT PROFILE 2013
SECTION 4 SOURCES OF DATA: REGIONAL DEVELOPMENT PROFILE 2013
SECTION 5 STATUS QUO: REGIONAL DEVELOPMENT PROFILE 2013
SECTION 6 WAY FORWARD: REGIONAL DEVELOPMENT PROFILE 2013

4
Background: Regional Development Profile 2013
Legislative Mandate: Section 26 of the MSA
The Council’s vision for the long term development of it’s communities.
An assessment of the existing development in the municipality which includes communities that do not have access to basic municipal services.
Council’s development priorities and objectives which includes it’s economic development aims and it’s internal transformation needs.
Council’s development strategies which must be aligned with national and provincial sectoral plans.
A Financial plan, which must include a budget projection of at least three years.
The Key Performance Indicators and Performance targets as determined in terms of section 41 of the MSA 32 OF 2000.

5
Purpose: Regional Development Profile
Provide a regional perspective on the Metro, Districts and Municipalities.
Ensuring that the Metro, District and local municipalities understand the socio-economic reality for their respective regions.
Valuable insight can be gained as to the developmental challenges faced by communities within a specific municipal boundary.
Regional Development Profile to be used as a data tool that can ensure that the information obtained will lead and guide planning & budgetary processes within municipal environment.

6
CONTENT: Regional Development Profile 2013
Demographics 1.1 Population Size1.2 Age and Gender Distribution1.3 Population Groups
Social Development and Well-being 2.1 Education and Human Development2.2 Literacy2.3 Education attainment2.4 Learner Enrolment and drop-out rates2.5 Access to FET colleges2.6 No fee Schools
Health 3.1 Health Care facilities3.2 HIV/AIDS Treatment and Care3.3 Child Health3.4 Maternal Health3.5 Community Based Services
Crime 4.1 Safety and Security

7
CONTENT: Regional Development Profile 2013
Poverty and Inequality 5.1 Human Development Index5.2 People living in Poverty5.3 Indigent Households5.4 Gini Coefficient
Access to Municipal Services 6.1 Water6.2 Energy6.3 Sanitation6.4 Refuse Removal6.5 Roads
Economically Active Population 7.1 Labour Force7.2 Unemployment7.3 Unemployment Rate7.4 Employment by Sector
Finance and Resource Mobilisation 8.1 National and Provincial Transfers8.2 Provincial Payments and Estimates

8
CONTENT: Regional Development Profile 2013
Environmental Management 9.1 Regional Water Volumes and Losses9.2 Water Service Levels9.3 Water Quality9.4 Waste Water Treatment9.5 Spatial Planning9.6 Air Quality9.7 Climate Change

9
Sources of Data: Regional Development Profile
Statistics South Africa: Census 2001
Statistics South Africa: Census 2011
Quantec Data
Municipal Economic Review Outlook 2013
Sector Departments-Most Recent data

10
STATUS QUO: Regional Development Profile 2013
Released Regional Profiles 2012 November/December 2012
Invite municipalities to comment on content of Regional Profiles 2013
28 June 2013 and 01 July 2013
Forward Reminder to municipalities to comment on content or possible information required by municipalities on the Regional Development Profile 2013
10 July 2013
Received Inputs from municipalities on content of the Regional Development Profile 2013
13 July 2013
Data Collection and writing for 2013 Regional Development Profiles
August 2013-September 213

11
STATUS QUO: Regional Development Profile 2013
Released Regional Profiles 2012 November/December 2012
Release draft Regional Development Profile 2013 to the Metro/ Districts and Municipalities
September 2013
Roadshow on draft Regional Development Profiles-DCF/IDP Forum
October 2013
Invitation to municipalities to comment on draft Regional Development Profile 2013
October 2013
Incorporate inputs from municipalities into Regional Development Profile 2013
October 2013
Release Regional Development Profiles to Metro/Districts and Municipalities for planning purpose and alignment to Budget 2014/2015
15 November 2013

PERO 2013

13
PERO: WESTERN PROVINCIAL ECONOMIC REVIEW AND OUTLOOK
Annual research report which provides an objective review and analysis of past and estimated future economic growth and socio economic development of the Province.
Socio-economic scanning to provide an evidence-based platform to inform and guide provincial planning and budgeting.
Analytical reference point for the provincial economic development strategies and interventions.
Contextualizes the challenge of shifting towards a inclusive growth and development trajectory in the Province.
Informs budget policy formulation and hence the budget of the Western Cape.
The PERO is informed by provincial government policy initiatives while, although not producing recommendations, has some influence on policy decisions.

14
Focus: Provincial Economic Review and Outlook

15
Focus: Provincial Economic Review and Outlook
MERO 2013

17
CONTENT: MUNICIPAL ECONOMIC REVIEW OUTLOOK
CHAPTER 1 BACKGROUND AND OUTLINE OF REPORT
CHAPTER 2 ECONOMIC OUTLOOK
CHAPTER 3 SECTOR GROWTH, EMPLOYMENT AND SKILLS
CHAPTER 4 VALUE CHAINS
CHAPTER 5 INFORMAL SECTOR PROFILE
CHAPTER 6 INFRASTRUCTURE SPENDING

18
MERO: WC INDUSTRY COMPOSITION ACROSS DISTRICTS
19
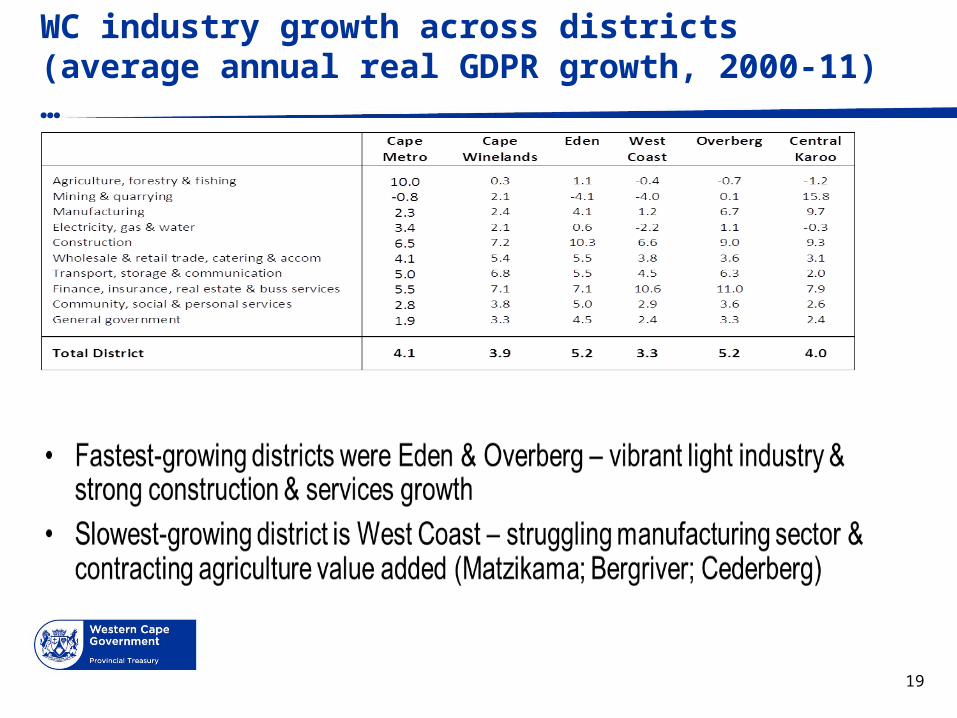
WC industry growth across districts (average annual real GDPR growth, 2000-11) …

Western CapeWestern Cape: Revealed comparative : Revealed comparative advantage across districts (2011: LQ > 1)advantage across districts (2011: LQ > 1)Cape Metro:•Tex, cloth & leather
•Tourism
•Finance, BPO, ICT
•‘Knowledge sector’
•Timber & furniture
Cape Winelands:•Agric & processing
•Tourism
•Building & construction
•Communications & ICT
West Coast:•Agric & processing
•Tourism
•Building & construction
Overberg:•Agric & processing
•Tourism
•Building & construction
•Timber & furniture
Eden:•Agric & processing
•Tourism
•Building & construction
•Timber & furniture
Central Karoo:•Agric & processing
•Tourism
•Building & construction
•Electrical machinery
•Finance & insurance

21
Business climate in informal sector: key points Sample of 200 spread across municipalities and towns
Age, gender and education/skills
Regulation: benefits of non-compliance > costs (there is some effort to comply, e.g. by one third of respondents in WCD)
Duration (e.g. WCD): 50% 1 to 5 years; 21% 6 to 10 years; 20% more than 10 years, implying high survival rate
Employment (e.g. WCD): 40% single owner; 40% = 1 + 1; one enterprise 11 employees

22
Infrastructure investment & district economic growth – salient points
Differences in infrastructure investment and maintenance lead to different economic growth outcomes (as economic theory predicts): E.g. West Coast:

23
% Share of agro-processing industry in District GDPR, 2010

24
Non-Metro agricultural real GDPR, 2000-11 (2000=100): sideways or contracting

© Western Cape Government 2012 |
WAY FORWARD: PERO & MERO
25
Provincial Top Management and Budget Policy Committee – September 2013
o Presentation on key findings and discussion
IDP Indaba – 16 September 2013
Cabinet – 2 October
o Presentation on key findings and discussion o Approval for publication
Tabling in Provincial Parliament by Minister of Finance, Economic Development and Tourism – 17 October 2013
Budget Committee in Provincial Parliament - 17 October 2013

Thank you