social ecology, university of vienna rapid metabolic change as a chance and a threat to...
Post on 21-Dec-2015
216 views
TRANSCRIPT
Social Ecology, University of Vienna
Rapid Metabolic Change as a Chance and a Threat to
Sustainability: The Case of Amazonia
Marina Fischer-Kowalski (Vienna) Norbert Fenzl (Belem)
José A. da Costa Machado (Manaus)Hercilio C. Bohorquez (Caracas)
Prepared for Open Meeting of the Global Environmental Change Research Community
Rio de Janeiro, Oct. 6-8, 2001

Social Ecology, University of Vienna
Preface The following presentation is based upon a preliminary analysis of data on Brazil and Venezuela generated within the EU-financed project “Amazonia 21” (http://www.amazonia21.org/). We related these data to national material flow accounts for various other countries, from various sources (among them most prominently: World Resources Institute: Adriaanse et al. 1997, Matthews et al. 2000). Our analysis aims at illustrating whether MFA is an adequate tool for issues of sustainability. The reader should be aware, though, that despite many efforts (see for example Steurer/Eurostat 2001) data reliability and comparability across countries is far from excellent, and so our conclusions should be considered rather as grounded hypotheses than as final, well established results. For a more elaborate discussion see Fischer-Kowalski & Amann 2001.
Social Ecology, University of Vienna
Overview
1. The Context: Amazonia 21
2. Metabolic Transition – what is that?
3. Metabolic transition in a globalized economy – Brazil and Venezuela
4. Is global trade driving environmental exploitation of the periphery?
5. Conclusions
Social Ecology, University of Vienna
1) The Context: Amazonia 21
• Ongoing EU-financed research – teams from Panamazonian Countries (PACs) and Europe participating
• Response to Agenda 21-setting by PAC, searching for less destructive ways of economic development
• Is material flow analysis an adequate tool to define sustainable development, and develop strategies, for PAC?
Social Ecology, University of Vienna
2) Metabolic transition – what is that?
• Metabolic transition: major change in socio-ecological regime
• It implies a qualitative transformation of the mode of subsistence of a society, and therefore of the society – nature interrelation
• Core: change in energy metabolism
Social Ecology, University of Vienna
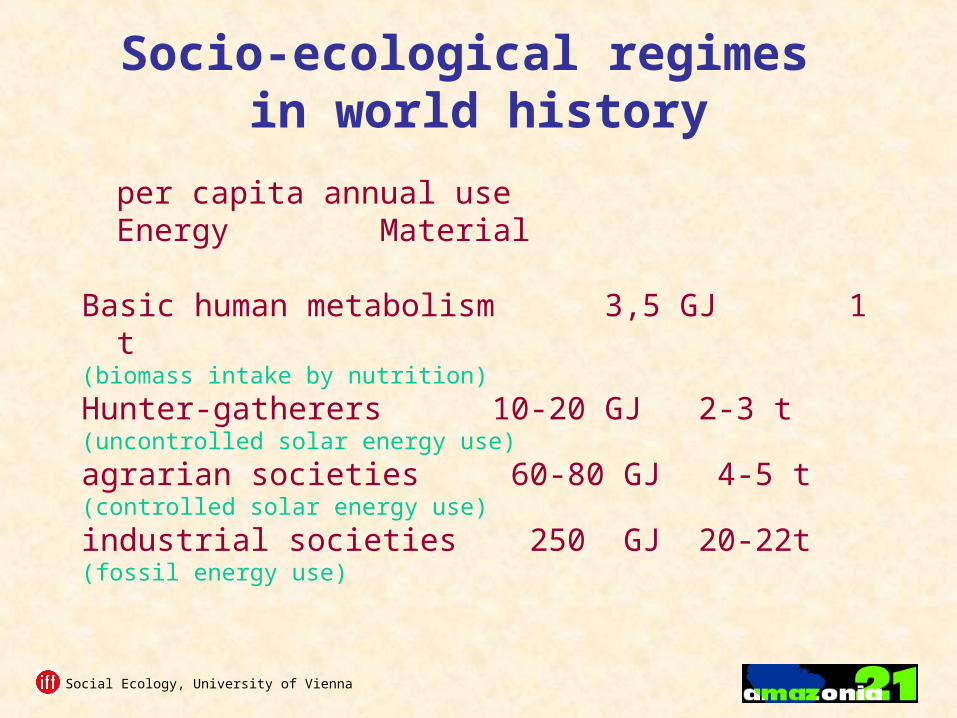
Socio-ecological regimes in world history
per capita annual useEnergy Material
Basic human metabolism 3,5 GJ 1 t(biomass intake by nutrition)
Hunter-gatherers 10-20 GJ 2-3 t(uncontrolled solar energy use)
agrarian societies 60-80 GJ 4-5 t(controlled solar energy use)
industrial societies 250 GJ 20-22t(fossil energy use)

Social Ecology, University of Vienna
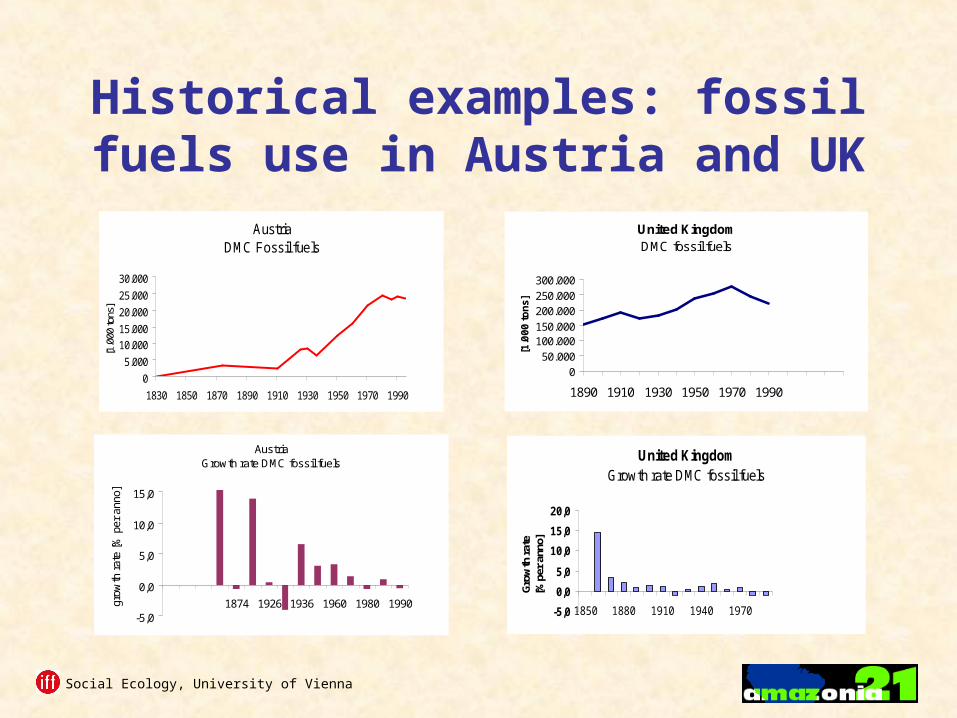
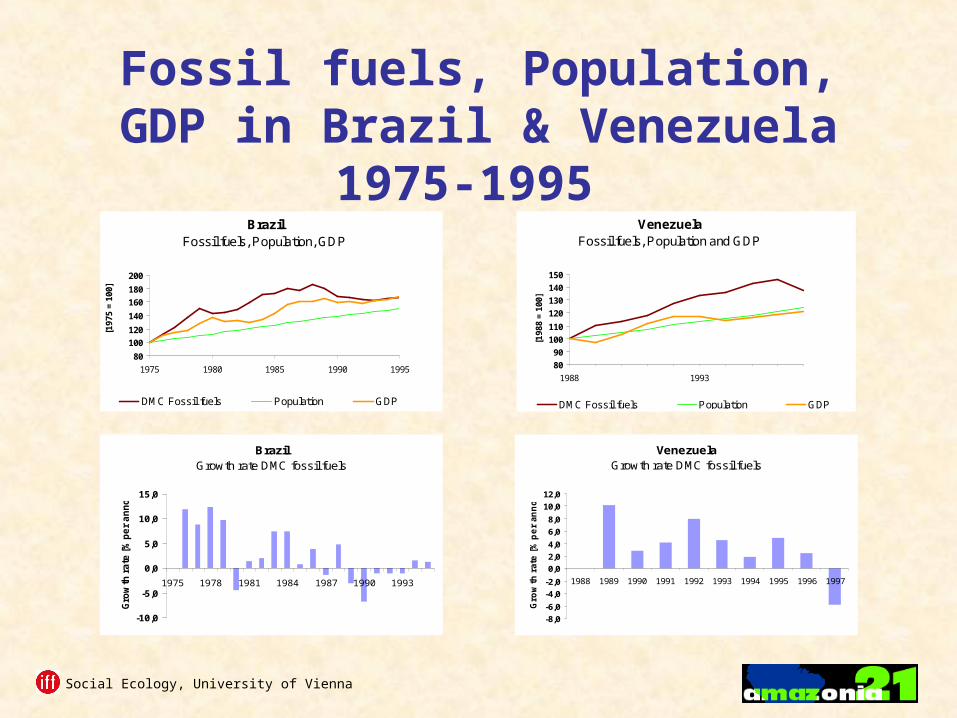
In history: Symptoms of Metabolic transition from
agrarian to industrial mode
• Rapid increase in fossil energy use
• Rapid population growth
• Rapid increase in income (GDP)
Social Ecology, University of Vienna
Historical examples: fossil fuels use in Austria and UK
United KingdomDMC fossil fuels
050.000
100.000150.000200.000250.000300.000
1890 1910 1930 1950 1970 1990
[1.0
00
to
ns
]
AustriaGrowth rate DMC fossil fuels
-5,0
0,0
5,0
10,0
15,0
1874 1926 1936 1960 1980 1990grow
th r
ate
[% p
er a
nno]
United KingdomGrowth rate DMC fossil fuels
-5,0
0,0
5,0
10,0
15,0
20,0
1850 1880 1910 1940 1970
Gro
wth
rat
e[%
per
ann
o]
AustriaDMC Fossil fuels
0
5.000
10.000
15.000
20.000
25.000
30.000
1830 1850 1870 1890 1910 1930 1950 1970 1990
[1.0
00 to
ns]
Social Ecology, University of Vienna
Fossil fuels, Population, GDP in Brazil & Venezuela 1975-1995
BrazilFossil fuels, Population, GDP
80
100
120
140
160
180
200
1975 1980 1985 1990 1995
[197
5 =
100]
DMC Fossil fuels Population GDP
VenezuelaFossil fuels, Population and GDP
80
90
100
110
120
130
140
150
1988 1993
[198
8 =
100]
DMC Fossil fuels Population GDP
BrazilGrowth rate DMC fossil fuels
-10,0
-5,0
0,0
5,0
10,0
15,0
1975 1978 1981 1984 1987 1990 1993
Gro
wth
ra
te [
% p
er
an
no
]
VenezuelaGrowth rate DMC fossil fuels
-8,0
-6,0
-4,0
-2,0
0,0
2,0
4,0
6,0
8,0
10,0
12,0
1988 1989 1990 1991 1992 1993 1994 1995 1996 1997
Gro
wth
rate
[%
pe
r an
no
]
Social Ecology, University of Vienna
In history: Symptoms of metabolic transition from agrarian to industrial mode continued...
• Relief on agricultural and forestry land use
• Per capita levels energy & materials use = transition from agrarian to industrial level
Social Ecology, University of Vienna
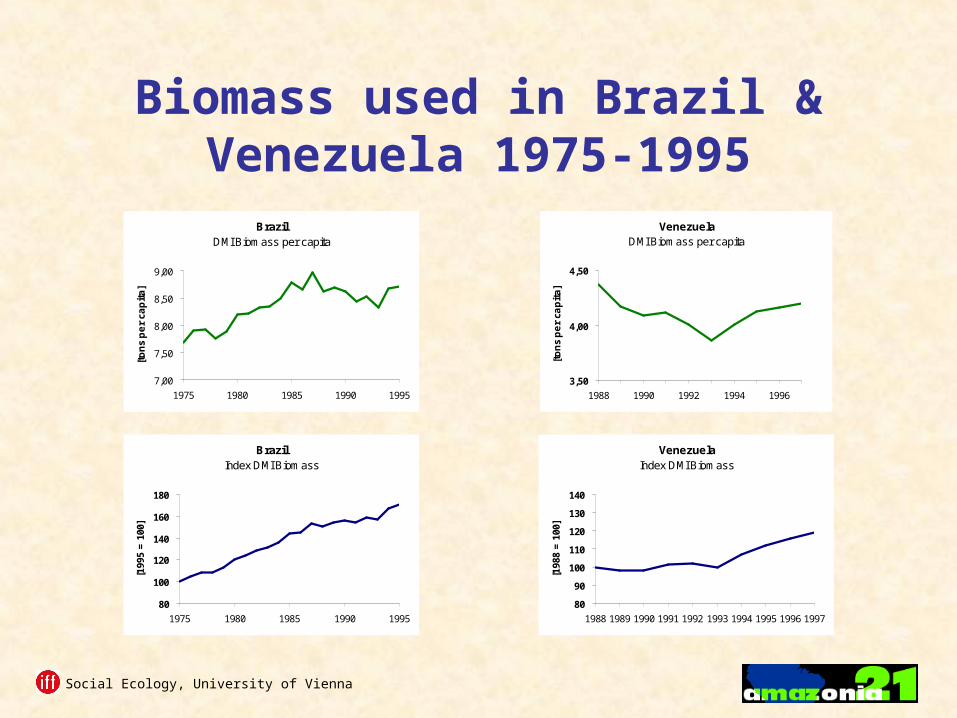
Biomass used in Brazil & Venezuela 1975-1995
BrazilDMI Biomass per capita
7,00
7,50
8,00
8,50
9,00
1975 1980 1985 1990 1995
[to
ns
pe
r ca
pit
a]
VenezuelaDMI Biomass per capita
3,50
4,00
4,50
1988 1990 1992 1994 1996
[to
ns
pe
r ca
pit
a]
BrazilIndex DMI Biomass
80
100
120
140
160
180
1975 1980 1985 1990 1995
[199
5 =
100
]
VenezuelaIndex DMI Biomass
80
90
100
110
120
130
140
1988 1989 1990 1991 1992 1993 1994 1995 1996 1997
[198
8 =
100
]
Social Ecology, University of Vienna
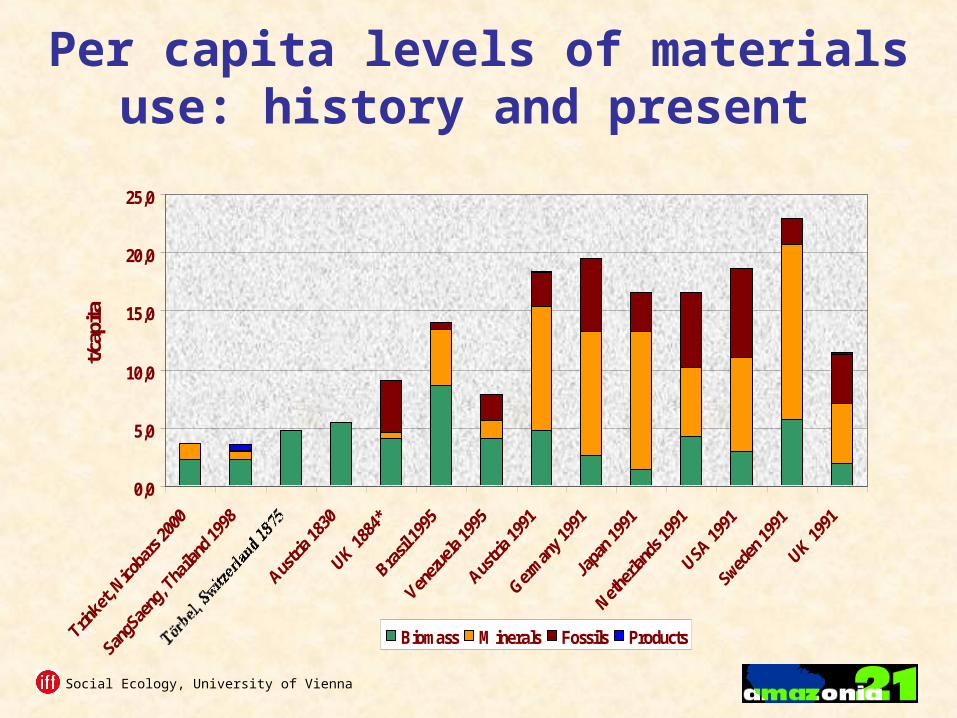
Per capita levels of materials use: history and present
0,0
5,0
10,0
15,0
20,0
25,0
t/capita
Biomass Minerals Fossils Products

Social Ecology, University of Vienna
3) Metabolic transition now: Symptoms of „extractive
economies“
• Intensification of agriculture and forestry, increasing pressure on land
• High per capita materials and energy use
• Very high materials intensity of the economy (tons per unit GDP)
Social Ecology, University of Vienna
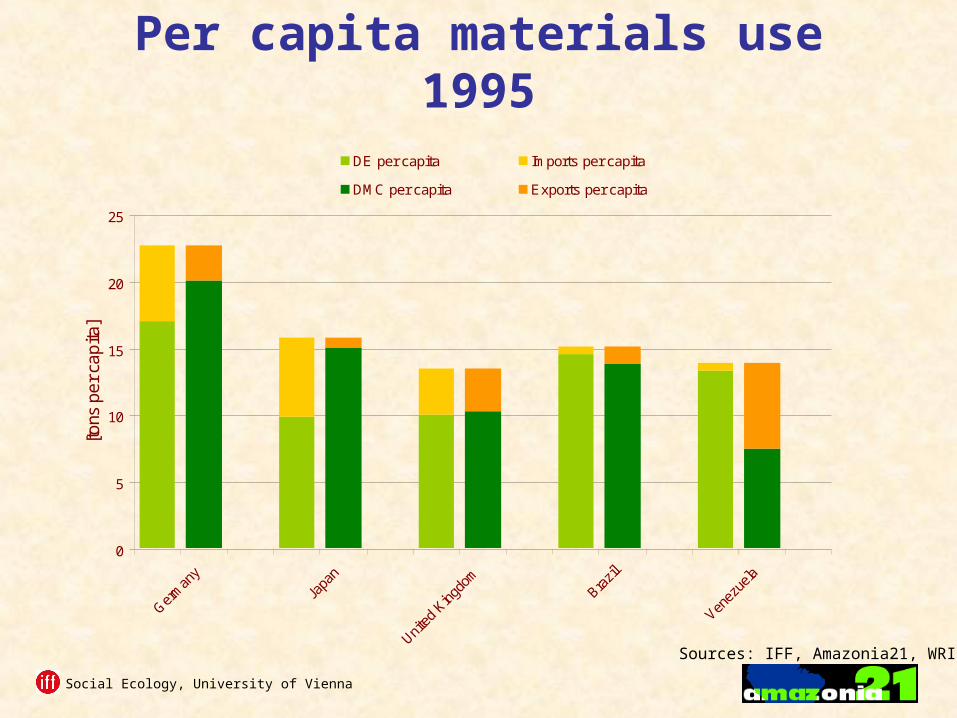
Per capita materials use 1995
Sources: IFF, Amazonia21, WRI
0
5
10
15
20
25
Germ
any
Japa
n
United
King
dom
Brazil
Venez
uela
[tons
pe
r ca
pita
]
DE per capita Imports per capita
DMC per capita Exports per capita

Social Ecology, University of Vienna
Per capita income, 1995
Sources: World Bank
0
5
10
15
20
25
Germany United Kingdom Japan Sweden Brazil Venezuela
[In
t$ (
PP
P)
pe
r c
ap
ita
]
GDP per capita

Social Ecology, University of Vienna
Material Intensity 1995
Sources: IFF, Amazonia21, WRI, World Bank
0
500
1.000
1.500
2.000
2.500
3.000G
erm
any
Japa
n
Uni
ted
Kin
gdom
Bra
zil
Ven
ezue
la
[tons
pe
r 1
.00
0 In
t$ (
PP
P)]
DMI per unit GDP
DMC per unit GDP
Social Ecology, University of Vienna
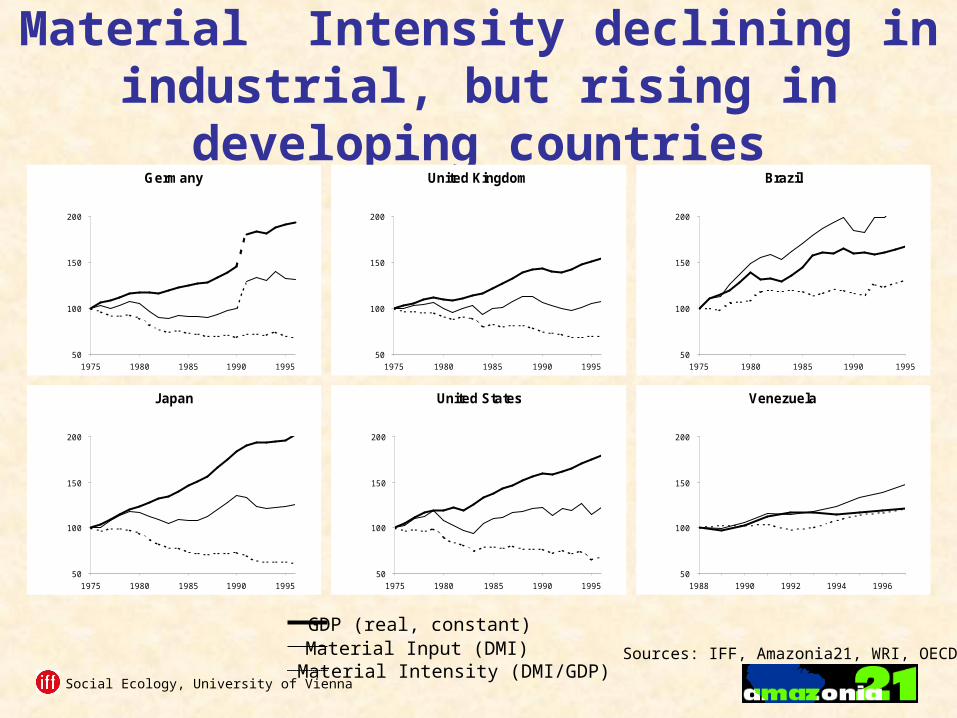
Metabolic transitions in the globalized economy
• Declining material intensity in the industrial core countries
• Alarming: Rising materials intensity at the periphery („extractive economies“)
• Rich industrial countries externalize materially intensive processes, and environmental burdens
Social Ecology, University of Vienna
Material Intensity declining in industrial, but rising in developing countries
Sources: IFF, Amazonia21, WRI, OECD
GDP (real, constant)Material Input (DMI)Material Intensity (DMI/GDP)
Germany
50
100
150
200
1975 1980 1985 1990 1995
Japan
50
100
150
200
1975 1980 1985 1990 1995
United States
50
100
150
200
1975 1980 1985 1990 1995
United Kingdom
50
100
150
200
1975 1980 1985 1990 1995
Venezuela
50
100
150
200
1988 1990 1992 1994 1996
Brazil
50
100
150
200
1975 1980 1985 1990 1995
Social Ecology, University of Vienna
4) Is global trade driving environmental exploitation in
peripheral economies?

Social Ecology, University of Vienna
Imports & Exports in tons as share of material input, 1975-1995
Sources: IFF, Amazonia21, WRI, OECD
Exports [% share of DMI]Imports [% share of DMI]
Austria
0
10
20
30
40
50
60
1975 1980 1985 1990 1995
Germany
0
10
20
30
40
50
60
1975 1980 1985 1990 1995
Japan
0
10
20
30
40
50
60
1975 1980 1985 1990 1995
Brazil
0
10
20
30
40
50
60
1975 1980 1985 1990 1995
Venezuela
0
10
20
30
40
50
60
1988 1990 1992 1994 1996
United Kingdom
0
10
20
30
40
50
60
1975 1980 1985 1990 1995
Social Ecology, University of Vienna
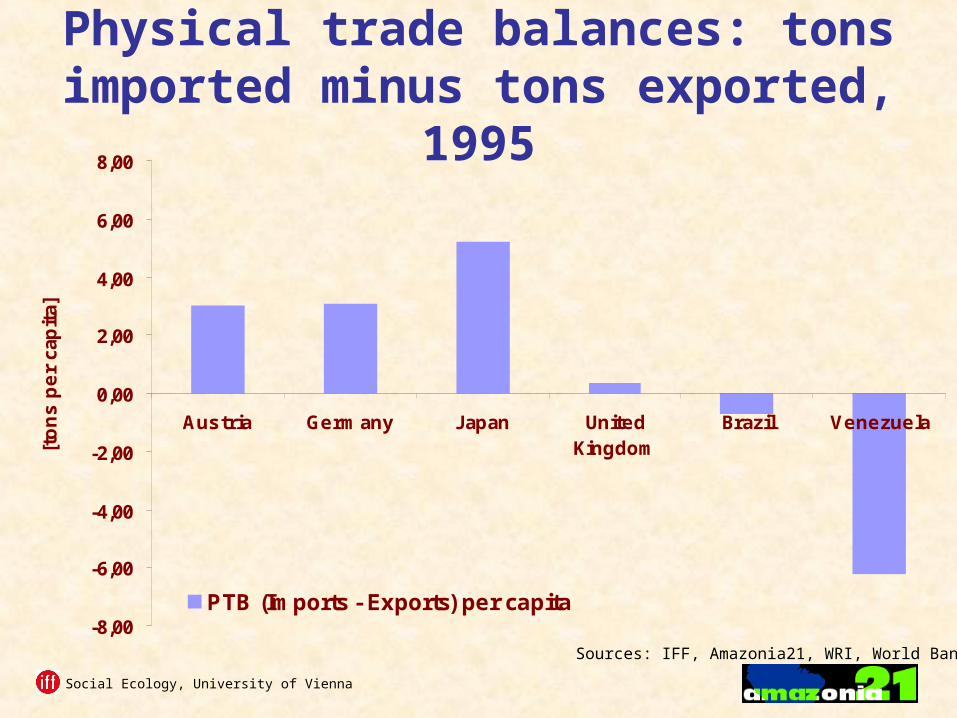
Physical trade balances: tons imported minus tons exported, 1995
Sources: IFF, Amazonia21, WRI, World Bank
-8,00
-6,00
-4,00
-2,00
0,00
2,00
4,00
6,00
8,00
Austria Germany Japan UnitedKingdom
Brazil Venezuela
[to
ns
pe
r ca
pit
a]
PTB (Imports - Exports) per capita
Social Ecology, University of Vienna
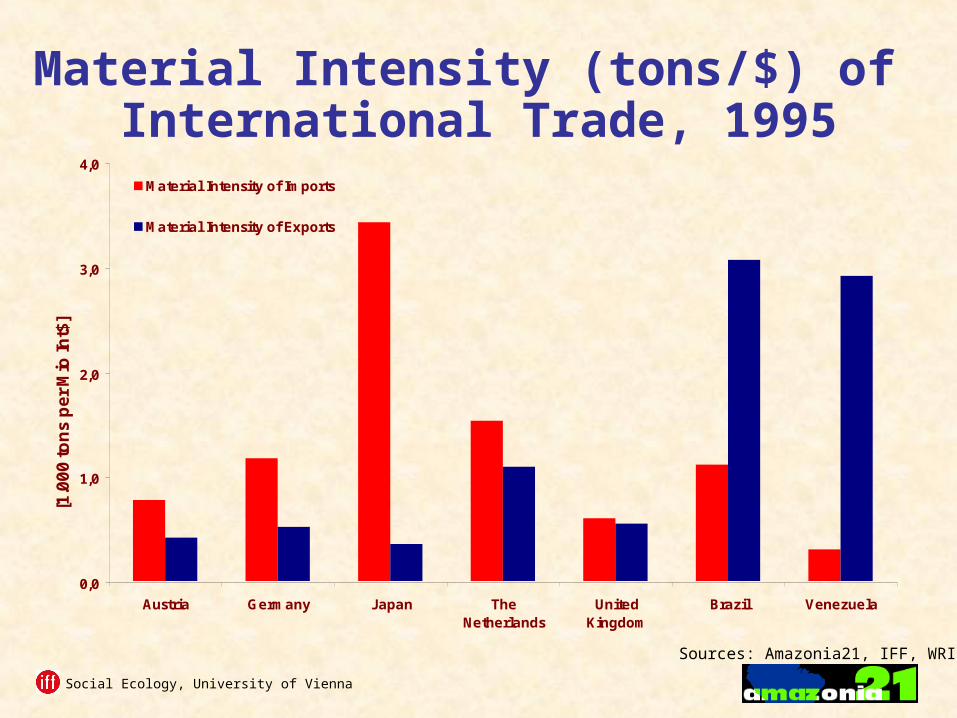
Material Intensity (tons/$) of International Trade, 1995
Sources: Amazonia21, IFF, WRI
0,0
1,0
2,0
3,0
4,0
Austria Germany Japan TheNetherlands
UnitedKingdom
Brazil Venezuela
[1.0
00
to
ns
pe
r M
io In
t$]
Material Intensity of Imports
Material Intensity of Exports
Social Ecology, University of Vienna
5) Conclusions
• Amazonian countries have a specific metabolic profile: different from history, different from present-day industrial countries
• an unsustainable profile: high material input, low income, rising material intensity
• this profile is reinforced by international trade• no „wait and see“: ongoing structural change
is not working towards sustainability

Social Ecology, University of Vienna
ReferencesAdriaanse, A., Bringezu, S., Hammond, A., Moriguchi, Y., Rodenberg, E., Rogich, D., and Schütz, H.
(1997), Resource Flows: The Material Basis of Industrial Economies, Washington DC, World Resources Institute.
Berkhout, F. (1998), "Aggregate resource efficiency: A review of evidence", in Vellinga, P., Managing a material world: Perspectives in industrial ecology, Dordrecht, Kluwer
Fischer-Kowalski, M. (1998), Society's Metabolism. The Intellectual History of Material Flow Analysis, Part I, 1860 - 1970, Journal of Industrial Ecology, Vol. 2, No. 1, pp. 61-78.
Fischer-Kowalski, M. and Amann, C. (2001). „Beyond IPAT and Kuznets Curves: Globalization as a Vital Factor in Analysing the Environmental Impact of Socio-Economic Metabolism”, in: Population and Environment, 23: 7-47.
Matthews, E., Amann, C., Fischer-Kowalski, M., Bringezu, S., Hüttler, W., Kleijn, R., Moriguchi, Y., Ottke, C., Rodenburg, E., Rogich, D., Schandl, H., Schütz, H., van der Voet, E., and Weisz, H. (2000), The Weight of Nations: Material Outflows from Industrial Economies, Washington, World Resources Institute.
Muradian, R. and Martinez-Alier, J. (2001), South-North Materials Flow: History and Environmental Repercussions, Innovation, Vol. 14, No. 2, 171-187.
Schandl, H. and Schulz, N. B. (2001), "Industrial Ecology: United Kingdom", in Ayres, R. U. et al., Handbook for Industrial Ecology, Cheltenham, Edward Elgar, in print
Steurer, Anton, Schütz, Helmut, and Eurostat (2001). Economy-wide Material Flow Accounts and derived Indicators. A methodological guide. Luxenburg, Eurostat.
Weisz, H., Fischer-Kowalski, M., Grünbühel, C. M., Haberl, H., Krausmann, F., and Winiwarter, V. (2001), Global Environmental Change and Historical Transitions, Innovation, Vol. 14, No. 2, 117-142.