small scale bio-lng plant: comparison of different biogas
TRANSCRIPT
Small scale bio-LNG plant: comparison of different biogas upgrading techniques
A. Baccioli, M. Antonelli, S. Frigo, U. Desideri, G. Pasini
University of Pisa - DESTEC Largo Lucio Lazzarino 56122 Pisa (ITALY)
Abstract
In this paper, a comparison of two different small bio-LNG plants for upgrading and liquefaction have been conducted. In the first configuration liquefaction of the biomethane occurred after the upgrading with conventional processes; in the second configuration, cryogenic upgrading occurred within the liquefaction process, removing CO2 in solid state. For both the two configurations, a two-pressure levels Joule-Brayton reverse cycle, with nitrogen as working fluid, has been considered as refrigeration cycle. The two systems have been simulated and optimized in ASPEN HYSYS, determining the values of the various working parameters which minimized the energy specific consumption.
Results showed that a bio-LNG plant with cryogenic upgrading did not require any pre-treatment of raw biogas and reached a very promising energy consumption: 0.61 kWh/Stm3 of raw biogas processed, equivalent to 1.45 kWh/kg of bio-LNG produced. Bio-LNG plants with standard upgrading techniques required between 0.57 and 0.72 kWh/Stm3 without considering additions for heating and raw biogas pre-treatment.
A sensitivity analysis concerning CH4 content in bio-LNG and intercooling temperature has been accomplished for bio-LNG plants with cryogenic upgrading, proving their impact in specific energy consumption.
A standalone bio-LNG plant cryogenic upgrading, with a natural gas internal combustion engine for energy supply, has been studied and briefly discussed. Some solutions for waste heat utilization have been proposed (digesters warming, energy recovery).
Nomenclature
AD Anaerobic Digester
Bio-LNG Liquified Natural Gas from bioGas
CH4 Methane
CO2 Carbon Dioxide
hin Enthalpy Inlet
hout Enthalpy Inlet
H2O Water
H2S Hydrogen Sulfide
ICE Internal Combustion Engine
LHV Lower Heating Value
LNG Liquified Natural Gas
m Massflow Rate
𝜂𝜂𝑒𝑒 Isentropic Efficiency
N2 Nitrogen
NH3 Ammonia
O2 Oxygen
W Mechanical Work
1. Introduction Since the beginning of this century, Liquefied Natural Gas (LNG) has been attracting more and more attention as a cleaner energy alternative to other fossil fuels, mainly due to the advantage of transportation and lower environmental impact than other liquid fuels. It is expected that this trend in the use of LNG will lead to increase the demand over the next few decades [1, 2]. LNG contains at least 90% of methane (CH4) and, at ambient pressure, its boiling point is around -161 °C, with a density of 0.41 kg/l and a 21.2 MJ/l (50 MJ/kg) lower heating value (LHV). Once transferred at the utilization point, LNG can be pressurized, boiled at ambient pressure and used in several applications, such as the injection into the natural gas grids or road vehicles, train and ships fuelling. Very interesting is also the possibility of fueling or co-fuelling in Diesel engines, allowing a decrease in pollutants emission, especially of soot and NOx [3, 4].
Commercial processes currently utilized for natural gas liquefaction are mainly of three types: cascade liquefaction processes, mixed refrigerant-liquefaction process and expander liquefaction process [5, 6]. Those technologies have been proven in several large scale LNG plants around the world, where productivity exceeds 2 million tons per year or 6000 tons of LNG per day.
LNG plants are known to be energy consuming since they require a large amount of power for compression and refrigeration. Moreover, special equipment such as cryogenic heat exchangers, compressors, drivers, and turbines are requested. Therefore, one of the primary challenges in the LNG industry is to improve the efficiency of the current natural gas liquefaction processes in combination with cost savings.

An increased attention has been recently dedicated to the development of suitable processes for offshore and small-scale plants (from 5 to 500 tons of LNG per day). Indeed, the most suitable process for small-scale LNG plants may considerably differ from large-scale application since large scale technologies are neither practical nor economical when applied to small plants. The scientific literature reports several works concerning the study of natural gas liquefaction technologies suitable for small plants. M. A. Ancona et al. [7] showed that the replacement, in a liquefaction process, of the Joule-Thompson valve by means of a turbo-expander allows significative reduction in terms of energy consumption. L. Castillo et al. [8] analysed a selection criterion for small and middle LNG technology, while P. Neksa et al. [9] described the development and application of a small-scale re-liquefaction plant for natural gas boil-off gas from gas tankers. M. Gong et al. [10] described the development of a small liquefier for natural gas or coal-bed methane based on a mixed-refrigerant liquefaction cycle with R22 precooling, reaching a very promising minimum specific power consumption of about 0.54 kW h/Nm3 natural gas treated. Z. Yuan et al. [11] proposed and simulated, with the commercial code Aspen HYSYS, a novel small-scale natural gas liquefaction process adopting single nitrogen expansion with carbon dioxide pre-cooling. T. He and Y. Ju [12] designed a novel parallel nitrogen expansion liquefaction process for small-scale plant which differs from conventional cascades ones. The process has been first simulated with Aspen HYSYS and then optimized utilizing a GA (genetic algorithm) code in Matlab. In a successive study [13], they compared sixteen feasible liquefaction cycles based on reverse-Bryton refrigeration cycle. Moreover [14], they analysed two nitrogen expansion liquefaction process with different precooling cycles to improve the liquefaction process performance, one based on propane precooling cycle and the other on R410a. M. S. Khan et al. [15] analysed the efficiency of nitrogen single and dual expander processes showing that, for optimized configurations, the specific energy requirement for single expander is 0.7449 kWh/kg LNG produced, while 0.5007 kWh/kg LNG is obtained for dual expander. C. W. Remeljej et al. [16] operated an exergy analysis of four processes for small-scale liquefied natural gas (LNG) production, while W. Cao et al. [17] compared two small-scale natural gas liquefaction process, showing that the N2–CH4 expander cycle precedes the mixed-refrigerant cycle neglecting propane pre-cooling from the parameter comparison. As a whole, nitrogen expansion technology (with several variations, such as single or dual expansion process, with or without a precooling cycle, etc.) seems to be the most suitable process for small-scale LNG production plants, combining energy consumption, economic performance, safety, and operability.
Great interest is also committed to improve the profitability of small gas fields and biogas plants with anaerobic digestion processes and landfills thanks to the application of small LNG production units. This can lead to a decentralized production of liquified natural biogas (bio-LNG) suitable for vehicle fuelling, opening new economical perspectives for the agricultural and waste sectors.
P. Patrizio et al. [18] investigated the potential role of agricultural biogas (biomethane) in different utilization pathways in Italy, and also F. Cucchiella et al. [19] confirmed the strategic
role that biomethane (both from agricultural and waste residues) can assume as fuel in the transportation sector.
M. Poschl et al. [20] evaluated the impact of feedstock (single and co-digested) and process chains (production, conversion and utilization) on energy balance of biogas systems. The energy balance was evaluated as Primary Energy Input to Output (PEIO) ratio, to assess the process energy efficiency, showing that PEIO is highly influenced by feedstock transportation distances and characteristics of feedstock used, so enhancing the importance of a decentralized production of natural biogas.
N. E. Korres et al. [21] analysed whether the gaseous biofuel meets the EU sustainability criteria of 60% greenhouse gas emission savings and results show that biogas generated from grass and further upgraded to biomethane can offer a better energy balance than first-generation liquid biofuels, especially if a vehicle optimized for gaseous fuel is used.
However, before being used as a substitute of natural gas, biogas generally undergoes first a cleanup process, where the trace components harmful to the natural gas grid are removed, and then an upgrading process, in which CO2 is removed to adjust the heating value and density in order to meet specific requirements. As better analyzed in the next paragraph, the selection of the upgrading technology mainly depends on the particular LNG plant considered and on the biogas utilization requirements. Among the various technologies, cryogenic upgrading is an attracting one when a liquefaction plant is adopted for the production of bio-LNG.
Cryogenic upgrading has been treated in the literature: Yousef et al. in [22] studied a liquefaction process in which CO2 was separated as a liquid. No information about the cooling cycle was provided and the liquid separation of CO2 required to compress the methane up to the pressure of 110 bar, similarly to other process involving liquid CO2 separation [23, 24]: the high value of the pressure practically prevents the use of this type of liquefaction system in small scale plants. For this purpose the Prometheus-Energy process seems to be more suitable for small scale applications: in this process, in fact, CO2 is separated at solid state, at lower pressure and without the use of distillation columns [24].
Differently from other literature papers, where large scale plants have been analyzed, in this work two different small-scale biogas liquefaction systems have been compared: liquefaction of biogas with conventional upgrading and liquefaction of biogas with cryogenic upgrading. In both the two configurations a dual pressure Joule-Brayton reverse regenerated cycle has been adopted as cooling source. For the cryogenic upgrading system, carbon dioxide has been removed at solid state, similarly to Prometheus-Energy process, but with the difference of reusing part of the cooling capacity of the CO2. Utilizing the commercial code ASPEN Hysys, the two configurations have been designed and optimized concerning the energy specific consumption (kWh/Nm3 of raw biogas processed).
2. Biogas characteristics and upgrading Biogas is produced during the anaerobic digestion of organic substrates, such as manure, sewage sludge, the organic fraction of municipal waste, industry waste, and energy crops.

Biogas produced during anaerobic degradation in landfills is called landfill gas. Biogas from controlled wastes, such as manure and organic fraction of urban wastes, has a similar composition as landfill gas, but most of the contaminants are quite different, with the exception of H2S, which is present in both.
Biogas produced from anaerobic digestion processes and landfill consists mainly of methane (CH4) and carbon dioxide (CO2). Apart from methane and carbon dioxide, biogas can also contain other gases and contaminants, such as water (H2O), hydrogen sulfide (H2S), nitrogen (N2), oxygen (O2), ammonia (NH3), siloxanes and solid matter. The concentrations of these impurities mainly depend on the composition of the substrate from which the gas is produced. Typical properties of biogas generated from aerobic digestion- plants and landfill sites are summarized and compared with those of natural gas in Table 1 [25, 26, 27].
Table 1 – Characteristics of natural gas, biogas and landfill gas
Parameter (unit) Landfill gas Biogas from AD Natural gas CH4 variation (vol - %) 35 - 65 50 - 70 85 – 92 CO2 variation (vol - %) 15 - 40 50 - 30 0 – 1
Heavy Hydrocarbons (vol - %) 0 0 < 12 N2 variation (vol - %) 2 - 5 < 1 0.3 – 5 O2 variation (vol - %) 0 - 5 0 < 0.1
H2S variation (vol - %) < 1 < 2 0 – 5 NH3 (vol - %) < 0.1 < 1 0 H2O (vol - %) < 10 < 10 0
Total chlorine [as Cl-] (mg/Stm3) 5 100 0 Density (kg/Stm3) 1.3 1.2 0.75 – 0.85
Lower Heating Value (MJ/Stm3) 30 – 40 Before being used as a substitute of natural gas, biogas generally requires a cleanup process, where the trace components harmful to the natural gas grid are removed, and then an upgrading process, in which CO2 is removed to adjust the heating value and density in order to meet specific requirements. After cleanup/upgrading, the final product is called ‘biomethane’, typically containing 95-97% CH4 and 1-3% CO2.
As correctly pointed out by other authors [26, 28], the selection of the upgrading technology mainly depends on the particular LNG plant considered and on the biogas utilization requirements. In some applications such as vehicle fuel or for grid injection [28, 30], where high energy content and low corrosion problems are requested, the main cleanup/upgrading processes concern H2S, H2O and CO2 removal.
Sun et al [27] wrote a thorough review regarding the state of art of different upgrading technologies, which are compared in Table 2.
Table 2 - Characteristics of different biogas upgrading technologies [28]
CH4 purity [vol - %]
Energy consumption [kWh/Stm3 of raw
biogas]
H2S / water pre-upgrading Additional heat
Water scrubbing + regeneration 97 (93-99) 0.3 (0.2-0.46) necessary not necessary
Physical absorption 97 (95-99) 0.25 (0.2-0.3) necessary necessary
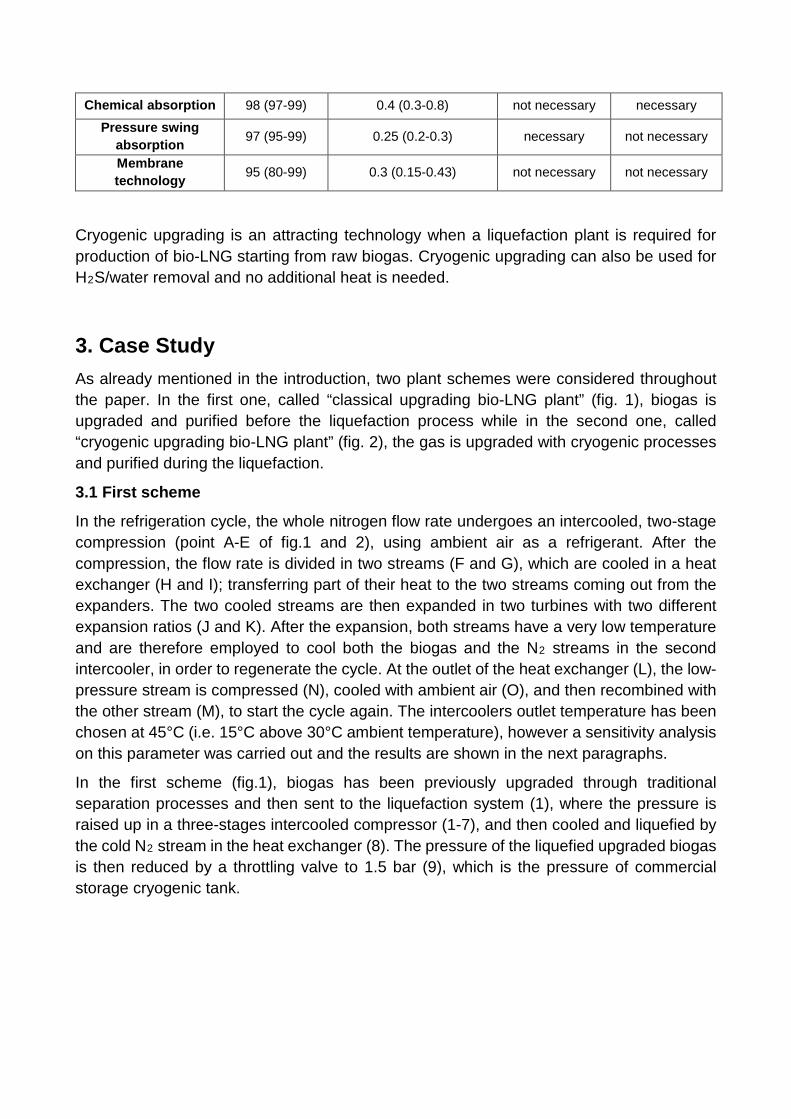
Chemical absorption 98 (97-99) 0.4 (0.3-0.8) not necessary necessary Pressure swing
absorption 97 (95-99) 0.25 (0.2-0.3) necessary not necessary
Membrane technology 95 (80-99) 0.3 (0.15-0.43) not necessary not necessary
Cryogenic upgrading is an attracting technology when a liquefaction plant is required for production of bio-LNG starting from raw biogas. Cryogenic upgrading can also be used for H2S/water removal and no additional heat is needed.
3. Case Study As already mentioned in the introduction, two plant schemes were considered throughout the paper. In the first one, called “classical upgrading bio-LNG plant” (fig. 1), biogas is upgraded and purified before the liquefaction process while in the second one, called “cryogenic upgrading bio-LNG plant” (fig. 2), the gas is upgraded with cryogenic processes and purified during the liquefaction.
3.1 First scheme
In the refrigeration cycle, the whole nitrogen flow rate undergoes an intercooled, two-stage compression (point A-E of fig.1 and 2), using ambient air as a refrigerant. After the compression, the flow rate is divided in two streams (F and G), which are cooled in a heat exchanger (H and I); transferring part of their heat to the two streams coming out from the expanders. The two cooled streams are then expanded in two turbines with two different expansion ratios (J and K). After the expansion, both streams have a very low temperature and are therefore employed to cool both the biogas and the N2 streams in the second intercooler, in order to regenerate the cycle. At the outlet of the heat exchanger (L), the low-pressure stream is compressed (N), cooled with ambient air (O), and then recombined with the other stream (M), to start the cycle again. The intercoolers outlet temperature has been chosen at 45°C (i.e. 15°C above 30°C ambient temperature), however a sensitivity analysis on this parameter was carried out and the results are shown in the next paragraphs.
In the first scheme (fig.1), biogas has been previously upgraded through traditional separation processes and then sent to the liquefaction system (1), where the pressure is raised up in a three-stages intercooled compressor (1-7), and then cooled and liquefied by the cold N2 stream in the heat exchanger (8). The pressure of the liquefied upgraded biogas is then reduced by a throttling valve to 1.5 bar (9), which is the pressure of commercial storage cryogenic tank.

Figure 1 - Classical upgrading bio-LNG plant
3.2 Second scheme
In the second scheme (fig. 2), the raw biogas is directly supplied to the liquefaction plant, where the pressure is raised up in a three-stage intercooled compressor (1-7). After the compression, in a first passage into the heat exchanger, the biogas temperature is lowered down to 0°C (8) to remove water and part of H2S in a two-phase separator. The gas from the separator (9) is then further cooled to remove carbon dioxide and hydrogen sulfide (11). To increase the fraction of methane in the biogas stream, and making a thermodynamic regeneration of the process, part of the purified methane (11) is recirculated at the exchanger inlet (12). During the biogas cooling process at low temperature, part of the CO2 separates from methane in the heat exchanger and freezes due to the low temperature. The rest of the CO2 is separated from the methane in a solid gas separator [24, 31]: in order to grant continuity of operation, at least two parallel branches, each composed by one heat exchanger and one separator, must be employed. It is worth to notice that, to achieve an easy separation of the CO2 in the solid form, the solid-vapor equilibrium of the CO2-CH4 mixture should be reached. Once the solid-gas separator is full, the feeding of the separator is interrupted and the pressure inside the chamber is reduced up to atmospheric pressure, by eliminating the residual part of methane (which will be recovered and liquefied). The separator with the CO2 ice is therefore heated by external air to sublimate the CO2. The gaseous CO2 stream is then used to precool the biogas stream. It is worth to notice that, as for the heat exchanger, at least two different separators are required. Finally, the purified methane (13) is further cooled down and liquefied by the nitrogen to -157°C (14) and therefore throttled to 1.5 bar (15), the pressure of commercial LNG tanks. Since a small amount of CO2 is still present in the methane, at least two different throttling valves are required, due to the possible formation of CO2 ice, which might lead to the blockage of the valve.
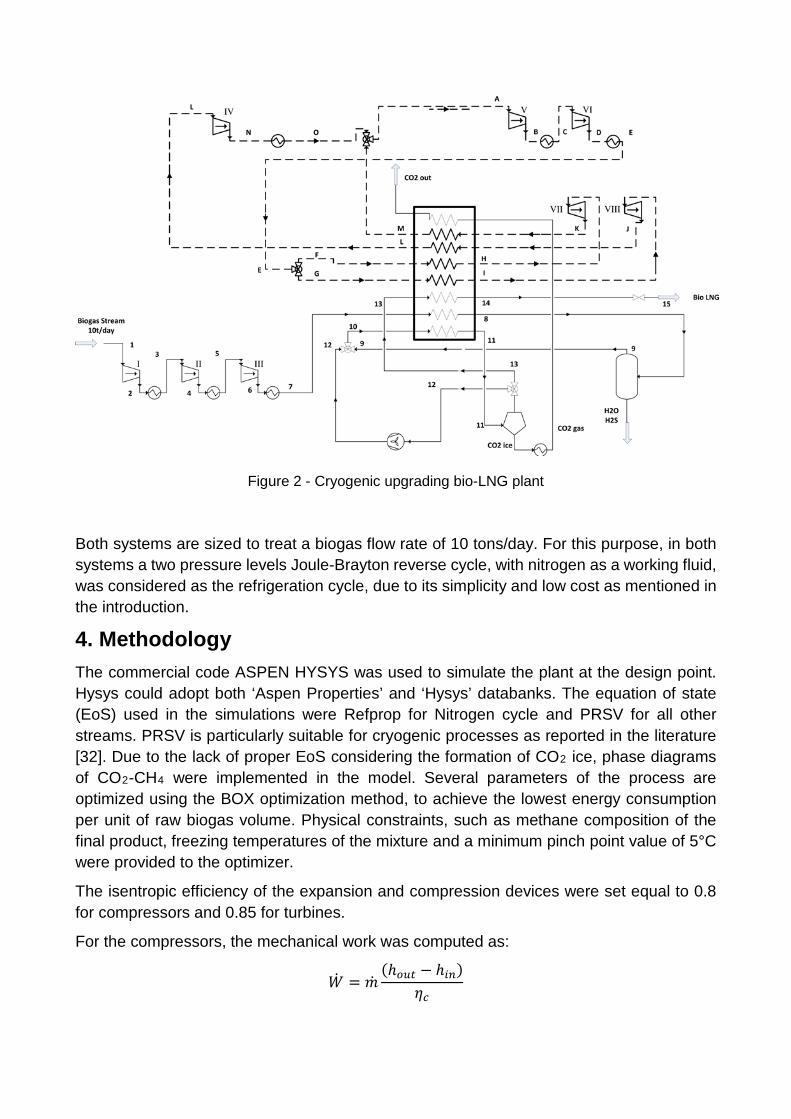
Figure 2 - Cryogenic upgrading bio-LNG plant
Both systems are sized to treat a biogas flow rate of 10 tons/day. For this purpose, in both systems a two pressure levels Joule-Brayton reverse cycle, with nitrogen as a working fluid, was considered as the refrigeration cycle, due to its simplicity and low cost as mentioned in the introduction.
4. Methodology The commercial code ASPEN HYSYS was used to simulate the plant at the design point. Hysys could adopt both ‘Aspen Properties’ and ‘Hysys’ databanks. The equation of state (EoS) used in the simulations were Refprop for Nitrogen cycle and PRSV for all other streams. PRSV is particularly suitable for cryogenic processes as reported in the literature [32]. Due to the lack of proper EoS considering the formation of CO2 ice, phase diagrams of CO2-CH4 were implemented in the model. Several parameters of the process are optimized using the BOX optimization method, to achieve the lowest energy consumption per unit of raw biogas volume. Physical constraints, such as methane composition of the final product, freezing temperatures of the mixture and a minimum pinch point value of 5°C were provided to the optimizer.
The isentropic efficiency of the expansion and compression devices were set equal to 0.8 for compressors and 0.85 for turbines.
For the compressors, the mechanical work was computed as:
��𝑊 = ��𝑚(ℎ𝑜𝑜𝑜𝑜𝑜𝑜 − ℎ𝑖𝑖𝑖𝑖)
𝜂𝜂𝑐𝑐

where ��𝑚 is the mass flow rate of the fluid crossing the compressor (biogas or nitrogen), ℎ𝑜𝑜𝑜𝑜𝑜𝑜 − ℎ𝑖𝑖𝑖𝑖 is the enthalpy difference of the stream between the inlet and the outlet and 𝜂𝜂𝑐𝑐 is the compressor isentropic efficiency.
Similarly, the mechanical work extracted from expanders in the Joule-Brayton Cycle was computed as:
��𝑊 = ��𝑚(ℎ𝑖𝑖𝑖𝑖 − ℎ𝑜𝑜𝑜𝑜𝑜𝑜)𝜂𝜂𝑒𝑒
where in this case ��𝑚 is the mass flow rate of nitrogen, (ℎ𝑖𝑖𝑖𝑖 − ℎ𝑜𝑜𝑜𝑜𝑜𝑜) is the enthalpy difference between the inlet and the outlet of the turbines and 𝜂𝜂𝑒𝑒 is the turbine isentropic efficiency.
Lamination processes were simulated as isenthalpic transformation.
The various intercoolers and the heat rejection exchanger of the Joule-Brayton cycle (D-E) were simulated as coolers where the heat exchanged was evaluated as the enthalpy difference between the stream temperature from the compressor outlet to the intercooler outlet temperature (fixed at 45°C)
The main heat transfer processes were optimized using a multi-stream exchanger, where the pinch analysis reported in [33] was used to determine the solution that satisfies not only the energy balance but also the temperature approach and the minimum entropy production. Through the pinch analysis it is possible to combine the heat exchange curves of the various hot and cold streams, in two composite curves, which represents the best match possible. There are two ways to obtain the optimal heat exchange between the various fluxes: the first is represented by the creation of a heat exchanger network; the second is represented using a multi-stream heat exchanger. The first method is suitable only for large scale plants and cannot be applied to small scale systems such as the one reported in this paper, because of the high number of heat exchanger and auxiliary streams necessary. The second one is instead possible: multi-stream plate and fin heat exchanger are components that are commercially viable and that are commonly employed in liquefaction processes, involving different streams. Due to the CO2 ice formation at least two different heat exchangers are needed.
To take into account CO2 ice formation the state diagrams of CO2 were imported from [34] and interpolated for various pressure. The solid and vapor flows from the CO2 solid-vapor separator were evaluated according to the lever rule.
5. Results and discussion
In order to compare cryogenic separation with classical upgrading methods, two layouts were simulated. Both started from raw biogas and provided bio-LNG at conditions reported in Table 3.
Some parameters such as efficiencies and exchangers outlet temperature were considered constant for both the two configurations while many others, such as intermediate pressures, temperatures and mass flow rates, were optimized by using the BOX method.

In Table 4 physical conditions of all plants streams and machine power installed are reported.
Table 3 - Characteristics of raw biogas processed and bio-LNG produced
Raw Biogas Bio-LNG Pressure [bar] 1.5 1.5
Temperature [°C] 30 -156.5 Massflow [t/day] 10 3.7
CH4 [vol - %] 40 97 CO2 [vol - %] 59 3 H2S [vol - %] 0.5 0 H2O [vol - %] 0.5 0
Table 4 – Stream conditions and installed power
Classical upgrading bio-LNG plant Cryogenic upgrading bio-LNG plant
total compressors power installed 150.65 kW total compressors
power installed 296.60 kW
total expanders power installed 34.67 kW total expanders
power installed 74.52 kW
point Pressure [bar]
Temperature [°C] point Pressure
[bar] Temperature
[°C]
1 1.50 30.0 1 1.50 30.0 2 4.99 141.9 2 4.52 131.8 3 4.89 45.0 3 4.42 45.0 4 18.15 172.5 4 12.47 143.5 5 18.05 45.0 5 12.37 45.0 6 49.86 143.9 6 34.61 143.5 7 49.76 45.0 7 34.51 45.0 8 49.66 -157.0 8 34.41 0 9 1.50 -156.5 9 34.41 0 A 16.64 42.1 10 34.41 -34.6 B 34.95 135.3 11 34.31 -78.0 C 34.85 45.0 12 34.31 -78.0 D 71.56 136.3 13 34.31 -78.0 E 71.46 45.0 14 34.21 -157.0 F 71.46 45.0 15 1.50 -156.5 G 71.46 45.0 A 11.44 36.1 H 71.36 -5.26 B 26.93 143.4 I 71.36 -56.0 C 26.83 45.0 J 4.96 -162.8 D 51.90 127.9 K 16.74 -87.3 E 51.80 45.0 L 4.86 39.9 F 51.80 45.0 M 16.64 39.2 G 51.80 45.0 N 16.74 205.3 H 51.70 4.2 O 16.64 45.0 I 51.70 -56.0 J 3.54 -161.2 K 11.54 -81.6 L 3.44 35.52 M 11.44 24.4 N 11.54 194.3

O 11.44 45.0 CO2gas 1.10 -56.0 CO2out 1.00 38.8
As expected simulations confirmed that recirculation of purified methane is not necessary and therefore the mass flow rate of the recirculated methane is equal to zero. In fact, examining the two-phase diagram of CH4-CO2, it is evident that the separation occurs in the solid-vapor region: the increase of methane composition in the mixture would cause a worst separation of solid. Also, the possible benefic effect of thermodynamic regeneration is practically negligible and not advisable, due to the worsening of the separation efficiency.
Figure 3 Phase diagram for CO2-CH4 mixture at 34.31 bar [34]
CO2 was considered a waste product and used for cold recovery in the cooling process.
4.1 Comparison with other concurrent technologies
Results coming from these simulations have been added to the classical upgrading bio-LNG plant energy consumption (previously discussed and reported in Table 2) to carry out the

comparison in Figure 4. Heat and H2S/water removal were considered as potential sources of additional energy demand and indicated in the bar chart with dashed areas.
Figure 4 - Comparison of energy consumption of different biogas upgrading solutions
Cryogenic upgrading bio-LNG plants achieved a very promising energy consumption: 0.61 kWh/Stm3 of raw biogas processed (corresponding to 0.53 kWh/kg), equivalent to 1.45 kWh/kg of bio-LNG produced. Classical upgrading bio-LNG plants stand between 0.57 and 0.72 kWh/Stm3 with possible additions for heating and pre-treatment. Only membrane technology does not require anything else but 0.62 kWh/Stm3 electric energy.
A small bio-LNG plant could be built in isolated locations (i.e. farms) far from electricity grids. In this case a standalone and skid-mounted plant should be considered, with a natural gas ICE (internal combustion engine), providing the electrical power.
0
0,2
0,4
0,6
0,8
1
water scrubbing+ regeneration
physicalabsorption
chemicalabsorption
pressure swingabsorption
membranetechnology
cryogenicupgrading
Ener
gy co
nsum
ptio
n [k
Wh/
Stm
3 ]
Biogas upgrading and liquefaction
liquefaction + upgrading
additional heat
H2S + water removal
upgrading
liquefaction
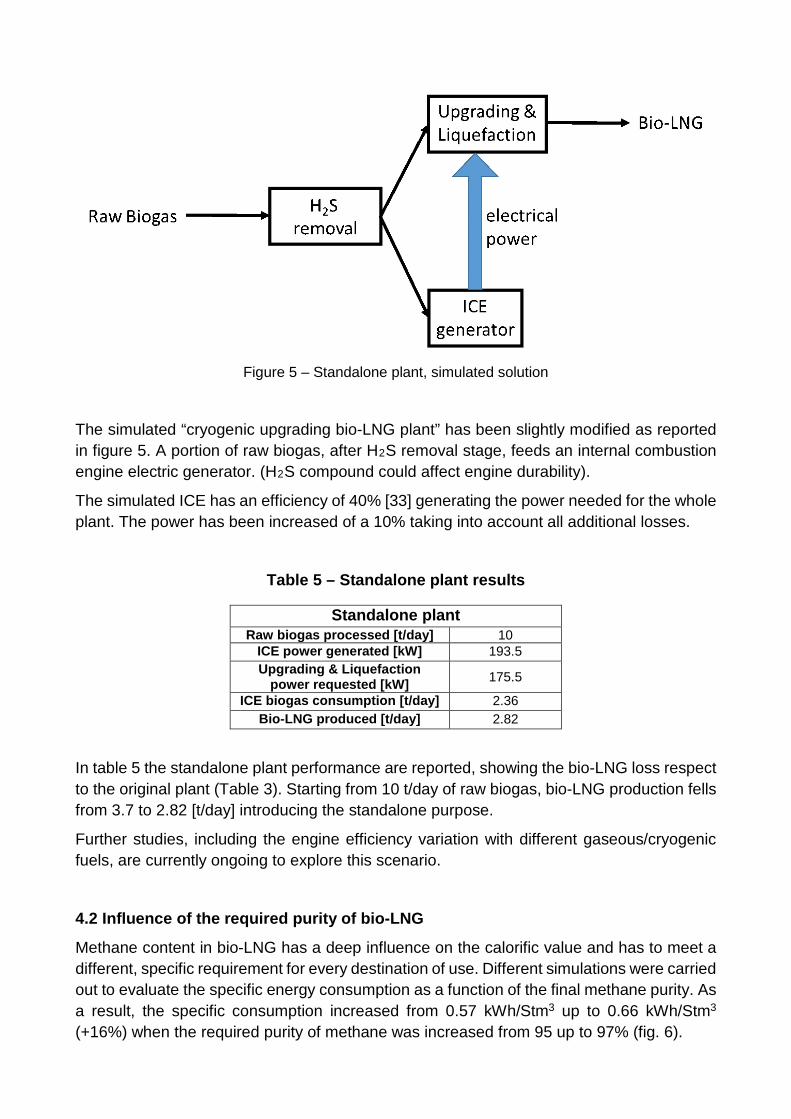
Figure 5 – Standalone plant, simulated solution
The simulated “cryogenic upgrading bio-LNG plant” has been slightly modified as reported in figure 5. A portion of raw biogas, after H2S removal stage, feeds an internal combustion engine electric generator. (H2S compound could affect engine durability).
The simulated ICE has an efficiency of 40% [33] generating the power needed for the whole plant. The power has been increased of a 10% taking into account all additional losses.
Table 5 – Standalone plant results
Standalone plant Raw biogas processed [t/day] 10
ICE power generated [kW] 193.5 Upgrading & Liquefaction
power requested [kW] 175.5
ICE biogas consumption [t/day] 2.36 Bio-LNG produced [t/day] 2.82
In table 5 the standalone plant performance are reported, showing the bio-LNG loss respect to the original plant (Table 3). Starting from 10 t/day of raw biogas, bio-LNG production fells from 3.7 to 2.82 [t/day] introducing the standalone purpose.
Further studies, including the engine efficiency variation with different gaseous/cryogenic fuels, are currently ongoing to explore this scenario.
4.2 Influence of the required purity of bio-LNG
Methane content in bio-LNG has a deep influence on the calorific value and has to meet a different, specific requirement for every destination of use. Different simulations were carried out to evaluate the specific energy consumption as a function of the final methane purity. As a result, the specific consumption increased from 0.57 kWh/Stm3 up to 0.66 kWh/Stm3 (+16%) when the required purity of methane was increased from 95 up to 97% (fig. 6).

Figure 6 - Cryogenic upgrading bio-LNG plant – energy consumption for different methane content
in bio-LNG produced
4.3 Influence of the exchangers type and quality on the specific consumption
The simulated plant is equipped with six ambient air heat exchangers for the intercooling of biogas and nitrogen between the compressions. In order to analyze the effect of different types/qualities of exchangers and different ambient conditions, the outlet temperatures were varied from 40°C up to 65°C. The same methane final purity was considered for the calculation (97%-vol). The results showed that the energy consumption varied between 0.6 and 0.69 kWh/Stm3 when the outlet temperature of the air was increased from 40°C up to 65°C (fig. 7).
Figure 7 - Cryogenic upgrading bio-LNG plant – energy consumption for different outlet
temperature of ambient air exchangers
0,56
0,58
0,6
0,62
95% 96% 97%
Ener
gy c
onsu
mpt
ion
[kW
h/N
m3
of
raw
bio
gas]
CH4 content in bio-LNG [% - vol]
energy consumption vs ch4 content
0,59
0,61
0,63
0,65
0,67
0,69
40 45 50 55 60 65
Ener
gy c
onsu
mpt
ion
[kW
h/St
m3
of ra
w
biog
as]
outlet temperature of ambient air exchangers [°C]
Energy consumption vs different exchangers temperature

4.4 Influence of the purity of raw biogas
Biogas can be produced from various raw materials (manure, agricultural waste, plant material, sewage, food waste etc.) with different resulting composition. Four simulations were carried out to evaluate the specific energy consumption as a function of the raw biogas methane content (50-55-60-65 %vol of CH4 in raw biogas). Bio-LNG purity is fixed at 97% and raw biogas massflow at 10t/day.
In Figure 8 the corresponding energy consumptions are reported. Regarding energy per kg of bio-LNG produced, a reduction is reported with higher methane content. With 50% of methane the plant needs 1.83 [kWh/kg of bio-LNG], falling to 1.38 [kWh/kg of bio-LNG] for a biogas with 65% of methane.
The change in raw biogas composition leads to density variation, so the energy consumption respect to raw biogas processed now is measured in kWh/kg of raw biogas and not in Stm3. A slight increase of this consumption is reported with higher methane content in raw biogas (from 0.49 [kWh/kg of raw biogas] for 50% to 0.58 [kWh/kg of raw biogas] for 65%). This behavior could be easily explained with the increased quantity of methane that has to be liquified and also with different properties of the raw biogas during the first compression stages.
Figure 8 - Cryogenic upgrading bio-LNG plant – energy consumption for different methane content
in raw biogas processed
It is worthwile to mention that, in this first study, the heat rejected from the intercoolers (and also from the internal combustion engine, if present in stand-alone plants) was considered to be wasted to the ambient but it has noticeable potential for energy recovery and/or
0,4
0,8
1,2
1,6
2
50 55 60 65
Ener
gy c
onsu
mpt
ion
[kW
h/kg
of r
aw
biog
as] -
[kW
h/kg
of b
io-L
NG
pro
duce
d]
CH4 content in raw biogas [% - vol]
Energy consumption vs CH4 content in raw biogas
energy consumption per kg of bio-LNG produced
energy consumption per kg of raw biogas processed

integration with other energy demanding processes such as anaerobic digester (AD) heating.
5. Conclusion Two different bio-LNG plants for biogas upgrading and liquefaction were simulated with ASPEN Hysys software with both Refprop and Peng-Robinson equations of state.
The first scheme, called “classical upgrading bio-LNG plant”, uses conventional upgrading techniques (water scrubbing + regeneration, physical absorption, chemical absorption, pressure swing absorption, membrane) and a two-pressure levels Joule-Brayton reverse cycle with nitrogen as working fluid for liquefaction.
The second scheme, called “cryogenic upgrading bio-LNG plant”, adopts the same refrigeration cycle both for upgrading and liquefaction.
The comparison was carried out by considering the same raw biogas average composition and the same bio-LNG purity, that is to say 97%vol of CH4.
Cryogenic upgrading bio-LNG plant doesn’t require any pre-treatment of raw biogas and reaches a very promising energy consumption: 0.61 kWh/Stm3 of raw biogas processed, equivalent to 1.45 kWh/kg of bio-LNG produced. Classical upgrading bio-LNG plants stand between 0.57 and 0.72 kWh/Stm3 without considering additions for heating and raw biogas pre-treatment.
CH4 content in bio-LNG and different levels of intercooling have been studied for cryogenic upgrading bio-LNG plant proving their remarkable impact in energy specific consumption (0.57-0.66 kWh/Stm3 for 95-99 % of CH4 in final product, 0.60-0.69 kWh/Stm3 for 40-65°C of different exchanger outlet temperature).
A standalone cryogenic upgrading bio-LNG plant, with a natural gas internal combustion engine for energy supply, has been simulated and briefly discussed. Also for waste heat some solutions have been proposed (AD warming, energy recovery).
Waste heat processing and economic analysis are two main aspects which are worthy of being further studied.
Bibliography 1. M. A. Ancona, M. Bianchi, L. Branchini, A. De Pascale, F. Melino, “Performance
Increase of a Small-Scale Liquefied Natural Gas Production Process by Means of Turbo-Expander”, The 8th International Conference on Applied Energy – ICAE2016.
2. T. He, Y. Ju, “A novel conceptual design of parallel nitrogen expansion liquefaction process for small-scale LNG (liquefied natural gas) plant in skid-mount packages”, Energy 75 (2014), 349-359.

3. S. Kumar, H. T. Kwon, K. H. Choi, J. H. Cho, W. Lim, I. Moon, “Current status and future projections of LNG demand and supplies: A global prospective”, Energy Policy 39 (2011), 4097-4104.
4. W. Lim, K. Choi, I. Moon, “Current Status and Perspectives of Liquefied Natural Gas (LNG) Plant Design”, Ind. Eng. Chem. Res. 52 (2013), 3065−3088.
5. A. P. Carlucci, D. Laforgia, R. Saracino, G. Toto, “Combustion and emissions control in diesel–methane dual fuel engines: The effects of methane supply method combined with variable in-cylinder charge bulk motion”, Energy Conversion and Management 52 (2011), 3004-3017.
6. C. Zhang, J. Song, “Experimental study of co-combustion ratio on fuel consumption and emissions of NG-diesel dual-fuel heavy-duty engine equipped with a common rail injection system”, Journal of the Energy Institute 89 (2016), 578-585.
7. W. Mazyan, A. Ahmadi, H. Ahmed, M. Hoorfar, "Market and technology assessment of natural gas processing: A review", Journal of Natural Gas Science and Engineering 30 (2016), 487-514.
8. Z Yuan, M. Cui, Y. Xie, C. Li, "Design and analysis of a small-scale natural gas liquefaction process adopting single nitrogen expansion with carbon dioxide pre-cooling", Applied Thermal Engineering 64 (2014), 139-146.
9. Ho-Myung Chang, “A thermodynamic review of cryogenic refrigeration cycles for liquefaction of natural gas”, Cryogenics (2015), 127 - 147.
10. L. Castillo, C.A. Dorao, "Influence of the plot area in an economical analysis for selecting small scale LNG technologies for remote gas production", Journal of Natural Gas Science and Engineering 2 (2010), 302-309.
11. M. Gong, J. Wu, Z. Sun, J. Liu, Qinguo Hu, "Development and performance test of a small trailer-mounted moveable natural gas liquefier", Energy conversion and Management 57 (2012), 148-153.
12. P. Nekså, E. Brendeng, M. Drescher a, B. Norberg “Development and analysis of a natural gas reliquefaction plant for small gas carriers", Journal of Natural Gas Science and Engineering 2 (2010), 143-149.
13. M. S Khan, S. Lee, M. Getu, M. Lee, "Knowledge inspired investigation of selected parameters on energy consumption in nitrogen single and dual expander processes of natural gas liquefaction", Journal of Natural Gas Science and Engineering 23 (2015), 324-337.
14. C.W. Remeljej, A.F.A. Hoadley, “An exergy analysis of small-scale liquefied natural gas (LNG) liquefaction processes”, Energy 31 (2006) 2005–2019.
15. T. He, Y. Ju, "Optimal synthesis of expansion liquefaction cycle for distributed-scale LNG (liquefied natural gas) plant", Energy 88 (2015), 268-280.
16. W. Cao, X. Lu, W. Lin, A. Gu, “Parameter comparison of two small-scale natural gas liquefaction processes in skid-mounted packages”, Applied Thermal Engineering 26 (2006), 898–904.

17. T.B. He, Y.L. Ju, “Performance improvement of nitrogen expansion liquefaction process for small-scale LNG plant”, Cryogenics 61 (2014), 111-119.
18. P. Patrizio, S. Leduc, D. Chinese, E. Dotzauer, F. Kraxner, “Biomethane as transport fuel – A comparison with other biogas utilization pathways in northern Italy”, Applied Energy 157 (2015), 25-34.
19. F. Cucchiella, I. D’Adamo, M. Gastaldi, “Profitability Analysis for Biomethane: A Strategic Role in the Italian Transport Sector”, International Journal of Energy Economics and Policy, 2015, 5(2), 440-449.
20. M. Pöschl, S. Ward, P. Owende, “Evaluation of energy efficiency of various biogas production and utilization pathways”, Applied Energy 87 (2010), 3305-3321.
21. N. E. Korres, A. Singh, A. Nizami, J. D. Murphy, “Is grass biomethane a sustainable transport biofuel?”, 2010 Published online in Wiley InterScience (www.interscience.wiley.com); DOI: 10.1002/bbb.228; Biofuels, Bioprod, Bioref. 4: 310–325 (2010).
22. A. Yousef, Y. Eldrainy, W. El-Maghlany, A. Attia, Upgrading biogas by a low-temperature CO2 removal technique, Alexandria Engineering Journal. 55 (2016) 1143-1150.
23. Johansson N. Production of liquid biogas, LBG, with cryogenic and conventional upgrading technology—description of systems and evaluations of energy balances. [Master thesis]. Lund, Sweden: Lund University.
24. Deublein D, Steinhauser A. Biogas from waste and renewable resources: an introduction, second, revised and expanded edition. Weinheim, Germany: Wiley-VCH Verlag GmbH & Co. KGaA; 2010.
25. P. Weiland, “Biogas production: current state and perspectives”, Appl Microbiol Biotechnol 85 (2010), 849–860.
26. Petersson, A. Wellinger, “Biogas upgrading technologies – developments and innovations”, Task 37 (2009), IEA Bioenergy.
27. Q. Sun, H. Li, J. Yan, L. Liu, Z. Yue, X. Yu, “Selection of appropriate biogas upgrading technology-a review of biogas cleaning, upgrading and utilisation”, Renewable and Sustainable Energy Reviews 51 (2015), 521-532.
28. E. Ryckebosch, M. Drouillon, H. Vervaeren, “Techniques for transformation of biogas to biomethane”, Biomass and Bioenergy 35 (2011), 1633-1645.
29. M. Persson, O. Jonsson, A. Wellinger, “Biogas upgrading to vehicle fuel standards and grid injection”, 2006, IEA Bioenergy.
30. T. Patterson, S. Esteves, R. Dinsdale, A. Guwy, “An evaluation of the policy and techno-economic factors affecting the potential for biogas upgrading for transport fuel use in the UK”, Energy Policy 39 (2011), 1806-1816.
31. A. Pettersson, A. Wellinger “Biogas upgrading technologies - developments and innovations” IEA Bioenergy task 37 (2009), 12-14

32. Aspen Hysys Guide, Property methods and calculations
33. I. C. Kemp, Pinch Analysis and Process Integration, Second Edition, Elsevier 2007
34. H. G. Donnelly, D. L. Katz, Phase equilibria in the Carbon Dioxide-Methane System, Industrial and engineering Chemistery 46 (1954), 511-517.
35. Liebherr G946 engine datasheet https://www.liebherr.com/en/sau/products/components/combustion-engines/gas-engines/product-portfolio-gas-engines/details/g946.html