six sigma acronyms -...
TRANSCRIPT

2-1 Do Not Reprint without permission of
SixSigma.us April, 2008
Six Sigma Acronyms
$k Thousands of dollars
$M Millions of dollars
% R & R Gauge % Repeatability and Reproducibility
ANOVA Analysis of Variance
AOP Annual Operating Plan
BB Black Belt
C & E Cause and Effects matrix
CEO Chief Executive Officer
CFO Chief Financial Officer
CIO Chief Information Officer
COB Chairman of the Board of Directors
COO Chief Operating Officer
COPQ Cost of Poor Quality

2-2 Do Not Reprint without permission of
SixSigma.us April, 2008
Six Sigma Acronyms
Cp Index of process capability
Cpk Index of process capability – process not centered
DMAIC Define, Measure, Analyze, Improve, Control
DOE Design of Experiments
DPU Defects Per Unit
F(x) Function relating process inputs to process outputs
FMEA Potential Failure Modes and Effect Analysis
FPY First Pass Yield
GB Green Belt
IS Information Systems
ISO International Standards Organization
KPIV Key Process Input Variable
KPOV Key Process Output Variable
LSL Lower Specification Limit
2-3 Do Not Reprint without permission of
SixSigma.us April, 2008
Six Sigma Acronyms
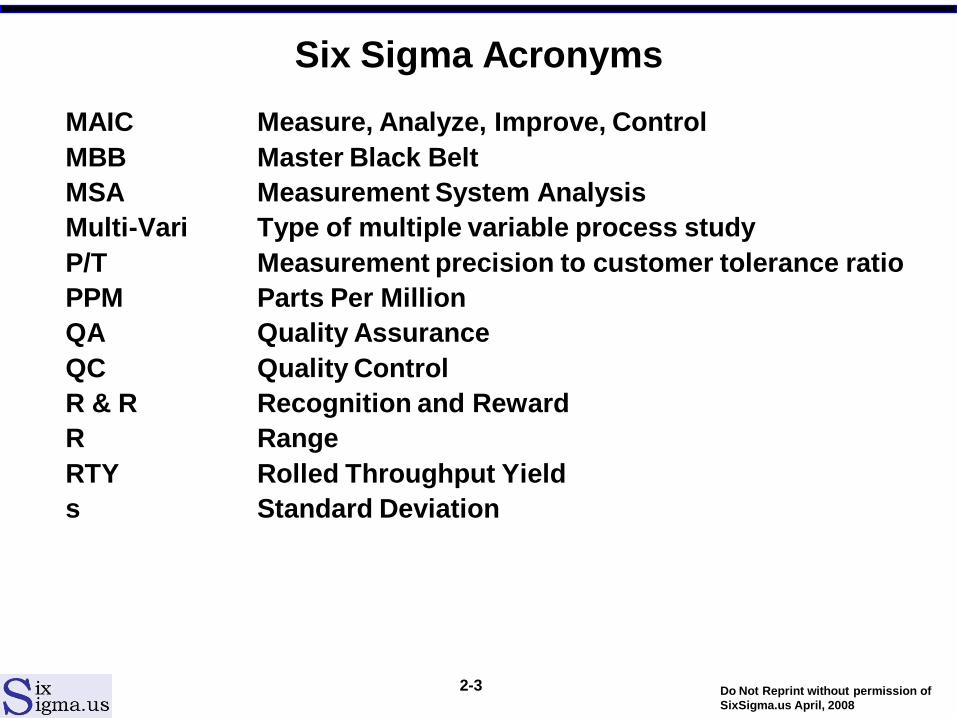
MAIC Measure, Analyze, Improve, Control
MBB Master Black Belt
MSA Measurement System Analysis
Multi-Vari Type of multiple variable process study
P/T Measurement precision to customer tolerance ratio
PPM Parts Per Million
QA Quality Assurance
QC Quality Control
R & R Recognition and Reward
R Range
RTY Rolled Throughput Yield
s Standard Deviation
2-4 Do Not Reprint without permission of
SixSigma.us April, 2008
Six Sigma Acronyms
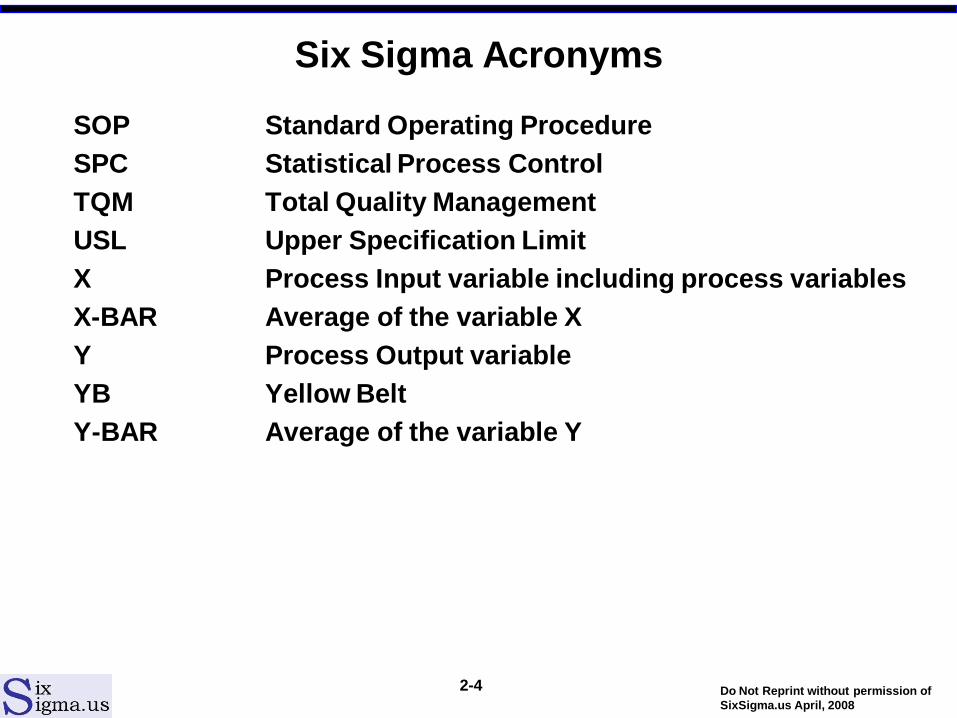
SOP Standard Operating Procedure
SPC Statistical Process Control
TQM Total Quality Management
USL Upper Specification Limit
X Process Input variable including process variables
X-BAR Average of the variable X
Y Process Output variable
YB Yellow Belt
Y-BAR Average of the variable Y

2-5 Do Not Reprint without permission of
SixSigma.us April, 2008
Glossary
• Alpha Risk: The probability of accepting the alternate hypothesis
when; in reality, the null hypothesis is true.
• Alternate Hypothesis: A tentative explanation that indicates that an
event does not follow a chance distribution; a contrast to the null
hypothesis.
• Assignable Cause: A source of variation which is non-random; a
change in the source (―VITAL FEW‖ variables) produces a
significant change of some magnitude in the response (dependent
variable)—e.g., a correlation exists; the change may be due to an
intermittent in-phase effect or a constant cause system which may
or may not be highly predictable. An assignable cause is often
signaled by an excessive number of data points outside a control
limit and/or a non-random pattern within the control limits; an
unnatural source of variation; most often economical to eliminate.

2-6 Do Not Reprint without permission of
SixSigma.us April, 2008
Glossary
• Assignable Variations: Variations in data that can be attributed
to specific causes.
• Attribute: A characteristic that may take on only one value (e.g.,
0 or 1).
• Attribute Data: Numerical information at the nominal level;
subdivision is not conceptually meaningful; data that represents
the frequency of occurrence within some discrete category (e.g.,
42 solder shorts).
• Background Variables: Variables that are of no experimental
interest and are not held constant; their effects are often
assumed insignificant or they are randomized to ensure that
contamination of the primary response does not occur.
• Beta Risk: The probability of accepting the null hypothesis when,
in reality, the alternate hypothesis is true.
• Black Belt: The leader of the team responsible for applying the
Six Sigma process.
2-7 Do Not Reprint without permission of
SixSigma.us April, 2008
Glossary
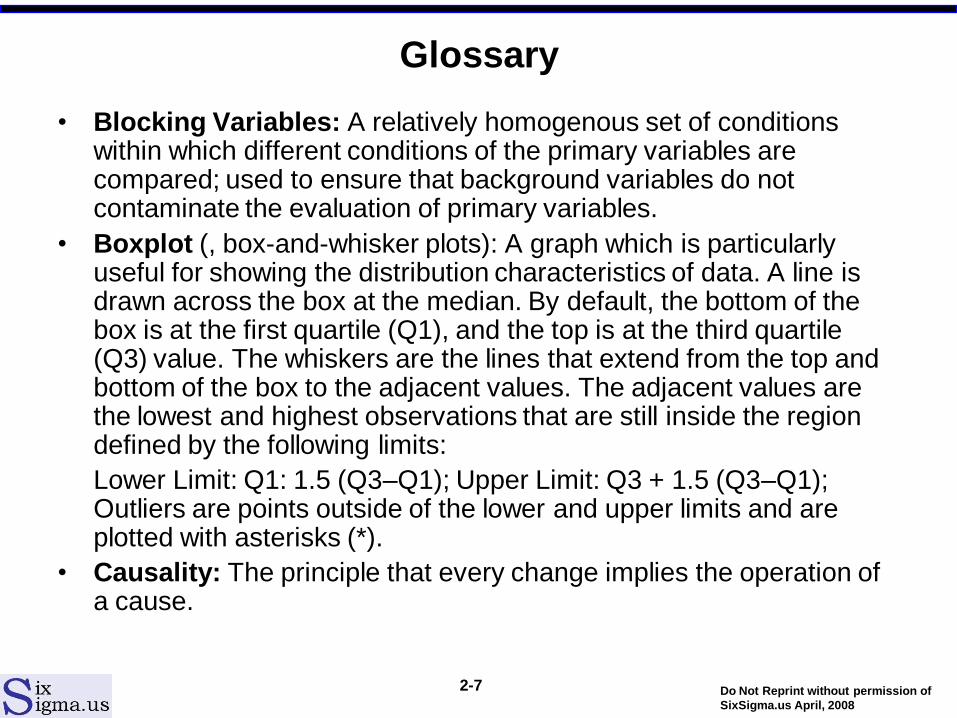
• Blocking Variables: A relatively homogenous set of conditions within which different conditions of the primary variables are compared; used to ensure that background variables do not contaminate the evaluation of primary variables.
• Boxplot (, box-and-whisker plots): A graph which is particularly useful for showing the distribution characteristics of data. A line is drawn across the box at the median. By default, the bottom of the box is at the first quartile (Q1), and the top is at the third quartile (Q3) value. The whiskers are the lines that extend from the top and bottom of the box to the adjacent values. The adjacent values are the lowest and highest observations that are still inside the region defined by the following limits:
Lower Limit: Q1: 1.5 (Q3–Q1); Upper Limit: Q3 + 1.5 (Q3–Q1); Outliers are points outside of the lower and upper limits and are plotted with asterisks (*).
• Causality: The principle that every change implies the operation of a cause.

2-8 Do Not Reprint without permission of
SixSigma.us April, 2008
Glossary
• Causative: Effective as a cause.
• Cause: That which produces an effect or brings about a change.
• C Charts: Charts that display the number of defects per sample.
• Champion: A member of senior management who is responsible for the logistical and business aspects of the program.
• Characteristic: A definable or measurable feature of a process, product, or variable.
• Central Tendency: Numerical average (e.g., mean, median, and mode); center line on a statistical process control chart.
• Center Line: The line on a statistical process control chart that represents the characteristic’s central tendency.
• Classification: Differentiation of variables.
• Common Cause: type of process variation that exist normally in the current process state, also called inherent variation. The reasons data values go up are the same reason data values go down.

2-9 Do Not Reprint without permission of
SixSigma.us April, 2008
Glossary
• Confidence Level: The probability that a random variable X lies within a defined interval.
• Confidence Limits: The two values that define the confidence interval.
• Confounding: Allowing two or more variables to vary together so that it is impossible to separate their unique effects. The ―but‖ word.
• Continuous Data: Numerical information at the interval of ratio level; subdivision is conceptually meaningful; can assume any number within an interval (e.g., 14.652 amps).
• Continuous Random Variable: A random variable that can assume any value continuously in some specified interval.
• Control Chart: A graphical rendition of a characteristic’s performance across time in relation to its natural limits and central tendency.
• Control Specifications: Specifications called for by the product being manufactured.
2-10 Do Not Reprint without permission of
SixSigma.us April, 2008
Glossary
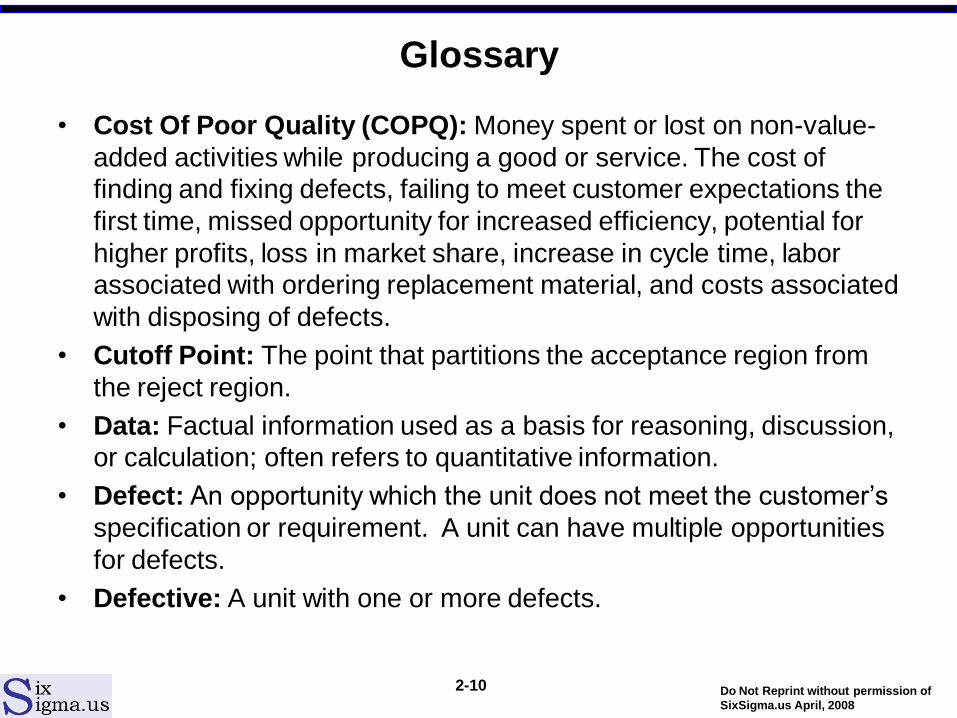
• Cost Of Poor Quality (COPQ): Money spent or lost on non-value-
added activities while producing a good or service. The cost of
finding and fixing defects, failing to meet customer expectations the
first time, missed opportunity for increased efficiency, potential for
higher profits, loss in market share, increase in cycle time, labor
associated with ordering replacement material, and costs associated
with disposing of defects.
• Cutoff Point: The point that partitions the acceptance region from
the reject region.
• Data: Factual information used as a basis for reasoning, discussion,
or calculation; often refers to quantitative information.
• Defect: An opportunity which the unit does not meet the customer’s
specification or requirement. A unit can have multiple opportunities
for defects.
• Defective: A unit with one or more defects.

2-11 Do Not Reprint without permission of
SixSigma.us April, 2008
Glossary
• Defects Per Million Opportunities (DPMO): [# Defects/(# of Units * # Opportunities)] * 1M; allows comparison of unlike products, services and processes by considering the total number of opportunities that exist for a defect to occur.
• Defects Per Unit (DPU): # of Defects / # Units; the ratio of the total number of defects in a product or service to the total number of units produced. A unit can have more than one defect. DPU can range from zero to the total number of defect opportunities.
• Degrees Of Freedom: The number of independent measurements available for estimating a population parameter. Often n-1.
• Density Function: The function yielding the probability that a particular random variable takes on any one of its possible values.
• Dependent Variable: A Response Variable; e.g., Y is the dependent or ―response‖ variable where Y = f(Xl. . . XN).
• Discrete Random Variable: A random variable that can assume values only from a definite number of discrete values.
2-12 Do Not Reprint without permission of
SixSigma.us April, 2008
Glossary
• Distributions: Tendency of large numbers of observations to group
themselves around some central value with a certain amount of
variation or ―scatter‖ on either side.
• Drill Down: Slang term used in Pareto and fishbone analysis;
means getting to the root cause rather than staying at a symptom
level of a problem.
• Effect: That which was produced by a cause.
• Experiment: A test under defined conditions to determine an
unknown effect; to illustrate or verify a known law; to test or
establish a hypothesis.
• Experimental Error: Variation in observations made under
identical test conditions; also called ―residual‖ error; the amount of
variation that cannot be attributed to the variables included in the
experiment. ―Unexplained variation‖
• Factors: Independent variables that are controllable for
experimentation purposes

2-13 Do Not Reprint without permission of
SixSigma.us April, 2008
Glossary
• Failure Modes and Effects Analysis (FMEA): A tool used to
identify high-risk areas within a process by rating the severity, the
frequency and the ease of detection for each potential failure mode
of a process.
• First Time Yield (FTY): # of good units or total units.
How many good products or services were produced at the end of
the process. If items are reworked or repaired during the process
but pass final inspection, they are counted as good in the first-time
yield calculation.
• Fishbone: Also known as a cause-and-effect and/or Ishikawa
diagram; a diagram to organize brainstorming information about
potential causes of a problem. Diagramming helps you to see
relationships among potential causes. These diagrams should start
with a problem. Ask why? why? why? why? until the root causes are
identified.

2-14 Do Not Reprint without permission of
SixSigma.us April, 2008
Glossary
• Fixed Effects Model: Experimental treatments that are specifically
selected by the researcher. Conclusions only apply to the factor
levels considered in the analysis. Inferences are restricted to the
experimental levels.
• Frequency Distribution: The pattern or shape formed by the group
of measurements in a distribution.
• Gage Reliability and Reproducibility (Gage R&R): Studies that
determine how much of your observed process variation is due to
measurement system variation. Variation can be caused by
repeatability problems; shows different results for same
measurement task or reproducibility problems; different operators
get different results for same measurement task.
• Green Belt: An individual who supports the implementation and
application of Six Sigma tools by way of participation on major
project teams or leading smaller projects.

2-15 Do Not Reprint without permission of
SixSigma.us April, 2008
Glossary
• Histogram: Vertical display of a population distribution in terms of
frequencies; a formal method of plotting a frequency distribution.
• Homogeneity of Variance: The variances of the groups being
contrasted are equal (as defined by statistical test of significant
difference). In Minitab called test of equal variance.
• Independent Variable: A controlled variable; a variable whose
value is independent of the value of another variable.
• Interaction: When the effects of a factor (A) are not the same at all
levels of another factor (B). A combined effect or more than
experimental factor.
• Instability: Unnaturally large fluctuations in a pattern.
• Interval: Numeric categories with equal units of measure but no
absolute zero point (i.e., quality scale or index).

2-16 Do Not Reprint without permission of
SixSigma.us April, 2008
Glossary
• Key Process Input Variable (KPIV): The process and input variables that have the greatest impact on being able to meet the customer requirements.
• Key Process Output Variable (KPOV): Also known as Critical to Quality (CTQ); the customer requirements defined in measurable terms.
• Line Charts: Charts used to track the performance without relationship to process capability or control limits.
• Lower Control Limit: A horizontal dotted line plotted on a control chart that represents the lower process limit capabilities of a process.
• Master Black Belt: A teacher and mentor of Black Belts—provides support, reviews projects, and undertakes larger scale projects.

2-17 Do Not Reprint without permission of
SixSigma.us April, 2008
Glossary
• Nominal: Unordered categories that indicate membership or non-
membership with no implication of quantity (i.e., assembly area
number one, part numbers, and so forth).
• Nonconforming Unit: A unit that does not conform to one or more
specifications, standards, and/or requirements.
• Nonconformity: A condition within a unit which does not conform to
some specific specification, standard, and/or requirement; often
referred to as a defect; any given nonconforming unit can have the
potential for more than one nonconformity.
• Normal Distribution: A continuous, symmetrical density function
characterized by a bell-shaped curve (e.g., distribution of sampling
averages).
• Null Hypothesis: A tentative explanation that indicates that a
chance distribution is operating; a contrast to the null hypothesis.

2-18 Do Not Reprint without permission of
SixSigma.us April, 2008
Glossary
• Opportunity: Anything that could be a ―fail to meet‖ for a customer requirement.
• Ordinal: Ordered categories (ranking) with no information about distance between each category (i.e., rank ordering of several measurements of an output parameter).
• Parameter: A constant defining a particular property of the density function of a variable.
• Pareto Chart: Organizes data to show the major factor(s) that make up the subject being analyzed; it is a type of bar chart in which the horizontal axis represents categories of interest—the major factor(s), rather than a continuous scale. The categories are often ―defects‖. By ordering the bars from largest to smallest, a Pareto chart can help you determine which of the defects comprise the ―vital few‖ and which are the ―trivial many‖. A cumulative percentage line helps you judge the added contribution of each category. Pareto charts can help to focus improvement efforts on areas where the largest gains can be made. It is a search for significance.

2-19 Do Not Reprint without permission of
SixSigma.us April, 2008
Glossary
• P Chart: Used to plot proportion defective in a sample..
• Poka-Yoke: Slang term used when talking about mistake proofing
processes; describes the error messages that ―pop up‖ when keying
information using an electronic format.
• Population: A group of similar items from which a sample is drawn.
Often referred to as the universe.
• Power Of An Experiment: The probability of rejecting the null
hypothesis when it is false and accepting the alternate hypothesis
when it is true.
• Prevention: The practice of eliminating unwanted variation ―a priori‖
(before the fact)—e.g., predicting a future condition from a control
chart and then applying corrective action before the predicted event
transpires.

2-20 Do Not Reprint without permission of
SixSigma.us April, 2008
Glossary
• Primary Control Variables: The major independent variables used
in the experiment.
• Probability: The chance of something happening; the percent or
number of occurrences over a large number of trials.
• Probability of An Event: The number of successful events divided
by the total number of trials.
• Problem: A deviation from a specified standard.
• Problem Solving: The process of solving problems; the isolation
and control of those conditions that generate or facilitate the creation
of undesirable symptoms.
• Process: A particular method of doing something; generally
involves a number of steps or operations.

2-21 Do Not Reprint without permission of
SixSigma.us April, 2008
Glossary
• Process Average: The central tendency of a given process characteristic across a given amount of time or at a specific point in time.
• Process Control: See STATISTICAL PROCESS CONTROL.
• Process Control Chart: Any of a number of various types of graphs upon which data is plotted against specific control limits.
• Process Map: Graphical representation of the flow of the process; show how inputs are taken through process steps to add value in producing a final product or service.
• Process Spread: The range of values which a given process characteristic displays; this particular term most often applies to the range; may also encompass the variance. The spread may be based on a set of data collected at a specific point in time or may reflect the variability across a given amount of time.
• Project: A problem usually calling for planned action.

2-22 Do Not Reprint without permission of
SixSigma.us April, 2008
Glossary
• R Chart: Range control chart; plot of the difference between the highest and lowest in a sample.
• Random: Selecting a sample so each item in the population has an equal chance of being selected; lack of predictability; without pattern.
• Random Cause: A source of variation which is random; a change in the source (―trivial many‖ variables) which will not produce a highly predictable change in the response (dependent variable)—e.g., a correlation does not exist; any individual source of variation results in a small amount of variation in the response; cannot be economically eliminated from a process; an inherent natural source of variation.
• Randomness: A condition in which any individual event in a set of events has the same mathematical probability of occurrence as all other events within the specified set (i.e., individual events are not predictable even though they may collectively belong to a definable distribution).

2-23 Do Not Reprint without permission of
SixSigma.us April, 2008
Glossary
• Random Sample: One or more samples randomly selected from the universe (population).
• Random Variable: A variable that can assume any value from a set of possible values.
• Range: The difference between the highest and lowest values in a set of values or ―subgroup‖.
• Ranks: Values assigned to items in a sample to determine their relative occurrence in a population.
• Ratio: Numeric scale that has an absolute zero point and equal units of measure throughout (i.e., measurements of an output parameter—amps).
• Reliability: The ability for one gage to consistently get the same results for the same task.
2-24 Do Not Reprint without permission of
SixSigma.us April, 2008
Glossary
• Replication: Observations made under identical test conditions.
• Representative Sample: A sample that accurately reflects a
specific condition or set of conditions within the universe.
• Reproducibility: The ability for all operators and gages to
consistently produce the same results as one another for the same
task..
• Residual Error: unexplained variation in a statistical model
• Response Surface Model (RSM): A form of a design of experiment
(DOE) that visually shows the impact of two key process variables
on the key process output variable.
• Robust: The condition or state in which a response parameter
exhibits hermetically to external cause of a nonrandom nature (i.e.,
impervious to perturbing influence).

2-25 Do Not Reprint without permission of
SixSigma.us April, 2008
Glossary
• Rolled Through Put Yield (RTY): e -dpu. A ratio of the number of
products or services made with no re-work or repairs before the end
of the process compared to the total number produced. It can be
estimated using the above formula.
• Sample: One or more observations drawn from a larger collection of
observations or universe (population).
• Scatter Diagrams: Charts which allow the study of correlation, e.g.,
the relationship between two variables.
2-26 Do Not Reprint without permission of
SixSigma.us April, 2008
Glossary
• Six Sigma (6s): Sigma ―s‖ is a letter in the Greek alphabet. The term ―sigma‖ is used to designate the distribution or spread about the mean (average) of any process or procedure.
For a business or manufacturing process, the sigma value is a metric that indicates how well that process is performing. The higher the sigma value, the better. Sigma measures the capability of the process to perform defect-free-work. A defect is anything that results in customer dissatisfaction.
Sigma is a statistical unit of measure which reflects process capability. The sigma scale of measure is perfectly correlated to such characteristics as defects-per-unit, parts-per million defective, and the probability of a failure/error. Meaning no more than 3.4 parts per Million.
• Special Cause: See ASSIGNABLE CAUSE.
• Stable Process: A process that is free of assignable causes, e.g., in statistical control.
2-27 Do Not Reprint without permission of
SixSigma.us April, 2008
Glossary
• Standard Deviation: A statistical index of variability which describes the spread.
• Statistical Control: A quantitative condition that describes a process that is free of assignable/special causes of variation, e.g., variation in the central tendency and variance. Such a condition is most often evidenced on a control chart, i.e., a control chart that displays an absence of nonrandom variation.
• Statistical Process Control: The application of statistical methods and procedures relative to a process and a given set of standards.
• Strawman: Term used to describe rough initial outline of a presentation, concept or idea.
• Subgroup: A logical grouping of objects or events which displays only random event-to-event variations, e.g., the objects or events are grouped to create homogenous groups free of assignable or special causes. By virtue of the minimum within group variability, any change in the central tendency or variance of the universe will be reflected in the ―subgroup-to-subgroup’ variability.

2-28 Do Not Reprint without permission of
SixSigma.us April, 2008
Glossary
• Symptom: That which serves as evidence of something not seen.
• System: That which is connected according to a scheme.
• Systematic Variables: A pattern that displays predictable tendencies.
• Theory: A plausible or scientifically acceptable general principle offered to explain phenomena.
• Test of Significance: A procedure to determine whether a quantity subjected to random variation differs from a postulated value by an amount greater than that due to random variation alone.
• Unit: An individual product or service defined in terms of what is a unit to a customer.
• Unnatural Pattern: Any pattern in which a significant number of the measurements do not group themselves around a center line; when the pattern is unnatural, it means that outside disturbances are present and are affecting the process.

2-29 Do Not Reprint without permission of
SixSigma.us April, 2008
Glossary
• Upper Control Limit: A horizontal line on a control chart (usually
dotted) which Represents the Upper Limits of Process Capability.
• Variable: A characteristic that may take on different values.
• Variables Data: Numerical measurements made at the interval or
ratio level; quantitative data, e.g., ohms, voltage, diameter;
subdivisions of the measurement scale are conceptually meaningful,
e.g., 1.6478 volts.
• Variation: Any quantifiable difference between individual
measurements; such differences can be classified as being due to
common causes (random) or special causes (assignable).
• X and R Charts: A control chart which is a representation of
process capability over time; displays the variability in the process
average and range across time.

2-30 Do Not Reprint without permission of
SixSigma.us April, 2008
Notes

2-31 Do Not Reprint without permission of
SixSigma.us April, 2008
Notes