single fluorescent protein-based ca2+ sensors with increased dynamic range
TRANSCRIPT
BioMed CentralBMC Biotechnology
ss
Open AcceResearch articleSingle fluorescent protein-based Ca2+ sensors with increased dynamic rangeEkaterina A Souslova1, Vsevolod V Belousov1, John G Lock2, Staffan Strömblad2, Sergey Kasparov3, Alexey P Bolshakov4, Vsevolod G Pinelis4, Yulii A Labas5, Sergey Lukyanov1, Lorenz M Mayr6 and Dmitriy M Chudakov*1Address: 1Shemiakin-Ovchinnikov Institute of Bioorganic Chemistry, RAS, Miklukho-Maklaya 16/10, 117997 Moscow, Russia, 2Karolinska Institutet, Department of Biosciences and Nutrition, Novum, SE-141 57 Huddinge, Sweden, 3Department of Physiology School of Medical Sciences University of Bristol, BS8 1TD, Bristol, UK, 4Scientific Centre for Children's Health RAMS, Lomonosovskii pr. 61/2, Moscow, Russia, 5Bakh Institute of Biochemistry, RAS, Leninsky 33, 117071 Moscow, Russia and 6Novartis Pharma AG, NIBR/DT/LDC, Lichtstrasse 35, CH-4002 Basel, Switzerland
Email: Ekaterina A Souslova - [email protected]; Vsevolod V Belousov - [email protected]; John G Lock - [email protected]; Staffan Strömblad - [email protected]; Sergey Kasparov - [email protected]; Alexey P Bolshakov - [email protected]; Vsevolod G Pinelis - [email protected]; Yulii A Labas - [email protected]; Sergey Lukyanov - [email protected]; Lorenz M Mayr - [email protected]; Dmitriy M Chudakov* - [email protected]
* Corresponding author
AbstractBackground: Genetically encoded sensors developed on the basis of green fluorescent protein(GFP)-like proteins are becoming more and more popular instruments for monitoring cellularanalytes and enzyme activities in living cells and transgenic organisms. In particular, a number ofCa2+ sensors have been developed, either based on FRET (Fluorescence Resonance EnergyTransfer) changes between two GFP-mutants or on the change in fluorescence intensity of a singlecircularly permuted fluorescent protein (cpFP).
Results: Here we report significant progress on the development of the latter type of Ca2+
sensors. Derived from the knowledge of previously reported cpFP-based sensors, we generated aset of cpFP-based indicators with different spectral properties and fluorescent responses tochanges in Ca2+ concentration. Two variants, named Case12 and Case16, were characterized byparticular high brightness and superior dynamic range, up to 12-fold and 16.5-fold increase in greenfluorescence between Ca2+-free and Ca2+-saturated forms. We demonstrated the high potential ofthese sensors on various examples, including monitoring of Ca2+ response to a prolonged glutamatetreatment in cortical neurons.
Conclusion: We believe that expanded dynamic range, high brightness and relatively high pH-stability should make Case12 and Case16 popular research tools both in scientific studies and highthroughput screening assays.
Published: 29 June 2007
BMC Biotechnology 2007, 7:37 doi:10.1186/1472-6750-7-37
Received: 19 February 2007Accepted: 29 June 2007
This article is available from: http://www.biomedcentral.com/1472-6750/7/37
© 2007 Souslova et al; licensee BioMed Central Ltd. This is an Open Access article distributed under the terms of the Creative Commons Attribution License (http://creativecommons.org/licenses/by/2.0), which permits unrestricted use, distribution, and reproduction in any medium, provided the original work is properly cited.
Page 1 of 10(page number not for citation purposes)
BMC Biotechnology 2007, 7:37 http://www.biomedcentral.com/1472-6750/7/37
BackgroundAn increasing number of genetically encoded fluorescentsensors have recently been developed on the basis of GFP-like proteins [1-3]. However, currently available geneti-cally encoded sensors are characterized by low signalintensity and limited dynamic range (maximum changein fluorescence ratio or intensity) [1,4,5], insufficient forroutine applications in high throughput screening (HTS)assays and restricting sensitivity of precise single-cell stud-ies. At the same time, genetically encoded sensors providea much wider flexibility, allowing to be targeted to anychosen cellular compartment, to generate stable cell linesand transgenic animals, to be expressed in a particular tis-sue and/or in a temporally controlled manner under aspecific promoter. Therefore, development of geneticallyencoded sensors characterized by increased dynamicrange and signal intensity remains an actual task.
One of the most promising approaches to create geneti-cally encoded sensors is based on the circularly permutedfluorescent protein (cpFP) fused to or inserted into sensi-tive domain(s) [6-12]. In the presence of an analyte or inresponse to a cellular event, sensitive domain(s) under-goe(s) structural rearrangements, inducing conforma-tional changes of cpFP and resulting in its alteredfluorescent properties. Circular permutation allows plac-ing sensitive domains in a close proximity to the chromo-phore environment of cpFP within chimeric sensorconstruct. Therefore, conformational changes of the sensi-tive domains and their influence on the spectral proper-ties of cpFP is direct and can lead to significant changes inthe fluorescent signal.
In particular, such Ca2+ sensors as GCaMPs [8,12] and Per-icams [7] were constructed by fusing calmodulin and itstarget peptide M13 (fragment of myosin light chainkinase) to cpFP. In the presence of Ca2+, calmodulin bindsto the M13 peptide, causing conformational changes inthe vicinity of the chromophore and thereby influencingcpFP fluorescence. Similar sensors, named Camgaroos[6,9], are formally based on the non-permuted GFP, butcontain an inserted calmodulin molecule at positionTyr145 of EYFP, which is essentially similar to the circularpermutation approach.
In most cases, it was shown that spectral changes of thecpFP-based sensors fluorescence occur through thechromophore transition from the neutral (protonated) tothe charged (anionic) form. Noteworthy, the same mech-anism leads to 100–400 fold increase of green fluores-cence after photoactivation of so called photoactivatablefluorescent proteins, PA-GFP [13] and PS-CFP [14]. Thisindicates that potentially the same dynamic ranges maybe achieved for the cpFP-based fluorescent sensors, pro-vided that the amino acid residues surrounding the
chromophore are adapted properly and the conforma-tional changes of the sensitive domains cause favorableconformational alterations in cpFP.
Here we describe the development of high dynamic rangecpFP-based Ca2+ sensors, that show up to 16.5-foldincrease of the fluorescent signal (F/F0, fluorescenceincrease, fold) in response to Ca2+. These sensors are morepH stable compared to Flash-pericam [7] and GCaMP1.6[8] and have approximately 3-fold higher dynamic rangecompared to GCaMPs [8,12]. We believe that the "fluores-cent core" of the sensors reported herein may beemployed to develop sensors of various specificity withincreased dynamic range, allowing reliable quantitativeanalyses of cellular signaling pathways.
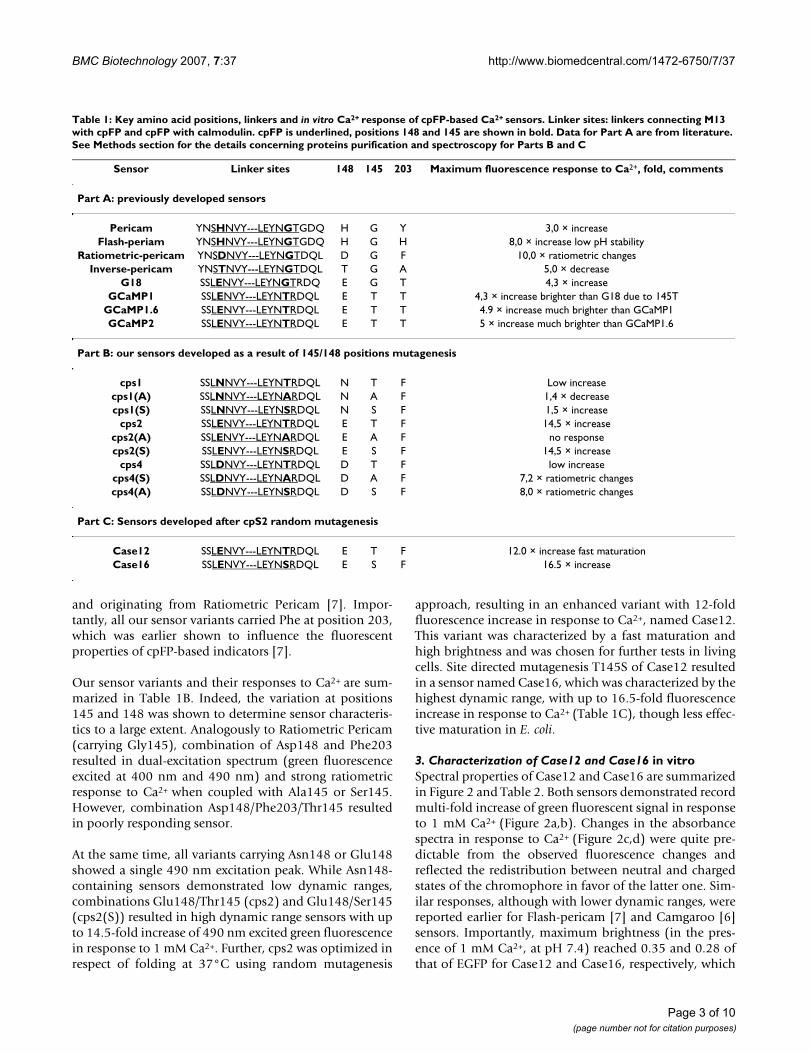
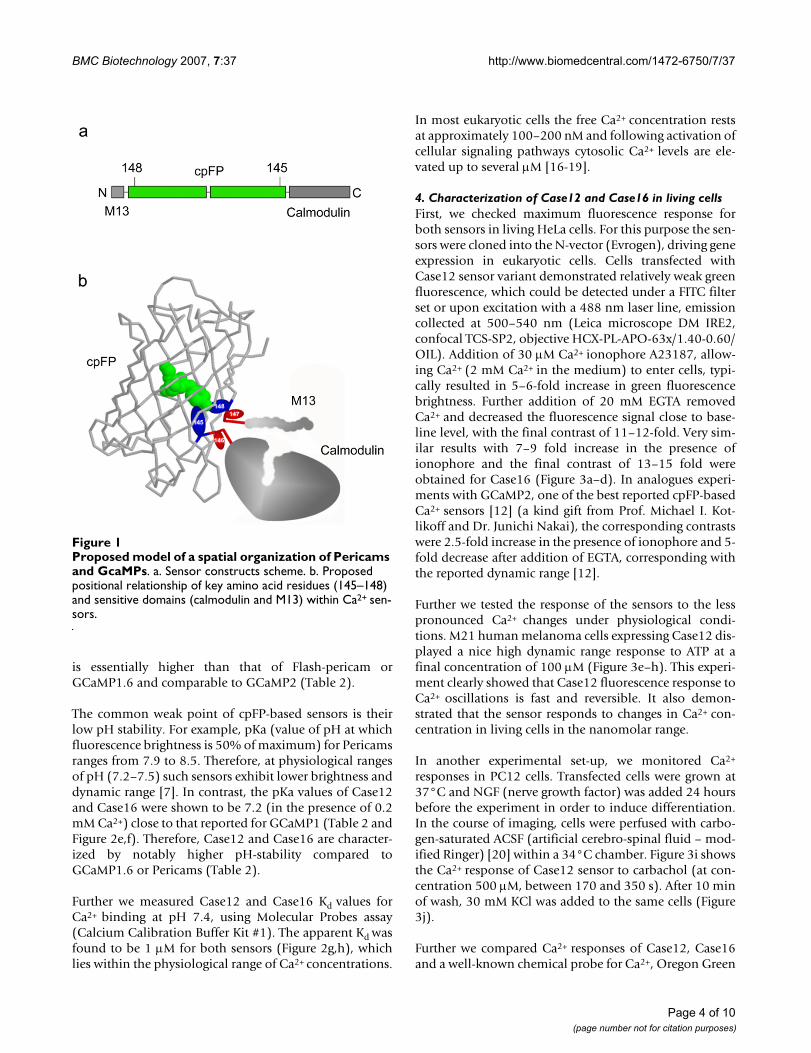
Results and discussion1. Analyzing the break pointFirst we compared the break points of circular permuta-tion within the β-barrel of fluorescent proteins used inPericams and GCaMPs Ca2+ sensors (Table 1A). Remarka-bly, amino acid residues corresponding to the positions145 and 148 of the intact Aequorea victoria GFP (avGFP)(Figure 1a) were shown to substantially determine the flu-orescent properties of the sensors [7,8]. Therefore, it islikely that in Pericams and GCaMPs the amino acid resi-dues 148 and 145 are in a close proximity to the chromo-phore, similarly to the native avGFP (PDB ID: 1GFL) [15].The amino acid residue preceding position 148 and theone following position 145 should be the outermostwithin the cpFP beta-barrel (Figure 1b). It can be pre-sumed that the positional relationship of these key aminoacid residues and the sensitive domains is common forthe sensors described in Refs. [7,8,10-12] and this familyof circularly permuted variants can be generally namedcpFP147-146. A similar spatial organization can be pro-posed for the Camgaroo sensors [6,9].
2. Adapting the chromophore environment within a Ca2+
sensorLooking for the sensor variants with expanded dynamicrange, we generated a set of Ca2+ sensor constructs whichvaried at positions 148 and 145. In GCaMPs and Pericamsposition 145 was either Gly or Thr (Table 1A). We pre-sumed that two other amino acid residues with rathercompact side chains, Ser and Ala, wouldn't cause spatialconflict at position 145, while they would alter the spec-tral properties of the sensor. Using site-directed mutagen-esis, we ntroduced either Ser, Ala or Thr in position 145,in combination with Asp148 (which earlier resulted inRatiometric Pericam), Glu148 (used in GCaMPs), orAsn148. The overall sensors design was similar to that ofGCaMPs. We used M13 peptide, a calmodulin domainand linkers lengths identical to those reported forGCaMP1 [8], combined with cpFP described in Ref. [10]
Page 2 of 10(page number not for citation purposes)
BMC Biotechnology 2007, 7:37 http://www.biomedcentral.com/1472-6750/7/37
and originating from Ratiometric Pericam [7]. Impor-tantly, all our sensor variants carried Phe at position 203,which was earlier shown to influence the fluorescentproperties of cpFP-based indicators [7].
Our sensor variants and their responses to Ca2+ are sum-marized in Table 1B. Indeed, the variation at positions145 and 148 was shown to determine sensor characteris-tics to a large extent. Analogously to Ratiometric Pericam(carrying Gly145), combination of Asp148 and Phe203resulted in dual-excitation spectrum (green fluorescenceexcited at 400 nm and 490 nm) and strong ratiometricresponse to Ca2+ when coupled with Ala145 or Ser145.However, combination Asp148/Phe203/Thr145 resultedin poorly responding sensor.
At the same time, all variants carrying Asn148 or Glu148showed a single 490 nm excitation peak. While Asn148-containing sensors demonstrated low dynamic ranges,combinations Glu148/Thr145 (cps2) and Glu148/Ser145(cps2(S)) resulted in high dynamic range sensors with upto 14.5-fold increase of 490 nm excited green fluorescencein response to 1 mM Ca2+. Further, cps2 was optimized inrespect of folding at 37°C using random mutagenesis
approach, resulting in an enhanced variant with 12-foldfluorescence increase in response to Ca2+, named Case12.This variant was characterized by a fast maturation andhigh brightness and was chosen for further tests in livingcells. Site directed mutagenesis T145S of Case12 resultedin a sensor named Case16, which was characterized by thehighest dynamic range, with up to 16.5-fold fluorescenceincrease in response to Ca2+ (Table 1C), though less effec-tive maturation in E. coli.
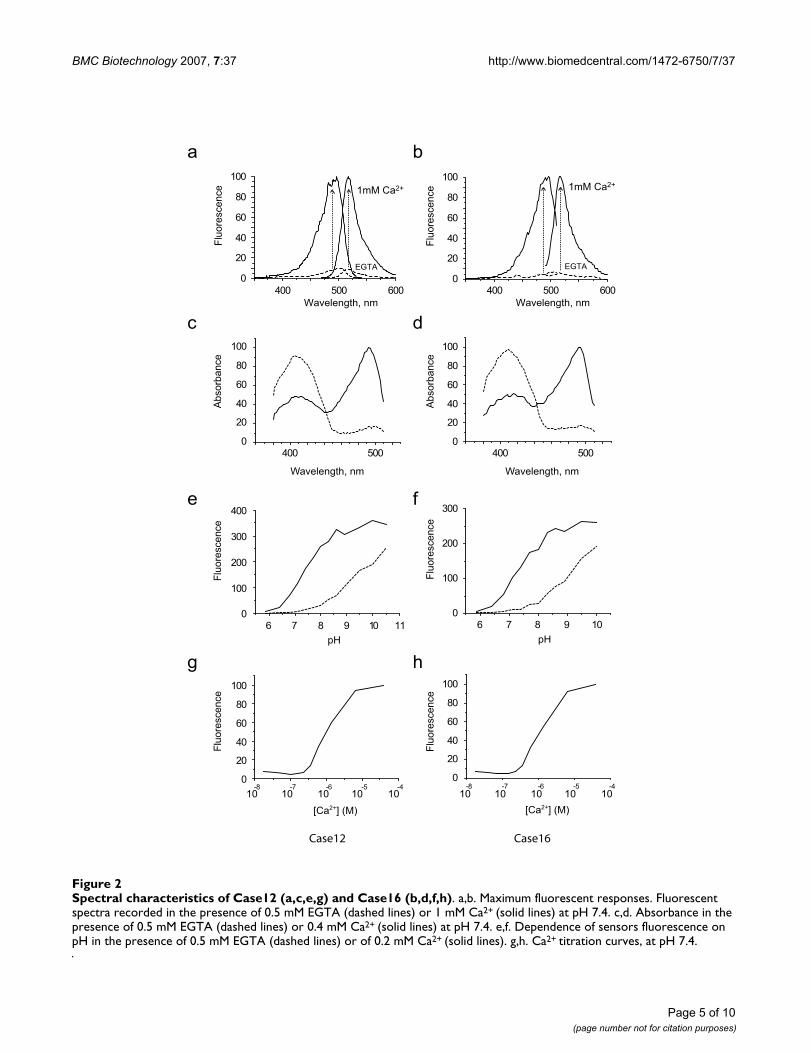
3. Characterization of Case12 and Case16 in vitroSpectral properties of Case12 and Case16 are summarizedin Figure 2 and Table 2. Both sensors demonstrated recordmulti-fold increase of green fluorescent signal in responseto 1 mM Ca2+ (Figure 2a,b). Changes in the absorbancespectra in response to Ca2+ (Figure 2c,d) were quite pre-dictable from the observed fluorescence changes andreflected the redistribution between neutral and chargedstates of the chromophore in favor of the latter one. Sim-ilar responses, although with lower dynamic ranges, werereported earlier for Flash-pericam [7] and Camgaroo [6]sensors. Importantly, maximum brightness (in the pres-ence of 1 mM Ca2+, at pH 7.4) reached 0.35 and 0.28 ofthat of EGFP for Case12 and Case16, respectively, which
Table 1: Key amino acid positions, linkers and in vitro Ca2+ response of cpFP-based Ca2+ sensors. Linker sites: linkers connecting M13 with cpFP and cpFP with calmodulin. cpFP is underlined, positions 148 and 145 are shown in bold. Data for Part A are from literature. See Methods section for the details concerning proteins purification and spectroscopy for Parts B and C
Sensor Linker sites 148 145 203 Maximum fluorescence response to Ca2+, fold, comments
Part A: previously developed sensors
Pericam YNSHNVY---LEYNGTGDQ H G Y 3,0 × increaseFlash-periam YNSHNVY---LEYNGTGDQ H G H 8,0 × increase low pH stability
Ratiometric-pericam YNSDNVY---LEYNGTDQL D G F 10,0 × ratiometric changesInverse-pericam YNSTNVY---LEYNGTDQL T G A 5,0 × decrease
G18 SSLENVY---LEYNGTRDQ E G T 4,3 × increaseGCaMP1 SSLENVY---LEYNTRDQL E T T 4,3 × increase brighter than G18 due to 145T
GCaMP1.6 SSLENVY---LEYNTRDQL E T T 4.9 × increase much brighter than GCaMP1GCaMP2 SSLENVY---LEYNTRDQL E T T 5 × increase much brighter than GCaMP1.6
Part B: our sensors developed as a result of 145/148 positions mutagenesis
cps1 SSLNNVY---LEYNTRDQL N T F Low increasecps1(A) SSLNNVY---LEYNARDQL N A F 1,4 × decreasecps1(S) SSLNNVY---LEYNSRDQL N S F 1,5 × increase
cps2 SSLENVY---LEYNTRDQL E T F 14,5 × increasecps2(A) SSLENVY---LEYNARDQL E A F no responsecps2(S) SSLENVY---LEYNSRDQL E S F 14,5 × increase
cps4 SSLDNVY---LEYNTRDQL D T F low increasecps4(S) SSLDNVY---LEYNARDQL D A F 7,2 × ratiometric changescps4(A) SSLDNVY---LEYNSRDQL D S F 8,0 × ratiometric changes
Part C: Sensors developed after cpS2 random mutagenesis
Case12 SSLENVY---LEYNTRDQL E T F 12.0 × increase fast maturationCase16 SSLENVY---LEYNSRDQL E S F 16.5 × increase
Page 3 of 10(page number not for citation purposes)
BMC Biotechnology 2007, 7:37 http://www.biomedcentral.com/1472-6750/7/37
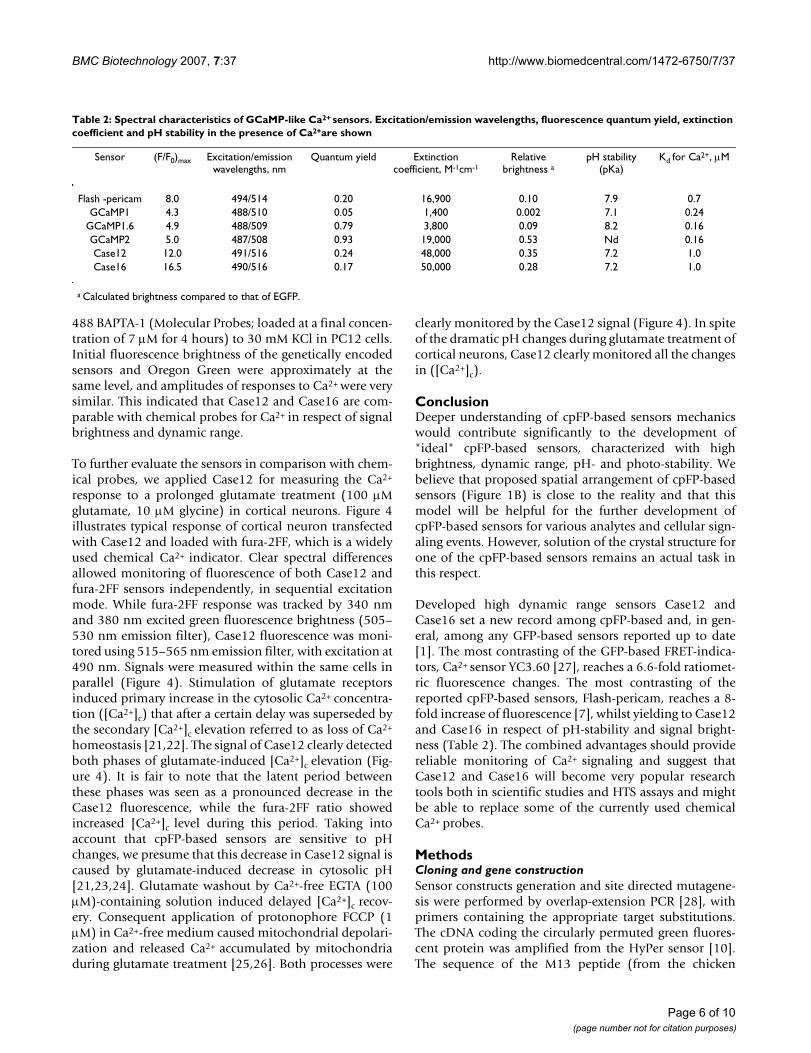
is essentially higher than that of Flash-pericam orGCaMP1.6 and comparable to GCaMP2 (Table 2).
The common weak point of cpFP-based sensors is theirlow pH stability. For example, pKa (value of pH at whichfluorescence brightness is 50% of maximum) for Pericamsranges from 7.9 to 8.5. Therefore, at physiological rangesof pH (7.2–7.5) such sensors exhibit lower brightness anddynamic range [7]. In contrast, the pKa values of Case12and Case16 were shown to be 7.2 (in the presence of 0.2mM Ca2+) close to that reported for GCaMP1 (Table 2 andFigure 2e,f). Therefore, Case12 and Case16 are character-ized by notably higher pH-stability compared toGCaMP1.6 or Pericams (Table 2).
Further we measured Case12 and Case16 Kd values forCa2+ binding at pH 7.4, using Molecular Probes assay(Calcium Calibration Buffer Kit #1). The apparent Kd wasfound to be 1 μM for both sensors (Figure 2g,h), whichlies within the physiological range of Ca2+ concentrations.
In most eukaryotic cells the free Ca2+ concentration restsat approximately 100–200 nM and following activation ofcellular signaling pathways cytosolic Ca2+ levels are ele-vated up to several μM [16-19].
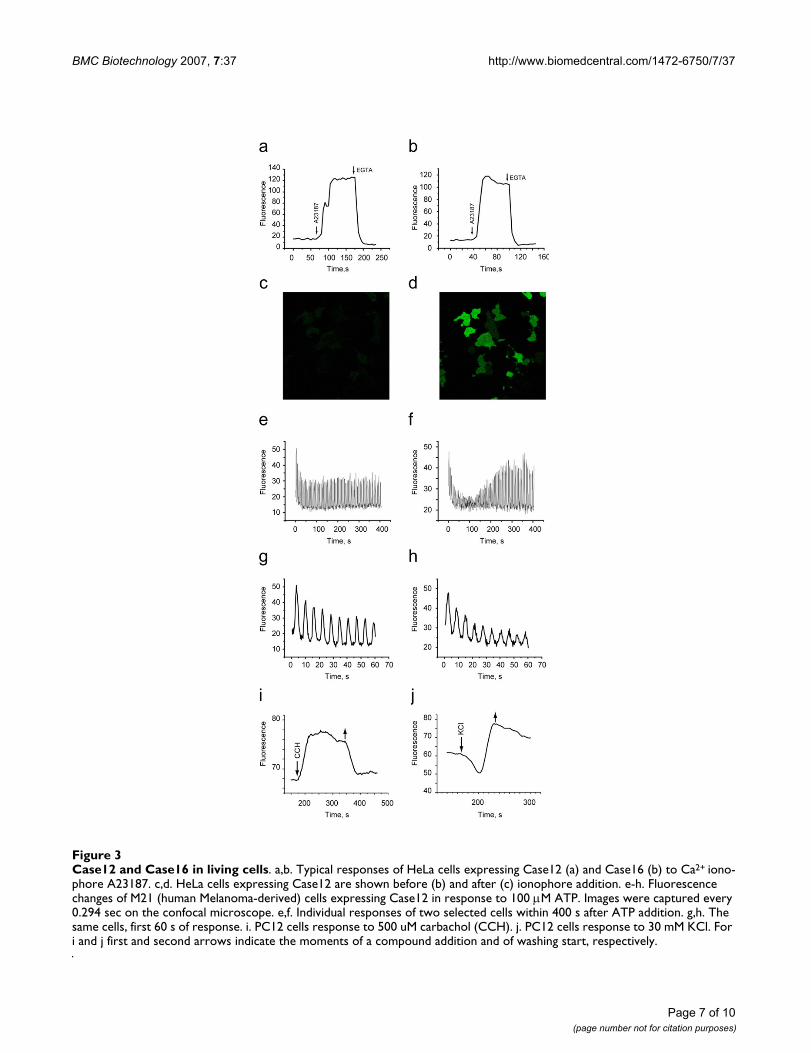
4. Characterization of Case12 and Case16 in living cellsFirst, we checked maximum fluorescence response forboth sensors in living HeLa cells. For this purpose the sen-sors were cloned into the N-vector (Evrogen), driving geneexpression in eukaryotic cells. Cells transfected withCase12 sensor variant demonstrated relatively weak greenfluorescence, which could be detected under a FITC filterset or upon excitation with a 488 nm laser line, emissioncollected at 500–540 nm (Leica microscope DM IRE2,confocal TCS-SP2, objective HCX-PL-APO-63x/1.40-0.60/OIL). Addition of 30 μM Ca2+ ionophore A23187, allow-ing Ca2+ (2 mM Ca2+ in the medium) to enter cells, typi-cally resulted in 5–6-fold increase in green fluorescencebrightness. Further addition of 20 mM EGTA removedCa2+ and decreased the fluorescence signal close to base-line level, with the final contrast of 11–12-fold. Very sim-ilar results with 7–9 fold increase in the presence ofionophore and the final contrast of 13–15 fold wereobtained for Case16 (Figure 3a–d). In analogues experi-ments with GCaMP2, one of the best reported cpFP-basedCa2+ sensors [12] (a kind gift from Prof. Michael I. Kot-likoff and Dr. Junichi Nakai), the corresponding contrastswere 2.5-fold increase in the presence of ionophore and 5-fold decrease after addition of EGTA, corresponding withthe reported dynamic range [12].
Further we tested the response of the sensors to the lesspronounced Ca2+ changes under physiological condi-tions. M21 human melanoma cells expressing Case12 dis-played a nice high dynamic range response to ATP at afinal concentration of 100 μM (Figure 3e–h). This experi-ment clearly showed that Case12 fluorescence response toCa2+ oscillations is fast and reversible. It also demon-strated that the sensor responds to changes in Ca2+ con-centration in living cells in the nanomolar range.
In another experimental set-up, we monitored Ca2+
responses in PC12 cells. Transfected cells were grown at37°C and NGF (nerve growth factor) was added 24 hoursbefore the experiment in order to induce differentiation.In the course of imaging, cells were perfused with carbo-gen-saturated ACSF (artificial cerebro-spinal fluid – mod-ified Ringer) [20] within a 34°C chamber. Figure 3i showsthe Ca2+ response of Case12 sensor to carbachol (at con-centration 500 μM, between 170 and 350 s). After 10 minof wash, 30 mM KCl was added to the same cells (Figure3j).
Further we compared Ca2+ responses of Case12, Case16and a well-known chemical probe for Ca2+, Oregon Green
Proposed model of a spatial organization of Pericams and GcaMPsFigure 1Proposed model of a spatial organization of Pericams and GcaMPs. a. Sensor constructs scheme. b. Proposed positional relationship of key amino acid residues (145–148) and sensitive domains (calmodulin and M13) within Ca2+ sen-sors.
Page 4 of 10(page number not for citation purposes)
BMC Biotechnology 2007, 7:37 http://www.biomedcentral.com/1472-6750/7/37
Page 5 of 10(page number not for citation purposes)
Spectral characteristics of Case12 (a,c,e,g) and Case16 (b,d,f,h)Figure 2Spectral characteristics of Case12 (a,c,e,g) and Case16 (b,d,f,h). a,b. Maximum fluorescent responses. Fluorescent spectra recorded in the presence of 0.5 mM EGTA (dashed lines) or 1 mM Ca2+ (solid lines) at pH 7.4. c,d. Absorbance in the presence of 0.5 mM EGTA (dashed lines) or 0.4 mM Ca2+ (solid lines) at pH 7.4. e,f. Dependence of sensors fluorescence on pH in the presence of 0.5 mM EGTA (dashed lines) or of 0.2 mM Ca2+ (solid lines). g,h. Ca2+ titration curves, at pH 7.4.
400 5000
20
40
60
80
100
Absorb
ance
400 5000
20
40
60
80
100
Absorb
ance
Wavelength, nmWavelength, nm
Case12 Case16
6 7 8 9 10 110
100
200
300
400
Flu
ore
scence
pH
6 7 8 9 100
100
200
300
Flu
ore
scence
pH
-8 -7 -6 -5 -40
20
40
60
80
100
Flu
ore
scence
[Ca2+] (M)
-8 -7 -6 -5 -40
20
40
60
80
100
Flu
ore
scence
[Ca2+] (M)
10 10 10 10 10 10 10 10 10 10
a
400 500 6000
20
40
60
80
100
Flu
ore
scence
Wavelength, nm
1mM Ca2+
EGTA
b
c d
e f
g h
400 500 600
Wavelength, nm
0
20
40
60
80
100
Flu
ore
scence 1mM Ca2+
EGTA
BMC Biotechnology 2007, 7:37 http://www.biomedcentral.com/1472-6750/7/37
488 BAPTA-1 (Molecular Probes; loaded at a final concen-tration of 7 μM for 4 hours) to 30 mM KCl in PC12 cells.Initial fluorescence brightness of the genetically encodedsensors and Oregon Green were approximately at thesame level, and amplitudes of responses to Ca2+ were verysimilar. This indicated that Case12 and Case16 are com-parable with chemical probes for Ca2+ in respect of signalbrightness and dynamic range.
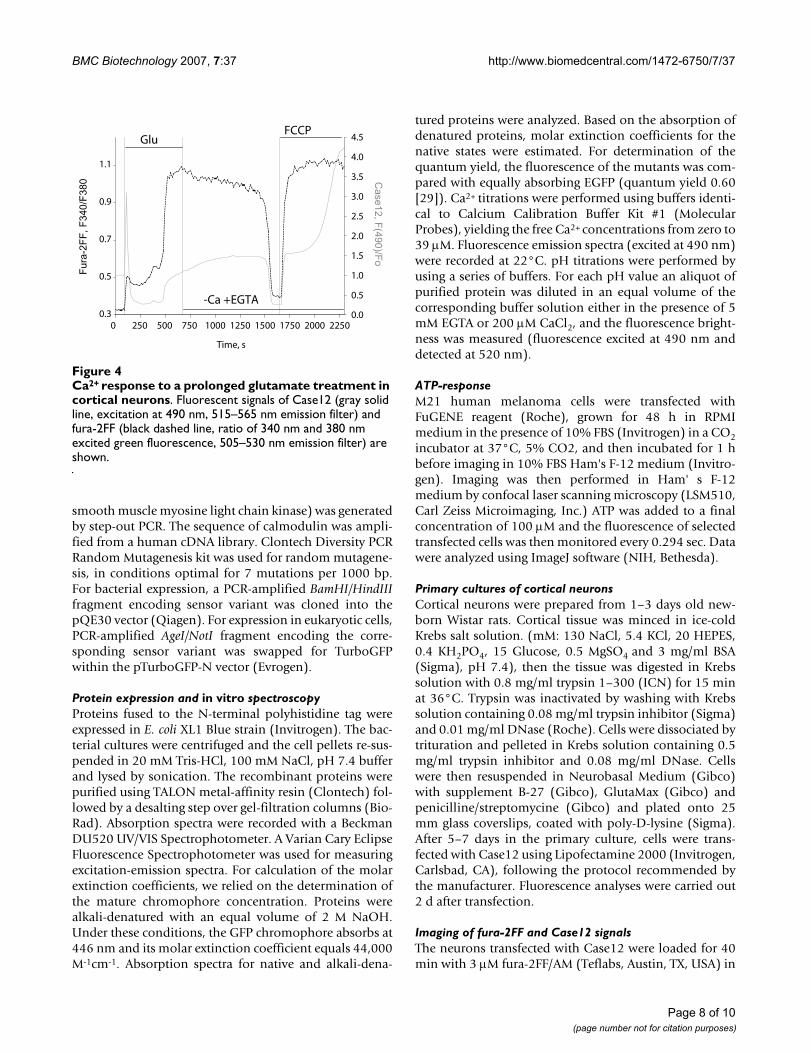
To further evaluate the sensors in comparison with chem-ical probes, we applied Case12 for measuring the Ca2+
response to a prolonged glutamate treatment (100 μMglutamate, 10 μM glycine) in cortical neurons. Figure 4illustrates typical response of cortical neuron transfectedwith Case12 and loaded with fura-2FF, which is a widelyused chemical Ca2+ indicator. Clear spectral differencesallowed monitoring of fluorescence of both Case12 andfura-2FF sensors independently, in sequential excitationmode. While fura-2FF response was tracked by 340 nmand 380 nm excited green fluorescence brightness (505–530 nm emission filter), Case12 fluorescence was moni-tored using 515–565 nm emission filter, with excitation at490 nm. Signals were measured within the same cells inparallel (Figure 4). Stimulation of glutamate receptorsinduced primary increase in the cytosolic Ca2+ concentra-tion ([Ca2+]c) that after a certain delay was superseded bythe secondary [Ca2+]c elevation referred to as loss of Ca2+
homeostasis [21,22]. The signal of Case12 clearly detectedboth phases of glutamate-induced [Ca2+]c elevation (Fig-ure 4). It is fair to note that the latent period betweenthese phases was seen as a pronounced decrease in theCase12 fluorescence, while the fura-2FF ratio showedincreased [Ca2+]c level during this period. Taking intoaccount that cpFP-based sensors are sensitive to pHchanges, we presume that this decrease in Case12 signal iscaused by glutamate-induced decrease in cytosolic pH[21,23,24]. Glutamate washout by Ca2+-free EGTA (100μM)-containing solution induced delayed [Ca2+]c recov-ery. Consequent application of protonophore FCCP (1μM) in Ca2+-free medium caused mitochondrial depolari-zation and released Ca2+ accumulated by mitochondriaduring glutamate treatment [25,26]. Both processes were
clearly monitored by the Case12 signal (Figure 4). In spiteof the dramatic pH changes during glutamate treatment ofcortical neurons, Case12 clearly monitored all the changesin ([Ca2+]c).
ConclusionDeeper understanding of cpFP-based sensors mechanicswould contribute significantly to the development of"ideal" cpFP-based sensors, characterized with highbrightness, dynamic range, pH- and photo-stability. Webelieve that proposed spatial arrangement of cpFP-basedsensors (Figure 1B) is close to the reality and that thismodel will be helpful for the further development ofcpFP-based sensors for various analytes and cellular sign-aling events. However, solution of the crystal structure forone of the cpFP-based sensors remains an actual task inthis respect.
Developed high dynamic range sensors Case12 andCase16 set a new record among cpFP-based and, in gen-eral, among any GFP-based sensors reported up to date[1]. The most contrasting of the GFP-based FRET-indica-tors, Ca2+ sensor YC3.60 [27], reaches a 6.6-fold ratiomet-ric fluorescence changes. The most contrasting of thereported cpFP-based sensors, Flash-pericam, reaches a 8-fold increase of fluorescence [7], whilst yielding to Case12and Case16 in respect of pH-stability and signal bright-ness (Table 2). The combined advantages should providereliable monitoring of Ca2+ signaling and suggest thatCase12 and Case16 will become very popular researchtools both in scientific studies and HTS assays and mightbe able to replace some of the currently used chemicalCa2+ probes.
MethodsCloning and gene constructionSensor constructs generation and site directed mutagene-sis were performed by overlap-extension PCR [28], withprimers containing the appropriate target substitutions.The cDNA coding the circularly permuted green fluores-cent protein was amplified from the HyPer sensor [10].The sequence of the M13 peptide (from the chicken
Table 2: Spectral characteristics of GCaMP-like Ca2+ sensors. Excitation/emission wavelengths, fluorescence quantum yield, extinction coefficient and pH stability in the presence of Ca2+are shown
Sensor (F/F0)max Excitation/emission wavelengths, nm
Quantum yield Extinction coefficient, M-1cm-1
Relative brightness a
pH stability (pKa)
Kd for Ca2+, μM
Flash -pericam 8.0 494/514 0.20 16,900 0.10 7.9 0.7GCaMP1 4.3 488/510 0.05 1,400 0.002 7.1 0.24
GCaMP1.6 4.9 488/509 0.79 3,800 0.09 8.2 0.16GCaMP2 5.0 487/508 0.93 19,000 0.53 Nd 0.16Case12 12.0 491/516 0.24 48,000 0.35 7.2 1.0Case16 16.5 490/516 0.17 50,000 0.28 7.2 1.0
a Calculated brightness compared to that of EGFP.
Page 6 of 10(page number not for citation purposes)
BMC Biotechnology 2007, 7:37 http://www.biomedcentral.com/1472-6750/7/37
Page 7 of 10(page number not for citation purposes)
Case12 and Case16 in living cellsFigure 3Case12 and Case16 in living cells. a,b. Typical responses of HeLa cells expressing Case12 (a) and Case16 (b) to Ca2+ iono-phore A23187. c,d. HeLa cells expressing Case12 are shown before (b) and after (c) ionophore addition. e-h. Fluorescence changes of M21 (human Melanoma-derived) cells expressing Case12 in response to 100 μM ATP. Images were captured every 0.294 sec on the confocal microscope. e,f. Individual responses of two selected cells within 400 s after ATP addition. g,h. The same cells, first 60 s of response. i. PC12 cells response to 500 uM carbachol (CCH). j. PC12 cells response to 30 mM KCl. For i and j first and second arrows indicate the moments of a compound addition and of washing start, respectively.
BMC Biotechnology 2007, 7:37 http://www.biomedcentral.com/1472-6750/7/37
smooth muscle myosine light chain kinase) was generatedby step-out PCR. The sequence of calmodulin was ampli-fied from a human cDNA library. Clontech Diversity PCRRandom Mutagenesis kit was used for random mutagene-sis, in conditions optimal for 7 mutations per 1000 bp.For bacterial expression, a PCR-amplified BamHI/HindIIIfragment encoding sensor variant was cloned into thepQE30 vector (Qiagen). For expression in eukaryotic cells,PCR-amplified AgeI/NotI fragment encoding the corre-sponding sensor variant was swapped for TurboGFPwithin the pTurboGFP-N vector (Evrogen).
Protein expression and in vitro spectroscopyProteins fused to the N-terminal polyhistidine tag wereexpressed in E. coli XL1 Blue strain (Invitrogen). The bac-terial cultures were centrifuged and the cell pellets re-sus-pended in 20 mM Tris-HCl, 100 mM NaCl, pH 7.4 bufferand lysed by sonication. The recombinant proteins werepurified using TALON metal-affinity resin (Clontech) fol-lowed by a desalting step over gel-filtration columns (Bio-Rad). Absorption spectra were recorded with a BeckmanDU520 UV/VIS Spectrophotometer. A Varian Cary EclipseFluorescence Spectrophotometer was used for measuringexcitation-emission spectra. For calculation of the molarextinction coefficients, we relied on the determination ofthe mature chromophore concentration. Proteins werealkali-denatured with an equal volume of 2 M NaOH.Under these conditions, the GFP chromophore absorbs at446 nm and its molar extinction coefficient equals 44,000M-1cm-1. Absorption spectra for native and alkali-dena-
tured proteins were analyzed. Based on the absorption ofdenatured proteins, molar extinction coefficients for thenative states were estimated. For determination of thequantum yield, the fluorescence of the mutants was com-pared with equally absorbing EGFP (quantum yield 0.60[29]). Ca2+ titrations were performed using buffers identi-cal to Calcium Calibration Buffer Kit #1 (MolecularProbes), yielding the free Ca2+ concentrations from zero to39 μM. Fluorescence emission spectra (excited at 490 nm)were recorded at 22°C. pH titrations were performed byusing a series of buffers. For each pH value an aliquot ofpurified protein was diluted in an equal volume of thecorresponding buffer solution either in the presence of 5mM EGTA or 200 μM CaCl2, and the fluorescence bright-ness was measured (fluorescence excited at 490 nm anddetected at 520 nm).
ATP-responseM21 human melanoma cells were transfected withFuGENE reagent (Roche), grown for 48 h in RPMImedium in the presence of 10% FBS (Invitrogen) in a CO2incubator at 37°C, 5% CO2, and then incubated for 1 hbefore imaging in 10% FBS Ham's F-12 medium (Invitro-gen). Imaging was then performed in Ham' s F-12medium by confocal laser scanning microscopy (LSM510,Carl Zeiss Microimaging, Inc.) ATP was added to a finalconcentration of 100 μM and the fluorescence of selectedtransfected cells was then monitored every 0.294 sec. Datawere analyzed using ImageJ software (NIH, Bethesda).
Primary cultures of cortical neuronsCortical neurons were prepared from 1–3 days old new-born Wistar rats. Cortical tissue was minced in ice-coldKrebs salt solution. (mM: 130 NaCl, 5.4 KCl, 20 HEPES,0.4 KH2PO4, 15 Glucose, 0.5 MgSO4 and 3 mg/ml BSA(Sigma), pH 7.4), then the tissue was digested in Krebssolution with 0.8 mg/ml trypsin 1–300 (ICN) for 15 minat 36°C. Trypsin was inactivated by washing with Krebssolution containing 0.08 mg/ml trypsin inhibitor (Sigma)and 0.01 mg/ml DNase (Roche). Cells were dissociated bytrituration and pelleted in Krebs solution containing 0.5mg/ml trypsin inhibitor and 0.08 mg/ml DNase. Cellswere then resuspended in Neurobasal Medium (Gibco)with supplement B-27 (Gibco), GlutaMax (Gibco) andpenicilline/streptomycine (Gibco) and plated onto 25mm glass coverslips, coated with poly-D-lysine (Sigma).After 5–7 days in the primary culture, cells were trans-fected with Case12 using Lipofectamine 2000 (Invitrogen,Carlsbad, CA), following the protocol recommended bythe manufacturer. Fluorescence analyses were carried out2 d after transfection.
Imaging of fura-2FF and Case12 signalsThe neurons transfected with Case12 were loaded for 40min with 3 μM fura-2FF/AM (Teflabs, Austin, TX, USA) in
Ca2+ response to a prolonged glutamate treatment in cortical neuronsFigure 4Ca2+ response to a prolonged glutamate treatment in cortical neurons. Fluorescent signals of Case12 (gray solid line, excitation at 490 nm, 515–565 nm emission filter) and fura-2FF (black dashed line, ratio of 340 nm and 380 nm excited green fluorescence, 505–530 nm emission filter) are shown.
0 250 500 750 1000 1250 1500 1750 2000 22500.3
0.5
0.7
0.9
1.1
0.0
0.5
1.0
1.5
2.0
2.5
3.0
3.5
4.0
4.5Glu
-Ca +EGTA
FCCP
Time, s
Case12, F
(490)/F
o
Fura
-2F
F, F
340/F
380
Page 8 of 10(page number not for citation purposes)
BMC Biotechnology 2007, 7:37 http://www.biomedcentral.com/1472-6750/7/37
the incubator in the presence of cell culture medium.Images were acquired on an epifluorescence invertedmicroscope Axiovert 200 (Zeiss, Germany) equipped witha 20× fluorite objective. [Ca2+]c was monitored in singlecells using excitation light provided by a Xenon arc lamp,the beam passing sequentially through 10 nm bandpassfilters centered at 340, 380 and 490 nm housed in a com-puter-controlled filter wheel (Sutter Instrument Co., CA,USA). Emitted fluorescence light was reflected through a505–530 nm filter (fura-2FF) and 515–565 nm filter(Case12) placed in computer-controlled filter wheel.Images were acquired by CCD camera (Roper Scientific,USA). All imaging data were collected and analyzed usingthe Metafluor 6.1 software (Universal Imaging Corp.,USA). The fura-2FF data are presented as the ratio of lightexcited at 340 nm/380 nm.
Experimental procedures with primary cultures of cortical neuronsThe coverslips with cell culture were placed into the 300μl experimental chamber at room temperature (25°C)and washed with a standard physiological recordingsaline containing (mM): 140 NaCl, 5.4 KCl, 2 MgCl2, 2CaCl2, 5 glucose and 20 HEPES, pH adjusted to 7.4 withNaOH. The solution in the chamber was removed by aperistaltic pump. The solutions were added into thechamber with the aid of a pipette. Washout of solutionswas made three times to completely remove old solutionfrom the chamber.
AbbreviationsGFP, green fluorescent protein; avGFP, Aequorea victoriagreen fluorescent protein, EGFP, enhanced green fluores-cent protein; cpFP, circularly permuted fluorescent pro-tein; FRET, fluorescence resonance energy transfer, NGF,nerve growth factor; ACSF, artificial cerebro-spinal fluid.
Authors' contributionsEAS carried out the molecular genetic work, protein puri-fication and microscopy studies. VVB carried out part ofthe molecular genetic work. JGL and SS took part in themicroscopy studies on living cells and drafted the manu-script. SK carried out part of the microscopy studies on liv-ing cells. APB and VGP carried out experiments withprimary cultures of cortical neurons and partially draftedthe manuscript. YAL, SL and LMM participated in thedesign of the study and drafted the manuscript. DMC con-ceived of the study, participated in its design and coordi-nation, wrote the manuscript, and carried out part of themicroscopy studies on living cells. All authors read andapproved the final manuscript.
AcknowledgementsWe gratefully acknowledge careful reading of the manuscript and continu-ous input and support to the project by Lukas Leder and Felix Freuler. We thank Prof. Michael I. Kotlikoff (Cornell University, Ithaca, NY) and Dr.
Junichi Nakai (RIKEN Brain Science Institute, Saitama, Japan) for the kind gift of GCaMP2. This work was supported by a research grant from Novartis Pharma AG, Basel Switzerland as well as by grants from Molecular and Cell Biology Program RAS, EC FP-6 Integrated Project LSHG-CT-2003-503259, RFBR grant 07-04-12189-obr and the National Institutes of Health (GM070358). D.M.C. is supported by Grants of the President of Russian Federation MK-8236.2006.4 and Russian Science Support Foundation. Sup-ported by a grant to SS from the Swedish Institute for exchange between Sweden and Russia. SS holds a senior scientist position from the Swedish research council and was also supported by project grants from the Swed-ish research council and the Swedish cancer society. JGL was supported by a postdoctoral fellowship from the Wenner-Gren foundations.
References1. Griesbeck O: Fluorescent proteins as sensors for cellular func-
tions. Curr Opin Neurobiol 2004, 14:636-641.2. Miyawaki A: Visualization of the spatial and temporal dynam-
ics of intracellular signaling. Dev Cell 2003, 4:295-305.3. Chudakov DM, Lukyanov S, Lukyanov KA: Fluorescent proteins as
a toolkit for in vivo imaging. Trends Biotechnol 2005, 23:605-613.4. Pologruto TA, Yasuda R, Svoboda K: Monitoring neural activity
and [Ca2+] with genetically encoded Ca2+ indicators. J Neu-rosci 2004, 24:9572-9579.
5. Palmer AE, Tsien RY: Measuring calcium signaling using genet-ically targetable fluorescent indicators. Nat Protoc 2006,1:1057-1065.
6. Baird GS, Zacharias DA, Tsien RY: Circular permutation andreceptor insertion within green fluorescent proteins. ProcNatl Acad Sci U S A 1999, 96:11241-11246.
7. Nagai T, Sawano A, Park ES, Miyawaki A: Circularly permutedgreen fluorescent proteins engineered to sense Ca2+. ProcNatl Acad Sci U S A 2001, 98:3197-3202.
8. Nakai J, Ohkura M, Imoto K: A high signal-to-noise Ca(2+) probecomposed of a single green fluorescent protein. Nat Biotechnol2001, 19:137-141.
9. Griesbeck O, Baird GS, Campbell RE, Zacharias DA, Tsien RY:Reducing the environmental sensitivity of yellow fluorescentprotein. Mechanism and applications. J Biol Chem 2001,276:29188-29194.
10. Belousov VV, Fradkov AF, Lukyanov KA, Staroverov DB, ShakhbazovKS, Terskikh AV, Lukyanov S: Genetically encoded fluorescentindicator for intracellular hydrogen peroxide. Nat Methods2006, 3:281-286.
11. Kawai Y, Sato M, Umezawa Y: Single color fluorescent indicatorsof protein phosphorylation for multicolor imaging of intrac-ellular signal flow dynamics. Anal Chem 2004, 76:6144-6149.
12. Tallini YN, Ohkura M, Choi BR, Ji G, Imoto K, Doran R, Lee J, Plan P,Wilson J, Xin HB, Sanbe A, Gulick J, Mathai J, Robbins J, Salama G,Nakai J, Kotlikoff MI: Imaging cellular signals in the heart invivo: Cardiac expression of the high-signal Ca2+ indicatorGCaMP2. Proc Natl Acad Sci U S A 2006, 103:4753-4758.
13. Patterson GH, Lippincott-Schwartz J: A photoactivatable GFP forselective photolabeling of proteins and cells. Science 2002,297:1873-1877.
14. Chudakov DM, Verkhusha VV, Staroverov DB, Souslova EA, Luky-anov S, Lukyanov KA: Photoswitchable cyan fluorescent pro-tein for protein tracking. Nat Biotechnol 2004, 22:1435-1439.
15. Yang F, Moss LG, Phillips GN Jr.: The molecular structure ofgreen fluorescent protein. Nat Biotechnol 1996, 14:1246-1251.
16. Pozzan T, Rizzuto R, Volpe P, Meldolesi J: Molecular and cellularphysiology of intracellular calcium stores. Physiol Rev 1994,74:595-636.
17. Clapham DE: Calcium signaling. Cell 1995, 80:259-268.18. Augustine GJ, Charlton MP, Smith SJ: Calcium action in synaptic
transmitter release. Annu Rev Neurosci 1987, 10:633-693.19. Llinas R, Sugimori M, Silver RB: The concept of calcium concen-
tration microdomains in synaptic transmission. Neuropharma-cology 1995, 34:1443-1451.
20. Turner RW, Maler L, Deerinck T, Levinson SR, Ellisman MH: TTX-sensitive dendritic sodium channels underlie oscillatory dis-charge in a vertebrate sensory neuron. J Neurosci 1994,14:6453-6471.
Page 9 of 10(page number not for citation purposes)

BMC Biotechnology 2007, 7:37 http://www.biomedcentral.com/1472-6750/7/37
Publish with BioMed Central and every scientist can read your work free of charge
"BioMed Central will be the most significant development for disseminating the results of biomedical research in our lifetime."
Sir Paul Nurse, Cancer Research UK
Your research papers will be:
available free of charge to the entire biomedical community
peer reviewed and published immediately upon acceptance
cited in PubMed and archived on PubMed Central
yours — you keep the copyright
Submit your manuscript here:http://www.biomedcentral.com/info/publishing_adv.asp
BioMedcentral
21. Khodorov B: Glutamate-induced deregulation of calciumhomeostasis and mitochondrial dysfunction in mammaliancentral neurones. Prog Biophys Mol Biol 2004, 86:279-351.
22. Nicholls DG, Budd SL: Mitochondria and neuronal survival.Physiol Rev 2000, 80:315-360.
23. Wu ML, Chen JH, Chen WH, Chen YJ, Chu KC: Novel role of theCa(2+)-ATPase in NMDA-induced intracellular acidification.Am J Physiol 1999, 277:C717-27.
24. Pinelis VG, Khodorov BI, Fajuk D, Zagulova D, Andreeva NA, Uvar-ova T, Khaspekov LG, Golovina VA, Viktorov IV: A persistent cal-cium-dependent decrease of cytoplasmic pH in culturednerve cells induced by toxic glutamate treatment. Biolog-icheskie Membrany 1992, 9:1049-1051.
25. Brocard JB, Tassetto M, Reynolds IJ: Quantitative evaluation ofmitochondrial calcium content in rat cortical neurones fol-lowing a glutamate stimulus. J Physiol 2001, 531:793-805.
26. Kiedrowski L, Costa E: Glutamate-induced destabilization ofintracellular calcium concentration homeostasis in culturedcerebellar granule cells: role of mitochondria in calcium buff-ering. Mol Pharmacol 1995, 47:140-147.
27. Nagai T, Yamada S, Tominaga T, Ichikawa M, Miyawaki A: Expandeddynamic range of fluorescent indicators for Ca(2+) by circu-larly permuted yellow fluorescent proteins. Proc Natl Acad SciU S A 2004, 101:10554-10559.
28. Ho SN, Hunt HD, Horton RM, Pullen JK, Pease LR: Site-directedmutagenesis by overlap extension using the polymerasechain reaction. Gene 1989, 77:51-59.
29. Patterson G, Day RN, Piston D: Fluorescent protein spectra. JCell Sci 2001, 114:837-838.
Page 10 of 10(page number not for citation purposes)