single drop scanometry determination of cyanide in water ... · single drop scanometry...
TRANSCRIPT
J. Bio. Env. Sci. 2016
1 | Khajehzadeh et al.
RESEARCH PAPER OPEN ACCESS
Single drop scanometry determination of cyanide in water in
the various color spaces
Abdolreza Khajehzadeh1, Tahere Ghaedian2, Farzaneh Barani3, Zahra Sadeghi Mazidi3
1Department of Applied Chemistry, Darab Branch, Islamic Azad University, Darab, Iran
2Department of Chemistry, Firuzabad Branch, Islamic Azad University, Firuzabad, Iran
3Department of Chemistry, Shiraz Branch, Islamic Azad University, Shiraz, Iran
Article published on May 12, 2016
Key words: Cyanide ion, Methyl violet, Scanometry, Color space.
Abstract
In this study, the application of new and simple single drop scanometric method was described for determination
of cyanide as alternative for visible spectrophotometric method. Cyanide ion reacts with the methyl violet and
causes a decrease in the color intensity of solution. In the single drop scanometry, color intensity of one droplet of
solution was measured with color analyzing software in the various color models such as RGB, CMYK, HSV and
XYZ. In the proposed method, characterization of single drop was done with potassium permanganate 0.001 M
solution and pixel sampling box location, droplet location, glass plate location and image format were studied and
optimized. This method has a linear range 5–12 mM with a limit of detection of 2.3 mM for CN- ions. The
developed method was successfully applied to the determination of cyanide in the mineral waters with acceptable
results.
Journal of Biodiversity and Environmental Sciences (JBES) ISSN: 2220-6663 (Print) 2222-3045 (Online)
Vol. 8, No. 5, p. 1-15, 2016
http://www.innspub.net
J. Bio. Env. Sci. 2016
2 | Khajehzadeh et al.
Introduction
Cyanide has excellent chemical properties and widely
used in industrial fields such as making of plastics,
recovery of gold and silver from ores, electroplating of
metals (Hachiya et al. 1999; Baskin et al. 1997).
Cyanide is an inhibitor of the enzyme cytochrome c
oxidase in the fourth complex of the electron
transport chain (found in the membrane of the
mitochondria of eukaryotic cells). It attaches to the
iron within this protein. The binding of cyanide to
this enzyme prevents transport of electrons from
cytochrome c to oxygen. As a result, the electron
transport chain is disrupted, meaning that the cell can
no longer aerobically produce ATP for energy (Nelson
et al. 2004). Tissues that depend highly on aerobic
respiration, such as the central nervous system and
the heart, are particularly affected. This is an example
of histotoxic hypoxia (Biller et al. 2008). Cyanide
poisoning is not common, but can more surprisingly
occur from smoke inhalation from residential and
industrial fires (Baskin et al. 1997; Moriya and
Hashimoto 2001; Watanabe et al. 1997), where
cyanide was released from the combustion of
synthetic products that contain carbon and nitrogen,
such as plastics and synthetic fibers. The extreme
toxicity of cyanide and its great variety of uses in
industrial applications make it crucially important to
develop rapid, sensitive, selective and accurate
method for cyanide determination. Many methods
have been developed for the determination of
cyanide, e.g. chromatography (Chattaraj and Das
1991; Nonomura 1987), atomic absorption
spectroscopy (Chattaraj and Das 1991),
spectrophotometry (Afkhami and Sarlak 2007;
Gumus et al. 2000; Scoggings 1972; Cacace et al.
2007; Ohno 1989; Meeussen et al. 1989), fluorimetry
(Gamoh and Imamichi 1991), selective electrode
(Abbaspour et al. 2009; Gattrell et al. 2001 ). Cyanide
ion reacts with the methyl violet according to the
reaction of fig.1, and causes a decrease in the
absorbance of the solution at 598 nm by
spectrophotometric method (Afkhami and Sarlak
2007).
In the scanometric method, the sample solution was
scanned with flatbed scanner, and then the image was
transferred to image analyzing software. In the image
analyzing software the color spots were analyzed to
red, green and blue color values (Abbaspour et al.
2009).
In the present work, the application of methyl violet
as a reagent for determination of cyanide based on
single drop scanometry was described. After mixing
sample solution containing cyanide with methyl
violet, reaction was done and one droplet of final
solution injected on the glass plate, before drying the
droplet, glass plate was scanned with flatbed scanner.
Image of solution single droplet was analyzed to color
values in the various color spaces such as RGB,
CMYK, HSL, HSV, XYZ, and correlation between any
color values and concentration was studied.
To compare the spectrophotometric and scanometric
method, it that should be mentioned,
spectrophotometric techniques are based on the
measurement of transmitted light by an analyte. In
the visible spectrophotometric methods the sample
must not be turbid and the species should often have
a sharp max to obtain the precise determination in the
visible region. The linearity of the Beer–Lambert law
is limited by chemical and instrumental factors. One
of the instrumental deviations occurs when the
incident radiation is non-monochromatic, which can
be minimized by using max.
But in the sacnometric method, which used in this
research, the transparency of the solution in is not
important, because the light reflection is measured,
and the light radiation does not pass across the
solution. Also, the sharp max of the species are not
important, because in this method the intensity of the
color of the solution was analyzed by software to three
main color (red, green and blue) values (Abbaspour et
al. 2009).
Material and methods
Apparatus

J. Bio. Env. Sci. 2016
3 | Khajehzadeh et al.
A 4400F Canon scanner with a cold cathode
fluorescent lamp (CCFL) and CCD (charge coupled
device) as a light source and detection system
respectively was used for scanning the glass sheet
containing of sample solution droplets. The CCFL is a
three wavelength source (for red, green and blue
regions). The resolution of the scanner was regulated
at 200 dpi. In order to inject sample solution on the
flatbed scanner, a plate of glass with thickness of 1
mm was used.
The written software in VB 6 media converts the
recorded pictures of color of cells to RGB (red, green
and blue) data. A Brand micropipette was used for
injecting samples into the cells. The pH values of
solutions were measured by a Metrohm pH meter.
Reagents and chemicals
All of the chemicals used were of analytical reagent
grade. Deionized water was used to prepare the
buffer, reagents and stock solutions. To
characterization of the single drop, potassium
permanganate with concentration of 0.001 M was
used. A 0.1 M stock of standard solution of cyanide
was prepared by dissolving adequate amount of
sodium cyanide (Merck) in deionized water.
Phosphate buffer with concentration of 0.1 M was
used for study of effect of pH. These solutions were
kept in a dark, cold place and were freshly prepared
every day.
Color analyzing principle
RGB color model (or color space) is an additive color
model in which red, green, and blue light are added
together in various ways to reproduce a broad array of
colors. In computing, the color values are often stored
as integer numbers in the range 0 to 255, the range
that a single 8-bit byte can offer (by encoding 256
distinct values). In the RGB system, any color is
represented in the form of (R, G, B), in which the (0,
0, 0) and (255, 255, 255) refer to black and white
respectively (Abbaspour, 2011) 21.
Any color value (V) can be described by the following
formula:
V = R + 256G + 2562B
Where, R, G and B are red, green and blue values of
the main color.
The CMYK color model is a subtractive color model,
used in color printing, and is also used to describe the
printing process itself. CMYK refers to the four inks
used in some color printing: cyan, magenta, yellow,
and key (black). To convert RGB system to CMYK
system the following algorithm was used:
1. R' = 1 - (R / 255)
2. G' = 1 - (G / 255)
3. B' = 1 - (B / 255)
4. Black = min (R', G', B')
5. Cyan = (R' - Black) / (1 - Black)
6. Magenta = (G' - Black) / (1 - Black)
7. Yellow = (B - Black) / (1 - Black)
HSL (hue-saturation-lightness) and HSV (hue-
saturation-value) are the two most common
cylindrical-coordinate representations of points in an
RGB color model. Developed in the 1970s for
computer graphics applications, HSL and HSV are
used today in color pickers, in image editing software,
and less commonly in image analysis and computer
vision. To convert RGB model to HSV and HSL
system and calculate the H, L, I, chroma, SHSV, SHSI
and VHSV, following algorithm was used22:
1. Convert the R, G and B values to the range 0
- 1, by dividing each color value to 255.
Find min and max values of R, G and B.
2. I = (R + G + B)/3
3. L = (max + min)/2
4. V = Max (R, G, B)
5. Chroma = max - min
6. If the max and min colors are the same, S is
defined to be 0, and H is undefined but in programs
usually written as 0
7. Otherwise
SHSL = Chroma / (1 – 2L - 1)
SHSV = Chroma/V
SHSI = 1-Min/I

J. Bio. Env. Sci. 2016
4 | Khajehzadeh et al.
8. For H
If R = max H = [0 + (G - B)/(max - min)]/6
If G = max H = [2.0 + (B - R)/(max - min)]/6
If B = max H = [4.0 + (R - G)/(max - min)]/6
Also to calculate color values in the XYZ color system,
the transformation matrix (M) was used as followed
[22]:
Results and discussions
Study and characterization of single droplet
To study and characterization of single droplet on the
glass plate at the scanner surface, solution of 0.001 M
potassium permanganate was selected. Some
experimental parameters such as glass plate
thickness, scanner resolution, image format, glass
plate location, droplet location, and sampling zone
and … were studied and optimized.
Study the effect of glass plate thickness
In order to study the effect of glass plate thickness on
the color values, two glass plates with thickness of 1
and 2 mm were prepared. Five droplets of solution of
potassium permanganate 0.001 M were injected on
the two plates and after scanning, images were
transferred to color analyzing software. Results of this
experiment were shown in the fig.2.
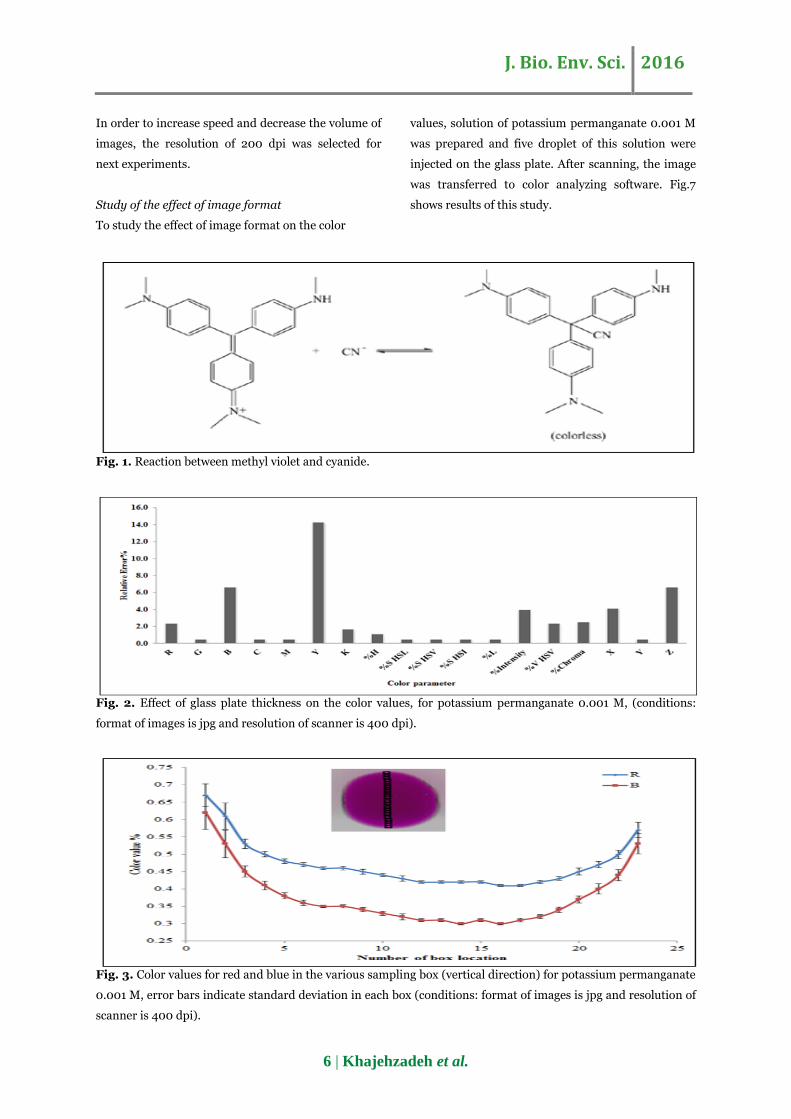
As fig. 2 shows, change of the glass plate thickness
has no significant effect on the most color values, but
the same glass plate was used in the next
experiments.
Table 1. LOD of proposed method.
Detection Limit (mM) Color parameter
2.6 R
3.7 G
2.5 B
5.2 C
2.3 M
4.9 %H
3.8 % SHSV
3.1 Y
3.2 Z
Table 2. RSD% of proposed method.
RSD% (n = 10) Color parameter
5.2 R
6.0 G
4.3 B
3.8 C
8.2 M
5.8 % H
7.3 % SHSV
3.7 Y
2.9 Z
Study of the sampling box location in the single drop
In the color analyzing software, a box (with size of
40000 pixels) was used to analyze the specific
location of image. To study of the effect of sampling
box location on the standard deviation of pixels, one
droplet of potassium permanganate (0.001 M) was
injected on the glass plate. Then scanning was done,
and in vertical and horizontal direction sampling was

J. Bio. Env. Sci. 2016
5 | Khajehzadeh et al.
done. Standard deviation of pixels was obtained, and
results of red and blue values (as representative of
other color values) are shown in the fig. 3 and 4.
As fig.3 and 4 show, in the edges of solution droplets,
standard deviation between pixels in the sampling
box increased.
Table 3. Interference study in the color parameters.
Relative errors in the color parameter
Z Y %SHSV %H M C B G R Interfering species
3.2 3.5 4.2 3.2 2.3 3.4 5.6 2.3 4.2 IO3-
3.4 4.2 3.4 5.6 7.2 2.8 4.5 2.9 6.3 HCO3-
5.2 5.6 7.2 2.8 2.9 4.3 4.5 4.3 4.2 CO32-
6.3 6.5 3.2 3.7 4.3 4.3 2.6 8.4 5.3 S2O32-
4.5 4.3 5.3 6.7 3.9 5.6 7.3 4.8 4.2 Cl-
6.2 5.4 4.7 4.8 3.9 4.6 8.5 7.6 2.3 Br-
5.4 6.4 5.6 4.8 3.8 2.7 6.5 4.8 4.2 SCN-
4.9 6.6 5.8 4.9 8.6 5.7 3.5 6.3 3.3 Thiourea
7.2 8.4 5.4 4.3 3.7 2.3 3.8 9.5 4.3 S2-
4.3 4.3 4.5 6.3 4.3 2.5 6.8 8.4 5.2 S2O32-
5.3 3.2 2.5 6.7 5.4 4.3 5.4 3.6 3.7 Mg2+
3.2 5.4 3.4 4.5 6.4 5.6 7.3 4.5 7.2 Fe3+
12 10 11.2 12.5 13.2 9.5 8.8 12.2 13 Cr2O72-
Table 4. Determination of cyanide in mineral waters.
Relative errors in the color parameter
Z Y %SHSV %H M C B G R Types of mineral water
2.8 3.5 3.7 -2.3 3.7 -2.3 3.2 5.2 5.6 Sepidan
2.9 -4.2 -4.2 4.3 5.6 5.2 2.9 3.2 7.2 Sheshpeer
5.3 4.5 -4.2 3.6 6.2 4.5 3.4 6.2 3.4 Kuhestan
3.4 4.5 3.8 3.2 2.7 5.2 2.9 4.3 6.2 Mineral
4.5 3.9 3.5 -4.2 4.1 3.8 3.8 3.6 4.5 Ivan ab
Therefore in the central zone of each droplet sampling
boxes have approximately same color values and low
acceptable standard deviation.
Effect of resolution of scanner on the color values
In order to study the effect of scanner resolution on
the color values, potassium permanganate 0.001 M
was prepared and five droplets of this solution were
injected on the glass plate. Fig. 5 shows color values
for all color parameters at various scanner
resolutions.
As shown in fig. 5, the color values in the all color
models are independent from scanner resolution.
Standard deviations of all color parameters are shown
in the Fig. 6, as the result of this figure, the
resolutions of 200 and 400 dpi have lower standard
deviation.
Table 5. Comparison between the proposed method and other method for the determination of cyanide.
Method Principle Instrumentation Figure of the merits
Optical sensor11 Based on the reaction between cyanide
and immobilized methyl violet on a
triacetylcellulose membrane
Spectrophotometer,
Decrease in absorbance at
= 598 was measured.
Linear range = 3.8-95 mM
LOD = 2.4 mM
Single drop
scanometry (this
work)
Based on the reaction between cyanide
and methyl violet in the solution
Scanner, color values
intensity were measured.
Linear range = 5-12 mM
LOD = 2.3 mM
J. Bio. Env. Sci. 2016
6 | Khajehzadeh et al.
In order to increase speed and decrease the volume of
images, the resolution of 200 dpi was selected for
next experiments.
Study of the effect of image format
To study the effect of image format on the color
values, solution of potassium permanganate 0.001 M
was prepared and five droplet of this solution were
injected on the glass plate. After scanning, the image
was transferred to color analyzing software. Fig.7
shows results of this study.
Fig. 1. Reaction between methyl violet and cyanide.
Fig. 2. Effect of glass plate thickness on the color values, for potassium permanganate 0.001 M, (conditions:
format of images is jpg and resolution of scanner is 400 dpi).
Fig. 3. Color values for red and blue in the various sampling box (vertical direction) for potassium permanganate
0.001 M, error bars indicate standard deviation in each box (conditions: format of images is jpg and resolution of
scanner is 400 dpi).

J. Bio. Env. Sci. 2016
7 | Khajehzadeh et al.
As fig.7 shows, change of image format has no effect
on the color values.Therefore to decrease the volume
of images, the jpg format was selected for next
experiments.
Study the effect of droplet location on the glass plate
The effect of location of droplets on the color values
was studied as followed. A solution of potassium
permanganate with concentration of 0.001 M was
prepared and some droplets of this solution was
injected on the glass plate at random locations. Fig.8
shows results of relative standard deviation of color
parameters at various locations on the glass plate.
Fig. 4. Color values for red and blue in the various sampling box (horizontal direction) for potassium
permanganate 0.001 M, error bars indicate standard deviation in each box (conditions: format of images is jpg
and resolution of scanner is 400 dpi).
Fig. 5. Color values for all color parameters at the various scanner resolutions for potassium permanganate
0.001 M, (conditions: sampling zone is central, format of images is jpg).
As can be seen in fig.8, in most color parameters, %
RSD is acceptable less than 5%, however in the next
all experiments, fix and same location was applied for
sample injection on the glass plate.
Study the effect of glass plate location on the scanner
surface
To study the effect of glass plate location on the
scanner surface, glass plate containing a droplet of
0.001 M potassium permanganate was scanned at the
randomize various location on the scanner surface.
Fig.9 shows relative standard deviation between

J. Bio. Env. Sci. 2016
8 | Khajehzadeh et al.
various glass plate locations. As this figure shows, for
all color parameters (except green), RSD % between
glass plate location was acceptable less than 10%,
however at the next experiments fix and same
location was selected for glass plate on the scanner
surface.
Fig. 6. Standard deviation of color values for all color parameters at the various scanner resolutions for
potassium permanganate 0.001 M, (conditions: sampling zone is central, format of images is jpg).
Fig. 7. Color values for all color parameters at the various image format for potassium permanganate 0.001 M,
(conditions: sampling zone is central, resolution is 200 dpi).
Study the effect of pH on the methyl violet color
parameters
In order to study the effect of pH on the color
parameters of methyl violet, various solutions of this
reagent with concentration of 0.01 M were prepared
at different pH (1.5 – 13). pH of these solution were
adjusted by phosphate buffer 0.1 M. Then five
droplets of each solution at every pH were injected on
the glass plat, after scanning the glass plate, images
were analyzed by color analyzing software. Fig.10
shows the result of Red, Magenta, %SHSL and %SHSI as
representative of all color parameters. As results of
fig.10 show, color values of methyl violet is
independent of pH between 2.5 – 11.
Study the effect of pH on the cyanide-methyl violet
product color parameters
Cyanide ion reacts with the methyl violet and causes a
decrease in the color intensity of the methyl violet
solution. In order to study of the effect of pH on the
reaction between methyl violet and cyanide, solution
containing 0.01 M cyanide and 0.01 M 0.1 M methyl
violet were prepared at different pH.

J. Bio. Env. Sci. 2016
9 | Khajehzadeh et al.
Fig. 8. Relative standard deviation on the color values for all color parameters at the various locations on glass
plate for potassium permanganate 0.001 M, (conditions: sampling zone is central, format of images is jpg,
resolution is 200 dpi).
Fig. 9. Relative standard deviation of the color values for all color parameters at the various glass plate locations
on the scanner surface for potassium permanganate 0.001 M, (conditions: sampling zone is central, droplet
location on glass plate is central, format of images is jpg, resolution is 200 dpi).
Fig. 10. Effect of pH on the color values of methyl violet, 0.01 M (conditions: resolution of scanner: 200 dpi,
location of sampling box, droplet and glass plate: central, image format: jpg).

J. Bio. Env. Sci. 2016
10 | Khajehzadeh et al.
After appropriate time (20 minutes), five droplets of
each solution were injected on the central location of
glass plate. Image of droplets was transferred to color
analyzing software by scanning with flatbed scanner.
Fig.11 shows color values of Red, Magenta, %SHSL and
%SHSI as representative of all color parameters. As
results in the fig 11shows, the color values of cyanide-
methyl violet product is independent of pH. Therefore
in this study pH adjustment is not required.
Fig. 11. Effect of pH on the color values of cyanide-methyl violet product, (conditions: methyl violet: 0.01 M, CN-:
0.01 M, reaction time: 20 min, resolution of scanner: 200 dpi, location of sampling box, droplet and glass plate:
central, image format: jpg).
Fig. 12. Effect of methyl violet concentration on the color values of cyanide-methyl violet product in the various
color models, (conditions: CN-: 0.01 M, no pH adjustment, reaction time: 20 min, resolution of scanner: 200 dpi,
location of sampling box, droplet and glass plate: central, image format: jpg).
J. Bio. Env. Sci. 2016
11 | Khajehzadeh et al.
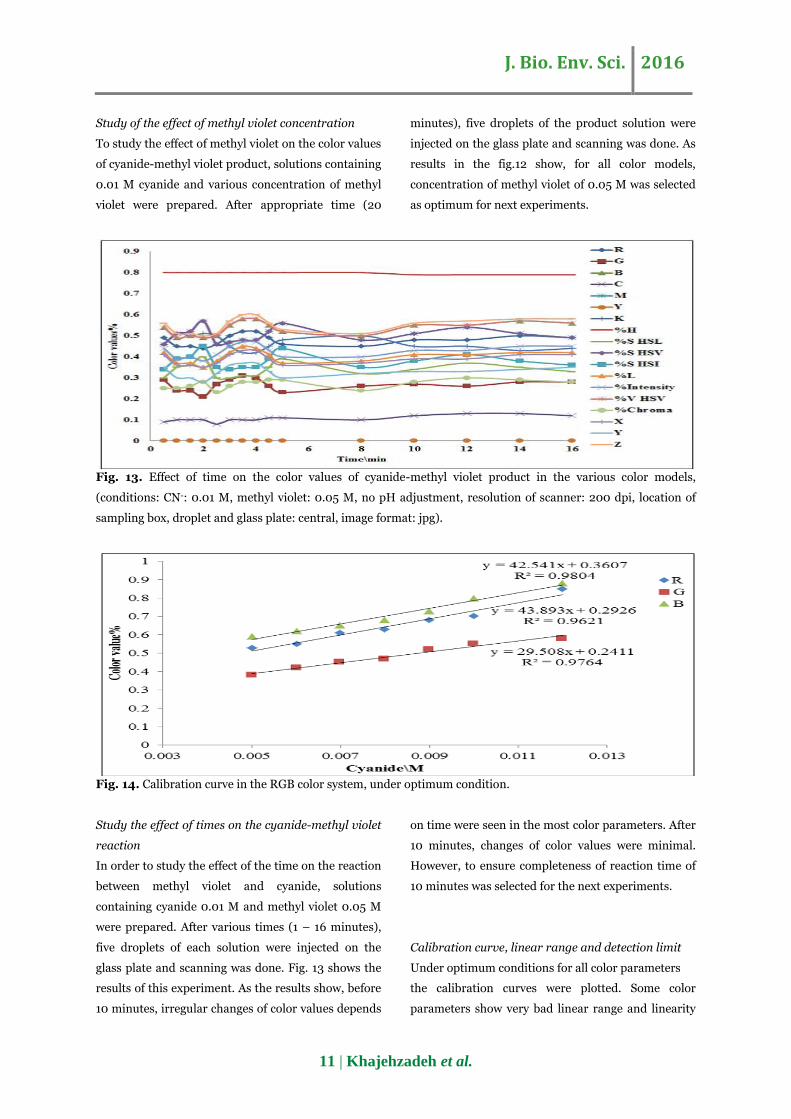
Study of the effect of methyl violet concentration
To study the effect of methyl violet on the color values
of cyanide-methyl violet product, solutions containing
0.01 M cyanide and various concentration of methyl
violet were prepared. After appropriate time (20
minutes), five droplets of the product solution were
injected on the glass plate and scanning was done. As
results in the fig.12 show, for all color models,
concentration of methyl violet of 0.05 M was selected
as optimum for next experiments.
Fig. 13. Effect of time on the color values of cyanide-methyl violet product in the various color models,
(conditions: CN-: 0.01 M, methyl violet: 0.05 M, no pH adjustment, resolution of scanner: 200 dpi, location of
sampling box, droplet and glass plate: central, image format: jpg).
Fig. 14. Calibration curve in the RGB color system, under optimum condition.
Study the effect of times on the cyanide-methyl violet
reaction
In order to study the effect of the time on the reaction
between methyl violet and cyanide, solutions
containing cyanide 0.01 M and methyl violet 0.05 M
were prepared. After various times (1 – 16 minutes),
five droplets of each solution were injected on the
glass plate and scanning was done. Fig. 13 shows the
results of this experiment. As the results show, before
10 minutes, irregular changes of color values depends
on time were seen in the most color parameters. After
10 minutes, changes of color values were minimal.
However, to ensure completeness of reaction time of
10 minutes was selected for the next experiments.
Calibration curve, linear range and detection limit
Under optimum conditions for all color parameters
the calibration curves were plotted. Some color
parameters show very bad linear range and linearity

J. Bio. Env. Sci. 2016
12 | Khajehzadeh et al.
(r2< 0.6). Therefore fig. 14 to 17 show the calibration
curves of the proposed method for some valuable
color parameters. Linear range of 0.005 – 0.012 M
cyanide (corresponding to 123.25 to 315 g/mL) was
obtained for all color parameters.
Fig. 15. Calibration curve in the CMYK color system (only for cyan and magenta), under optimum condition.
Fig. 16. Calibration curve in the HSV color system (only for H and S), under optimum condition.
For calculating of detection limit, a reagent blank was
measured 10 times (n= 10) and a detection limit was
obtained from three times of its standard deviation
divided by the slope of the linear regression equation
(LOD= 3SD blank/m). For all color values, LODs were
presented in the table 1.
According to the suggested procedure, under
optimum conditions, 10 sample solutions of 0.006 M
cyanide have been analyzed. Results for RSD of color
parameters are presented in Table 2.
Study of interference
To study the selectivity of the developed method for
the determination of cyanide, the effect of the
presence of several species were investigated.
Solutions containing 150 g/mL cyanide and 500
g/mL of interfering species were prepared and
under the optimum conditions experiments were
done. Table 3 shows the errors in the all color
parameters for each interfering species. As illustrated
in Table 3, no significant interference exists in all
values for all interfering species except for Cr2O72-.
Application
The applicability of the method to assay cyanide in
mineral water was examined. The amounts of

J. Bio. Env. Sci. 2016
13 | Khajehzadeh et al.
cyanide, which were spiked into the various brands of
mineral water samples, were measured and relative
errors are given for all color values in Table 4. From
results in this table it was concluded that all color
values are suitable for accurate determination of
cyanide in real samples such as mineral waters.
Fig. 17. Calibration curve in the XYZ color system (only for Y and Z), under optimum condition.
Fig 18. Graphical Index.
Conclusions
The single drop scanometry method described in this
work is convenient for use in home and office. Also
this method is simple, fast and inexpensive as an
alternative to visible spectrophotometry.
Developed method only needs the scanner, a glass
plate and a PC for analyzing the color. In this work,
applicability of new method single drop scanometry
was investigated for determination of cyanide in
water samples. As results in table 5 show, this
presented work have acceptable results(such as LOD
and Linear range) relative to optical sensor (optode11)
spectrophotometric method.
Acknowledgment
The authors wish to acknowledge the support of this
work by Islamic Azad University, Firuzabad and
Darab branches.
References
Abbaspour A, Khajehzadeh A, Ghaffarinejad
J. Bio. Env. Sci. 2016
14 | Khajehzadeh et al.
A. 2009. A simple and cost-effective method, as an
appropriate alternative for visible spectrophotometry:
development of a dopamine biosensor. Analyst 134,
1692 – 1698.
Abbaspour A, Valizadeh H, Khajehzadeh A.
2011. simple, fast and cost effective method for
detection and determination of dopamine in bovine
serum. Anal. Methods 3, 1405 – 1409.
Abbaspour A, Asadi M, Ghaffarinejad A,
Safaei E. 2005. A selective modified carbon paste
electrode for determination of cyanide using tetra-
3,4-pyridinoporphyrazinatocobalt(II). Talanta 66,
931 - 936.
Afkhami A, Sarlak N. 2007. A novel cyanide
sensing phase based on immobilization of methyl
violet on a triacetylcellulose membrane. Sens.
Actuators B 122, 437 – 441.
Baskin SI, Brewer TG, Sidell F, Takafuji ET,
Franz DR. 1997. Medical Aspects of Chemical and
BiologicalWarfare. TMM publications, Washington,
271–286.
Biller J, Lippincott W, Wilkins. 2008. Interface
of neurology and internal medicine. 939.
Cacace D, Ashbaugh H, Kouri N, Bledsoe S,
Lancaster S, Chalk S. 2007. Spectrophotometric
determination of aqueous cyanide using a revised
phenolphthalein method. Anal. Chim. Acta 589, 137
– 141.
Chattaraj S, Das AK. 1991. Indirect Determination
of Free Cyanide in Industrial Waste Effluent by
Atomic Absorption Spectrometry. Analyst 116, 739-
741.
Gamoh K, Imamichi S. 1991. Postcolumn liquid
chromatographic method for the determination of
cyanide with fluorimetric detection. Anal. Chim. Acta
251, 255 – 259.
Gattrell M, Cheng SC, Guena T, MacDougall B.
2001. Cyanide ion-selective electrode measurements
in the presence of copper. J. Electroanal. Chem. 508,
97 – 104.
Gumus G, Demirata B, Apak R. 2000.
Simultaneous spectrophotometric determination of
cyanide and thiocyanate after separation on a
melamine-formaldehyde resin. Talanta 53, 305 - 315.
Hachiya H, Ito S, Fushinuki Y, Masadome T,
Asano Y, Imato T. 1999. Continuous monitoring for
cyanide in waste water with a galvanic hydrogen
cyanide sensor using a purge system.Talanta 48, 997-
1004.
Meeussen JCL, Temminhoff EJM, Keiser MG.
1989. Spectrophotometric determination of total
cyanide, iron-cyanide complexes, free cyanide and
thiocyanate in water by a continuous-flow system.
Analyst 114, 959 – 963.
Moriya F, Hashimoto Y. 2001. Potential for error
when assessing blood cyanide concentrations in fire
victims. J. Forensic Sci. 46, 1421-1425.
Nelson D, Nelson DL, Cox MM. 2004. Lehniger
Principles of Biochemistry. New York: Worth
Publishers. 668-670, 71-676.
Nonomura M. 1987. Indirect determination of
cyanide compounds by ion chromatography with
conductivity measurement. Anal. Chem. 59, 2073 –
2076.
Ohno T. 1989. Spectrophotometric determination of
total cyanide in surface waters following ultraviolet
induced photodecomposition. Analyst 114, 857 –
858.
Scoggins MW. 1972. Ultraviolet spectrophotometric
determination of cyanide ion. Anal. Chem. 44, 1294 -
1296.

J. Bio. Env. Sci. 2016
15 | Khajehzadeh et al.
Watanabe K, Seno H, Ishii A, Suzuki O. 1997.
Capillary Gas Chromatography with Cryogenic Oven
Temperature for Headspace Samples: Analysis of
Chloroform or Methylene Chloride in Whole Blood.
Anal. Chem. 69, 5178-5181.