the characterization of cyanide in the dinitrotoluene and wastewater treatment … ·...
TRANSCRIPT

Atlanta University CenterDigitalCommons@Robert W. Woodruff Library, AtlantaUniversity Center
ETD Collection for AUC Robert W. Woodruff Library
5-1-1981
The characterization of cyanide in thedinitrotoluene and wastewater treatment processPhil Allen TuckerAtlanta University
Follow this and additional works at: http://digitalcommons.auctr.edu/dissertations
Part of the Chemistry Commons
This Thesis is brought to you for free and open access by DigitalCommons@Robert W. Woodruff Library, Atlanta University Center. It has beenaccepted for inclusion in ETD Collection for AUC Robert W. Woodruff Library by an authorized administrator of DigitalCommons@Robert W.Woodruff Library, Atlanta University Center. For more information, please contact [email protected].
Recommended CitationTucker, Phil Allen, "The characterization of cyanide in the dinitrotoluene and wastewater treatment process" (1981). ETD Collectionfor AUC Robert W. Woodruff Library. Paper 1512.

THE CHARACTERIZATION OF CYANIDE IN THE DINITROTOLUENE
AND WASTEWATER TREATMENT PROCESS
A THESIS
SUBMITTED TO THE FACULTY OF ATLANTA UNIVERSITY
IN PARTIAL FULFILLMENT OF THE REQUIREMENTS FOR
THE DEGREE OF MASTER OF SCIENCE
BY
PHILL ALLEN TUCKER
DEPARTMENT OF CHEMISTRY
ATLANTA, GEORGIA
MAY 1981

ABSTRACT
CHEMISTRY
TUCKER, PHILL ALLEN B.A., CHENEY STATE COLLEGE, 1979
THE CHARACTERIZATION OF CYANIDE IN THE DINITROTOLUENEAND WASTEWATER TREATMENT PROCESS
Advisors: Professor Kofi B. Bota and Professor Malcolm B. Polk
Thesis dated May 1981
Trace levels of cyanide were found in the effluent wastewater resulting from
the production of dinitrotoluene. To determine the source of cyanide, a survey of
the system was conducted. The wastewater treatment plant was also surveyed
before and during dinitrotoluene production.
Iso-octane extraction, exposure to ultraviolet light, and metal sequestering
agents were used in attempts to perform these analyses. These methods did not give
consistent results; therefore, the conventional distillation method followed by
colorimetric or selective ion electrode determination was used.

ACKNOWLEDGEMENTS
I cannot find enough words to express my sincere and honest appreciation to all
those who have contributed to this project. I want to thank Dr. Richard Ode for his
understanding and guidance throughout this project. I also wish to thank Dr. Robert
L. Sandridge, Mr. Marty Healy, Mr. Ray Ketko (all of the New Martinsville Research
Staff) for their contributions. A special thanks goes to my financee Dwana for her
support and patience throughout the graduate program, and thanks to Mrs. Lynne
Dowd for all the hours she spent typing this paper. A special acknowledgement goes
to the National Science Foundation Traineeship for their financial support. Grant
No. SPI 80-10746.
111

TABLE OF CONTENTS
ABSTRACT.
Page
ii
ACKNOWLEDGEMENTS m
LIST OF TABLES v
LIST OF FIGURES V1
INTRODUCTION 1
EXPERIMENTAL 6
RESULTS AND DISCUSSION 15
CONCLUSION 36
RECOMMENDATIONS 38
REFERENCES 39
IV

LIST OF TABLES
Table
1 Cyanide concentration in dinitrotoluene effluent
after the indicated pretreatment 17
2 Verification of cyanide electrode determination 18
3 Cyanide concentration in dinitrotoluene effluent
(before the wash water clean up system) after theindicated pretreatment 19
ii Cyanide concentration in DNT effluent determined by the
Sekerka and Lechner method 21
5 Potential reading for DNT wastewater before and after
irradiation at pH 5-7 and pH 11-12 in the presence of
sulfide ions 23
6 Potential reading for DNT wastewater before and afterirradiation in the presence of Na2EDTA 25
7 Potential reading for DNT wastewater before and afterirradiation in the presence of salicylic acetate ; 26
8 Cyanide concentration in the wastewater treatment plant
during DNT shut down 29
9 Cyanide concentration in dinitrotoluene process 31
10 Cyanide concentration for dinitrotoluene process 33
11 Cyanide concentration in the wastewater treatment plant
during a typical DNT production 35
12 Standard deviation of ten identical process samples 37

LIST OF FIGURES
Figure
1 Flow diagram of waste treatment process 28
2 Flow diagram of dinitrotoluene plant 30
VI

INTRODUCTION
During a verification study of priority pollutants in various production units at
Mobay Chemical Corporation's New MartinsvUle plant, cyanide concentrations from
30 to 60 parts per million were found in effluent wastewater resulting from the
production of dinitrotoiuene. According to the chemical reaction for the production
of dinitrotoiuene, cyanide was not expected. Therefore, a survey of the
dinitrotoiuene process streams was conducted to determine the source of cyanide.
A survey to determine the concentration of cyanide in the plant's wastewater
treatment streams was also conducted. This analysis was performed in two parts.
First a survey was conducted during a dinitrotoiuene plant shut down. This surveil
lance gave background cyanide concentrations present in the plant's wastewater. In
the second phase, a screening was done during a normal dinitrotoiuene production
period.
To perform these analyses an analytical method to determine cyanide concen
trations in the dinitrotoiuene process streams and wastewater treatment streams
had to be selected.
A literature search of existing methods for the determination of cyanide in
wastewater streams was performed. The literature revealed that most analytical
methods for determining cyanide were similar. Each of the techniques employed
some kind of preliminary treatment to remove interfering substances such as
sulfides, halogens, aldehydes, fats, and polar organic solvents. The pretreatment
also dissociated many metallocyanide complexes. The pretreatment was followed by
some analytical means of determining the amount of cyanide present in the sample.
The conventional method of analysis requires the removal of the interferences
mentioned above followed by distillation of samples for at least one hr. The cyanide
-1-

-2-
concentration is then determined by colorimetry, titration or ion selective electrode
measurements. The precision in the conventional method depends on the analyst's
experience and knowledge of the procedures. Since the conventional method was to
be employed in the analytical determinations, experience was gained by using the
conventional method to examine samples from the raw wastewater, biox feed, and
dinitrotoluene effluent stream. Many problems with the distillation, colorimetric
procedures and the ion selective electrode method were encountered.
Because of these problems plus the lengthy time involved in the distillation,
less time consuming pretreatments were examined. Previous studies performed by
the environmental control department of Mobay's New Martinsville plant showed
that sulfides and aldehydes were not present. Chlorine was present but its concen
tration was below interfering levels. Iron and other heavy metals were believed to
be below interfering levels. The only interferences remaining were fats, color,
turbidity and polar organic solvents. Therefore, various tests using iso-octane
extraction at different pH values were performed on the raw wastewater stream,
the biox feed stream, and the dinitrotoluene effluent wastewater stream. Also,
samples from these streams were examined with and without distillation. The use of
ultraviolet light in conjunction with metal sequestering agents was also examined in
an effort to decompose metallocyanide compounds. Once separated, the metals
would then be precipitated or complexed with the metal sequestering agents, thus
freeing bound cyanide. After examination of several pretreatments and analytical
procedures, the conventional distillation procedure with a few modifications
followed by either colorimetric or ion selective electrode determination was chosen.
The colorimetric analysis was used for cyanide levels below 1 ppm and the ion
selective electrode was used for concentrations above 1 ppm.
Cyanide refers to all of the CN groups in compounds that can be determined as

-3-
cyanide ion, CN~. The cyanide compounds are classified into two groups. The first
group, simple cyanides, are cyanide compounds of the structure ACN, where A is an
alkali metal such as sodium or potassium. The second group, complex cyanides, are
cyanide compounds of the structure A M(CN)Z- The most common of these are the
alkali heavy metal cyanide compounds. In these compounds A is the alkali metal
taken y times; M stands for the heavy metal; z is the number of cyanide ions. In the
simple cyanides the anion in solution is CN~, but in complex cyanides the anion in
solution is M(CN)"a. These metallocyanide anions decompose in time with exposurez
to sunlight, freeing cyanide ions. Thus, simple and complex cyanides are toxic to the
environment.
An excellent discussion on the determination of cyanide in wastewater is
presented in Standard Methods1. The Standard Methods text provides background
on sampling, pretreatment of samples, distillation, and the three conventional
methods of determination: colorimetry, titration, and ion selective electrode.
Additional information on the use of ion selective electrodes is presented by
Kapauan and Tom2. They discuss trace analysis of cyanide by the ion selective
electrode indicator technique. The method utilizes the standard additions technique
using a silver sulfide membrane electrode. In this method a known volume of sample
is treated with lead nitrate, Pb(NO3)2, solution to precipitate any sulfides present in
the sample and sodium hydrogen ethylenediaminetetraacetate (NaHEDTA) is added
to the sample to complex the metals present. The pH of the sample is adjusted to
11-12 and silver indicator, Ag(CN)"2, is added. The potential of the sample is noted
after each successive addition of standard cyanide solution. The original cyanide
concentration is obtained by extrapolating the curve, which is prepared on Gran's
plot paper, to the zero horizontal axis. The method performed well for the analysis
of several synthetic samples. However, it could not be applied to dinitrotoluene

process streams for the following reasons. First dinitrotoluene process streams
contain Fe(III) and Fe(H) ions which complex cyanide very strongly, forming Fe(CN)6
and Fe(CN>53. These complexes do not decompose on the addition of NaHEDTA.
Secondly, the dinitrotoluene process streams contain some moderately polar organic
solvents which can cause ion selective electrodes to malfunction.
In 1976 Sekerka and Lechner3 utilized the standard addition/known dilution
technique to determine trace concentrations of cyanide in wastewater. They discuss
the use of ultraviolet light to decompose metallocyanide complexes, the use of
sulfide to complex the free metals, followed by the addition of bismuth to
precipitate any excess sulfide. They also include a discussion of the effects of pH on
the cyanide ion electrode's response and sensitivity. The technique gave good results
on several synthetic samples containing metal ions including iron and silver.
However, consistent results could not be obtained on dinitrotoluene process streams.
The lack of reproducible results is believed to be due to temperature variations and
the presence of large quantities of toluene in the samples.
The use of ion chromatography with coulometric detection for the determina
tion of inorganic ions was reported by Girard\ The technique employs a Dionex Ion
Chromatograph coupled with a Hitachi Model 630 Coulometric Detector. This
method was successful in separating and detecting many inorganic anions including
(CN~). The detection limit was well below 0.1 ppm. The detection of anions was
based on the dissociation of the acid form of the anions. Since HCN has a small
dissociation constant, its detection with a conductivity cell was very difficult and
not quantitative. The method was not attempted because the ion chromatograph
available was not equipped with a coulometric detector.
Chi - Fen Chu5 employed a cyanide electrode to determine cyanide concentra
tions in river water. The Orion 94-06 cyanide electrode and the Orion 90-01

-5-
reference electrode were used to determine cyanide in samples without any
pretreatment; however, the method could only be applied to simple cyanides.
The HCN vapor diffusion method of measuring simple cyanide is discussed by
Tao 3ui and Yu-Cheng 3en6. The method can be used to analyze simple cyanides in
the presence of complex iron cyanides. The photodecomposition of the iron cyanide
compounds was inhibited by adding zinc acetate, Zn(OAc)2, to the sample.
Nota and Improta7 reported on the use of gas chromatography to determine
simple cyanide in coke-oven wastewater. The method does not require any of the
pretreatments listed in Standard Methods1. The technique does require that samples
be treated with bromine water to convert cyanide to cyanogen bromide (CNBr). The
cyanogen bromide was then separated and analyzed by gas chromatography electron
capture. Unfortunately this method is not applicable to complex cyanide
compounds.
An excellent review on the analytical methods for determining cyanide is
presented by McKee8. The paper briefly describes many methods for determining
cyanide in industrial wastewater. Also included in the report are the problems
associated with total cyanide methodology, as well as the approved Environmental
Protection Agency (EPA) methods.

EXPERIMENTAL
Equipment
To perform distillations a Fisher cyanide distillation apparatus was used.
Colorimetric determinations were made by Bausch and Lomb Spectronic 20 spectro-
photometer. The potentials of the samples were measured on a Beckman 4500
digital pH meter employing an Orion model 94-06 cyanide ion sensing electrode and
an Orion model 90-01 single junction reference electrode. The pH of the samples
was measured using a Fisher model 630 Accument pH meter and a Fisher standard
combination pH electrode. A photochemical quartz wand produced by Ultraviolet
Products, Incorporated (model SCT4) and an Hanovia mercury lamp were used for
the irradiation studies.
The determination of Cr, Ni , and Fe were made using a Perkin Elmer 305B
atomic absorption spectrophotometer.
Reagents
All reagents and solvents used were Fisher ACS spectranalyzed grade.
Extraction reagents - Iso-octane was used.
Sodium hydroxide - A 1.25 N solution was prepared by dissolving 50 g of sodium
hydroxide pellets in a liter of deionized water. The 0.125 N solution was made by
diluting 50 ml of the 1.25 N solution to 500 ml.
Sulfuric acid - Concentrated sulfuric acid was diluted 1:1 v/v with deionized water.
Cuprous chloride solution (Cu?Cl?I - Finely ground cuprous chloride, 20 g, was
washed twice with 250 ml of 1:49 v/v sulfuric acid and twice gently with deionized
water. Deionized water, 250 ml, and 125 ml of concentrated hydrochloric acid were
-6-

-7-
added. The solution was mixed until the salt dissolved. A few strands of copper
wire were added to the clean solution and the reagent was diluted to one liter.
Sodium dihydroRen phosphate (NaH^PO,,) - Sodium dihydrogen phosphate (NaHjPO^),
138 g, was dissolved in one liter of deionized water.
Chloroamine-T solution - Chloroamine-T, 1 g, was dissolved in 100 ml of deionized
water and stored in a refrigerator.
Pyridine barbituric acid solution - Barbituric acid, 15 g, was placed in a 250 ml
volumetric flask. Deionized water, just enough to wet the sides of the flask, was
added, followed by 75 ml of pyridine and the reagent was mixed. Concentrated
hydrochloric acid, 15 ml, was added and the solution was mixed thoroughly. The
reagent was allowed to cool to room temperature and deionized water was added to
the 250 ml mark. The reagent was mixed by inversion until the barbituric acid was
completely dissolved.
Standard cyanide solution 1000 ppm - Potassium cyanide, 2.5 g, and 2 g of sodium
hydroxide was dissolved in a liter of deionized water. Solutions, 0.01-1 ppm, were
prepared by diluting the 1000 ppm standard.
Cyanide electrode reagents - Sodium hydroxide pellets, 200 g, were dissolved in 500
ml of deionized water.
Acetic acid - Concentrated acetic acid was used.
Bismuth nitrate solution - Bismuth nitrate, 27.1 g, was dissolved in 1 liter of
deionized water.
Sodium sulfide solution 0.01 M - Approximately 48 g of disodium sulfide was
dissolved in 100 ml of deionized water. A 1 ml portion of that solution was diluted
to 200 ml with deionized water.
Disodium ethelenediaminetetraacetate (Na2EDTA) - Na2EDTA, 3.74 g, was dissolved
in 100 ml of deionized water.

-8-
Salicvlic acetate 1M - Salicylic acid, 13.81 g, was dissolved in 100 ml of ethyl
alcohol.
Distillation
To the absorber of a Fisher cyanide distillation apparatus 50 ml of 0.125 N
sodium hydroxide was added. A 100 ml sample was placed in the distillation flask.
The rate of air flow through the distillation flask was adjusted to 3-5 bubbles per
sec. Sulfuric acid (25 ml, 1:1 v/v) was added to the flask and the solution was
allowed to mix for one min. Cuprous chloride solution, 5 ml, was added and the
sample was heated at reflux for 1.25 hr. After refluxing the absorber solution was
transferred to a 100 ml volumetric flask. The gas scrubber was rinsed with
deionized water and the rinse solution was added to the absorber solution until the
100 ml mark was reached.
Colorimetric Analysis
A 20 ml portion of the distilled sample was placed in a 50 ml volumetric flask
followed by 15 ml of sodium dihydrogen phosphoric acid. The solution was mixed and
2 ml of chloroamine-T and 5 ml of pyridine barbituric acid were added. The
resulting solution was diluted to the mark with deionized water and mixed. After 8
min the absorbance was measured at 576 nm in a 1 cm cell. The corresponding
concentration was obtained from the calibration curve. The calibration curve was
prepared by following the above procedure employing standard cyanide solutions
from 0.01 to 1 ppm. The absorbance vs. concentration were plotted on standard
graph paper.
Analysis by Cyanide Electrode
From a 1000 ppm cyanide standard solution 100, 10, 1, and 0.1 ppm standards

-9-
were prepared by serial dilution. The standards, 100 ml each, were placed in 150 ml
beakers. The cyanide electrodes, pH electrode, and the thermometer were placed in
the stirred solution and the pH and temperature were adjusted to 11.5-12 and 24-25 ,
respectively. In the case of the 1 ppm standard, the potential was set to read zero
on the digital display of the Beckman 4500 digital pH meter. The electrodes and the
thermometer were removed, rinsed and placed in the 0.1 ppm standard. The pH and
temperature were adjusted to 11.5-12 and 24-25°, respectively, and the potential
recorded. The same procedure was employed on the 10 and 100 ppm standards.
Concentration in ppm vs. the potential in mV was plotted on 5 cycle log paper with
concentration on the log axis. After the calibration curve was prepared, 100 ml of
sample was placed in a 150 ml beaker. The electrodes and thermometer were rinsed
and placed in the stirred sample. The pH was adjusted to 11.5-12 and the
temperature was adjusted to 24-25°. The potential of the sample was recorded and
the cyanide concentration read directly from the calibration curve.
Extraction Procedure
A volume of sample, 10 ml more than is required for the analysis, was added to
a separatory funnel. Iso-octane, equal to 20% of the sample volume, was added to
the sample. The sepatatory funnel was shaken for 1 min and the layers were
separated. A 100 ml portion of the aqueous sample was employed in the analytical
determination.
Attempts to Remove Interferences
A liter of the dinitrotoluene effluent wastewater stream was adjusted to a pH
of 11.5-12 with sodium hydroxide pellets. Samples, 110 ml, were diluted 1:10 v/v
with deionized water and subjected to the various pretreatments listed below:

-10-
1. No pretreatment other than adjustment of pH and temperature.
2. DistUled samples and then analyzed by the cyanide electrode.
3. Extracted at pH 11.5-12 and then analyzed by the cyanide electrode.
4. Extracted at pH 5-7 and then analyzed by the cyanide electrode.
5. Extracted at pH 5-7, distUled, then analyzed by the cyanide electrode.
6. Extracted at pH 11.5-12, distUled, then analyzed by the cyanide
electrode.
This procedure was repeated for 1 liter of dinitrotoluene wastewater.
Verification of the Cyanide Electrode Method for Determining Cyanide
Standard solutions from 0.2-5 ppm were prepared by serial dUution of the 1000
ppm standard. The samples were analyzed according to the cyanide electrode
method.
The Analysis for Cr, Ni, and Fe in Dinitrotoluene Effluent Wastewater
A sample of dinitrotoluene wastewater was obtained. The sample was pre-
treated according to section 301.1 in the Standard Methods text. Atomic absorption
was then used to determine the concentration of Cr, Ni, and Fe in the sample. The
technique outlined in the Perkin Elmer Analytical Methods for Atomic Absorption
Manual was used.
rwnmposition of Fe(CN)^3 Complexes Present in Dinitrotoluene Wastewater
A sample of dinitrotoluene wastewater (before the extraction column) was
diluted 1:10 v/v with deionized water. Portions of the sample (110 ml) were then
extracted with iso-octane. The samples were analyzed by the method of Sekerka
and Lechner3 for total cyanides. The samples were exposed for 4 min using 270 watt
UV lamps.

-11-
Ultraviolet Irradiation of Dinitrotoluene Wastewater at pH
A sample of dinitrotoluene wastewater was diluted 1:10 v/v with deionized
water and extracted. The sample was separated into twelve 100 ml portions and the
potentials of six samples were measured by the cyanide electrode method. To the
remaining six samples, 2 ml of Na2S was added and each sample was irradiated for a
specified time using the UV quartz wand. The times were 10 sec, 20 sec, 30 sec, 1
min, 3 min, and 5 min. After irradiation 1 ml of bismuth nitrate was added and the
potentials were recorded.
UV Irradiation of Dinitrotoluene Wastewater at pH 11.5-12
Two sets of dinitrotoluene wastewater were analyzed according to the pre
ceding procedures, except the pH of the samples was maintained at 11.5-12 during
the irradiation sequence. One set of samples was also cooled in an ice water bath
directly after irradiation.
UV Irradiation of Dinitrotolune Wastewater in the Presence of Na2 EDTA
A 1 liter sample of dinitrotoluene wastewater whose cyanide concentration
was determined by the colorimetric method to be 35 ppm, was diluted 1:10 v/v with
deionized water and extracted. To three 100 ml portions of this wastewater 1 ml of
Na-EDTA was added and the potentials of the solutions were recorded. To another
three 100 ml samples 1 ml of Na2EDTA was added, the pH was adjusted to 5-7 and
the samples were then irradiated for 30 sec, 2 min, and 10 min, separately. After
irradiation the potentials were measured.
UV Irradiation of Dinitrotoluene Wastewater in the
Presence of Na^EDTA at pH Less Than 5
Several duplicate samples of dinitrotoluene wastewater were diluted 1:10 v/v
with deionized water and extracted at pH 6-7. To 100 ml of each sample 1 ml of 0.1

-12-
Na EDTA was added. The potentials were recorded. Several more identical samples
were analyzed in the same way as the above samples, except after the addition of
Na EDTA the pH of the samples was adjusted to less than 5 with acetic acid. They
were then irradiated for 10 sec, 20 sec, 30 sec, 1 min, 2 min, 3 min, and 5 min
separately.
UV Irradiation of Dinitrotoluene Wastewater in thePresence of Na2EDTA at pH 11.5-12
Six duplicate samples of dinitrotoluene wastewater were treated in the same
ways as the samples in the previous analysis, except the pH of the samples during
the irradiation was 11.5-12 rather than 5.
UV Irradiation of Dinitrotoluene Wastewater in thePresence of Salicylic Acetate at pH 11.5-12
Three identical samples of dinitrotoluene wastewater were diluted 1:10 v/v
with deionized water. The samples were extracted at pH 6-7 and the potentials
were measured. Salicylic acetate, 2 ml, was added and the potentials were again
measured. The three samples were irradiated for 1 min, 5 min, and 10 min
respectively. After irradiation the samples were cooled to room temperature and
the potentials recorded.
UV Irradiation of Dinitrotoluene Wastewater in the
Presence of Salicylic Acetate at pH 5-6
Three samples of dinitrotoluene wastewater were analyzed in the same way as
the samples in the above analysis. However, this time the samples were irradiated
at a pH of 5-6. The analysis was also performed on a set of five dinitrotoluene
wastewater samples using a Hanovia mercury lamp.

-13-
Wastewater Treatment Plant Analysis During Dinitrotoluene Plant Shut Down
Samples of wastewater were collected from the following eight points in the
wastewater treatment process in 1 quart cubitainers:
1. Process wastewater
2. Biox feed
3. Biox effluent
k. Carbon effluent
5. Feed to quench tank
6. Quench tank overflow
7. Scrubber water feed
8. Scrubber water effluent
Each of the samples was extracted at a pH of 6-7 and distilled. The cyanide
concentration was determined by the cyanide electrode and then by the colorimetric
method.
Surveillance of Dinitrotoluene Process Plant
Samples were collected from the following streams in the dinitrotoluene
process:
1. H-SO* from dinitrotoluene separator
2. Toluene from toluene overflow tank
3. H-SO& from the acid layer of mononitrotoluene and H
f. Feed to the wash water clean-up system
5. Effluent wash water clean-up system
6. H2SO^ from MNT-r^SO^ separator
7. Buffer feed to the washer separator
8. HNO3 from nitric acid plant
9. H-SO. from sulfuric acid concentration plant
The samples were diluted 1:10 v/v with deionized water and extracted with iso-
octane with no change in pH. A 100 ml portion of each samples was then distUled
and analyzed by the cyanide electrode method.
Surveillance of Wastewater Treatment Process DuringTypical Dinitrotoluene Production Periods
Samples from the eight wastewater treatment streams previously mentioned
were collected. The samples were extracted at pH 6-7. The samples were distUled
and the concentration of cyanide was first determined by colorimetry, then by the
cyanide electrode method.

RESULTS AND DISCUSSION
As part of a U.S. Environmental Protection Agency (EPA) verification study
involving the analysis of all waste streams associated with production of toluenedi-
isocyanate and methylenedianiline diisocyanate and their precursors, samples of the
effluent from the dinitrotoluene production unit prior to waste treatment were
examined. During this study, conducted by Mobay Chemical Corporation's
Environmental Research Group and Environmental Control Department, unexpected
cyanide levels (averaging 35 ppm) were found in the wastewater from the
dinitrotoluene process. This caused the environmental and analytical staff to
wonder if cyanide was being introduced into the system as an impurity. In order to
locate the source of cyanide a survey of the dinitrotoluene process was conducted.
The method used in the monitoring was the classical pretreatment distillation
followed by colorimetric determination. Because the classical method was time
consuming and tedious, less time consuming methods were examined. The methods
were based on the chemical composition (interferences) of the wastewater.
The analysis for interferences showed that sulfide, chlorine, and oxidizing
agents were not present. Sulfide can convert cyanide to thiocyanide (SCN) which
cannot be determined as cyanide. Sulfide would also cause cyanide electrodes to
malfunction by forming AgS salt deposits on the electrode membrane. Chlorine, an
oxidizing agent, oxidizes cyanide to the cyanate ion (CNO) by the following reaction:
NaCN + Cl2 ■*■ CNC1 + NaCl
CNC1 + 2NaOH * NaCNO + H2O + NaCl
Nitrophenols and amines were the only interferences believed to be present. The
-15-

-16-
polarality of the nitrophenols and amines can cause the cyanide electrodes to mal
function. Also, these phenols and amines are highly colored and therefore they
interfere with the colorimetric determination. Iron and other complexing metals
were initially assumed not to be present.
The interferences in the wastewater were relatively simple. Therefore, a
dilution followed by iso-octane extraction at the proper pH value should have
removed most of these interferences. If the interferences were removed with just
an extraction and a dilution, the time required for an analysis would have been
reduced by at least 1 hr.
Attempts to Remove Interferences
The experimental procedure (Attempts to Remove Interferences) was followed
and the results shown in Table 1 were very inconsistent. Because of the inconsistent
data a verification of the electrode determination procedure was conducted. Table
2 shows the excellent results that were obtained on several synthetic potassium
cyanide (KCN) solutions. These findings indicated that the electrodes were working
properly. Therefore, the problems must have been caused by interferences in the
sample.
After studying the experimental procedure, it was decided to increase the time
of the distillation to 1.25 hr and to decrease the amount of solution distilled from
250 ml to 100 ml. This procedure would insure complete distillation of HCN.
The procedure was performed again on a sample of dinitrotoluene wastewater
taken before the toluene extraction column. The results shown in Table 3 were more
consistent than those in Table 1. This data revealed that larger concentrations of
cyanide were being determined in samples after distillation. This meant that
metallocyanide complexes must be present in the wastewater, and our original

-17-
Table 1. Cyanjde concentration in dinitrotoluene effluent after the indicated
pretreatment. '
Untr.
54
50
44
55
55
53
Dist.
5k
5*
45
50
46
Extc.
pH 6-7
45
Extc.
pH 11-12
54
45
45
56
47
Extc.
pH 11-12
Dist.
45
52
45
a. Concentration in ppm.
b. Untr. - untreated sample
Dist. - distilled sample
Extc. pH 6-7 - extracted sample at pH 6-7
Extc. pH 11-12 - extracted sample at pH 11-12
Extc. Dist. pH 6-7 - extracted sample at pH 6-7, then distilled
Extc. Dist. pH 11-12 - extracted at pH 11-12, then distilled

-18-
Table 2. Verification of cyanide electrode determination.
[ CN~] from .True ICN"] Potential Readings Calibration Curvea'D
(ppm) (mY) (ppm)
0.2
0.3
0.4
0.5
3
4
5
48
35
32
20
-28
-33
-40
0.2
0.3
0.4
0.5
3
4
5
a. Calibration curve was prepared from 0.1, 1, and 10 ppm standard cyanide
solutions.
b. Standard deviation + .64.

-19-
Table 3. Cyanide concentration in dinitrotoluene ^fluent (before the wash waterclean up system) after the indicated pretreatments. '
Untr. Dist.Extc.
pH 5-7
25
21
23
23
23
23
23
21
23
22
2k
Extc.
pH 11-12
25
2H
26
25
25
Extc.
pH5-7
Dist.
29
37
35
37
29
29
29
37
32
35
35
Extc.
pH 11-12
Dist.
37
40
37
37
29 37
26 27
27 25
26 37
27 37
27
27
27
a. Concentration in ppm.
b. Samples as in Table 1.

-20-
assumption that iron or other complexing metals were not present in significant
quantities was incorrect.
To verify the presence of heavy metals, a literature search for the types of
metals possibly present was conducted. The literature revealed that the reactors
and pipes in the dinitrotoluene plant were all constructed of stainless steel of which
nickel, chromium, and iron are major components. A sample of dinitrotoluene
wastewater was then examined for Ni, Cr, and Fe using a Perkin Elmer 305 Atomic
Absorption spectrophotometer. The results showed that Cr and Ni concentrations
were of no significance but the concentration of Fe was 3 ppm. The concentration
of cyanide found in samples before distillation was approximately 27 ppm. The
concentration of cyanide found after distillation was approximately 37 ppm. The
difference between the two concentrations was 10 ppm. This 10 ppm was in agree
ment with the amount of cyanide that was complexed with 3 ppm iron. This analysis
confirmed the presence of complexed metallocyanide-compounds.
The Use of Ultraviolet to Decompose Iron CyanideComplexes Present in Dinitrotoluene Wastewater
The realization that iron cyanide complexes were present in the wastewater
led to the use of ultraviolet light as a means of decomposing these complexes. The
first procedure used was the Lechner and Sekerka3 method. The results are reported
in Table 4. These erratic results could have been caused by several factors: 1) the
270 watt lamps were not producing the proper wavelength of light; 2) the pH of the
sample did not aid in the decomposition of the Fe(CN)'3 complex; 3) the sulfide ion
did not successfully compete with the cyanide ions for the iron; 1) most
importantly, the temperature of the samples was not maintained constant during
potential readings.

-21-
Table ». Cyanide Concentration in DNT effluent determined by the Sekerka and
Lechner method.
Sample
1
2
3
4
5
6
7
(mV)
-15.7
-28.5
-30.8
-22.0
-21.0
-30.0
-29.0
E2(mV)
-16.6
-28.8
-31.2
-22.2
-21.4
-30.6
-30.4
E3(mV)
-1.3
-14.1
-17.8
-11.8
-8.1
-18.7
-17.0
[CN~]
(ppm)
65
29
7
9
23
5
9
Note:
where
The concentration of cyanide was determined by solving the following
equation:
[ CN~] ppm = [ CN~] a
E.-E log 2
Antilog I ^ r. I -1E2-E3
[ CN~] a = [CN~ ] ppm addedE. = mV of initial solution
El = mV of solution after known additionEi = mV of solution after 1-1 dilution v/v
-1

-22-
To solve these problems and to see if UV light would decompose metallocyanide
complexes in the DNT effluent, a procedure similar to the Lechner and Sekerka
method was employed. In this procedure the potential of dinitrotoluene effluent
wastewater was recorded before and after the wastewater was irradiated with UV in
the presence of sulfide ions, Na2EDTA, or salicylic acetate. Theoretically, if the
negative potential of the wastewater increased after irradiation, that would mean
that iron cyanide complexes decomposed and the Fe+3 or Fe+2 ions were
precipitated or recomplexed with sulfide or Na2EDTA or salicylic acetate, freeing
the bound cyanide. During this analysis the UV quartz wand was used as the source
of UV light. The wand provided a wider and more intensified source of light. Also,
the samples were irradiated at pH values 5-7 and 11.5-12. The temperature of the
samples were meticulously maintained at 24-25° during potential measurement.
The first of these analyses began with the UV irradiation of dinitrotoluene
wastewater at pH 5-7 in the presence of sulfide ions. The results shown in Table 5
indicate that no increase in cyanide ion concentration was observed after irradia
tion. Next, the dinitrotoluene wastewater was irradiated in the presence of sulfide
at pH 11.5-12. These results are also shown in Table 5 and they indicate no increase
in cyanide concentration after irradiation.
The second set of analyses began with irradiation of dinitrotoluene wastewater
in the presence of Na2EDTA. Na2EDTA is a multidentate ligand and theoretically
should be able to compete with CN" ions for the iron ions better than the sulfide
ions. The use of Na2EDTA would also eliminate any possible problems caused by
sulfide ion interference. The pH of the samples was varied from 3-5 to 5-7 to 11-12
during the irradiation of the samples. The potentials of the samples were recorded
before and after irradiation. The temperature of the samples was again maintained
at 24-25° during all potential measurements. Any increase in negative potential

-23-
Table 5. Potential reading for DNT wastewater before and after irradiation at pH
5-7 and pH 11-12 in the presence of sulfide ions.
Exposure „ Before AfterTime P Irradiation Irradiation
E E
:fore Afte
diation Irradia
(mV) (mV)
5
3
1
30
20
10
10
7.5
5
3
1
30
20
10
mm
min
min
sec
sec
sec
min
min
min
min
min
sec
sec
sec
5-7 -26 -20
5-7 -16 -10
5-7 -18 -1*
5-7 -19 -16
5-7 -17 -16
5-7 -18 -17
11-12 -9 -8
11-12 -9 -3
11-12 -9 -9
11-12 -8 -5
11-12 -8 -8
11-12 -8 -8
11-12 -8 -8
11-12 -8 -8

-7k-
after irradiation would indicate an increase in cyanide ion concentration. Table 6
shows the results. Again, there was no increase in cyanide concentration after
irradiation.
This result led to trying UV irradiation of dinitrotoluene wastewater in the
presence of salicylic acetate. Salicylic acetate forms a strong complex with Fe or
Fe ions in solution. The dissociation constants for the iron complexes indicate
that iron III and iron II form a stronger complex with salicylic acetate than with
Na-EDTA. The same irradiation procedure was performed using salicylic acetate as
the iron sequestering agent. The potentials of the samples were recorded before and
after irradiation and the results are shown in Table 7. Again, the results indicate no
increase in cyanide concentration after irradiation.
The results of these UV studies clearly show that there was no increase in
cyanide concentration after UV irradiation and in some cases there was a decrease
in cyanide concentration. These results are not fully understood at this time. More
research into the effects of UV on dinitrotoluene wastewater would have to be
conducted before these results can be fully comprehended. These analyses did show
that the use of UV as a substitute for distillation could not decompose iron cyanide
complexes under the chemical conditions present in dinitrotoluene wastewater.
Analysis During Dinitrotoluene Plant Shut Down
The failure of extraction, dilution, and UV exposure to remove interferences
and to give consistent results left us with no other choice but to use the conven
tional distillation method in analyzing the plant's processes. The conventional
method had to be changed somewhat so more consistent results could be obtained.
The first change was to decrease the amount of sample from 250 ml to 100 ml. The
second change was to increase the distillation time to 1.25 hr. The third change was

-25-
Table 6. Potential reading for DNT wastewater before and after irradiation in the
presence of Na2EDTA.
Exposure
Time
5 min
3 min
2 min
1 min
30 sec
20 sec
10 sec
10 min
2 min
30 sec
10 min
5 min
3 min
2 min
1 min
30 sec
10 sec
PH
5-6
5-6
5-6
5-6
5-6
5-6
5-6
6-7
6-7
6-7
11-12
11-12
11-12
11-12
11-12
11-12
11-12
E
Before
Irradiation
(mV)
-18
-17.5
-16
-17
-17
-17
-17
-23
-18
-20
-18
-18
-18
-18
-18
-18
-18
E
After
Irradiation
(mV)
-8
-8
-11
-13
-1*
-15
-10
-0.5
-10
-17
-9
-12
-13
-18
-17
-17
-17

-26-
Table 7. Potential reading for DNT wastewater before and after irradiation in the
presence of salicylic
Exposure
Time
1 min
5 min
10 min
1 min
3 min
5 min
7 min
10 min
1 min
5 min
10 min
acetate.
PH
5-6
5-6
5-6
6-7
6-7
6-7
6-7
6-7
11-12
11-12
11-12
E
Before
Irradiation
(mV)
-19
-17
-16
-5
-5
-6
-7
-6
-20
-18
-18
E
After
Irradiation
(mV)
-17
-1*
-9
-3
-2
-5
-6
-3
-16
-16
-13
°C
26°
25°
25°
23°
2*°
2*°
23°
2*°
25°
26°
25°

-27-
to decrease the concentration of the caustic soda trap solution to 0.125 normal.
These changes would insure complete turnover of hydrogen cyanide (HCN) from the
distilling flask to the caustic soda trap.
The first process surveyed was the wastewater treatment process. The survey
was conducted during a dinitrotoluene plant shut down. A flow diagram of the
wastewater treatment process is illustrated in Fig. 1. The sample points are indi
cated by numbers. The results show a variation in cyanide concentration after
neutralization. This variation suggested that cyanide ions were present in the basic
solution used in the neutralization. This variation was small and of no consequence
because the (CN~) was reduced after biox treatment. A relatively large increase in
cyanide concentrations was observed in the scrubber water effluent. This indicated
that cyanides may be generated during the regeneration of spent carbon. The spent
carbon is regenerated by heating at very high temperature. The gases that are given
off are washed into a water storage pond by the scrubber water stream. The cyanide
concentration was again reduced by dilution in the water storage pond, as evidenced
by the low cyanide concentration in the scrubber feed water.
The final effluent from the wastewater treatment process averaged 23 ppb.
This concentration was well below the EPA required limit for cyanide discharged to
a water body. These results are indicated in Table 8.
Surveillance of Dinitrotoluene Process
To characterize the cyanide concentration in the dinitrotoluene plant, samples
from the process were obtained from the points illustrated on the flow diagram in
Fig. 2. The samples were collected every morning between 8:00 and 9:30. The
initial results are reported in Table 9. The inconsistency of these results was due to
changes in the amount of dinitrotoluene produced per hr. Therefore, conversions

-28-
NEUTRALIZAT1ON
AREA.2
RAINWATER
CATCH BASIN
BIO
OXYDAT1ON
_>£.
CARBON
TOWER
CARBON
REG EN.
TOWER
.6-B—
QUENCH
COOL
TANK
Fie. 1. Flow diagram of waste treatment process.
Sample points: (1) Process raw wastewater
(2) Biox feed
(3) Biox effluent
(k) Carbon tower effluent
(5) Carbon furnace feed water
(6) Carbon furnace effluent water
(7) Quench cool scrubber feed water
(8) Quench cool scrubber discharge water

Table 8. Cyanide concentration in the wastewater treatment plant during DNT shut down/
Sample
Points 9/22/80 9/23/80 9/24/80
Dates
9/25/80 10/2/80 10/3/80 10/4/80
1
2
3
5
6
7
8
0.02
0.47
0.03
0.02
0.02
0.02
0.02
0.02
0.03
0.09
0.03
0.02
0.07
0.02
0.02
1.0
0.20
0.20
0.04
0.03
0.04
0.02
0.01
1.0
0.01
0.014
0.01
0.01
0.014
0.01
0.01
1.0
0
0
0
0
0
0
0
0
.04
.17
.01
.01
.09
.01
.01
.01
0.1
0.1
0.05
0.05
0.22
0.002
0.175
2.01
I
VD1
a. Concentration in ppm.
b. Sample Points:
(1) Raw wastewater
(2) Biox feed
(3) Biox effluent
(4) Final effluent
(5) Scrubber water feed
(6) Feed to quench tank
(7) Quench tank overflow
(8) Scrubber water effluent

-30-
1,104 •aC7cl«4 7.JJ.1
Sli.nl Hia,
Teiumc ^
Mononltrator
SyaLao
1 Telu*na raeavcroa1
m
4 ««.
WIT
Separator
BjSO, to
trvrrv ?lt«
Vaafc V«c.r
Syataai
e.i TxlIT11
r
Km m
Stloog BHO3 Stron| lljSC^
O.C2ilO~l* Bloltiatto.
•74ml(T"^
■,0 mm
•<|u»tia hvffir lOU
s
SKI -fl
ONT
Stparator
Ijaraa
Baahar
Ijataa
_J
Fig. 2. Flow diagram of dinitrotoluene plant.
Note: Numbers express average cyanide concentration in lbs CN basedon 1 lb DNT per hr of production.
NMA = No measureable amount of cyanide.

Table 9. Cyanide concentration in dinitrotoiuene process.
Sample
Points
1
2
3
4
5
6
7
10/13
0.1
3.8
4.3
11.5
4.9
3.4
-
10/14
-
4.0
-
5.5
3.3
-
0.1
10/15
29.0
0.54
30.0
3.2
3.9
50.0
0.1
10/16
51.0
3.4
51.0
3.2
2.4
40.0
-
Dates
10/17
22.0
3.5
80.0
4.6
3.5
10.9
0.1
10/20
95.0
3.7
40.1
2.9
2.5
70.0
0.1
10/21
40.0
0.25
60.0
4.7
4.1
40.4
0.1
10/22
12.5
0.33
7.0
2.9
3.0
14.5
0.1
10/23
6.9
0.68
55.0
3.0
2.6
80.4
0.1
10/24
20.7
0.5
-
3.6
3.8
50.0
0.1
a. Concentration in ppm
b. Sample Points:
(1) r^SO^ to mononitrator(2) Toluene, recycled from overflow tank(3) Effluent from mononitrator(4) Feed to wash water clean-up system
(5) Effluent from wash water clean-up system(6) Spent acid from MNT separator(7) Buffer feed to washer system

-32-
from cyanide in ppm to lbs cyanide/lb DNT produced/hr were made. These conver
sions normalized the data and made it more meaningful. After these conversions
were made a true pattern of cyanide concentration in the process could be observed.
From the normalized data in Table 10 it can be seen that cyanide averaging con
centration of 8.0X10" lbs CN/lb DNT produced/hr was generated in the nitration
steps of the process. These data are also represented on the flow diagram of the
dinitrotoluene process in Fig. 2. Most of the cyanide was lost to the sulfuric acid
recovery plant. A small portion, 0.7<fX10~ lb CN/hr, remained in the system and
was carried to the wastewater treatment area where this concentration was reduced
by dilution and wastewater treatment. No measurable amount (NMA) of cyanide was
found in the initial nitric acid and sulfuric acid used in the process. The 0.74X10
lb CN/hr concentration should not have effected the cyanide concentration found in
the wastewater treatment area during (DNT) shut down. However, the cyanide
concentration did increase in all the sampled streams in the wastewater treatment
area. This increase in cyanide concentration may have been due to the combined
effects of all the processes in the plant. Also, the atmospheric temperature was a
possible contributor to these results. The atmospheric temperature during the first
survey of wastewater treatment process was approximately 22 . This temperature
is near the boiling point of HCN. The temperature during the second survey of the
wastewater treatment process was below freezing. The higher temperature during
the first analysis caused more cyanide to volatize out of the wastewater streams,
causing less cyanide to be determined in the final analysis. Unfortunately this
explanation can not be verified because we did not measure the temperature of the
water itself. These results are reported in Table 11.

Table 10. Cyanide concentration for dinitrotoiuene process
Samples
1
2
3
k
5
6
0
0
0
10/13
-
-
.77X10"11
-
.81X10"11
.56X10"11
10/lf
-
-
-
0.92X10"11
0.62X10"11
-
Dates
10/15
f.9 X10"11
0.09X10'11
5.08X10'11
0.5 X10"11
0.66X10"11
8.47X10"11
10/16
1.2 X10"11
-
11.2 X10"11
0.7 X10"11
0.53X10"11
8.8 X10"11
10/17
3.88X10"11
-
14.1 X10"11
0.81X10"11
0.63X10"11
1.92X10"11
-33-a. Concentration in lbs cyanide per lb DNT produced per hr.
b. Samples:
(1) H-SCX to mononitrator
(2) Toluene recycled from overflow tank
(3) Effluent from MNT system
() Feed to wash water clean-up system
(5) Effluent from wash water clean-up system
(6) Spent acid from MNT separator
(7) Buffer feed to washer system

Table 10. (Cont.)
10/20
24.7 X10¹¹
-
10.4 X10"11
0.76X10"11
0.65X10"11
18.2 X10"11
10/21
7.82X10"11
0.05X10"11
11.5 X10"11
0.92X10"11
0.80X10"11
7.04X10"11
10/22
2.56X10"11
0.07X10"11
1.43X10"11
0.59X10"11
0.62X10"11
2.97X10"11
Dates
10/23
2.04X10"11
0.01X10"11
11. X10'11
61.7 X10"11
53.5 X10"11
0.16X10"11
10/24
4.6 X10"11
.11X10"11
-
.81X10"11
.84X10'11
11. X10"11
Average
7.75 XIO"11
0.066X10"11
8.2
0.74
0.67
8.5
I
xio-11
XIO"11
xio-11
XIO"11
MMA

-35-
Table 11. Cyanide concentration in the wastewater treatment plant during a typical
DNT production.
[ CN~]Sample Points (ppm)
1. Process Raw Wastewater 0.6
2. Biox Feed *»6
3. Biox Effluent °«5
4. Carb Tower Effluent °«7
5. Scrubber Water Feed 0.7
6. Quench Tank Feed
7. Quench Tank Overflow 0.1
8. Scrubber Water Effluent 8.5

CONCLUSION
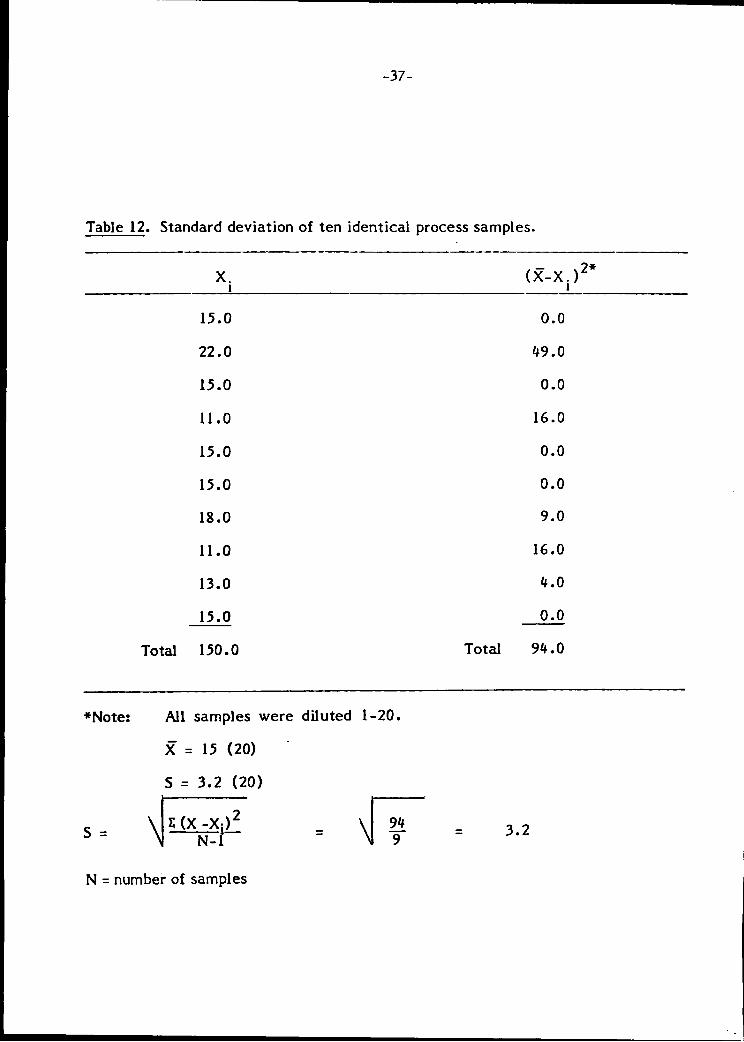
The precision of conventional distillation methods was checked by calculating
the standard deviation (Table 12) of ten identical samples from the dinitrotoluene
process stream. The mean of these samples was 15 ppm and standard deviation was
+ 3.2 ppm. This precision was in good agreement with other calculated precisions
g
reported by McKee .
The interferences present in the wastewater streams could not be removed by
dilution, extraction or UV irradiation in the presences of metal precipitating or
sequestering agents. Therefore, the conventional distillation procedure had to be
used to perform the analyses.
The analysis of the DNT plant revealed that cyanide averaging 8.0X10 lb
CN" (basis 1 lb DNT/hr) was generated by an unknown reaction in the nitration steps
of the process. Most of the cyanide is lost to the sulfuric acid recovery plant.
Approximately 0.7X10'11 lb CN is carried through the system and exists in the DNT
wastewater stream.
The surveillance of the wastewater treatment area during DNT shut down
revealed three things. One, the cyanide concentration varied across the neutrali
zation unit. Two, the cyanide concentration was increased in scrubber water after
regeneration of spent carbon. Three, the final cyanide concentration of the waste-
water stream was below the EPA required limit of 6*0 ppb for a daily maximum.
The analysis of the wastewater treatment plant during a typical DNT produc
tion period suggested that the 0.7 X 10"11 lb CN from the DNT unit increased the
cyanide concentration in all the wastewater treatment streams.
-36-
-37-
Table 12. Standard deviation of ten identical process samples.
(X-X.)2*
15.0
22.0
15.0
11.0
15.0
15.0
18.0
11.0
13.0
15.0
Total 150.0
0.0
49.0
0.0
16.0
0.0
0.0
9.0
16.0
4.0
0.0
Total 94.0
*Note:
S =
All samples were diluted 1-20.
X = 15 (20)
S = 3.2 (20)
\r vl2 94
93.2
N = number of samples

RECOMMENDATIONS
Research for possible mechanisms by which cyanides are generated in the DNT
process should be conducted. A possible starting point could be setting up a
laboratory size DNT production unit. Make DNT in the lab under different catalytic
conditions. Analyze the wastewater from the unit to see if cyanides are being
generated.
A second recommendation is that wastewater treatment streams be examined
under different atmospheric conditions. Special attention should be paid to the
temperature of the raw process wastewater stream. This study could reveal the
dependence or independence of the wastewater treatment streams on atmospheric
conditions.
-38-

REFERENCES
1. ALPHA, AWWA, and WPCF, "Standard Methods for the Examination of Water
and Wastewater," 14th Ed., American Public Health Association, Washington,
D.C., 1975, p. 361.
2. P. A. Kapauan and R. L. Tom, Inis Atomindex, |, 406971 (1978).
3. I. Sekerka and 3. F. Lechner, Water Research, 10, 479 (1976); Chem. Abstr.,g5,
112408a (1976).
4. 3. E. Girard, Analytical Chemical, 51, 836 (1979).
5. Chi - Fen Chu, 3. Chin. Chem. Soc, 22, 157 (1975).
6. Tao 3ui and Yu-Cheng 3en, Fen Hsi Hua Hsueh, 6, 438 (1978).
7. G. Nota and C. Improta, Water Research, 13, 177 (1979).
8. G. D. McKee, "Status of Analytical Methods for Cyanide", U. S. NTIS Tech
nical Report No. PB-297453 (1979).
-39-