singapore in motion: insights on public transport service ... · ment data used: the anonymized...
TRANSCRIPT

Singapore in Motion: insights on public transport servicelevel through farecard and mobile data analytics
Hasan PoonawalaIBM Research
9 Changi Business ParkSingapore
Vinay KolarIBM Research
Outer Ring RoadBangalore, India
Sebastien BlandinIBM Research
9 Changi Business ParkSingapore
[email protected] WynterIBM Research
9, Changi Business ParkSingapore
Sambit SahuIBM Research
1101 Kitchawan RoadYorktown Height, NY
AbstractGiven the changing dynamics of mobility patterns and rapidgrowth of cities, transport agencies seek to respond morerapidly to needs of the public with the goal of offering aneffective and competitive public transport system. A moredata-centric approach for transport planning is part of theevolution of this process. In particular, the vast penetrationof mobile phones provides an opportunity to monitor andderive insights on transport usage. Real time and histor-ical analyses of such data can give a detailed understand-ing of mobility patterns of people and also suggest improve-ments to current transit systems. On its own, however, mo-bile geolocation data has a number of limitations. We thuspropose a joint telco-and-farecard-based learning approachto understanding urban mobility. The approach enhancestelecommunications data by leveraging it jointly with othersources of real-time data. The approach is illustrated on thefirst- and last-mile problem as well as route choice estima-tion within a densely-connected train network.
CCS Concepts•Information systems → Data analytics; •Appliedcomputing → Transportation;
Keywordsbig data; mobility ; public transport route choice; map-matching LATEX
1. INTRODUCTION
1.1 Background
Permission to make digital or hard copies of all or part of this work for personal orclassroom use is granted without fee provided that copies are not made or distributedfor profit or commercial advantage and that copies bear this notice and the full cita-tion on the first page. Copyrights for components of this work owned by others thanACM must be honored. Abstracting with credit is permitted. To copy otherwise, or re-publish, to post on servers or to redistribute to lists, requires prior specific permissionand/or a fee. Request permissions from [email protected].
KDD ’16 August 13–17, 2016, San Francisco, CA, USAc© 2016 ACM. ISBN 123-4567-24-567/08/06.
DOI: 10.475/123 4
Traditional transportation planning processes can be costlyand resource intensive since they are typically based on sur-vey data. However, given the changing dynamics of mobilitypatterns, it is important for cities to maintain a comprehen-sive and high-frequency knowledge of mobility patterns. Adata-driven approach to the monitoring, analysis, and plan-ning of transport operations is paramount for smart cities.
The deep penetration of mobile phones provides an oppor-tunity for transport agencies to monitor and derive valuableinsights from all commuters, and across their entire trips.With the proper analytics, anonymized mobile geolocationdata can provide a detailed understanding of mobility pat-terns, with visibility on the trip segments traditionally un-observed, such as the first and last miles part of the trip.This understanding can trigger and adaptive feedback loopon data-driven public transit improvements.
On its own, however, mobile geolocation data has a num-ber of limitations. For example, the spatial resolution ofthe mobile geolocation data, for records without GPS infor-mation, can lead to high uncertainty in derived movementpatterns. Secondly, the uncertainty in the penetration ofmobile devices means that quantitative assessments of den-sities or volumes cannot be known precisely. Lastly, theheterogeneity of those two sources of errors over space (andtime, for the latter) adds further difficulty and error to theanalytical results obtained from mobile geolocation data.
We thus propose a farecard-based learning approach tounderstand urban mobility from telecommunications data.Fusion with farecard data allows for harnessing the powerof the mobile geolocation data while compensating for itslimitations. In particular farecard data provides highly ac-curate quantitative knowledge on station to station travel-times and volumes, which can help anchor end-to-end tra-jectory information provided by mobile geolocation data.
We are also interested in designing Big Data models fortwo main types of analyses, namely the so-called first andlast mile of public transport users, and the route choice ofpublic transport users in the public transport network. Bothrequire trajectory analytics and data fusion, which are de-scribed in this article.
First and last mile analysis is of importance to transportauthorities to aid in defining services to and from train sta-

tions, including feeder bus routes and on-demand minibusservice. The route choice of train passengers in a train net-work such as Singapore’s is not directly available from thefarecard data and so must be deduced from other sources.It is valuable to transport authorities in understanding routecrowding within the network, and adjusting accordingly routedissemination systems. Additionally, the understanding ofexplanatory factors for route choice (travel-time, fare, etc.)is fundamental for planning.
1.2 Related workWith the increase of mobile data, the concept of crowd
and community sensing [18] has seen a growing popularityin the recent decades. With the availability of GPS chips andadditional sensors indirectly providing location contexts onmost smartphones, spatio-temporal analytics which used torely on inaccurate low-sample cellphone data has seen re-newed interest for this new analytic superfood [1]. Mobilegeolocation data has been used for instance for real-timetraffic monitoring [32] and path inference [14] in the contextof GPS-based participatory sensing, combined with othersources for city planning [26], and even as a potential re-placement for the fixed sensing infrastructure, in particularon expressways [23].
A large literature has been focused on extracting spatio-temporal activity patterns from large cellular network datasets [5],in combination with social media [11], leveraging model fromstatistical physics [10]. Remarkable structure and consis-tency has been exhibited from large mobile datasets [7, 28],supporting the design of long-term mobility forecast modelsable to achieve unexpected accuracy [27]. It has been shownthat based on mobile data, it is possible to identify touristsfrom residents, identify hotspots within a city, detect pre-ferred activity sequences, see for instance [6, 8, 30].
In the recent years, a growing literature has been con-cerned with augmenting geospatial and mobility insightswith semantics information [16], in particular using socialmedia during events [25] and for prediction of level of ser-vice on public transport networks [24].
In Singapore, the large penetration of mobile phones andthe relatively high population density have been conduciveto a number of studies analyzing public mobility patterns [19],deriving insights on the network resilience [13] based on net-work connectivity indicators and crowding. In [12] a systemwas developed to derive passenger traffic and route recom-mendations for the train network, using train network spe-cific cell tower information. These studies serve as buildingblock for nation-wide simulation engines [22], which can inturn support enhanced response to incidents [15, 29].
In parallel, Big Data and cloud computing platforms haveemerged leveraging fast and efficient frameworks able to runspatio-temporal and statistical models at scale [17] on ter-abytes of data.
We propose to focus our study of travel patterns to thecase of the public transit network, which requires novel an-alytics for travel mode detections in the context of spatiallyuncertain mobile geolocation data. We further derive newactionable insights by fusion of mobile geolocation data withfarecard data, and show that such insights can support thedeployment of new data-driven practices for real-time mon-itoring and transit planning.
1.3 Contributions
In this work, we generate insights on the Singapore publictransport mobility patterns through a fusion approach whichincludes mobile geolocation data as well as farecard datafrom the public transport network. The contributions ofthis work include
• the development of trajectory analytics for mobile ge-olocation data calibrated automatically from farecarddata, allowing for both high accuracy and high spatialcoverage.
• application of the calibrated travel pattern model tothe analysis of the first and last mile problem, withcategorization of train stations according to their ac-cessibility properties.
• the development and calibration of data-driven routechoice models and the resulting analyses of public trans-port route choices, in particular explanatory features,by using the calibrated travel pattern model.
The remainder of the paper is organized as follows. Sec-tion 2 describes the data characteristics, Section 3 presentsour Big Data platform, and Section 4 introduces the coreanalytics developed for the particular use cases of interest,as well as our calibration procedure. Section 5 presents theinsights obtained on the problem of the first and last mile,and Section 6 addresses the problem of understanding theexplanatory factors of public transport route choices. Fi-nally, Section 7 provides concluding remarks.
2. DATASETIn this section, we describe our two main sources of move-
ment data used: the anonymized StarHub mobile geoloca-tion data and the anonymized Singapore Land TransportAuthority (LTA) farecard data, as well as the key charac-teristics of the public transport network.
2.1 Public transport network characteristicsThe public rail network used in this study is composed
of five Mass Rapid Transit (MRT) lines: the North-South,East-West, North-East, Circle and Downtown lines. Thereare 123 stations on the five lines, of which 15 are interchangestations connecting two or more lines. The network boastsa ridership of over 2 million passengers per day.
2.2 Farecard dataAll train fares on the Singapore public transport network
are paid using cashless smart cards which require a passen-ger to tap in to enter the network and tap out to exit thenetwork, thus providing the origin, destination, time, andtravel-time, of every journey within the train network. Theanonymized farecard data thus has a unique entry for eachorigin-destination journey made by a commuter includingthe following data fields for each journey (1) anonymizedcard ID, (2) origin MRT station, (3) destination MRT sta-tion, (4) entry timestamp, (5) exit timestamp.
2.3 Mobile geolocation dataThe StarHub mobile geolocation data format includes a
unique anonymized entry for each geo-localized record gen-erated from a StarHub anonymized customer mobile phone,including the following fields; (1) record time, (2), anonymizeduser ID, (3) latitude, (4) longitude, (5) accuracy, (7) network

event type, where the various network events are further de-scribed in the following section.
3. BIG DATA PLATFORMIn this section, we describe the Big Data platform sup-
porting the analytics components. We use IBM City in Mo-
Figure 1: IBM City in Motion: Conceptual Architecture.
tion (CiM) system. The system is built on a Hadoop-basedplatform with a custom spatio-temporal engine.
The conceptual architecture of CiM is shown in Figure 1.The CiM acts on mobile geolocation data to provide mean-ingful insights about movement patterns in a city. Corealgorithms are generically constructed such that CiM canbe used as a fundamental system for spatio-temporal ana-lytics in various domains such as Smarter TransportationPlanning, Cellular Network Planning, Visitor Analytics fordifferent points-of-interest, and Law Enforcement. We nowbriefly explain the main components of the system.
3.1 Data and IngestionCiM ingests generically available mobile geolocation data
including network events, and other forms of openly avail-able data such as maps.
Generic mobile geolocation inputs.Network event data consists of anonymized subscriber-
level events that are recorded by the network. Networkevents are usually generated under the following conditions:(1) place or receive a call or SMS, (2) periodic log of mobiledata usage, (3) location update (typically, when anonymizeduser moves from one region of the city to another), or (4)network event such as network congestion, call drop, etc..
In addition to the network event, CiM ingests locationcontext and map data. The map data provides CiM withdetails about the road and the rail network, and is used bythe analytics engine to reason about the mode of transportof the anonymized user. Point-of-interest data provides in-formation about important locations to be analyzed, suchas malls and train stations.
Extract, Transform, Enrich, Load.One of the main challenging tasks in ingesting network
events is handling the scale, which can range from hundredsof millions to over a billion records per day. CiM ingests
network events using Apache Flume and Kafka thus allowingCiM to reach this scale.
Network event data is enriched and converted to a stan-dard format called the Denormalized Network Event (DNE).Here, only selective fields required for analysis (such as anonymizeduser identifier, time-of-the-event, and event type) are usedand the rest of the record is excluded. In this study, we in-gest close to 3 billion records for around 2.6 million anonymizedusers.
The multi-dimensional DNE data is indexed and storedin Hive tables [2]. Indexing the data is not a trivial task.Each analytic component may query the data using differ-ent dimensions; certain analytics require all events of ananonymized user for a given time-frame, others may requireall events within a certain space-time window. Thus there isno single optimal way to index and cluster the data. We par-tition the DNE first by time (at date granularity), and thencluster by the user id. This enables the core algorithms – thedwell and trip analytics – to compute meaningful locationsand trips of an anonymized user in a given time period.
3.2 Road/Rail Network AlgorithmsSeveral analytics require basic spatio-temporal algorithms
on graphs, such as the road and rail network, to deter-mine the location context of the user. Examples of suchanalytics in CiM include detection of mode of transporta-tion used and computation of the shortest-path on the rail-network. The main graph-based spatio-temporal functional-ities in CiM are: (1) ingestion of the road and rail network;(2) fast shortest-path algorithms on the graph between twopoints using constrained graph search; (3) Hidden MarkovModel (HMM) based map-matching algorithm to identifythe most likely trajectory on a road or rail network givenmobile geolocation data [21]. On the Hadoop platform, theroad and rail network are stored in Hive tables. The algo-rithms for shortest-path and map-matching are exposed asHive User Defined Functions (UDFs).
3.3 VisualizationFor visualization purposes, we aggregate trajectories by
origin zone-destination zone (OD) pairs, where zones are250m x 250m squares. The start and the end point of thetrip computed by the trajectory cut algorithm, described inthe following section, are mapped to their respective zones.We aggregate the number of trajectories at 1 hour inter-val periods for each day and the estimated aggregate origindestination flow is used by the application-specific modules.We also provide the mean and median measures for the tripdistance and duration, along with the number of trips foran OD pair. Figure 2 corresponds to the OD visualizationdescribed, for various times of day.
4. MOVEMENT PATTERN ANALYTICSCiM consists of two types of fundamental spatio-temporal
analytics: (1) Dwell analytics determine the meaningful lo-cations where people spend time, and (2) Trip Analyticsdetermine how people move. Properties of mobile geolo-cation data render these analytics non-trivial. First, mobilegeolocation data is very sparse (around 40 events per personper day) compared to GPS location traces, typically sampledaround 1 Hz. In addition, geolocation uncertainty in cellulardata typically ranges in the hundredths of meters, whereasGPS data uncertainty is less than 10 meters. Hence, our

(a) Morning traffic flow
(b) Evening traffic flow
Figure 2: Origin Destination weekday traffic: repre-sented by a green arrow from the origin with red head at thedestination. The morning traffic toward the Central Busi-ness District and evening traffic from the Central BusinessDistrict on the South can be observed at peak times.
cellular spatio-temporal analytics components are tailoredto spatially uncertain and under-sampled geolocation data.
4.1 Dwell analyticsDwell analytics estimate user home and work location
based on the duration of stay at different times of the day.Dwell analytics also estimate additional anonymized user-specific meaningful locations, where an anonymized user spendssignificant time during weekdays and weekends. Home, workand meaningful locations can be aggregated and visualizedas a heatmap of where people live, work or spend time. Im-portant places of an anonymized user are stored into HDFSas Hive tables. They are also stored in Elastic-Search, whichis an indexed storage for fast retrieval [4]. Home, workand meaningful locations are indexed by the anonymizeduser identifier and the spatial zone coordinate. In addition,meaningful locations are also indexed by type of day (week-day/weekend) and 90th percentile of the time range of visitsto the given location.
4.2 Trip analyticsThe Trip Analytics component estimates anonymized user
trajectories from raw DNE data. We describe some of thecore trajectory algorithms below, focusing on the scalability
and Big Data aspects.
Trajectory segmentation.We utilize stay-point detection algorithms [33] to detect
the start and end of a meaningful trip of a user. All the tripsof a user are stored into the Hive table. This table servesas a foundation for all trajectory-related algorithms in CiM,such as origin-destination analysis.
Trajectory fencing.A common requirement consists of assessing whether a
trajectory intersects a point of interest. For example, todetermine if a user has possibly traveled in a train, it maybe useful to compute if the user trip intersects a train stationpolygon. We have developed trajectory fence algorithms todetermine if a trajectory cuts a polygon. The polygon ofinterest is divided into disjoint triangles and a trajectoryinto a set of lines between hops. The algorithm checks ifany line of a trajectory cuts at least one triangle using a fastline cutting polygon algorithm [20].
Trajectory similarity.It is often required to estimate the distance between two
trajectories, for instance a user trip and a train route. Wehave developed trajectory similarity algorithms based onleast common substring (LCSS) [31].
4.3 Travel mode detectionIn order to provide public transit specific travel patterns
insights from mobile geolocation data, it is necessary to iden-tify the subset of the total daily trips including a publictransit network segment. To this end, we propose a four-phase approach to process the time-series of sparse mobilegeolocation data network events and leveraging the farecardand potentially other sources of real-time data.
In this work, we focus on identifying trajectories wherea significant sub-trajectory aligns with a train network seg-ment. Applying a map-matching algorithm on all the tripsbeing prohibitively expensive, we propose a fast two-stepheuristic to efficiently filter out trajectories that are un-likely to correspond to a trip on the train network. A map-matching algorithm is then applied to these filtered trajec-tories. Lastly, we join the estimated train network trips withpatterns estimated from the farecard data, and iterate untila target accuracy has been achieved.
Step 1: determine start and end train stations.We recognize that a sampled trajectory trace can be a
trajectory on a train only if it cuts through at least two trainstations. We use the trajectory fence algorithm describedabove to check if the trip cuts train station polygons. Forthe filtered trajectories, we determine the start and the endtrain stations in this step. Next steps are executed only fortrajectories filtered in this stage.
Step 2: filter based on intermediate points.We use a heuristic that all points of a trip between the
start and end train stations should be close to the rail net-work. We store all line segments of the rail network within aspatial index, such as r-Tree [9]. For each trajectory filteredin step 1, we determine if any point between the start andend train stations is farther than a threshold (1km in this

study) from the rail network segments. It that is the case,we conclude that the trip does not correspond to a train tripsince at least one point between the candidate start and endtrain stations is far from the rail network. Step 3 is onlyapplied to the trajectory successfully filtered by both step 1and step 2.
Step 3: map-matching and similarity test.We then snap the candidate trajectory on the rail-network
using the map-matching algorithm described in Section 3.2.The HMM-based map-matching algorithm uses an adequateobservation noise model with a 1km variance. This rela-tively large observation noise also causes scenarios wheretrips corresponding to nearby roads may be falsely catego-rized as train trips by the map-matching module. Hence,we utilize a heuristic wherein we compare the sampled sub-trajectory between the start and the end train station withthe map-matched sub-trajectory using a trajectory similar-ity algorithm. If the similarity is sufficiently high, we acceptthe trajectory as a train trip.
Step 4: farecard-based learning.The output from step 3, must then be appropriately scaled
based on estimated device penetration rate, is then com-pared against similar observed quantities from farecard data,and CiM iterates if the error metric is too high. This pro-cess is illustrated in Figure 3, representing a week of fare-card tap-in data and the corresponding tap-in as per step3. Travel mode detection parameters are updated via localsearch based on the observed discrepancy until convergence.
For each trip including a train network leg, we eventuallyobtain from the travel mode detection component both asub-trajectory corresponding to the train segment, and anentire end-to-end trajectory of the anonymized user trip asper the DNE data. Both trajectories are stored in Hivetables clustered by start and end train stations.
4.4 EvaluationThe general statistics of the dataset and movement pat-
terns are are listed in Table 1 and Table 2.
Number of records 3089 MNumber of subscribers 1.7 M
Number of records per user 1800
Table 1: General Statistics
Number of Trips 33 MNumber of Trips after MRTFilter
27 M
Number of MRT Trips afterMap-matching
21.1 M
Number of MRT Trips afterCalibration
14 M
Number of MRT Trips afterscaling by penetration factor
46.6 M
Number of MRT Trips as perFarecard Data
40 M
Table 2: Movement Patterns (15 days)
Figure 3: Farecard-based learning: for a popular resi-dential station (Tampines), a popular commercial/shoppingzone (Orchard) and a busy commercial station in the CentralBusiness District (City Hall).
The evaluation of the performance of the trajectory an-alytics can be measured quantitatively on a network levelby computation of standard rank correlation, such as Spear-man rank correlation coefficient or Kendall rank correlationcoefficient, presented in Table 3.
Spearman rank Kendall rankcorrelation coefficient correlation coefficient
0.60 0.44
Table 3: Top ODs matching: between farecard-based topODs and mobile geolocation-based top ODs.
For completeness, we also present in Table 4 typical val-ues for qualitative similarity between origin-destination flowrankings from mobile geolocation and farecard data. Inthe following section, we present application of the cali-brated mobile geolocation-based public transit travel pat-terns model.
5. FIRST AND LAST MILE
5.1 MotivationUsing the results of the trajectory analytics, we analyze
the spatial distribution of the initial (first mile) and final(last mile) segment of user trajectories before and after com-pleting a probable train journey. The first and last mile are

Top ODs Matching betweencellular and farecard
100 40500 2251000 5262000 1185
Table 4: Top ODs matching: qualitative metric.
key quantities for public transit planners, since (1) a signif-icant part of the trip travel-time can be associated with thefirst and last mile travel-time, and hence improvements tofirst or last-mile segments can have a large impact to publictransport quality of serice, and (2) there is currently verylittle data about these trip segments. In this section, wepresent our results for the spatial distribution of first andlast mile segments as well as for the average first and lastmile travel distances.
5.2 Residential vs shopping stationsThe distribution of first mile locations of passengers board-
ing at Tampines MRT, a highly residential area, as estimatedfrom trajectory analytics applied to geolocation data, is pre-sented as a heatmap in Figure 4. Using the same visualiza-
Figure 4: First mile origin points at residential sta-tion: Tampines MRT (represented as a circle on the map).
tion format, we present in Figure 5 the estimated distribu-tion of first mile locations of passengers boarding at BugisMRT, a popular commercial and shopping area. One canobserve that the origin for the shopping area are qualita-tively much closer to the train station. This is confirmedby the actual distances to the station for the first mile seg-ments, presented in Table 5. Such insights can be derived
Distance (kms) Percentage Trips Percentage TripsTampines MRT Bugis MRT
0-1 39 751-2 51 242-3 7 1
Table 5: First mile length: for residential (Tampines) andshopping (Bugis) stations.
in quasi real-time via fusion of mobile geolocation data withfarecard, and thus support frequent analyses, relevant for afast-paced nation such as Singapore.
Figure 5: First mile origin points at residential sta-tion: Bugis MRT (represented as a circle on the map).
5.3 Analysis of first and last mileThe insights presented in the previous section for two sta-
tions can be reproduced for the entire train network. InFigure 6, we illustrate a histogram of % of commuters ateach train station for which the trip origin is located within1 km of the station. The left on the histogram correspondsto stations with relatively low accessibility (% of commutersstarting their trip within 1 km of the station is low), whereasthe right hand side of the histogram corresponds to sta-tions with higher proportion of commuters starting their tripwithin 1 km of the station. Figure 7, presents the analogoushistogram for the last-mile of the trip. The breakdown
Figure 6: Distribution of first mile shorter than 1 km:across 42 MRT stations.
Figure 7: Distribution of last mile shorter than 1 km:across 42 MRT stations.
of the first mile histogram over the the 42 train stations is
provided in Table 6. In Figure 8, we illustrate the impact
Station Percenttripswithin1 km
Station Percenttripswithin1 km
Admiralty 84 Ang Mo Kio 33Redhill 78 Orchard 30Bugis 74 Bishan 30Bukit Gom-bak
71 Bukit Batok 27
Lavender 71 City Hall 24Yio Chu Kang 66 Pasir Ris 23Commonwealth 63 Buona Vista 23TanjongPagar
59 Jurong East 23
Aljuned 56 Yishun 21Novena 55 Marina Bay 19Dhoby Ghaut 53 Clementi 18Somerset 50 Tampines 17Braddell 42 Lakeside 15Boon Lay 40 Toa Payoh 13Eunos 40 Bedok 12Queenstown 40 Paya Lebar 11Kembangan 39 Newton 11Kallang 38 Chinese Gar-
den7
Table 6: Percentage of First Mile trips within 1 km ofMRT station.
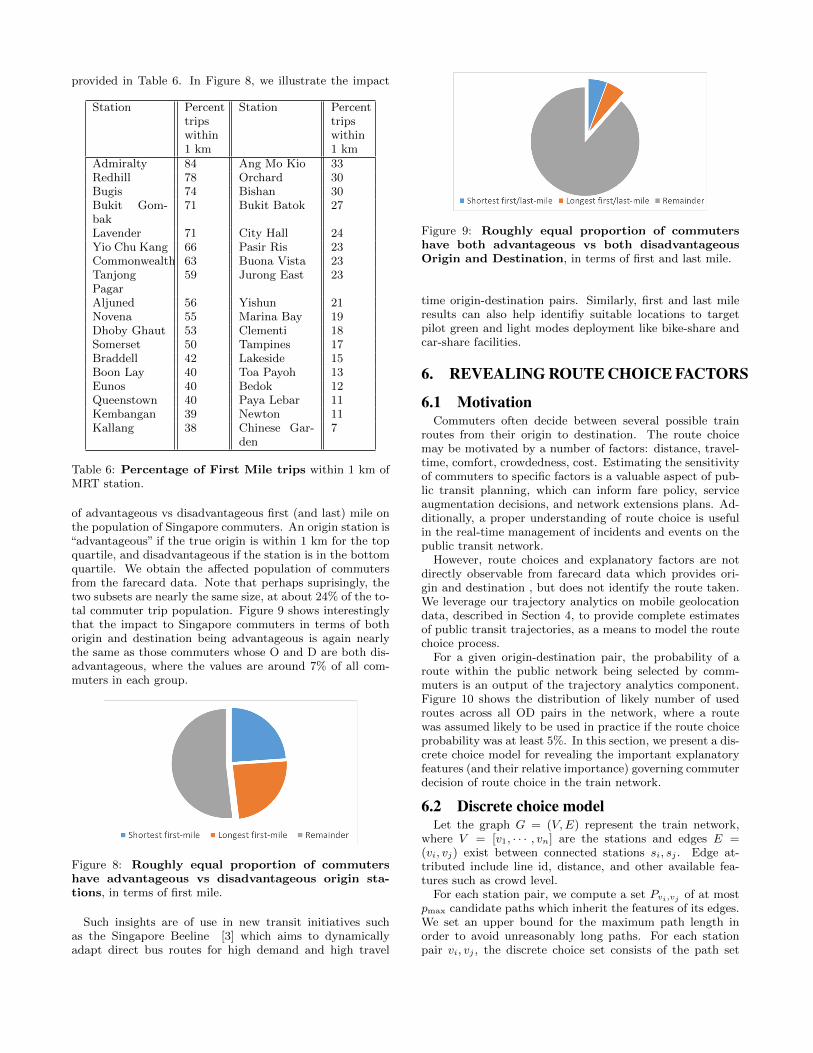
of advantageous vs disadvantageous first (and last) mile onthe population of Singapore commuters. An origin station is“advantageous” if the true origin is within 1 km for the topquartile, and disadvantageous if the station is in the bottomquartile. We obtain the affected population of commutersfrom the farecard data. Note that perhaps suprisingly, thetwo subsets are nearly the same size, at about 24% of the to-tal commuter trip population. Figure 9 shows interestinglythat the impact to Singapore commuters in terms of bothorigin and destination being advantageous is again nearlythe same as those commuters whose O and D are both dis-advantageous, where the values are around 7% of all com-muters in each group.
Figure 8: Roughly equal proportion of commutershave advantageous vs disadvantageous origin sta-tions, in terms of first mile.
Such insights are of use in new transit initiatives suchas the Singapore Beeline [3] which aims to dynamicallyadapt direct bus routes for high demand and high travel
Figure 9: Roughly equal proportion of commutershave both advantageous vs both disadvantageousOrigin and Destination, in terms of first and last mile.
time origin-destination pairs. Similarly, first and last mileresults can also help identifiy suitable locations to targetpilot green and light modes deployment like bike-share andcar-share facilities.
6. REVEALING ROUTE CHOICE FACTORS
6.1 MotivationCommuters often decide between several possible train
routes from their origin to destination. The route choicemay be motivated by a number of factors: distance, travel-time, comfort, crowdedness, cost. Estimating the sensitivityof commuters to specific factors is a valuable aspect of pub-lic transit planning, which can inform fare policy, serviceaugmentation decisions, and network extensions plans. Ad-ditionally, a proper understanding of route choice is usefulin the real-time management of incidents and events on thepublic transit network.
However, route choices and explanatory factors are notdirectly observable from farecard data which provides ori-gin and destination , but does not identify the route taken.We leverage our trajectory analytics on mobile geolocationdata, described in Section 4, to provide complete estimatesof public transit trajectories, as a means to model the routechoice process.
For a given origin-destination pair, the probability of aroute within the public network being selected by comm-muters is an output of the trajectory analytics component.Figure 10 shows the distribution of likely number of usedroutes across all OD pairs in the network, where a routewas assumed likely to be used in practice if the route choiceprobability was at least 5%. In this section, we present a dis-crete choice model for revealing the important explanatoryfeatures (and their relative importance) governing commuterdecision of route choice in the train network.
6.2 Discrete choice modelLet the graph G = (V,E) represent the train network,
where V = [v1, · · · , vn] are the stations and edges E =(vi, vj) exist between connected stations si, sj . Edge at-tributed include line id, distance, and other available fea-tures such as crowd level.
For each station pair, we compute a set Pvi,vj of at mostpmax candidate paths which inherit the features of its edges.We set an upper bound for the maximum path length inorder to avoid unreasonably long paths. For each stationpair vi, vj , the discrete choice set consists of the path set

Figure 10: Likely number of used routes across allorigin-destination pairs, as estimated from mobile geoloca-tion data.
Pvi,vj . The utility Ui,j,k of using path k is a function of thepath features and the origin-destination pair. The probabil-ity of choosing path k reads Pijk = Pr(Uijk > Uijl,l 6=k) =eUijk/
∑l=1...pmax
eUijl .
We use the following network features: (1) path length,(2) number of interchanges, (3) mean frequency of the trains,and (4) number of crowded interchanges, the latter two fea-tures which are estimated from the farecard data. Specif-ically, an interchange is labelled crowded for a candidatepath if the number of commuters for the intended station-line combination exceeds a threshold at that time of the day.
For consistency, for each OD pair, we normalized the fea-tures to vary in the interval [0, 1]. The model parametersare the weights associated with each feature in the utilityfunction. The model is calibrated using the number of pas-sengers for a given origin-destination pair from the farecarddata, while the candidate paths and the proportion of com-muters using a candidate path are provided by the trajectoryanalytics described in Section 4.
Given the expected distinct route choices at different times,we calibrate two distinct models for (1) morning peak on anon-holiday week day, (2) off-peak on a non-holiday weekday. The morning peak model uses 13000 data points, andwe obtain a R2 = 0.56. The off-peak model uses 28000 datapoints, and we obtain a R2 = 0.55.
We generate confidence intervals via bootstrapping of themodel coefficients using a normal distribution with meanequal to the coefficient value and standard deviation equalto the standard error of the coefficient estimation. We boot-strap 1000 model executions for the same test dataset andoutput a distribution of probabilities for every route andorigin-destination pair. Figure 11 shows an example of abootstrap simulation for a given route with choice probabil-ity 0.26.
6.3 Example: route choice setWe illustrate one set of results from the route choice model
on high occupancy routes from Ang Mo Kio, a popular res-idential station to Tanjong Pagar, a popular office locationin the Central Business District of Singapore. Figure 12 de-picts the route 1, with an estimated 52% of the commuters;Figure 13 shows route 2 with an estimated 24% of the com-muters having one extra line change. Figure 14 shows route3, with an estimated 15 % of the commuters and two extraline changes.
Figure 11: Bootstrap simulation: for a given route.
Figure 12: Route 1: with 52 percent Ang Mo Kio to Tan-jong Pagar
6.4 Explanatory featuresThe model feature coefficients and standard errors are
listed in Table 7. The results illustrate that path distance
Feature Peak Off-peakcoefficient coefficient
Intercept 2.91 3.00# Interchanges -1.22 -2.08Distance -3.08 -3.07Train frequency -0.64 -0.61Crowd level -0.59 -0.26
Table 7: Feature importance: for both the peak and off-peak models.
remains the most important explanatory factor of the routechoice, both during the morning peak and off-peak. Onecan also observe the relative increase of the sensitivity tocrowd level during peak times, indicating the preference tolow crowd level.
The route choice model can be further improved by con-sidering specific commuter types, regular commuters whoknow the network and would evaluate more advanced fea-tures (such as interchange distance, queues at train doors,

Figure 13: Route 2: with 24 percent Ang Mo Kio toTanjong Pagar
etc.) and non-regular commuters such as tourists with ad-ditional activity-specific considerations (hotspots on route,station attractivity, etc.)
7. CONCLUSIONSIn this work, we used mobile geolocation data and pub-
lic transit data for generating complete insights on publictransit travel patterns. We applied trajectory analytics onmobile geolocation data and showed that the limitations ofmobile geolocation data can be addressed by leveraging thecomplementary strengths of public transit data via appropri-ate calibration and learning. We have shown that combin-ing these data sources helps provide an accurate and com-plete picture of public transit trips, including first and lastmile, and we illustrated the applicability of these insights fortwo typical transport applications. Our conclusions on theestimation of first and last mile travel patterns show thatthe output of our system can be used for the design of on-demand public transit feeders and main public transit lines.We have also shown that parameters that are critical foroptimal public transit planning, such as explanatory covari-ates for route choice, can be estimated from the adequatecombination of mobile geolocation and public transit datavia advanced learning analytics.
8. ACKNOWLEDGMENTSWe are grateful to the Singapore Land Transport Author-
ity for sharing the anonymized farecard data and to StarHubfor providing the anonymized mobile geolocation data usedin this work. We acknowledge the support of the SingaporeEconomic Development Board.
9. REFERENCES[1] Analytic superfood.
http://jeffjonas.typepad.com/jeff jonas/2009/08/your-movements-speak-for-themselves-spacetime\\-travel-data-is-analytic-superfood.html.
[2] Apache hive. https://hive.apache.org.
Figure 14: Route 3: with 15 percent Ang Mo Kio toTanjong Pagar
[3] Beeline. https://www.beeline.sg/.
[4] Elastic search.https://www.elastic.co/products/elasticsearch.
[5] R. Becker, R. Caceres, K. Hanson, S. Isaacman, J. M.Loh, M. Martonosi, J. Rowland, S. Urbanek,A. Varshavsky, and C. Volinsky. Human mobilitycharacterization from cellular network data.Communications of the ACM, 56(1):74–82, 2013.
[6] F. Calabrese, M. Colonna, P. Lovisolo, D. Parata, andC. Ratti. Real-time urban monitoring using cellphones: A case study in rome. IntelligentTransportation Systems, IEEE Transactions on,12(1):141–151, 2011.
[7] N. Eagle and A. S. Pentland. Eigenbehaviors:Identifying structure in routine. Behavioral Ecologyand Sociobiology, 63(7):1057–1066, 2009.
[8] F. Girardin, F. Calabrese, F. D. Fiore, C. Ratti, andJ. Blat. Digital footprinting: Uncovering tourists withuser-generated content. Pervasive Computing, IEEE,7(4):36–43, 2008.
[9] A. Guttman. R-trees: A dynamic index structure forspatial searching. SIGMOD Rec., 14(2):47–57, June1984.
[10] S. Hasan, C. M. Schneider, S. V. Ukkusuri, and M. C.Gonzalez. Spatiotemporal patterns of urban humanmobility. Journal of Statistical Physics,151(1-2):304–318, 2013.
[11] S. Hasan, X. Zhan, and S. V. Ukkusuri.Understanding urban human activity and mobilitypatterns using large-scale location-based data fromonline social media. In Proceedings of the 2nd ACMSIGKDD international workshop on urban computing,page 6. ACM, 2013.
[12] T. Holleczek, S. Yin, Y. Jin, S. Antonatos, H. L. Goh,S. Low, A. Shi-Nash, et al. Traffic measurement androute recommendation system for mass rapid transit(mrt). In Proceedings of the 21th ACM SIGKDDInternational Conference on Knowledge Discovery andData Mining, pages 1859–1868. ACM, 2015.

[13] T. Holleczek, L. Yu, J. K. Lee, O. Senn, C. Ratti, andP. Jaillet. Detecting weak public transport connectionsfrom cellphone and public transport data. InProceedings of the 2014 International Conference onBig Data Science and Computing, page 9. ACM, 2014.
[14] T. Hunter, P. Abbeel, and A. Bayen. The pathinference filter: model-based low-latency mapmatching of probe vehicle data. IntelligentTransportation Systems, IEEE Transactions on,15(2):507–529, 2014.
[15] J. G. Jin, K. M. Teo, and L. Sun. Disruption responseplanning for an urban mass rapid transit network. Intransportation research board 92nd annual meeting,Washington DC, 2013.
[16] F. Kling and A. Pozdnoukhov. When a city tells astory: urban topic analysis. In Proceedings of the 20thInternational Conference on Advances in GeographicInformation Systems, pages 482–485. ACM, 2012.
[17] V. Kolar, S. Ranu, A. P. Subramainan,Y. Shrinivasan, A. Telang, R. Kokku, andS. Raghavan. People in motion: Spatio-temporalanalytics on call detail records. In CommunicationSystems and Networks (COMSNETS), 2014 SixthInternational Conference on, pages 1–4. IEEE, 2014.
[18] A. Krause, E. Horvitz, A. Kansal, and F. Zhao.Toward community sensing. In Proceedings of the 7thinternational conference on Information processing insensor networks, pages 481–492. IEEE ComputerSociety, 2008.
[19] R. K.-W. Lee, T. S. Kam, et al. Time-series datamining in transportation: A case study on singaporepublic train commuter travel patterns. InternationalJournal of Engineering and Technology, 6(5):431, 2014.
[20] T. Moller and B. Trumbore. Fast, minimum storageray/triangle intersection. In ACM SIGGRAPH 2005Courses, SIGGRAPH ’05, New York, NY, USA, 2005.ACM.
[21] P. Newson and J. Krumm. Hidden markov mapmatching through noise and sparseness. In Proceedingsof the 17th ACM SIGSPATIAL InternationalConference on Advances in Geographic InformationSystems, GIS ’09, pages 336–343, New York, NY,USA, 2009. ACM.
[22] N. B. Othman, E. F. Legara, V. Selvam, andC. Monterola. Simulating congestion dynamics of trainrapid transit using smart card data. ProcediaComputer Science, 29:1610–1620, 2014.
[23] A. D. Patire, M. Wright, B. Prodhomme, and A. M.Bayen. How much gps data do we need?Transportation Research Part C: EmergingTechnologies, 2015.
[24] F. C. Pereira, F. Rodrigues, and M. Ben-Akiva. Usingdata from the web to predict public transport arrivalsunder special events scenarios. Journal of IntelligentTransportation Systems, (ahead-of-print):1–16, 2014.
[25] A. Pozdnoukhov and C. Kaiser. Space-time dynamicsof topics in streaming text. In Proceedings of the 3rdACM SIGSPATIAL international workshop onlocation-based social networks, pages 1–8. ACM, 2011.
[26] J. Reades, F. Calabrese, A. Sevtsuk, and C. Ratti.Cellular census: Explorations in urban data collection.Pervasive Computing, IEEE, 6(3):30–38, 2007.
[27] A. Sadilek and J. Krumm. Far out: Predictinglong-term human mobility. In AAAI, 2012.
[28] C. Song, Z. Qu, N. Blumm, and A.-L. Barabasi.Limits of predictability in human mobility. Science,327(5968):1018–1021, 2010.
[29] X. Tang, S. Blandin, and L. Wynter. A fastdecomposition approach for transportation networkoptimization. In World Congress, volume 19, pages5109–5114, 2014.
[30] A. Vaccari, L. Liu, A. Biderman, C. Ratti, F. Pereira,J. Oliveirinha, and A. Gerber. A holistic framework forthe study of urban traces and the profiling of urbanprocesses and dynamics. In Intelligent TransportationSystems, 2009. ITSC’09. 12th International IEEEConference on, pages 1–6. IEEE, 2009.
[31] M. Vlachos, G. Kollios, and D. Gunopulos.Discovering similar multidimensional trajectories. InData Engineering, 2002. Proceedings. 18thInternational Conference on, pages 673–684, 2002.
[32] D. B. Work, O.-P. Tossavainen, S. Blandin, A. M.Bayen, T. Iwuchukwu, and K. Tracton. An ensemblekalman filtering approach to highway trafficestimation using gps enabled mobile devices. InDecision and Control, 2008. CDC 2008. 47th IEEEConference on, pages 5062–5068. IEEE, 2008.
[33] Y. Zheng. Trajectory data mining: An overview. ACMTransaction on Intelligent Systems and Technology,September 2015.