simulation of three-dimensional pore-pressure …...zor according to the mining schedule are...
TRANSCRIPT
ARMA 12-452
Simulation of Three-Dimensional Pore-Pressure Distribution for Slope-Stability Analysis
Liu1, H. Itasca Denver, Inc. 1, Lakewood, Colorado, USA
Durán del Valle2, F. Division Codelco-Chuquicamata 2, Chile Xiang3, J. and Şener Kaya4, B. Itasca Denver Inc. 3,4, Lakewood, Colorado, USA
Copyright 2012 ARMA, American Rock Mechanics Association
This paper was prepared for presentation at the 46th US Rock Mechanics / Geomechanics Symposium held in Chicago, IL, USA, 24-27 June 2012.
This paper was selected for presentation at the symposium by an ARMA Technical Program Committee based on a technical and critical review of the paper by a minimum of two technical reviewers. The material, as presented, does not necessarily reflect any position of ARMA, its officers, or members. Electronic reproduction, distribution, or storage of any part of this paper for commercial purposes without the written consent of ARMA is prohibited. Permission to reproduce in print is restricted to an abstract of not more than 300 words; illustrations may not be copied. The abstract must contain conspicuous acknowledgement of where and by whom the paper was presented.
1. INTRODUCTION
Chuquicamata is a large open pit mine located 15 km north of the city of Calama in the Atacama Desert, Chile. It is 250 km northeast of Antofagasta, and 1,200 km north of Santiago. The depth of the current pit is approximately 900 m. The open pit is scheduled to continue to operate until 2020. Because of the low-permeability nature of the rock, there is no large-scale active dewatering at the site. Instead, an extensive drainage system was implemented at the site to reduce pore water pressures in the pit wall.
A three-dimensional groundwater flow model (3D flow model) was constructed to simulate the groundwater conditions at the mine. The primary purpose of the flow model was to predict pore-pressure distribution as input to the on-going geomechanical model.
The 3D flow model was specifically designed to simulate the following unique features of open-pit mining that could not be incorporated within a 2D flow model:
(i) Time varying pit topography: During open pit mining, the pit topography changes over time. The surface of the pit wall and floor has zero pore pressure and acts as groundwater drainage points; therefore, simulations of continuously changing topography are critical in determining the change of pore pressure over time. For lower-permeability material, simulating the time varying topography is particularly important in understanding the temporal changes in pore pressure because the dissipation of pore pressure is slow and deviates from the hydrostatic pore-pressure distribution.
ABSTRACT: A 3D groundwater flow model was constructed using MINEDW [1] to simulate pore pressure at the Chuquicamata open pit mine slope in Chile. Three main factors required the implementation of a 3D model for the prediction of pore pressures: (1) discrete zones of recharge in the gravel zone lead to the non-uniform flow field; (2) the low-permeability west fault and shear zones maintain the non-hydrostatic pore-pressure distribution with depth during mining; and (3) the drainage gallery causes localized depressurization. In addition, a zone of relaxation (ZOR) was observed at the site. Simulations of the development of the ZOR according to the mining schedule are important in the prediction of pore-pressure distribution within the slope.
The model was calibrated against measured water levels, pore pressures, drains, and seepage rates. The calibrated model was then used to simulate and predict pore-pressure distribution in the pit walls for different time periods. Specifically, the model was able to capture the non-hydrostatic, transient nature of the pore pressures with depth in the granodiorite west of the shear zone, in the shear zone, and along the west fault. The model also simulated the ZOR for the first 150 m below the pit bench with enhanced hydraulic conductivity values according to the excavation schedule. Simulated transient 3D pore-pressure distribution provides a more realistic input to 3DEC slope-stability analyses.
(ii) Development of the zone of relaxation (ZOR): After excavation, a ZOR layer generally develops to a certain depth below the pit surface. The ZOR develops according to the excavation schedule and is generally more permeable than the in situ rock, which could affect the pore-pressure distribution along the pit wall.
(iii) Dewatering and drainage system: Both spatial and temporal impacts of dewatering and the drainage system on pore-pressure distribution can only be simulated in a 3D flow model due to the limitations of a 2D flow model.
The 3D flow model constructed for this investigation utilizes the numerical code MINEDW [1] developed by Itasca Denver, Inc., which solves 3D groundwater flow problems with an unconfined (or phreatic) surface using the finite-element method. MINEDW has several attributes that were specially developed to address conditions often encountered in mine dewatering. The modeling code has been verified by Sandia National Laboratory [2] and has been used on numerous mining hydrogeologic projects throughout the world.
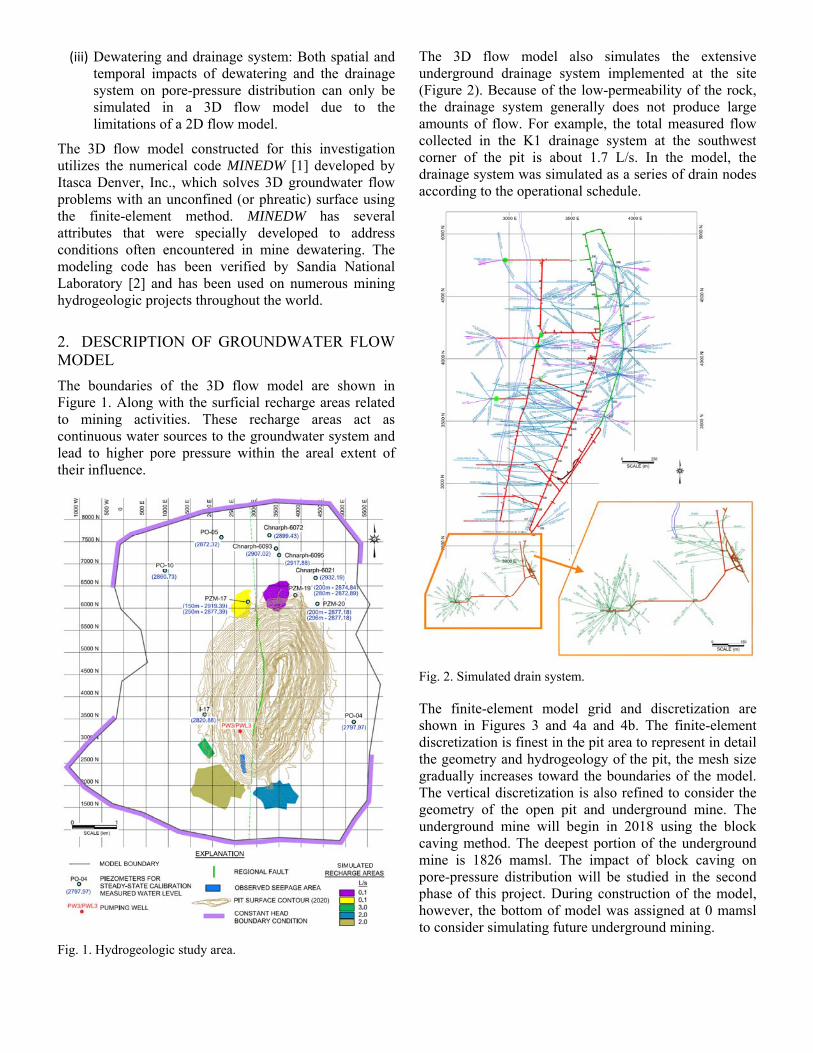
The 3D flow model also simulates the extensive underground drainage system implemented at the site (Figure 2). Because of the low-permeability of the rock, the drainage system generally does not produce large amounts of flow. For example, the total measured flow collected in the K1 drainage system at the southwest corner of the pit is about 1.7 L/s. In the model, the drainage system was simulated as a series of drain nodes according to the operational schedule.
2. DESCRIPTION OF GROUNDWATER FLOW MODEL
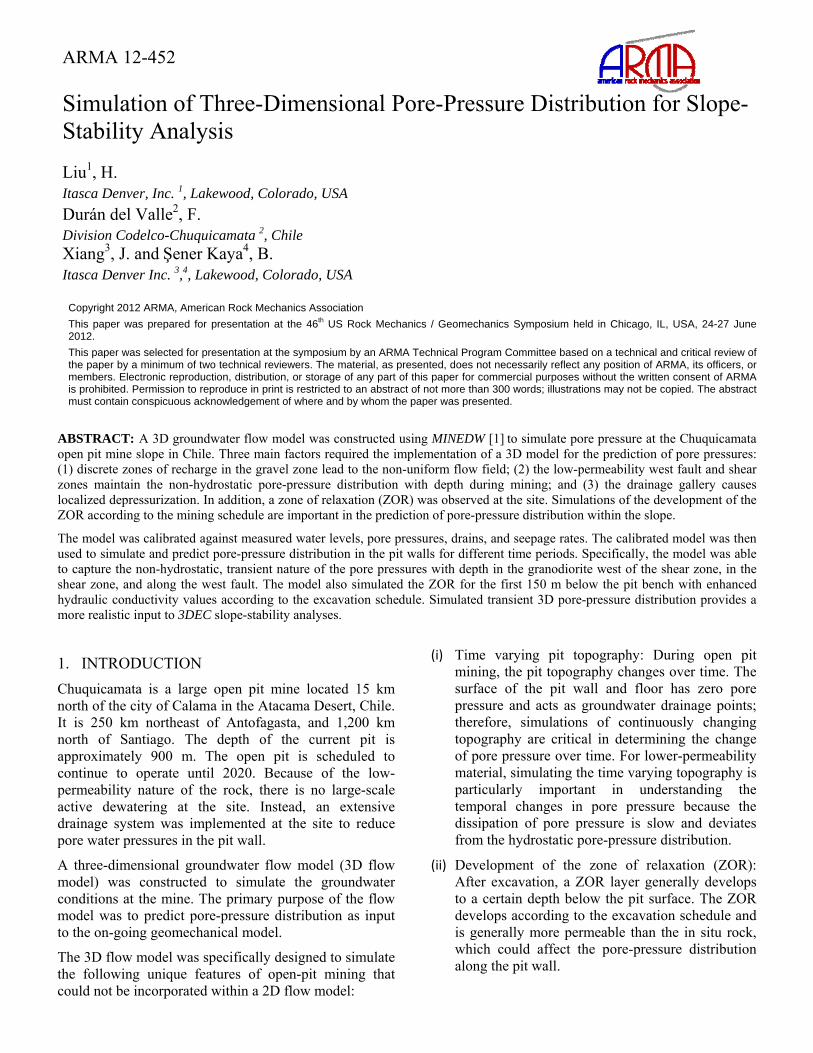
The boundaries of the 3D flow model are shown in Figure 1. Along with the surficial recharge areas related to mining activities. These recharge areas act as continuous water sources to the groundwater system and lead to higher pore pressure within the areal extent of their influence.
Fig. 2. Simulated drain system.
The finite-element model grid and discretization are shown in Figures 3 and 4a and 4b. The finite-element discretization is finest in the pit area to represent in detail the geometry and hydrogeology of the pit, the mesh size gradually increases toward the boundaries of the model. The vertical discretization is also refined to consider the geometry of the open pit and underground mine. The underground mine will begin in 2018 using the block caving method. The deepest portion of the underground mine is 1826 mamsl. The impact of block caving on pore-pressure distribution will be studied in the second phase of this project. During construction of the model, however, the bottom of model was assigned at 0 mamsl to consider simulating future underground mining.
Fig. 1. Hydrogeologic study area.

Fig. 3. Plan view of model grid (model layer 1) and geology before mining.
Fig. 4. Cross section A-A′ before mining and in August 2011.
The major geologic units simulated in the flow model were based on the block model of the mine area and previous investigations at the site by Water Management Consultants (WMC) [3]. The simulated major geologic units are shown in Figures 3 and 4 and are described as the following:
(i) Fortuna granodiorite in the west wall (GDF): horizontal hydraulic conductivity (Kh) is approximately 1.0 x 10⁻³ m/day
(ii) weak “moderate” shear zone west of the West fault (ZCM): this shear zone is considered to be a low-permeability unit with Kh of approximately 6.0 x 10⁻⁵ m/day
(iii) “intense” shear zone west of the West fault (ZCI): this unit is considered to be a low-permeability unit with Kh approximately 1.0 x 10⁻⁵ m/day
(iv) West fault (FW): this fault is considered to be the groundwater barrier between the east and west portions of the pit with Kh about 2.4 x 10⁻⁶ m/day
(v) Quartz Sericitic Rock (RQS): this unit contains the ore and has Kh value of approximately 1.5 x 10⁻⁴ m/day
(vi) Elena granodiorite of the east wall (GES): the Kh value of this unit is approximately 1.2 x 10⁻⁴ m/day
(vii) gravel unit in the south end of the model (GRA): this unit is assumed to be permeable with Kh value of 8.6 x 10⁻¹ m/day
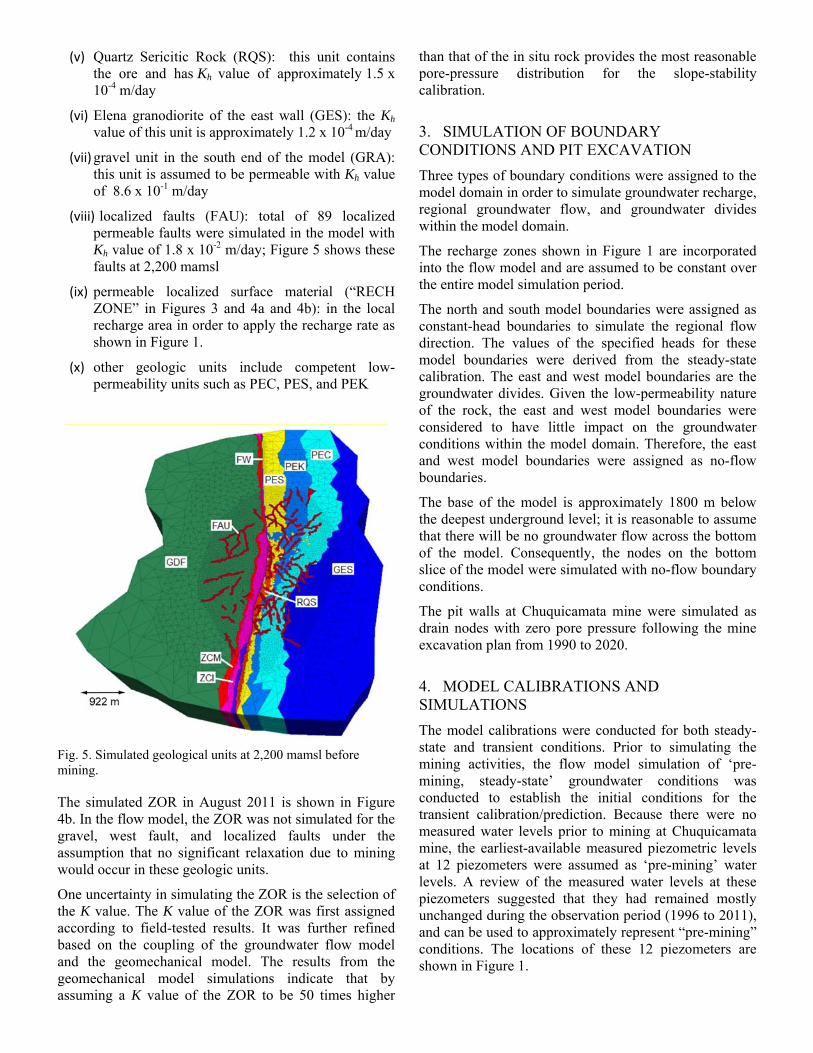
(viii) localized faults (FAU): total of 89 localized permeable faults were simulated in the model with Kh value of 1.8 x 10⁻² m/day; Figure 5 shows these faults at 2,200 mamsl
(ix) permeable localized surface material (“RECH ZONE” in Figures 3 and 4a and 4b): in the local recharge area in order to apply the recharge rate as shown in Figure 1.
(x) other geologic units include competent low- permeability units such as PEC, PES, and PEK
Fig. 5. Simulated geological units at 2,200 mamsl before mining.
The simulated ZOR in August 2011 is shown in Figure 4b. In the flow model, the ZOR was not simulated for the gravel, west fault, and localized faults under the assumption that no significant relaxation due to mining would occur in these geologic units.
One uncertainty in simulating the ZOR is the selection of the K value. The K value of the ZOR was first assigned according to field-tested results. It was further refined based on the coupling of the groundwater flow model and the geomechanical model. The results from the geomechanical model simulations indicate that by assuming a K value of the ZOR to be 50 times higher
than that of the in situ rock provides the most reasonable pore-pressure distribution for the slope-stability calibration.
3. SIMULATION OF BOUNDARY CONDITIONS AND PIT EXCAVATION
Three types of boundary conditions were assigned to the model domain in order to simulate groundwater recharge, regional groundwater flow, and groundwater divides within the model domain.
The recharge zones shown in Figure 1 are incorporated into the flow model and are assumed to be constant over the entire model simulation period.
The north and south model boundaries were assigned as constant-head boundaries to simulate the regional flow direction. The values of the specified heads for these model boundaries were derived from the steady-state calibration. The east and west model boundaries are the groundwater divides. Given the low-permeability nature of the rock, the east and west model boundaries were considered to have little impact on the groundwater conditions within the model domain. Therefore, the east and west model boundaries were assigned as no-flow boundaries.
The base of the model is approximately 1800 m below the deepest underground level; it is reasonable to assume that there will be no groundwater flow across the bottom of the model. Consequently, the nodes on the bottom slice of the model were simulated with no-flow boundary conditions.
The pit walls at Chuquicamata mine were simulated as drain nodes with zero pore pressure following the mine excavation plan from 1990 to 2020.
4. MODEL CALIBRATIONS AND SIMULATIONS
The model calibrations were conducted for both steady-state and transient conditions. Prior to simulating the mining activities, the flow model simulation of ‘pre-mining, steady-state’ groundwater conditions was conducted to establish the initial conditions for the transient calibration/prediction. Because there were no measured water levels prior to mining at Chuquicamata mine, the earliest-available measured piezometric levels at 12 piezometers were assumed as ‘pre-mining’ water levels. A review of the measured water levels at these piezometers suggested that they had remained mostly unchanged during the observation period (1996 to 2011), and can be used to approximately represent “pre-mining” conditions. The locations of these 12 piezometers are shown in Figure 1.

Figure 6 shows the simulated water levels under ‘pre-mining, steady-state’ conditions. Contour lines of the simulated ‘pre-mining’ water levels in Figure 6 show that the groundwater flow direction is from north to south. The simulated water-level contours also show that the regional fault acts as a barrier between the west and east wall.
Fig. 6. Contours of simulated water levels under steady-state conditions.
The transient calibration was conducted to achieve a reasonable agreement between the measured piezometric levels from December 1996 to August 2011 with the simulated water levels. A total of 50 single point monitoring wells and multi-level piezometers with 104 monitoring points were used for the transient calibration. Calibrations to the measured flow rate from a selected drainage system and to the measured seepage rate from one selected pit surface area were also conducted.
5. FINDINGS AND CONCLUSIONS
Simulated pore-pressure distributions from the flow model in October 2006 and May 2010 along cross section A-A' are shown in Figure 7. The head distribution along A-A' is shown in Figure 8. Figures 7 and 8 indicate the following:
The pore pressure in the GDF unit immediately west of the regional fault shows a noticeable deviation from the hydrostatic pore-pressure distribution (Figure 7).
An upward groundwater gradient is predicted to occur in the GDF unit immediately west of the regional fault, pit floor, and east wall (Figure 8).
The predicted seepage point is between 2600 and 2700 mamsl, which agrees with the seepage location observed in the south-west corner.
Fig. 7. Simulated pore-pressure distributions in Oct 2006 and May 2010 along cross section A-Aʹ.

Fig. 8. Simulated total head distributions in October 2006 and May 2010 along cross section A-Aʹ.
Figures 9a, 9b, 9c, and 9d show pore-pressure distributions at four different vertical locations (B-Bʹ, C-Cʹ, D-Dʹ, and E-Eʹ, respectively) in the west wall in October 2006 and May 2010. Also shown in the figures is the distribution of the hydrostatic pressure with saturated depth. Comparisons of the pore pressures at different locations and times demonstrate:
Pore pressures outside of the mining excavation area at B-Bʹ do not change over time as shown in Figure 9a. This little impact from mining on the pore pressure at this location is expected due to the low-permeability nature of the GDF unit.
Local drainage has impact on pore pressure. As shown in Figures 9b and 9c, the simulated pressure decreases in the vicinity of the drainage tunnel/gallery at D-Dʹ and E-Eʹ as shown in Figure 7. The areal extent of pore-pressure reduction is limited in the low-permeability rock. A comparison between Figures 9b (C-Cʹ) and 9d (E-Eʹ) shows that, for approximately the same distance, the drainage has a smaller effect on the ZCI than on the GDF unit because the former is less permeable than the latter.
The simulated pore pressures will re-establish to the hydrostatic condition over time. As shown in
Figure 9d (E-Eʹ), after excavation, the pore pressures in 2010 are closer to the hydrostatic pore pressures than in 2006. The time required to reach hydrostatic conditions depends on the permeability of the rock mass.
Figures 9b, 9c, and 9d demonstrate that the extent that the simulated pore pressure deviates from the hydrostatic conditions depends on the permeability of the rock mass. The maximum deviation is observed in the low-permeability ZCI unit. A reduced deviation was observed at the location that is farther away from the ZCI.
Fig. 9a. Simulated distribution of pore pressure with depth at B-Bʹ.
Fig. 9b. Simulated distribution of pore pressure with depth at C-Cʹ.

Fig. 9c. Simulated distribution of pore pressure with depth at D-Dʹ.
Fig. 9d. Simulated distribution of pore pressure with depth at E-Eʹ.
REFERENCES
1. Azrag, E., Ugorets, V.I., and Atkinson, L.C. 1998. Use of a finite element code to model complex mine water problems. In Proceedings of Symposium on Mine Water and Environmental Impacts, International Mine Water Association, Johannesburg, South Africa, 1 September, 31-41.
2. Sandia National Laboratories. 1998. Review and verification of the MINEDW groundwater flow code. Conducted by Sandia National Laboratories for Greystone, Inc. 4 December.
3. Water Management Consultants. 2004. Conceptual hydrogeological model, Chuquicamata pit, Division
Codelco Norte, prepared by Water Management Consultants Limitada, August.