pore pressure and fracture gradientassessment from...
TRANSCRIPT
American Journal of Scientific Research ISSN 2301-2005 Issue 105 March, 2015, pp.47-61 http://www.americanjournalofscientificresearch.com
Pore Pressure and Fracture Gradientassessment from
Well Log Petrophysical Data of Agbada
Formation, South-East Niger-Delta
Rotimi Oluwatosin John
Petroleum Engineering Department
Covenant University, Ota, Nigeria
E-mail: [email protected] Tel: +234(0)8034299349
Adeoye TaiyeOlushola
Geology Department, University of Ilorin
Ologe Oluwatoyin
Department of Chemical and Geological Sciences
Al-Hikmah University, Ilorin, Nigeria
Onuh Charles Yunusa
Petroleum Engineering Department
Covenant University, Ota, Nigeria
Abstract
Changing down-hole conditions observed during hydrocarbon exploration can be
divers. Some desired ones concern oil/gas shows while others may vary from borehole/drilling fluid association and pressure situations. Managing pressure variations and geopressure zones while drilling has been an issue of concern which has yield generic positive results over the years. However pre-pressure zones (i.e. zones above pressure zones), can display characteristics that are worthy of note in view of the underlying rock potential. Pore pressure and fracture pressure has been evaluated using Eaton’s equations amongst others on data for some reservoir of Agbada formation in the petroliferous Niger Delta. This is in view of knowing the potential of this pre-pressured zone with effective porosity and water saturation necessitated by production operations and well re-entry processes. These computations adopted various pressure models and have yielded good result presented as plots. It was observed that depth of rock units is the main indicator of rock shrinkage leading to increase in fracture due to increase in production and hydraulic fracturing. Adequate attention must be paid to the integrity (density) of the explored formation as they become sandwiched with under-compacted argillaceous sediments.
Keyword: drilling, pressure, pre-pressure, fracture, shrinkage, porosity, pore pressure.
1.0 Introduction Safe, economical and efficient production of oil and natural gas reserves requires an adept knowledge of subsurface pressure regimes, patterns and distribution. Accurate prediction of pore-pressure and
Pore Pressure and Fracture Gradientassessment from Well Log Petrophysical Data of Agbada Formation, South-East Niger-Delta 48 fracture gradients within a zone of interest becomes a necessity. Overpressure zones represent major causeof drilling hazards and one of the main challenges in exploration and exploitation of hydrocarbons reserves. Drilling events such as formation fluid kicks, lost circulation, surface blowouts and underground blowouts can be avoided when accurate pore pressure and fracture gradient predictions are in the design process. Suchpressures may occur as shallow as a few hundred meters below the surface or at greater depths in the subsurfaceand can be present in shale/sand sequences and/or carbonate-evaporite sections (Petroconsultants, 1996). It becomes important in some instance, especially where formation integrity is questionable, to include casing program design that will promote efficiency during drilling operation. In Geopressure evaluation, an assumption is to draw equality suggesting that pore pressure us shale units us same as pore-pressure in adjacent sand formation (Aslihan, 2006). Another assumption is that of adopting subsurface pressure indicator as a function of the relationship between effective porosity and effective stress. A demerit of the second assumption is the tendency to ascribe high porosity zones as overpressure zones in the case of both under-compaction and rise in fluid volume (O’Connor and Swarbrick, 2008).All these are based on overpressure determination from well logs.
During drilling, mud weight adjustment is often adopted to manage well and reservoir damage as drilling operation nears Geopressure zones. In deeper waters this is of greater concern because of occurrence of more marine derived sediments and increase in under-compaction due to sediment mobility;i.e. the operating window, between the hydrostatic gradient and the fracture gradient can be very narrow (Bowers, 2002).Geopressuring in hydrocarbon reservoirs may also result from a variety of geologic and tectonic processes (Chilingar, et.al.,2002).Borehole-acoustic detection methods using compressional and shear slowness can identify abnormally pressured zones before they are drilled and can quantify pressure gradients. The aim of this paper is therefore the detection and prediction of possible overpressure zones through the assessment of pre-pressured zones as well as thestudy of how the fractured formation affects water saturation and effective porosity in the study area Niger Delta. Principally in production, post-drilling well re-entry operations may be inevitable in optimally recovering hydrocarbon in different play. The lithological sequences and compaction modes are intrinsic to pressure responses and fracture pressures. Understanding this helps to reduce drilling and work over/re-entry cost, improve safety and assessment of prospect risks. In this particular area, producing hydrocarbon from pay-zones has encountered challenges caused by the integrity of the associated shale formation.
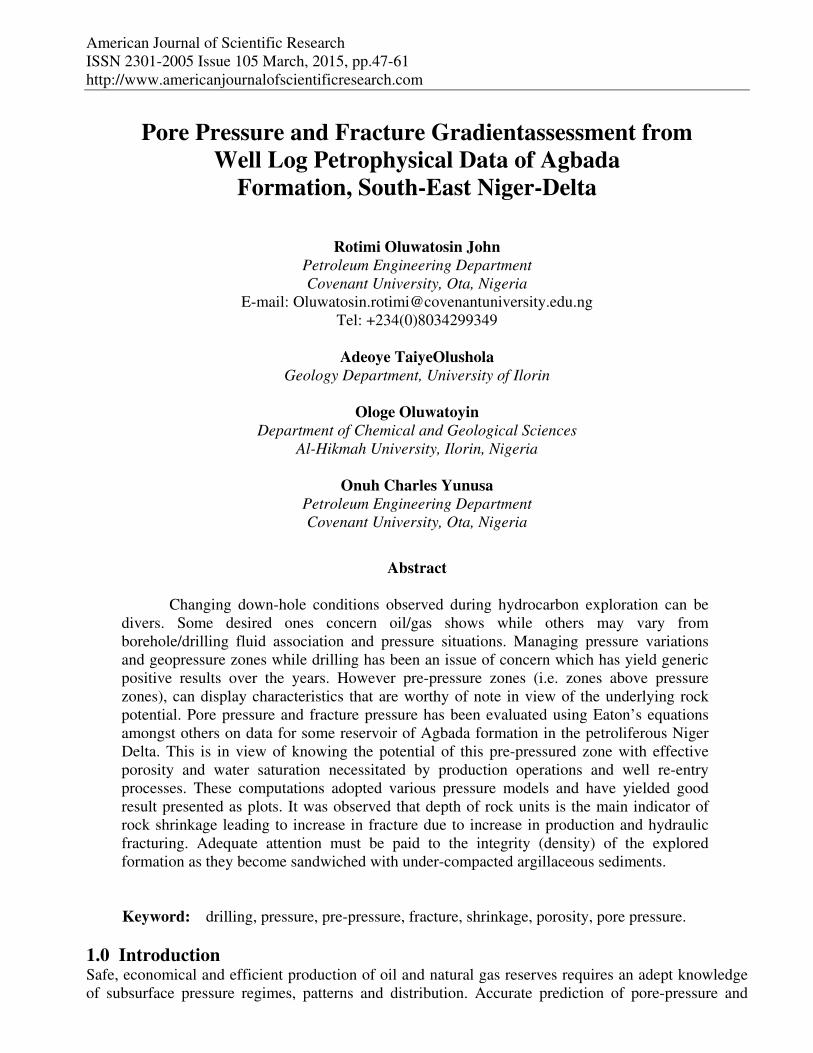
Figure1: Shows the subnormal, normal and abnormal pore pressure in a formation
49 Rotimi Oluwatosin John, Adeoye Taiye Olushola, Ologe Oluwatoyin and Onuh Charles Yunusa
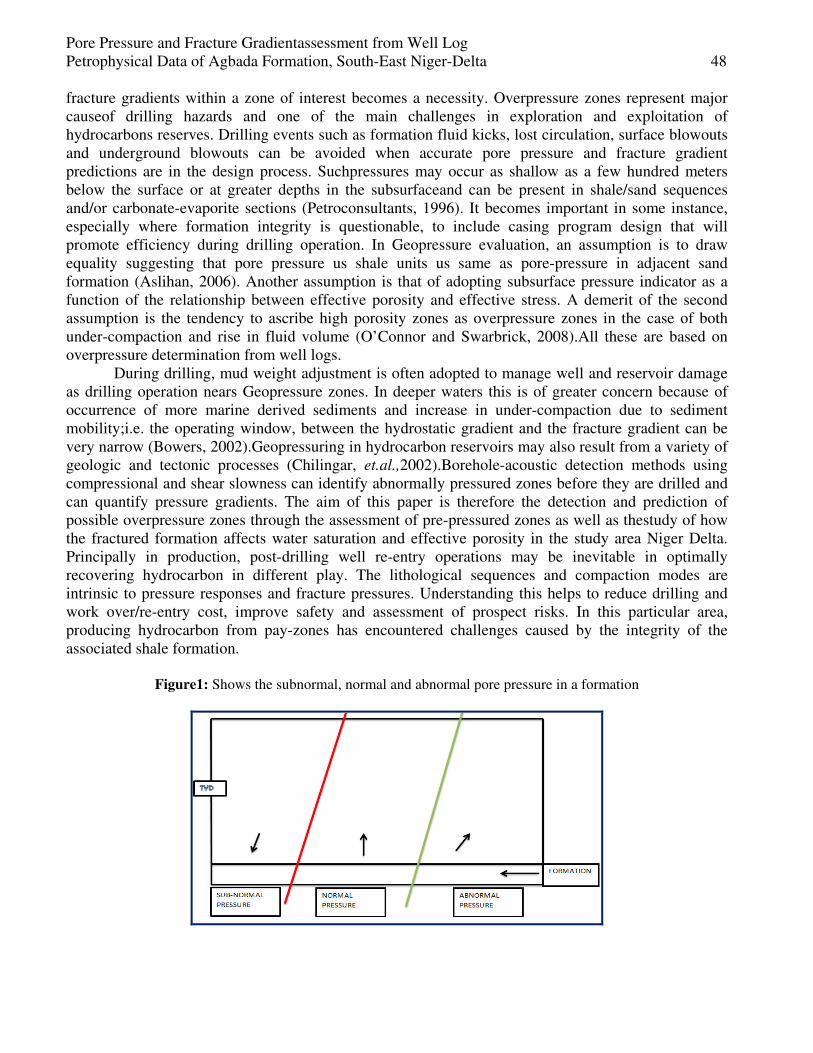
2.0. Location of Study Area and Geological Setting The five (5) wells, used in this study are located in the offshore depobelt of the southern Niger Delta, Nigeria, and lie within the concession of a major operator in Niger Delta. The base map for the location of the study field is shown in Fig. 2.
Figure 2: Location of the wells in the study Area
The Niger Delta basin is located on the continental margin of the Gulf of Guinea in equatorial West Africa and lies between latitudes 40 and 70N and longitudes 30 and 90 E (Whiteman, 1982). It ranks among the worlds’ most prolific petroleum producing Tertiary deltas that together account for about 5% of the worlds’ oil and gas reserves. It is one of the economically prominent sedimentary basins in West Africa and the largest in Africa (Reijers, 1996). Detailed studies on tectonics, stratigraphy, petrophysics and hydrocarbon potential are well documented in the literature (Short and Stauble, 1967;Nton and Adebambo, 2009; Rotimi, 2010) among others. Akata, Agbada and Benin Formations are the three lithostratigraphic units recognized in the subsurface of the Niger Delta. They are essentially diachronous, parallic and unconformably stacked over one anotherfrom the oldest to the youngest (Short and Stauble, 1967; Frankl and Cordy, 1967 and Avbovbo, 1978).
3.0. Materials and Methods Well log data was the main tool used for this study. This made it possible to adopt an indirect approach to pore-pressure evaluation and possible prediction. Log types overpressure indicator used are; density, neutron, sonic, gamma ray and resistivity logs. The general technique in overpressure prediction is to deter-mine the subsurface formation properties and compares it with the normal pressured properties (Hottman and Johnson, 1965; Babu and Sircar, 2011). Dutta (2002) explained in his work that overpressured formations exhibit several of the following properties when compared with a normally pressured section at the same depth (1) higher porosities, (2) lower bulk densities (3) lower effective stress (4) higher temperature (5) lower velocities (6) higher Poisson ratios. Equations used are as follows;
Pore Pressure and Fracture Gradientassessment from Well Log Petrophysical Data of Agbada Formation, South-East Niger-Delta 50
Composite well logs which includes gamma ray, resistivity, density, sonic and neutron logs on five wells were correlated with depth. These wells are on a field with an area inline extent of 148 km2
and with a spacing of 25m between seismic shot lines. Interpretations were made from the well logs, which includes basic log analysis, clay volume, porosity and saturation, thereby resulting into plots of computed variables such as pore pressure, fracture pressure and water saturation.
Conventional log analysis was used to make a quick and basic analysis of the well logs. The basic well logs are gamma ray, porosity and resistivity logs. Plots were made to understand pore pressure and fracture gradient indices variation from the zones and isolate that for shale component presented as silty-clay
3.1 Petrophysical Properties Computation Standard Archies’ equation was adopted to evaluate water saturation interpretation. Porosity (ɸ), water saturation (Sw), flushed zone water saturation (Sxo), matrix density (Rhoma), and wet and dry clay volumes (Vwcl and Vdcl). The number and type of output curves depends on the porosity model chosen and the logic selected. For this study, the primary porosity logic chosen is the neutron-density while adjustment was made depending on the available porosity log. The clay volume interpretation module was used to interactively calculate clay volume curves from multiple clay indicators. The indicators are logs of SP, GR and Resistivity. The reservoir intervals correlated indicates the lateral continuity of quality reservoirs across the zones. Within these intervals correlated, porosity and fracture gradients of the reservoir formations of each wells studied was examined against the density and fluid saturation. This was done to assess the influence of fine grained terrigenous part of the formation in the overall integrity of the hydrocarbon reservoir candidate, and to ascertain at what point with the reservoir fail when producing from it. 3.2 Pressure Prediction Models
Using the following fracture gradient models, pore pressure and pressure gradient was evaluated. Matthews and Kelly method
(1)
(2)
(3) Where, Di can be used to determine Ki, P/D is pressure gradient in psi, σv is vertical stress, Ki is
matrix stress, ρ is pore pressure, s is overburden pressure in psi, D is depth in feet (Jorden and Shirley, 1966; Bowers, 1994; 1995; 2001, Eaton, 1969; 1972; 1975; 1997; Matthews and Kelly, 1967). Hubbertand Willis
(4)
(5)
Ben Eaton
(6)
= Poisson’s ratio The above equations take into considerations the pore pressure gradient. Pore pressure often
increases as the fracture gradient increases. Hubbertand Willis (1972) considers only the variation in pore pressure gradient while Matthews & Kelly considered the changes that occur in rock matrix stress coefficient and matrix stress. Eaton’s equation considers the variation in pore pressure gradient, overburden stress and Poisson’s ratio. It is regarded as the best (accurate) method and adopted for this study.
51 Rotimi Oluwatosin John, Adeoye Taiye Olushola, Ologe Oluwatoyin and Onuh Charles Yunusa
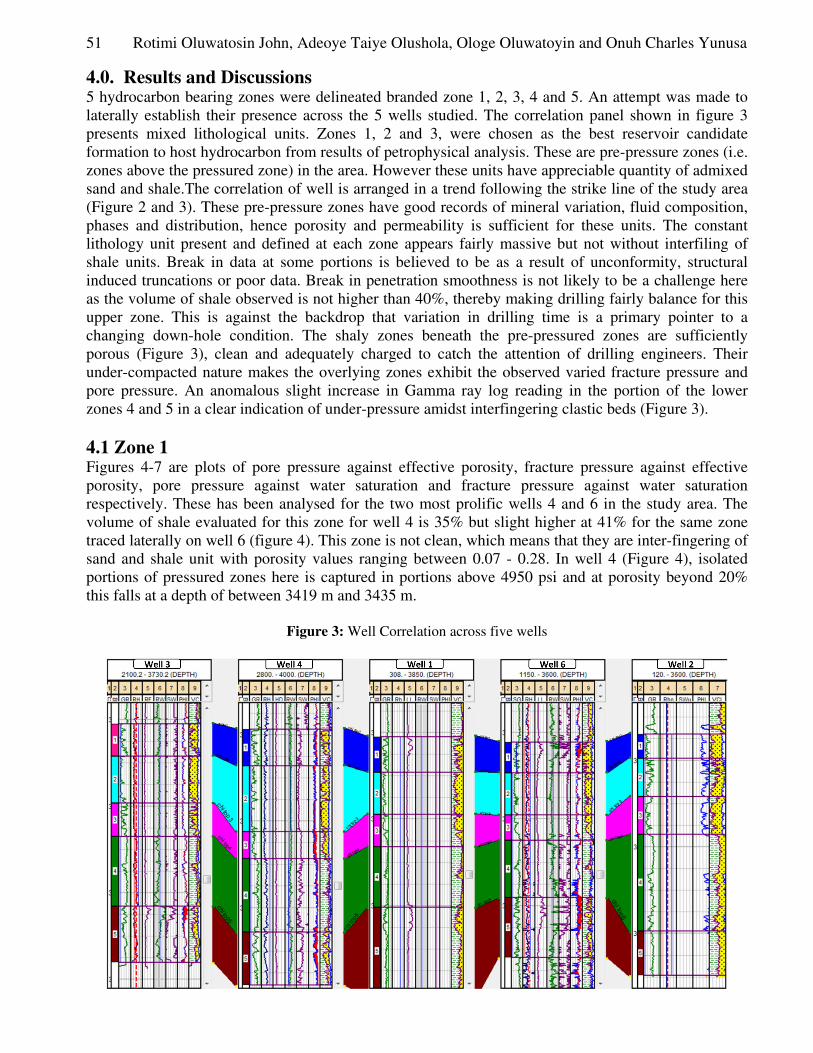
4.0. Results and Discussions 5 hydrocarbon bearing zones were delineated branded zone 1, 2, 3, 4 and 5. An attempt was made to laterally establish their presence across the 5 wells studied. The correlation panel shown in figure 3 presents mixed lithological units. Zones 1, 2 and 3, were chosen as the best reservoir candidate formation to host hydrocarbon from results of petrophysical analysis. These are pre-pressure zones (i.e. zones above the pressured zone) in the area. However these units have appreciable quantity of admixed sand and shale.The correlation of well is arranged in a trend following the strike line of the study area (Figure 2 and 3). These pre-pressure zones have good records of mineral variation, fluid composition, phases and distribution, hence porosity and permeability is sufficient for these units. The constant lithology unit present and defined at each zone appears fairly massive but not without interfiling of shale units. Break in data at some portions is believed to be as a result of unconformity, structural induced truncations or poor data. Break in penetration smoothness is not likely to be a challenge here as the volume of shale observed is not higher than 40%, thereby making drilling fairly balance for this upper zone. This is against the backdrop that variation in drilling time is a primary pointer to a changing down-hole condition. The shaly zones beneath the pre-pressured zones are sufficiently porous (Figure 3), clean and adequately charged to catch the attention of drilling engineers. Their under-compacted nature makes the overlying zones exhibit the observed varied fracture pressure and pore pressure. An anomalous slight increase in Gamma ray log reading in the portion of the lower zones 4 and 5 in a clear indication of under-pressure amidst interfingering clastic beds (Figure 3).
4.1 Zone 1 Figures 4-7 are plots of pore pressure against effective porosity, fracture pressure against effective porosity, pore pressure against water saturation and fracture pressure against water saturation respectively. These has been analysed for the two most prolific wells 4 and 6 in the study area. The volume of shale evaluated for this zone for well 4 is 35% but slight higher at 41% for the same zone traced laterally on well 6 (figure 4). This zone is not clean, which means that they are inter-fingering of sand and shale unit with porosity values ranging between 0.07 - 0.28. In well 4 (Figure 4), isolated portions of pressured zones here is captured in portions above 4950 psi and at porosity beyond 20% this falls at a depth of between 3419 m and 3435 m.
Figure 3: Well Correlation across five wells
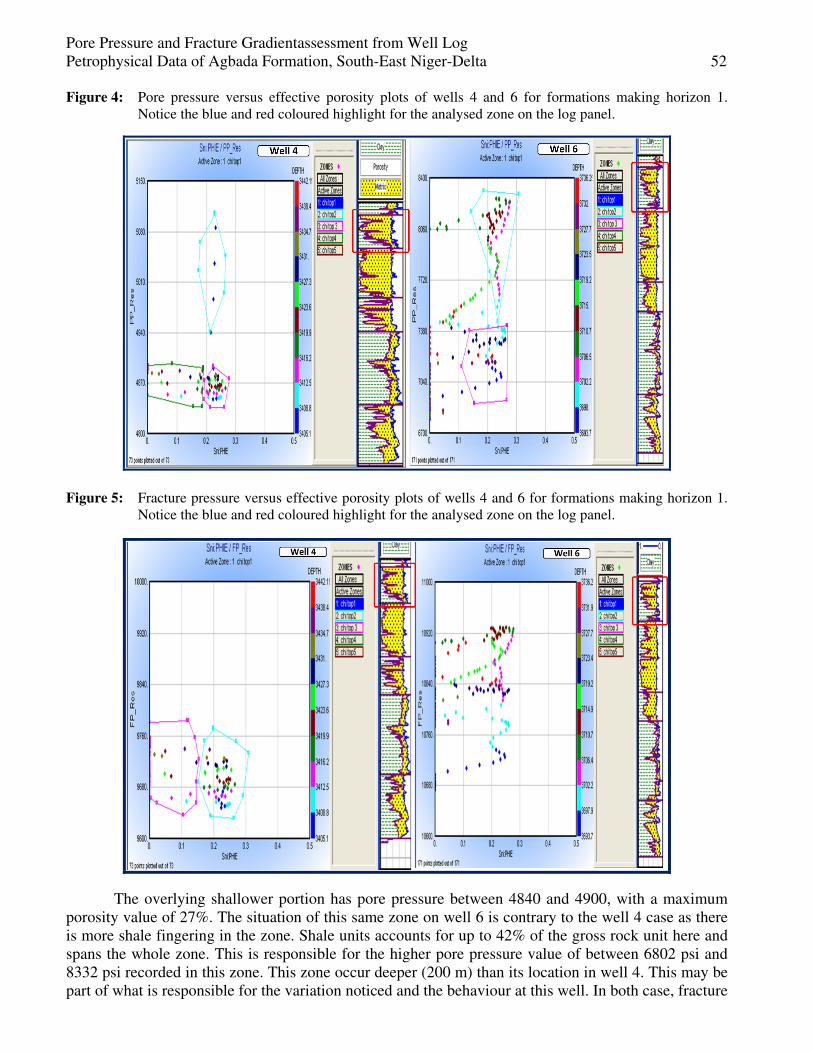
Pore Pressure and Fracture Gradientassessment from Well Log Petrophysical Data of Agbada Formation, South-East Niger-Delta 52 Figure 4: Pore pressure versus effective porosity plots of wells 4 and 6 for formations making horizon 1.
Notice the blue and red coloured highlight for the analysed zone on the log panel.
Figure 5: Fracture pressure versus effective porosity plots of wells 4 and 6 for formations making horizon 1. Notice the blue and red coloured highlight for the analysed zone on the log panel.
The overlying shallower portion has pore pressure between 4840 and 4900, with a maximum porosity value of 27%. The situation of this same zone on well 6 is contrary to the well 4 case as there is more shale fingering in the zone. Shale units accounts for up to 42% of the gross rock unit here and spans the whole zone. This is responsible for the higher pore pressure value of between 6802 psi and 8332 psi recorded in this zone. This zone occur deeper (200 m) than its location in well 4. This may be part of what is responsible for the variation noticed and the behaviour at this well. In both case, fracture
53 Rotimi Oluwatosin John, Adeoye Taiye Olushola, Ologe Oluwatoyin and Onuh Charles Yunusa
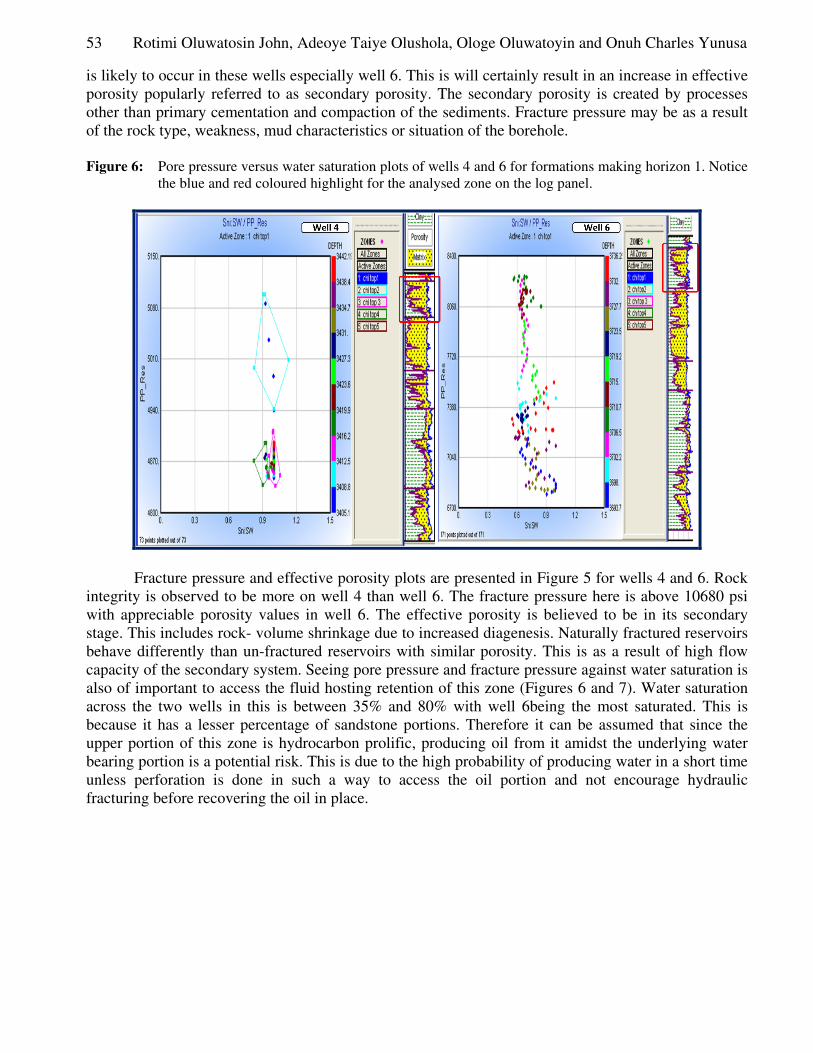
is likely to occur in these wells especially well 6. This is will certainly result in an increase in effective porosity popularly referred to as secondary porosity. The secondary porosity is created by processes other than primary cementation and compaction of the sediments. Fracture pressure may be as a result of the rock type, weakness, mud characteristics or situation of the borehole. Figure 6: Pore pressure versus water saturation plots of wells 4 and 6 for formations making horizon 1. Notice
the blue and red coloured highlight for the analysed zone on the log panel.
Fracture pressure and effective porosity plots are presented in Figure 5 for wells 4 and 6. Rock integrity is observed to be more on well 4 than well 6. The fracture pressure here is above 10680 psi with appreciable porosity values in well 6. The effective porosity is believed to be in its secondary stage. This includes rock- volume shrinkage due to increased diagenesis. Naturally fractured reservoirs behave differently than un-fractured reservoirs with similar porosity. This is as a result of high flow capacity of the secondary system. Seeing pore pressure and fracture pressure against water saturation is also of important to access the fluid hosting retention of this zone (Figures 6 and 7). Water saturation across the two wells in this is between 35% and 80% with well 6being the most saturated. This is because it has a lesser percentage of sandstone portions. Therefore it can be assumed that since the upper portion of this zone is hydrocarbon prolific, producing oil from it amidst the underlying water bearing portion is a potential risk. This is due to the high probability of producing water in a short time unless perforation is done in such a way to access the oil portion and not encourage hydraulic fracturing before recovering the oil in place.
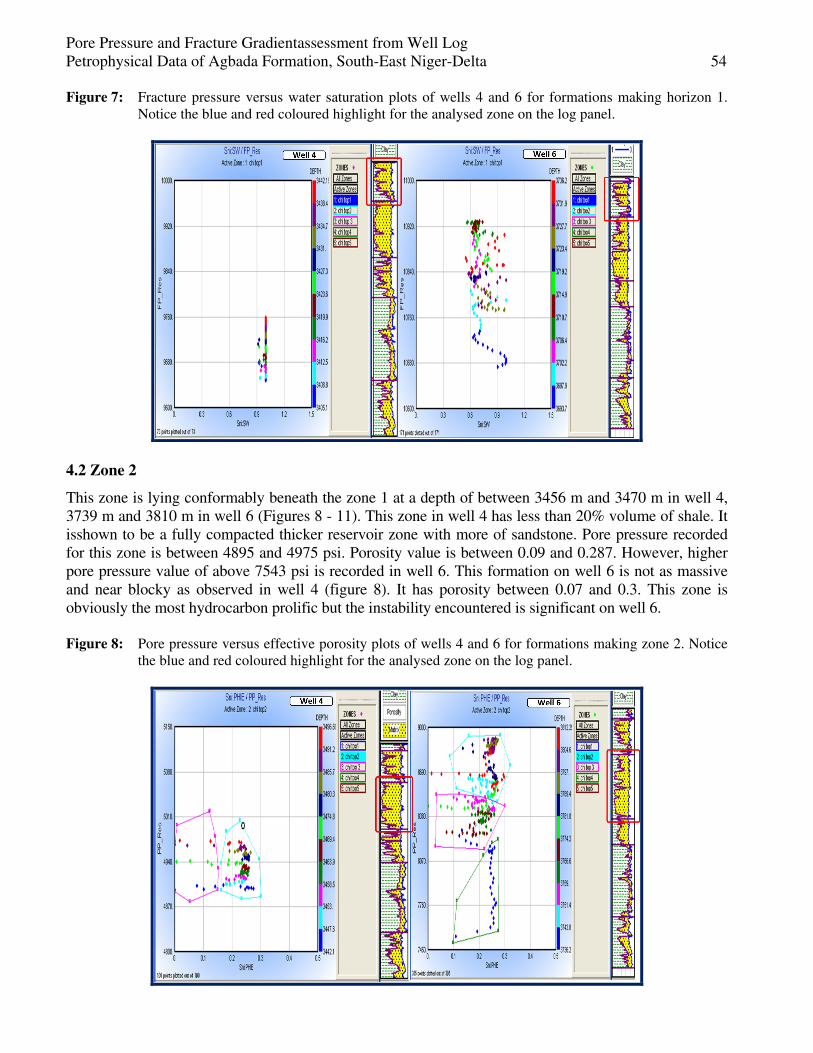
Pore Pressure and Fracture Gradientassessment from Well Log Petrophysical Data of Agbada Formation, South-East Niger-Delta 54 Figure 7: Fracture pressure versus water saturation plots of wells 4 and 6 for formations making horizon 1.
Notice the blue and red coloured highlight for the analysed zone on the log panel.
4.2 Zone 2
This zone is lying conformably beneath the zone 1 at a depth of between 3456 m and 3470 m in well 4, 3739 m and 3810 m in well 6 (Figures 8 - 11). This zone in well 4 has less than 20% volume of shale. It isshown to be a fully compacted thicker reservoir zone with more of sandstone. Pore pressure recorded for this zone is between 4895 and 4975 psi. Porosity value is between 0.09 and 0.287. However, higher pore pressure value of above 7543 psi is recorded in well 6. This formation on well 6 is not as massive and near blocky as observed in well 4 (figure 8). It has porosity between 0.07 and 0.3. This zone is obviously the most hydrocarbon prolific but the instability encountered is significant on well 6. Figure 8: Pore pressure versus effective porosity plots of wells 4 and 6 for formations making zone 2. Notice
the blue and red coloured highlight for the analysed zone on the log panel.
55 Rotimi Oluwatosin John, Adeoye Taiye Olushola, Ologe Oluwatoyin and Onuh Charles Yunusa
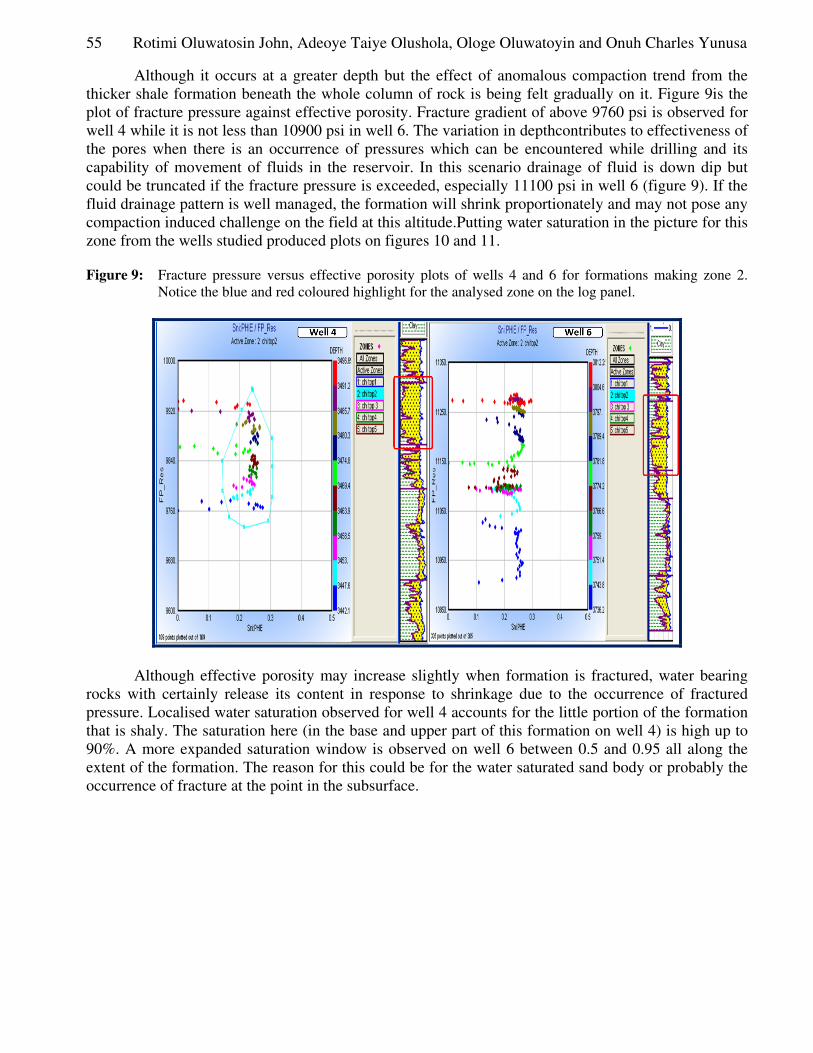
Although it occurs at a greater depth but the effect of anomalous compaction trend from the thicker shale formation beneath the whole column of rock is being felt gradually on it. Figure 9is the plot of fracture pressure against effective porosity. Fracture gradient of above 9760 psi is observed for well 4 while it is not less than 10900 psi in well 6. The variation in depthcontributes to effectiveness of the pores when there is an occurrence of pressures which can be encountered while drilling and its capability of movement of fluids in the reservoir. In this scenario drainage of fluid is down dip but could be truncated if the fracture pressure is exceeded, especially 11100 psi in well 6 (figure 9). If the fluid drainage pattern is well managed, the formation will shrink proportionately and may not pose any compaction induced challenge on the field at this altitude.Putting water saturation in the picture for this zone from the wells studied produced plots on figures 10 and 11.
Figure 9: Fracture pressure versus effective porosity plots of wells 4 and 6 for formations making zone 2. Notice the blue and red coloured highlight for the analysed zone on the log panel.
Although effective porosity may increase slightly when formation is fractured, water bearing rocks with certainly release its content in response to shrinkage due to the occurrence of fractured pressure. Localised water saturation observed for well 4 accounts for the little portion of the formation that is shaly. The saturation here (in the base and upper part of this formation on well 4) is high up to 90%. A more expanded saturation window is observed on well 6 between 0.5 and 0.95 all along the extent of the formation. The reason for this could be for the water saturated sand body or probably the occurrence of fracture at the point in the subsurface.
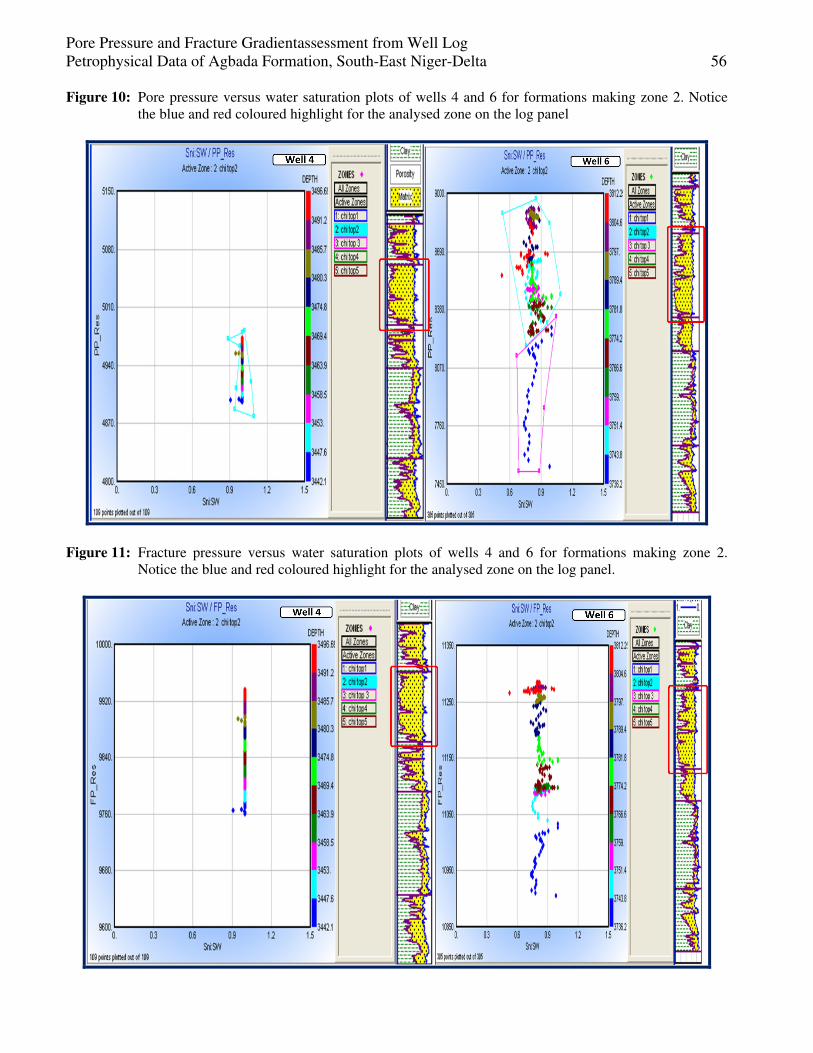
Pore Pressure and Fracture Gradientassessment from Well Log Petrophysical Data of Agbada Formation, South-East Niger-Delta 56 Figure 10: Pore pressure versus water saturation plots of wells 4 and 6 for formations making zone 2. Notice
the blue and red coloured highlight for the analysed zone on the log panel
Figure 11: Fracture pressure versus water saturation plots of wells 4 and 6 for formations making zone 2. Notice the blue and red coloured highlight for the analysed zone on the log panel.
57 Rotimi Oluwatosin John, Adeoye Taiye Olushola, Ologe Oluwatoyin and Onuh Charles Yunusa
Plot of fracture pressure versus water saturation (figure 11) could not justify the above conclusively but there is a likelihood a fracture trend being sustained beyond a threshold sustainable by the rock integrity especially sequel to increased production of hydrocarbon. Well 4 show a very linear relation with no significant threatening feature. Fractures are caused by stress in the formation, which in turn becomes such features as folds and faults desired in oil and gas exploration.Unless there is a proven hydrocarbon playand known reservoir volume, a lot of fractures would be counterproductive and of no use. 4.3 Zone 3
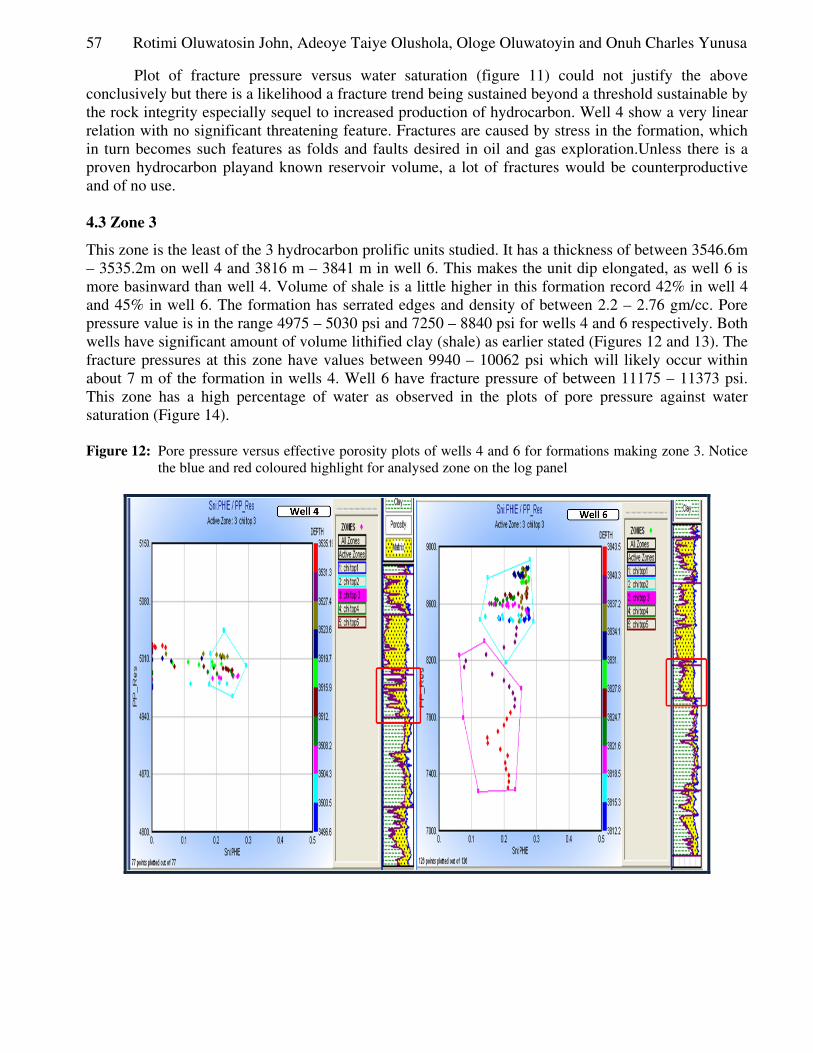
This zone is the least of the 3 hydrocarbon prolific units studied. It has a thickness of between 3546.6m – 3535.2m on well 4 and 3816 m – 3841 m in well 6. This makes the unit dip elongated, as well 6 is more basinward than well 4. Volume of shale is a little higher in this formation record 42% in well 4 and 45% in well 6. The formation has serrated edges and density of between 2.2 – 2.76 gm/cc. Pore pressure value is in the range 4975 – 5030 psi and 7250 – 8840 psi for wells 4 and 6 respectively. Both wells have significant amount of volume lithified clay (shale) as earlier stated (Figures 12 and 13). The fracture pressures at this zone have values between 9940 – 10062 psi which will likely occur within about 7 m of the formation in wells 4. Well 6 have fracture pressure of between 11175 – 11373 psi. This zone has a high percentage of water as observed in the plots of pore pressure against water saturation (Figure 14). Figure 12: Pore pressure versus effective porosity plots of wells 4 and 6 for formations making zone 3. Notice
the blue and red coloured highlight for analysed zone on the log panel
Pore Pressure and Fracture Gradientassessment from Well Log Petrophysical Data of Agbada Formation, South-East Niger-Delta 58 Figure 13: Fracture pressure versus effective porosity plots of wells 4 and 6 for formations making zone 3.
Notice the blue and red coloured highlight for analysed zone on the log panel.
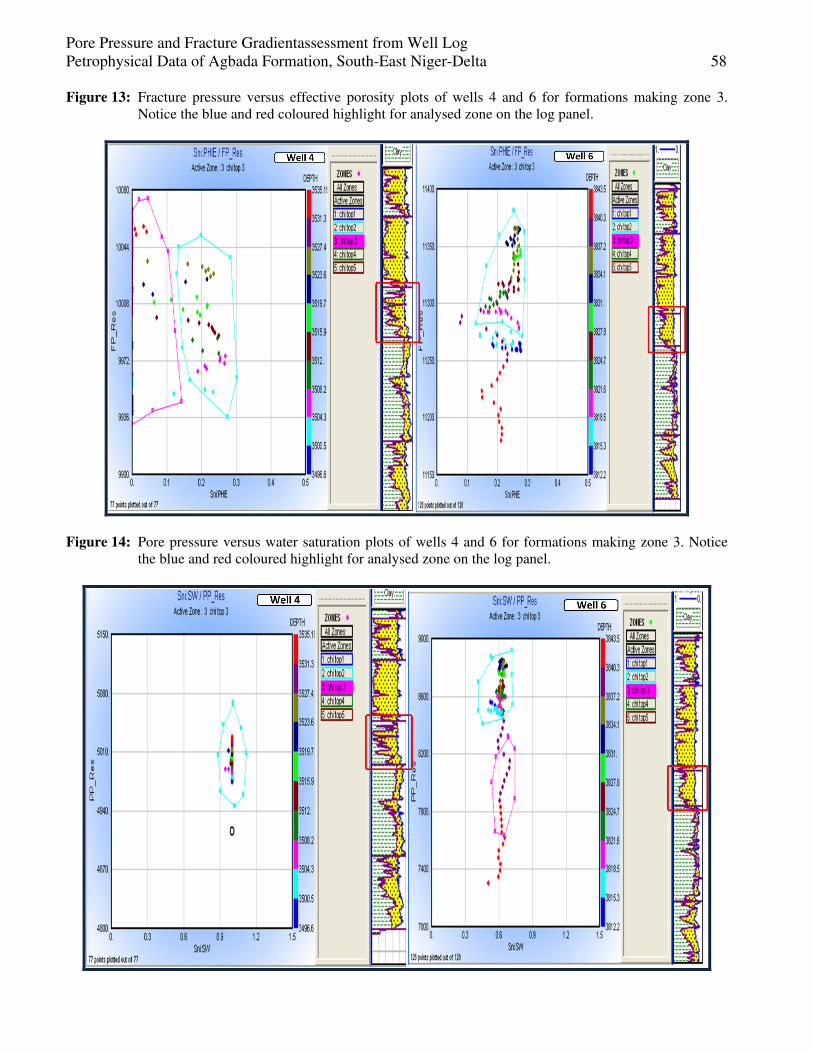
Figure 14: Pore pressure versus water saturation plots of wells 4 and 6 for formations making zone 3. Notice the blue and red coloured highlight for analysed zone on the log panel.
59 Rotimi Oluwatosin John, Adeoye Taiye Olushola, Ologe Oluwatoyin and Onuh Charles Yunusa
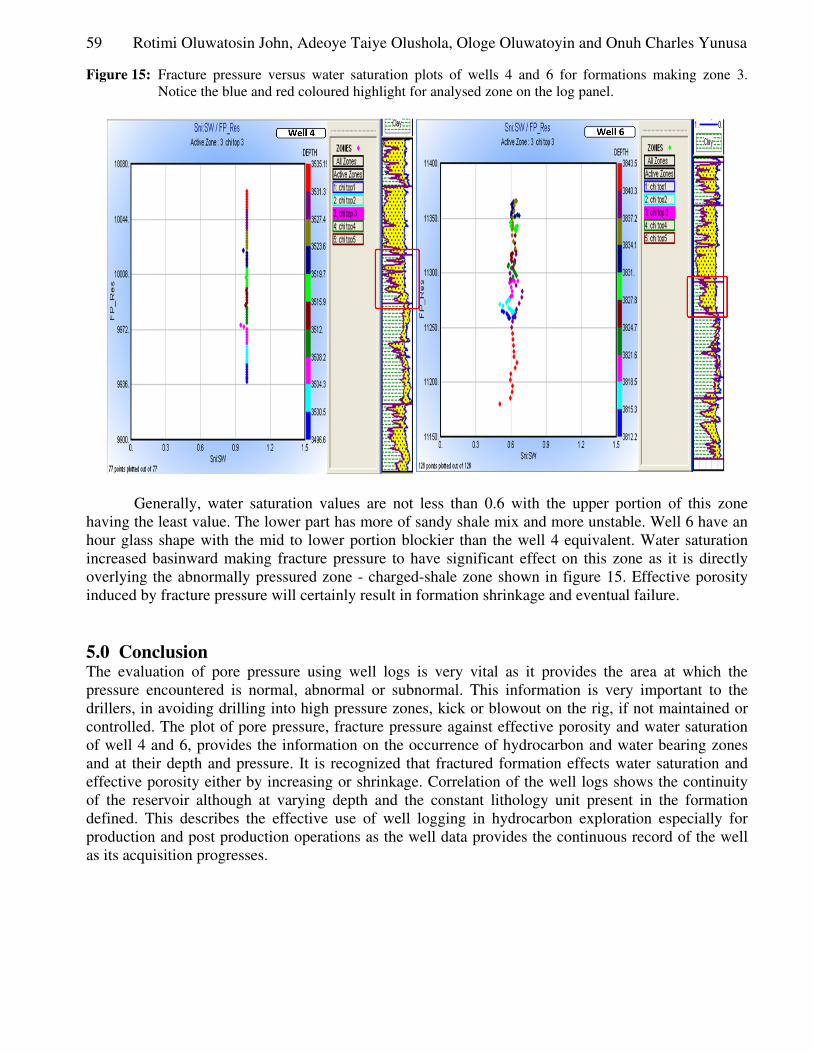
Figure 15: Fracture pressure versus water saturation plots of wells 4 and 6 for formations making zone 3. Notice the blue and red coloured highlight for analysed zone on the log panel.
Generally, water saturation values are not less than 0.6 with the upper portion of this zone having the least value. The lower part has more of sandy shale mix and more unstable. Well 6 have an hour glass shape with the mid to lower portion blockier than the well 4 equivalent. Water saturation increased basinward making fracture pressure to have significant effect on this zone as it is directly overlying the abnormally pressured zone - charged-shale zone shown in figure 15. Effective porosity induced by fracture pressure will certainly result in formation shrinkage and eventual failure.
5.0 Conclusion The evaluation of pore pressure using well logs is very vital as it provides the area at which the pressure encountered is normal, abnormal or subnormal. This information is very important to the drillers, in avoiding drilling into high pressure zones, kick or blowout on the rig, if not maintained or controlled. The plot of pore pressure, fracture pressure against effective porosity and water saturation of well 4 and 6, provides the information on the occurrence of hydrocarbon and water bearing zones and at their depth and pressure. It is recognized that fractured formation effects water saturation and effective porosity either by increasing or shrinkage. Correlation of the well logs shows the continuity of the reservoir although at varying depth and the constant lithology unit present in the formation defined. This describes the effective use of well logging in hydrocarbon exploration especially for production and post production operations as the well data provides the continuous record of the well as its acquisition progresses.
Pore Pressure and Fracture Gradientassessment from Well Log Petrophysical Data of Agbada Formation, South-East Niger-Delta 60
References [1] AslihanOzkale, 2006, Overpressure prediction by mean total stress estimate using well logs for
compressional environments with strike – slip or reserve faulting stress state. Unpublished Master’s Thesis, TAMU. Pp 172
[2] Avbovbo, A.A. 1978. Tertiary lithostratigraphy of Niger Delta, American Association of Petroleum Geologist Bulletin, 62( 2), pp 295-300
[3] Babu, S., and Sircar, A., 2011. A Comparative Study of Predicted and Actual Pore Pressures in Tripura, Indian, Journal of Petroleum Technology and Alternative Fuel 2(9), 150-160.
[4] Bowers, G., 1994. Pore pressure estimation from velocity data: Accounting for overpressure mechanisms besides undercompaction. IADC/ SPE 27488, IADC/SPE Drilling Conference, p. 515-530.
[5] Bowers G.L, 1995. Pore pressure estimation from velocity data: Accounting for overpressure mechanism besides undercompaction. SPE Drilling and Completions. Dallas USA.
[6] Bowers, G., 2001. Determining an appropriate pore-pressure estimation strategy. OTC 13042, Offshore Technology Conference.
[7] Bowers, G.L. 2002. Detecting High Pressure. The Leading Edge 21 (2):174–177. http://dx.doi.org/10.1190/1.1452608
[8] Chilingar, G.V., Serebryakov, V.A. and Robertson, J.O. Jr. eds. 2002. Origin and Prediction of Abnormal Formation Pressures, 1-390. Amsterdam: Elsevier, Developments in Petroleum Science No. 50.
[9] Dutta, N.C., 2002. Deepwater geoharzard prediction using prestack inversion of large offset p–wave data and rock model. AAPG Bulletin, 21. 193-198
[10] Eaton, B.A., 1969, Fracture gradient prediction and its applications in oilfield operations: Journal of Petroleum Technology, p. 1353–1360.
[11] Eaton, B.A., 1972. Graphical method predicts geopressures worldwide. World Oil 7(76). 100-104.
[12] Eaton, B. A., 1975. The equation for Geopressure prediction from well logs. Society of Petroleum Engineers of AIME, SPE 5544, 11.
[13] Eaton, B.A., 1997, Fracture gradient prediction for the new generation: World Oil, (October 1997), p. 93–100).
[14] Frankl, E. J and Cordy, E.A. 1967. The Niger Delta oil province: Recent developments, onshore and offshore, Mexico city, seventh world petroleum congress proceedings, 2, p. 195-209.
[15] Hottman, C.A., and Johnson R. K., 1965. Estimation of formation pressures from log-derived shale porosities, Journal of Petroleum Technology, 17. 717-782.
[16] Hubbert, M. K. and Willis, D. G. 1972. Mechanics of hydraulic Fracturing, AIME, 210, 153-165.
[17] Jorden, J. R. and Shirley, O.J., 1966. Application of drilling performance data to overpressure detection. Journal of Petroleum Technology, 1387-1394
[18] Matthews, W.R., and Kelly J., 1967. How to predict formation pressure and fracture gradient: Oil& Gas Journal, Reprint (2/20/1967), 7p.
[19] Nton, M.E. and Adebambo, B.A., 2009 Petrophysical evaluation and depositional environments of reservoir sands of X- field, offshore Niger delta ., Mineral Wealth Vol. 150 pp 1-12
[20] O’Connor, S.A and Swarbrick, R.E, 2008. Where has all the pressure gone? Evidence from pressure reversals and hydrodynamic flow. First Break, v. 26 September 2008
[21] Petroconsultants, (1996), Petroleum exploration and production database: Houston. [22] Reijers, T.J.F., 1996. Selected Chapters on Geology, SPDC of Nigeria, Corporate Reprographic
Services, Warri, 197p
61 Rotimi Oluwatosin John, Adeoye Taiye Olushola, Ologe Oluwatoyin and Onuh Charles Yunusa
[23] Rotimi, O. J., 2010. Sequence stratigraphy study within a chronostratigraphic framework of ‘Ningning field’, Niger Delta. RMZ – Materials and Geoenvironment, 57 (4). pp. 475–500, 2010
[24] Short, K.C. and Stauble, A. J. 1967. outline of the geology of Niger Delta, American Association of Petroleum Geologists Bulletin, 51, 761-779
[25] Whiteman, A., 1982. Nigeria: Its Petroleum Geology, Resources and Potentials. Vol. 1&2. Graham and Trotman Ltd.: London. UK.