simulating the soundscape through an analysis/resynthesis ... · simulating the soundscape through...
TRANSCRIPT

Simulating the soundscape through ananalysis/resynthesis methodology
Andrea Valle∗, Vincenzo Lombardo∗, and Mattia Schirosa∗?
∗CIRMA, Universita di Torinovia Sant’Ottavio, 20, 10124 Torino, Italy
?Music Technology Group, Universitat Pompeu FabraRoc Boronat, 138, 08018 Barcelona, Spain
[email protected],[email protected],[email protected]∗http://www.cirma.unito.it/
?http://mtg.upf.edu/
Abstract. This paper presents a graph-based system for the dynamicgeneration of soundscapes and its implementation in an application thatallows for an interactive, real-time exploration of the resulting sound-scapes. The application can be used alone, as a pure sonic explorationdevice, but can also be integrated into a virtual reality engine. In thisway, the soundcape can be acoustically integrated in the exploration ofan architectonic/urbanistic landscape. The paper is organized as follows:after taking into account the literature on soundscape, we provide a for-mal definition of the concept; then, a model is introduced, and finally,we describe a software application together with a case-study1.
1 Introduction
The term “soundscape” was firstly introduced (or at least, theoretically dis-cussed) by R. Murray Schafer in his famous book The tuning of the world [6].Murray Schafer has led the research of the World Forum For Acoustic Ecology,a group of researchers and composers who empirically investigated for the firsttime the “environment of sounds” in different locations both in America andin Europe. Murray Schafer and his associates studied for the first time the re-lation between sounds, environments and cultures. Hence on, the diffusion ofthe term has continuously increased, and currently the concept of soundscapeplays a pivotal role at the crossing of many sound-related fields, ranging frommultimedia [7] to psychoacoustics [8], from working environment studies [9] tourban planning [10], from game design [11] [12] to virtual reality [13], from datasonification [14] to ubiquitous computing [15] [16]: soundscape is a fundamentalnotion for acoustic design [17] [18], electroacoustic composition [19], auditorydisplay studies [20].
1 Preliminary works to this paper includes [1], [2], and [3]. The GeoGraphy systemhas been initially discussed in [4], [5].

2 Simulating the soundscape through an analysis/resynthesis methodology
Indeed, such a diffusion of the term is directly proportional to the fuzzinessof its semantic spectrum. It is possible to individuate three main meanings ofthe term “soundscape”, related to three different areas of research:
– Ecology/anthropology [21]. Since Murray Schafer’s pioneering work, this per-spective aims at defining the relevance of sound for the different cultures andsocieties in relation to the specific environment they inhabit. A soundscapeis here investigated through an accurate social and anthropological analysis,with two goals. On the one side, the researchers are interested in document-ing and archiving sound materials related to a specific socio-cultural andhistorical context. On the other side, they aim at leading the design of fu-ture projects related to the environmental sound dimension.
– Music and sound design [22]. The musical domain is particularly relevant.All along the 20th century, ethnomusicological studies, bruitism, “musiqued’ameublement” and “musique anecdotique” have pushed the research dis-cussion on environmental sound dimension as acoustic scenery [23]. At thesame time, musique concrete has prompted composers to think about soundsas sound objects. During the ’60-’70s many composers started working withsound field recording. Sharing the musique concrete attitude towards sound,they have been strongly influenced by the soundscape studies. Not by chance,many of Murray Schafer’s associates were composers. Thus, the concept iswidely present in many contemporary musical forms, as the soundscape itselfis regarded as a form of “natural” music composition (in general, cf. [24]).More, “soundscape composition” identifies a mainly electro-acoustic genre,starting from natural acoustic environmental sounds, sometimes juxtaposedto musical scores. Also, sound designers working for cinema and TV havecontributed to the diffusion of the term, indicating with “soundscape” theidea of an acoustic scenario to be added/adapted to the moving image ([25],cf. [26]).
– Architecture/urban planning [27]. In recent years, electro-acoustic technol-ogy and architectural acoustics have allowed to think about the relationbetween sound and space in a new form, in order to make citizens aware ofthe sonic environment (the soundscape) they live in, so that they can activelycontribute to its re-design. Many architectural projects have been developeddescending from these assumptions [28]. The concept of “lutherie urbaine”was proposed as a combined design –of architecture and of materials– for theproduction of monumental elements located in public spaces and capable ofacting like resonators for the surrounding sound environment [29].
It must be noted that such a complex and rich set of features related to sound-scape is extremely relevant because it demonstrates that the problem of therelation between sound and space cannot be only solved in acoustic or psycho-acoustic terms. An acoustic or psycho-acoustic approach considers the relationamong sound, space and listener in terms of signal transfer [30]. Acoustic ecol-ogy, through a large body of studies dedicated to soundscape description andanalysis [6], has pointed out that the soundscape perception implies the in-tegration of low-level psychoacoustic cues with higher level perceptual cues

Simulating the soundscape through an analysis/resynthesis methodology 3
from the environment, its cultural and anthropological rooting, its deep rela-tions with human practices. The integration of soundscape in a landscape doc-umentation/simulation is crucial in order to ensure a believable experience inhuman-computer interaction [31]. A consequence of the integration among dif-ferent perceptual domains and among multilevel information is that the study ofsoundscape requires to include phenomenological and semiotic elements. In thissense, the study of soundscape can benefit from the research in “audiovision”,i.e. the study of the relation between audio and video in audiovisual products(film, video etc) [32]. More, soundscape studies have highlighted the relevance ofdifferent listening strategies in the perception of the sonic environments: from aphenomenological perspective ([33], [34]) it is possible to identify an “indexical”listening (when sounds are brought back to their source), a “symbolic” listening(which maps a sound to its culturally-specific meanings), an “iconic” listening(indicating the capabilites of creating new meanings from a certain sound ma-terial, in general see [35]).
2 For a definition of soundscape
As the semantic spectrum of the term “soundscape” is quite fuzzy, a modeling ofsoundscape requires first an explicit definition. With this aim, we need to intro-duce a number of concepts. A “sound object” is a cognitive and phenomenologicalunit of auditory perception [33]. It can be thought as an “auditory event” [36]and integrated in terms of ecological and cognitive plausibility in the auditoryscene analysis approach [37]. Its nature of “object” is intended to emphasize itssemiotic quality. This means that a sound object is always related to a specificlistening practice, so it is not exclusively placed at the perceptual level but alsorelated to a specific cultural context. In short, we can say that a sound object(SO) is a function of perceptual organization and cultural context. Assigningthe cultural context a pivotal role, traditional soundscape studies have insistedon a tripartite typology of sounds in relation to their socio-cultural function[21]: keynote sounds, signal sounds, soundmarks. Keynote sounds are the soundsheard by a particular society continuously, or frequently enough, to form a back-ground against which other sounds are perceived (e.g. the sound of the sea for amaritime community). Signals stands to keynotes sounds as a figure stands to abackground: they emerges as isolated sounds against a keynote background (e.g.a fire alarm). Soundmarks are historically relevant signals (e.g. the ringing ofthe historical bell tower of a city). While this classification is intended as a guid-ance for the analysis of the soundscape in its cultural context, here we proposea pivotal role for the perceptual and indexical organization of the soundscape.So, we yield a different classification for the sound objects of a soundscape:
– atmospheres: in relation to sound, Bohme has proposed an aesthetics of at-mospheres [38]. Every soundscape has indeed a specific “scenic atmosphere”,which includes explicitly an emotional and cultural dimension. An atmo-sphere is an overall layer of sound, which cannot be analytically decom-posed into single sound objects, as no particular sound object emerges. At-

4 Simulating the soundscape through an analysis/resynthesis methodology
mosphere characterizes quiet states without relevant sound events. Whilekeynote sounds are intended as background sounds (i.e. they are a layer ofthe soundscape), atmospheres identify the whole sound complex.
– events: an event is a single sound object of well-defined boundaries appearingas an isolated figure. In this sense, it is equivalent to a signal as defined insoundscape studies.
– sound subjects: a sound subject represents the behavior of a complex sourcein terms of sequencing relations between events. In other words, a soundsubject is a description of a sound source in terms of a set of events and ofa set of sequencing rules.
In other words, an atmosphere is a sound object which source cannot be iden-tified, as the source coincides with the whole environment. Events and soundsubjects are sound objects related to specific sources. In the case of an event,the behavior of the source is simple, and can be thought as the emission of aspecific sound object. In the case of a sound subject, the behavior is complexand is specified as a set of generation/sequencing relations.However, the previous classification of sound objects is not enough to exhaus-tively define a soundscape. A soundscape is not only a specific structure ofsound objects arranged in time (otherwise, every piece of music could be defineda soundscape), but is related to a space, and the exploration of such a spacereveals other aspects of the same soundscape. This exploration is performedby a listener, not to be intended as a generic psycho-acoustic subject but asa culturally-specific one: through the exploration of the space, the listener de-fines a transformation on the sound objects that depends on the mutual relationbetween her/himself and the objects. The transformation is both spatial –asit depends on features related to the listening space (e.g. reverberation)– andsemiotic –as it depends on cultural aspects (e.g. specific listening strategies). Bycoupling the spatial and semiotic aspects, Wishart [39] has discussed in depththe symbolic construction of landscape in acousmatic listening conditions, bytaking into account this overall sound dimension. For Wishart “the landscape ofa sound-image” is “the imagined source of the perceived sounds” ([39]: p. 44).In this sense, for Wishart the landscape of the sounds heard at an orchestralconcert is musician-playing-instruments, exactly as the landscape of the sameconcert heard over loudspeakers through recording. So, the first component ofthe reconstructed landscape is a semiotic construction based on the cultural cod-ing of soundscape. Wishart proposes a semiotic/phenomenological description ofnatural soundscapes. For instance: moorlands reveal a lack of echo or reverbera-tion, sense of great distance, indicated by sounds of very low amplitude with lossof high-frequency components; valleys display a lack of distance cues and possiblyinclude some specific image echos; forests are typified by increasing reverberationas the distance of the source from the listener increases ([39]: p. 45). Such a char-acterization can be semantically described through three continuous parameters:dynamics (cf. in music: from ppp to fff ), reverberation (expressed along the axis

Simulating the soundscape through an analysis/resynthesis methodology 5
dry/wet), brightness (in timbral studies, typically along the bright/dull axis)2.These three categories provide three descriptive axes for a qualitative evaluationof the global acoustic behavior of the soundscape.The second component of the reconstructed landscape is the distribution ofsound objects over the space indexically related to the soundscape. Many schol-ars have noted that a soundscape can be decomposed as a group of several acous-tic scenographies, which are then recomposed through the listener’s exploringexperience [28] [27] [29] [24]. As soundscapes are not uniform, the listener’sexperience is enhanced when s/he encounters aural transitions during her/hisexploration of the environment [38]. When a listener is spatially exploring thesoundscape, he can notice several perceptual differences in the sounds. In par-ticular, the sound environment can be decomposed into internally homogeneoussub-parts. These sub-parts are here referred to as “sound zones”. Sound zonescan differ in dimension and number of elements, but they are characterized bytypical sources, i.e. sound emissions that are often present in a region and absent(or only rarely heard) in the others. The soundscape will then results from thesummation of all the sound zones that the listener will be able to explore. As anexample, we can consider the following situation: in a classroom with acousticinsulation walls, closed doors and windows, a teacher is speaking in front of avery silent audience. The professor voice is loud and clear all over the classroom,without any relevant irregularity. By contrast, we can imagine the opposite sit-uation: doors and windows are open, the thin walls are incapable of blockingany environmental sound, outside there are roadworks, a party is running inthe hall just behind the door, a few students joke and laugh while the profes-sor keeps explaining loudly. This second soundscape (represented in Figure 1) iscompletely different from the first one. Considering a wide classroom, it wouldbe very simple to move around the space and run across several recognizable sub-soundscapes (“zones”). Someone near the door can notice that reception partysounds are louder than any other sound source coming from the classroom. Ass/he moves to the desk, s/he can hear the teacher’s voice. And so on. In the firstinsulated room case it is possible to identify a soundscape consisting of one onlyzone; in the second case four sound zones are clearly defined. Thus, even if theirboundaries can be fuzzy, each zone can be considered as completely independenton another. This means that it is possible to describe the character of each zone.To sum up, a zone is a region of the space that can include all the different kindsof sound objects previously discussed (atmospheres, events and sound subjects)and is perceptually separated from another zone. That is, the listener can detecta perceptually different soundscape when crossing over zone edges. Empiricallywe can determine a threshold that represents a measure of the just noticeabledifference (JND) over zones.A soundscape results to be composed of several zones and sound edges.No matter the definition of the discrimination function, the term “soundscape”indicates the summation of all the sound zones that a listener will be able to
2 It can be noted that a similar semantic description is strictly correlated to psychoa-coustic cues, respectively intensity, direct-to-reverberant ratio, spectrum [31].

6 Simulating the soundscape through an analysis/resynthesis methodology
Fig. 1. The classroom example: four sound zones.
explore. In order to take into account the composite nature of the soundscape,it is thus necessary to model the exploration process performed by the listener,and the resulting aural transitions. From the previous discussion, we can providethe following definition:A soundscape is a temporal and typological organization of sound objects, re-lated to a certain geo-cultural context, in relation to which a listener can applya spatial and semiotic transformation.
3 Towards a formalized model
Despite the profusion of usages, there are neither models nor applications aimingat a simulation of a soundscape starting from the analysis of an existing sound-scape. Listen [40] works on the generation and control of interactive soundscapes,but does not include an explicit modeling of the soundscape itself. Tapestrea [22]is designed to generate “environmental audio” in real time, but does not defineany relation between sound and space.In devising a computational model to be implemented in an application, a firstissue concerns the epistemological status of sound objects. As discussed above,they can be described as a function of perceptual and cultural factors. Cul-tural context results from encyclopedic knowledge on the environment and frominterviews to different typologies of users (e.g. usual/occasional goers/workers,musicians/non-musicians, etc.). A related issue concerns the relation betweenthe acoustic and the phenomenological levels. For each sound object we mustidentify a corresponding signal. The problem is particularly relevant when thesound objects play simultaneously. The more complex a soundscape, the moredifficult to unambiguously identify a signal corresponding to a sound object.Hence on, a “sound material” will be an audio signal corresponding to a certainsound object. Thus, in the analysis of a complex soundscape, there are at leasttwo difficult issues: first, the decomposition of the sound continuum into sound

Simulating the soundscape through an analysis/resynthesis methodology 7
objects; second, the retrieval of the corresponding signal for each sound object.As an example, in the soundscape of a restaurant kitchen, the decompositioninto sound objects can be quite hard, as some elements are easy recognizable(clashing cutlery, water in the basin, voices of cooks), but on the other sidethere is a diffuse texture made of a large amount of microsonic events that canbe hardly brought back to their sources. Even after having identified the soundobjects, it can be very difficult to extract isolated signals from the global sound-scape. The first issue can be identified as “semiotic discretization”, the secondas “acoustic discretization”. So, we define a semiotic discretization error (Sde)and an acoustic discretization error (Ade). In the perspective of the simulationof a soundscape (see Figure 2, more details later), we can then identify the fol-lowing relation between the real soundscape (RSC) and the targeted, virtualone (V SC):
RSC = V SC + Sde + Ade
Although the characterization of Sde and Ade is a very interesting topic, it isoutside the scope of this paper. Now, the virtual soundscape V SC is character-ized by a set of sound objects SO:
SO = {so1, so2, so3, . . . , son}
Each sound object so is a tuple
so = 〈typ, mat, att, pos, ra〉
Where:
– typ: the sound object type (A, atmosphere, E, event, SS, sound subject)– mat: the sound material related to the object and represented as an audio
file– att: a sublist representing variable attributes: iteration pattern (for sound
subjects), size (e.g. for atmospheres), radiation pattern, etc.– pos: the position of the object in the space, represented as a tuple of coor-
dinates– ra: the radiation area, that is how far from pos this sound object gets
A soundscape results from the interaction between a listener and a set of soundobjects. A listener is given a certain position and orientation in the space. More,an acoustic transformation is associated to the listener: each sound object isaffected by such a transformation in relation to its distance from the listener.Hence, the listener L is a triple
L = 〈pos, or,map〉
where the position pos is a tuple of coordinates (as above), the orientation or a setof Euler angles, and map is the mapping function of the distance/displacementbetween the sound object and the listener. A soundscape simulation of a realenvironment should include factors like sound propagation, radiation patterns,

8 Simulating the soundscape through an analysis/resynthesis methodology
Sound objects
Sound materials
Annotatedsound material
database
. GeoGraphy . Sound Interpreter
. LibrariesRecording
Spatial and behavioral information
Real Soundscape VirtualSoundscapeAnalysis of sound objects
Resynthesis
Interactiveexploration
User
1. Classification/Analysis/Recording
2. Production3. Generation
4. Evaluation
Evaluation tests
Fig. 2. Method. The generated, vitual, soundscape (bottom right) contains a reducedset of relevant sound objects from the real soundscape (top left).
reflections, impulse responses. The mapping function encodes all the factors thatcompose the sound transformations. So, to summarize the virtual soundscapeV SC is an audibility function Au defined over a set of sound objects and alistener:
V SC(t) = Au(SO, L, t)
The function Au takes a input the listener and the set of sound objects toreturn a set of sound sources in the space related to the listener. Given such adefinition, it is possible to propose a model for the simulation of soundscapes.The model features four phases (Fig. 2): 1. classification, analysis and recording,2. production, 3. generation, 4. evaluation.
4 Classification, Analysis and Recording
The first phase aims at gathering data from the real environment. It includesthe classification of sound objects, their perceptual analysis and the recordingof the related sound material (see the schema in 3). First (Figure 3, 0), generalinformation on the space is collected, including cultural features (e.g. if it isa religious or a secular space), topographical organization (e.g. if it containspedestrian areas), global acoustic properties (e.g. if it is reverberant or not andhow much). This information is intended as guidance for the subsequent steps.Then, we proceed at the identification of sound objects relying on qualitativeparameters. Here is where the Semiotic discretization error arises. This errordepends on two aspects: first, perceptual organization as defined by auditoryscene analysis studies ([37]) depends on a set of many heuristics available foreach listener to the auditory systems, and the prevalence of certain heuristics fora certain listening subject does not exclude the applicability of other heuristics

Simulating the soundscape through an analysis/resynthesis methodology 9
Soundscape
1. absent minded exploration
"Raw", relevant sound objects
Atmospheres, events, sound
subjects
2. active listening
2.1. SO classification
2.2. space localization
Sound mapTemporal patterns
Sound materials
3. recording
2.3. temporal organization
3.1. environment
3.2. sound details
Database
Soundscape
(to re-synthesis)
0. preliminary information
socio-culturaltopographicsonic
RECORDING
CLASSIFICATION
ANALYSIS
Fig. 3. Classification, Analysis and Recording.
for the same subject; second, heuristics depend on both primitive and culturally-based schemata, and the relevance of a heuristic with respect to other availableones can be strongly influenced by the competences of the differently involvedlisteners. The resulting (semiotic discretization) error is not quantifiable (as itdoes not involve physical entities), but it is nevertheless relevant to take it intoaccount in order not to loose crucial qualitative features of the soundscape. Theidentification of sound objects consists in a two-step procedure. This limits thesubjectivity and arbitrariness of identification and reduces the complexity of thewhole procedure. The first step (Figure 3, 1) is an “absentminded” explorationof the soundscape: the analyst must be perceptually open, adhering to a passivelistening strategy [26]. In this way s/he identifies the most relevant sound objectsof the overall soundscape, i.e. the ones that are evident even to the least awarelisteners. Moreover, the analyst carries out interviews with different kinds oflisteners, dealing with their global experience of the soundscape at differentlevels (perceptual, emotional, cultural). In the second step (Figure 3, 2), anactive listening strategy locates the sound objects in the space. The soundscape isinvestigated in depth, so that now even less prominent sound objects are detectedand analyzed (Figure 3, 2.1). The step consists in an on-site exploration, so thatthe eye can complement and help the ear in the retrieval process while aiming atidentifying areas with homogeneous sound objects. As an example, in case of amarket, different areas can be identified in relation to different stands, pedestrian
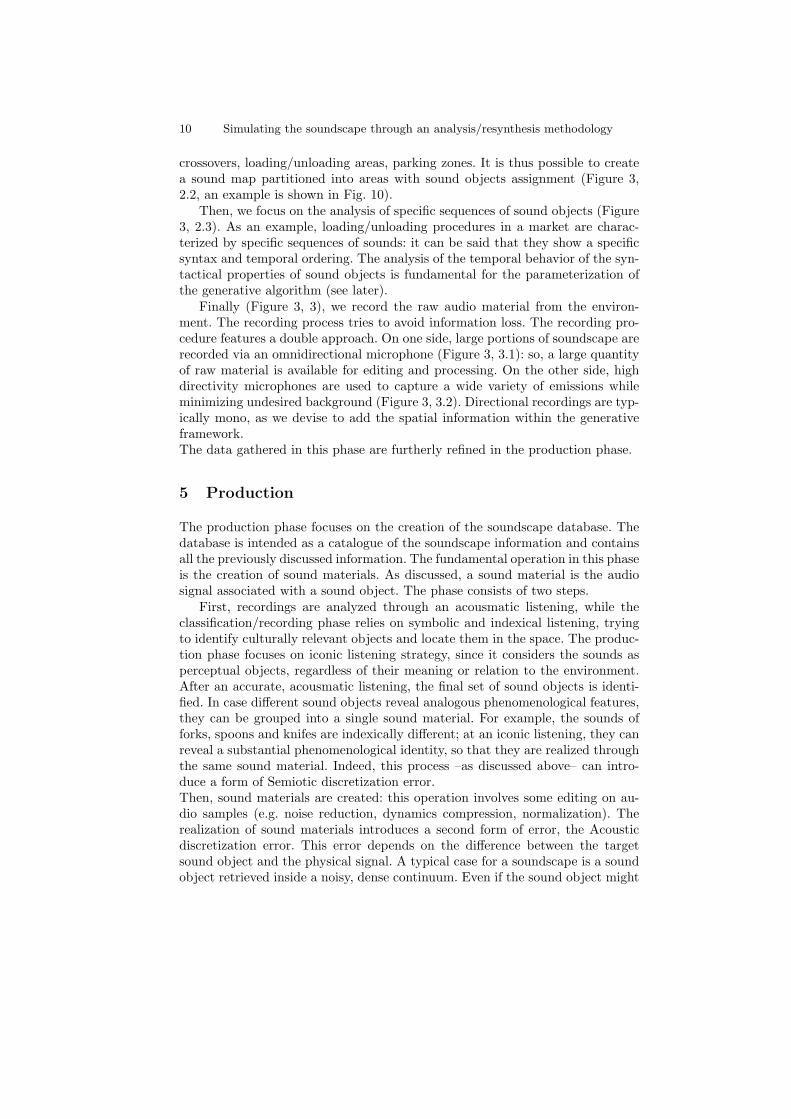
10 Simulating the soundscape through an analysis/resynthesis methodology
crossovers, loading/unloading areas, parking zones. It is thus possible to createa sound map partitioned into areas with sound objects assignment (Figure 3,2.2, an example is shown in Fig. 10).
Then, we focus on the analysis of specific sequences of sound objects (Figure3, 2.3). As an example, loading/unloading procedures in a market are charac-terized by specific sequences of sounds: it can be said that they show a specificsyntax and temporal ordering. The analysis of the temporal behavior of the syn-tactical properties of sound objects is fundamental for the parameterization ofthe generative algorithm (see later).
Finally (Figure 3, 3), we record the raw audio material from the environ-ment. The recording process tries to avoid information loss. The recording pro-cedure features a double approach. On one side, large portions of soundscape arerecorded via an omnidirectional microphone (Figure 3, 3.1): so, a large quantityof raw material is available for editing and processing. On the other side, highdirectivity microphones are used to capture a wide variety of emissions whileminimizing undesired background (Figure 3, 3.2). Directional recordings are typ-ically mono, as we devise to add the spatial information within the generativeframework.The data gathered in this phase are furtherly refined in the production phase.
5 Production
The production phase focuses on the creation of the soundscape database. Thedatabase is intended as a catalogue of the soundscape information and containsall the previously discussed information. The fundamental operation in this phaseis the creation of sound materials. As discussed, a sound material is the audiosignal associated with a sound object. The phase consists of two steps.
First, recordings are analyzed through an acousmatic listening, while theclassification/recording phase relies on symbolic and indexical listening, tryingto identify culturally relevant objects and locate them in the space. The produc-tion phase focuses on iconic listening strategy, since it considers the sounds asperceptual objects, regardless of their meaning or relation to the environment.After an accurate, acousmatic listening, the final set of sound objects is identi-fied. In case different sound objects reveal analogous phenomenological features,they can be grouped into a single sound material. For example, the sounds offorks, spoons and knifes are indexically different; at an iconic listening, they canreveal a substantial phenomenological identity, so that they are realized throughthe same sound material. Indeed, this process –as discussed above– can intro-duce a form of Semiotic discretization error.Then, sound materials are created: this operation involves some editing on au-dio samples (e.g. noise reduction, dynamics compression, normalization). Therealization of sound materials introduces a second form of error, the Acousticdiscretization error. This error depends on the difference between the targetsound object and the physical signal. A typical case for a soundscape is a soundobject retrieved inside a noisy, dense continuum. Even if the sound object might

Simulating the soundscape through an analysis/resynthesis methodology 11
be very well isolated by auditory scene analysis, it could not be easily possible toobtain an equally isolated sound material from an environmental recording. Ina case like this, the resulting sound material can be heard as a noisy representa-tion of the sound object or in the worst case still revealing other parallel sounds.Noise reduction can indeed improve the quality of the sound material, but onthe other side can remove audio information in such a measure that, again, thesound material is heard as a “distorted” version of the intended sound object.The second step is a general reviewing phase of the previous information in orderto create a final sound map. If some sound material is lacking, a new recordingsession is planned, targeted to that specific sound object. In this way a feedbackloop is defined from production to classification.
6 Generation
The information retrieved from the annotation/analysis of the real soundscape isthen used to generate a synthesized soundscape. The generation process involvestwo components: a formal model for the definition of sound object sequences andan interpreter to feed the synthesis algorithms. The formal model defines the se-quencing of the sound objects. It is a generative model, i.e. able to create aninfinite set of sequences of sound objects. This sequence represents a continuousvariation from a finite set of sound objects. An algorithm merges the informationcoming from the sequencing model with the user’s navigation data. In this way, asoundscape can be simulated and explored interactively. The generative compo-nent is based on graphs and extends the GeoGraphy system [4] [5]. The interpret(the second component) is responsible for the interpretation of the data gener-ated by the model in a sonic context. Hence, it is named “Sound Interpreter”. Inthe following subsections we first describe the two-layered GeoGraphy system,and then the Sound Interpreter.
6.1 The GeoGraphy System
Graphs have proven to be powerful structure to describe musical structures([41]): they have been widely used to model sequencing relation over musicalelements belonging to a finite set. It can be disputed whether non-hierarchicalsystems are apt for music organization, as hierarchical structures have proven tobe useful in modeling e.g. tonal music [42]. It is common to consider soundscapein terms of multiple parallel and independent layers of sound [6]. A common fea-ture of all these graph representations devised for music is that they generally donot model temporal information: the GeoGraphy model relies on time-stampedsequences of sound objects. The sequencing model is a direct graph (Figure 4,left), where each vertex represents a sound object and each edge represents apossible sequencing relation on a pair of sound objects. This graph is actually amultigraph, as it is possible to have more than one edge between two vertices;it can also include loops (see Figure 4 on vertex B). Each vertex is labeled withthe sound object duration and each edge with the temporal distance between

12 Simulating the soundscape through an analysis/resynthesis methodology
woodLow woodHiA B B A B
4: 1.0 2: 1.2 1: 0.7 3: 0.5 t
woodHi woodLow woodHi
eID: eDur
vID
vLab
vDur(0.7)
A: woodLow
B: woodHi
4: 1.03: 0.5
1: 0.7
2: 1.2
a
Fig. 4. A graph (left) with an actant “a” starting from edge 4. The resulting sequenceis shown on the right. A and B: vertices; 1,2,3: edges. The duration of the vertices is0.7.
the onsets of the two sound objects connected by the edge itself. The graph de-fines all the possible sequencing relation between adjacent vertices. A sequenceof sound objects is achieved through the insertion of dynamic elements, called“graph actants”. A graph actant is initially associated with a vertex (that be-comes the origin of a path); then, the actant navigates the graph by randomlyfollowing the directed edges. Each vertex emits a sound object at the passageof a graph actant. Multiple independent graph actants can navigate a graphstructure at the same time, thus producing more than one sequence. In case agraph contains loops, sequences can also be infinite. As modeled by the graph,the sound object’s duration and the delay of attack time are independent: asa consequence, it is possible that sound objects are superposed. This happenswhen the vertex label is longer than the chosen edge label.A soundscape includes a set of sequences, which are superposed like tracks: in asoundscape there are as many sequences as graph actants. The generation pro-cess can be summarized as follows. Graph actants circulate on the graph: thereare as many simultaneous sound object sequences as active graph actants. In thegeneration process, when an actant reaches a vertex, it passes to the level II thevertex identifier: the ID will be used in the map of graphs to determine if thevertex itself is heard by the Listener (see later).An example is provided in Figure 4. The graph (left) is defined by two verticesand four edges. The duration of both vertices is set to 0.7 seconds. In Figure 4(right), vertices are labeled with an identifier (“A”, “B”). More, each vertex isgiven a string as an optional information (“woodLow”, “woodHi”), to be used insound synthesis (see later). A soundscape starts when an actant begins to navi-gate the graph, thus generating a sequence. Figure 4 (left) represents a sequenceobtained by inserting a graph actant on vertex A. The actant activates vertexA (“woodLow”), then travels along edge 4 and after 1 second reaches vertex B(“woodHi”), activates it, chooses randomly the edge 2, re-activates vertex B af-ter 1.2 seconds (edge B is a loop), then chooses edges A, and so on. While goingfrom vertex A to vertex B by edge 3, vertex duration (0.7) is greater then edgeduration (0.5) and sound objects overlap. The study of the temporal pattern ofthe many sound objects provides the information to create graphs capable of

Simulating the soundscape through an analysis/resynthesis methodology 13
representing the pattern. Every graph represents a certain structure of soundobjects and its behavior. Different topologies allow to describe structure of dif-ferent degrees of complexity. This is apparent in relation to the three types ofsound objects previously introduced. Atmospheres are long, continuous texturalsounds: they can be represented by a single vertex with an edge loop, where thevertex duration (typically of many seconds) coincides with the edge duration(Figure 5, a). In this sense, atmospheres simply repeat themselves. Analogously,events can be represented by graphs made of a single vertex with many differentlooping edges, which durations are considerably larger than the duration of thevertex (Figure 5, b). In this way, isolated, irregularly appearing events can begenerated. Indeed, the graph formalism is mostly useful for sound subjects. Asound subject is a complex, irregular pattern involving many sound objects: itcan be aptly described by a multigraph (Figure 5, c). The multigraph can gen-erate different sequences from the same set of sound objects: in this sense, itrepresents a grammar of the sound subject’s behavior. Vertices are given an ex-
a b c
Fig. 5. Possible topologies for atmosphere, events and sound subjects (sizes of verticesand edge lengths roughly represents durations).
plicit position: in this way, the original location of a sound source is represented.Each vertex is given a radiation area: the radius indicates the maximum distanceat which the associated sound object can be heard. The space is named map ofgraphs. A map contains a finite number of graphs (n), which work independently,thus generating a sequences, where a is the total number of the graph actantsthat navigate in all the graphs. As there is at least one graph actant for eachgraph, there will be a minimum of n tracks (a ≥ n), i.e. potential layers of thesoundscape. Inside the map of graphs, a dynamic element, a “Listener” deter-mines the actually heard soundscape. The Listener is identified by a position,an orientation and an audibility area (see Fig. 6). The position is expressed as apoint in the map; the orientation as the value in radiant depending on the user’sinteraction control; the audibility area defines the perceptual boundaries of theListener. The Listener can be thought as a function that filters and parameter-izes the sequences of sound objects generated by the graph actants. Every timea vertex is activated by a graph actant, the algorithm calculates the position of

14 Simulating the soundscape through an analysis/resynthesis methodology
the Listener. If the intersection between the Listener’s audibility area and thevertex’s energetic area is not void, then the Listener’s orientation and distancefrom the vertex are calculated, and all the data (active vertex, position, distanceand orientation of the Listener) are passed to the DSP module. To sum up, thetwo-layer system outputs a sequence of time-stamped vertex IDs with positionalinformation added.
active vertex
trajectory
Listener
displacement angle
graph
radiationareas
audibilityarea
distance
Fig. 6. Listener in the map of graphs. The audibility radius filters out active verticesfalling outside.
Actually, the model represents the space as a 2-dimensional extension, and as-sumes that the sound sources (represented by vertices) are static. Through theGeoGraphy model it is possible to generate a target complex soundscape. InFigure 7, a soundscape is represented by two disconnected subgraphs. As dis-cussed, sound objects can overlap their audibility with other objects, dependingon their radiation area. The radiation area is set according to dynamics annota-tions taken during the analysis phase. It is thus possible to regulate the radiusof each element to interbreed a sound object with its neighbors. In Figure 7a soundscape subcomponent is represented by the loop between vertices 4 and5, respectively having radii I4 and I5 (the grouping is represented by the dot-ted ellipse). Similarly, the loop among vertices 1, 2, 3, 6 individuates anothersubcomponent, and the intersection between the elements 2 and 5 is the por-tion of space where the sounds of the two subcomponents can be hearable. Asdiscussed before, a soundscape is made by a continuous fusion process betweensound figures and backgrounds. In this sense, a soundscape has a core grant-ing continuity to the structure, and to the resulting auditory stream: the core

Simulating the soundscape through an analysis/resynthesis methodology 15
is formed by the atmospheres, that consist of several ambient sound materials(i.e. long field recordings), aiming at representing different natural “almost-quietstate” nuances. These features can be easily represented through graphs. Figure
413s
54s
27s
39s
13s
f: 11
g: 3
d: 11s
c: 9s
a: 5sb: 9s
I4
I5
I1
I2
I3
Distance
Audibility areaSound pollution
Sound object radiation area
65s
I6
e: 6
Intensity radius
Audibility radius
Fig. 7. Graphs and Listener.
8 represents a soundscape as a connected graph. The atmospheres (A, on top)allow the formation of a background against which semiotically and indexicallyrelevant signals can emerge. Atmospheres can be connected to other atmospheresand to events and sound subjects. Their durations are typically set longer thanthe edges connecting them to events and sound subjects: in this way, atmo-spheres are still present when the events and sound subjects are activated bythe actant. Atmospheres can then generate a background layer, while soundevents and sound subjects reach the close-up perceptual level and then quicklydisappear. Events (E) can be thought as isolated signals. On the contrary, soundsubjects (SS) feature a double nature. In Figure 8 they are represented, for sakeof simplicity, as single vertices, standing for a complex but unitary acoustic be-havior. But a sound subject properly is just a subgraph, organized recursivelyin a core surrounded by events, like a sub-zone. An example of sound subject isdiscussed in the case-study.

16 Simulating the soundscape through an analysis/resynthesis methodology
A
AA
A
SSE
SS
SS
SS
E
E E
E
E
Atmosphere Core (background)
Events and sound subjects
Sound subject as a subgraph
Fig. 8. A graph representing the relations among atmospheres, events and sound sub-jects in a soundscape.
6.2 The Sound Interpreter
The graph-based model does not make any assumption about sound objects,whose generation is demanded to an external component. It defines a mecha-nism to generate sequences of referred sound objects (grouped in sequences).During the generation step, the data from the model are passed to the SoundInterpreter (Figure 9). The Sound Interpreter is responsible for audio retrievalfrom memory (e.g. samples), synthesis/processing (e.g. reverberation) and finaldelivery (e.g. stereo). As discussed, for each event the data include attributes ofspace and sources, and movement. The Interpreter defines the audio semanticsof the data by relating them to transform functions. These transform functionsare grouped into libraries containing all the necessary algorithms to generate theaudio signal. They define a mapping schema associating the vertex IDs (result-ing from graph sequencing, Figure 9, I) to sound materials in the database, andspatially-related data (resulting from Listener’s movement in the Map of graphs,Figure 9, II) to audio DSP components, e.g. relating distance to reverberation ordisplacement to multi-channel delivery. By using different libraries, the systemallows to define flexible mapping strategies. As an example, a library can definea realistic mapping in which the data from the model are used to control DSP al-gorithms aiming at a physical simulation of the acoustic properties of the space.Other libraries can include “fictional” rendering of the soundscape. In this way,the continuous nature of the space (populated by the same sound objects) ispreserved, even if the global result can sound “alien”. Alien mappings are usefulto create artificial spaces (for artistic purposes, from music to sound design) andto test the degree of soundscape invariance over different space models.

Simulating the soundscape through an analysis/resynthesis methodology 17
Graphs Map of graphs
Sound Interpr
eter
- emit vertices - add Listen-
related paramsI II
...Libraries
- maps data to sound libraries
- audio processing and delivery
Database
GeoGraphy
Fig. 9. An overview of the generation process. In this case the final delivery is stereo.
7 Evaluation
The resulting simulation is evaluated through listening tests, taking into ac-count both the sound materials and the transformations induced by space. Asthe competences about sound can vary dramatically from a user to another,the evaluation procedure takes into account four different typologies of listen-ers: occasional visitors, regular goers, non-sensitized listeners, sensitized listeners(musicians/sound designers). In order to evaluate the simulation, we use a com-parative procedure. First, we record a set of explorations in the market. That is,a listener travels the real market following some predefined paths, and we recordwith a binaural microphone the resulting soundscapes. Then, we simulate thesame exploration paths, with same durations, in the GeoGraphy system. Werecord the output of the system and then submit a pool of listeners differentpairs of stereo deliveries, consisting of the real soundscape and the simulatedversion. The listeners are asked to correctly identify the original recording andthe simulation. Listening tests on the simulated landscape also allow to partiallyevaluate, even if a posteriori, semiotic and acoustic discretization errors. Acousticdiscretization error is related to the segmentation/extraction of sound materialsfrom the recorded audio signal. An assessment of audio quality, both in termsof overall quality and in terms of single sound materials, is a good indicator of alow discretization error, meaning that single materials have not lost their promi-nent audio features, and their sum –instead of amplifying distortions introducedduring audio editing– produces a smooth audio experience. Semiotic discretiza-tion results from the identification of a finite set of sound objects, which areconsidered as the only relevant sound objects of the soundscape. The reportedrichness and completeness of the soundscape (in terms of relevant sound objectsfor the listeners) are two possible indices of a low semiotic discretization error.
8 Case-study: the market of “Porta Palazzo”
The model has been tested on a simulation of the soundscape of Porta Palazzo,Turin’s historical market (see [43]). The market is a typical case of a socio-cultural relevant soundscape. In particular, the market of Porta Palazzo has a

18 Simulating the soundscape through an analysis/resynthesis methodology
long tradition (it has been established more than 150 years ago): it is the great-est outdoor market in Europe and represents the commercial expression of thecultural heritage of the city of Turin. During the last century, it has tenaciouslyretained its identity, characterized by the obstinate will of the workers of sharingits government’s responsibility.The analysis of the case-study initially focused on the socio-cultural dimensionof the market. First of all, we gathered bibliographic information to better un-derstand the cultural features of such a historical place. The municipality ofTurin, that has provided the most up-to-date report on the subject [43] and adetailed map of the whole area, prepared for the urban renovation and environ-mental improvement of the market. From the report it has emerged that themarket of Porta Palazzo is probably the part of Turin where the largest numberof different social realities and cultures inhabit. People speaks include languagesand dialects from all the regions of Italy, South America, Eastern Europe, NorthAfrica. More, every day the market serves 20,000 persons (80,000 on Saturday),and 5,000 persons work there every day. Not by chance, its soundscape mani-fests an impressive acoustic richness, as there are many qualitatively differentsound sources (both of linguistic and non-linguistic nature). In order to eval-uate relevance and features of the soundscape for its usual listeners, we madeshort informal interviews to local workers, customers and worker representatives.These interviews helped us to easily identify the most pervasive sound objects.As an example, the sound of plastic shopping-bags is a unique keynote soundrepresented as a mass of sound events. The shouts of the merchants are anothermulti-particle keynote in which the listener of the marketplace soundscape is im-mersed (so, the most intense, vibrant, repetitive, significant advertising messageshave been recorded to be simulated). In some sense, their sum is the pervasivecall of the market: the Porta Palazzo market voice.We then investigated the topographic structure of the market. The map pro-vided by the municipality (Figure 10) has been a fundamental resource in orderto effectively simulate the market, as it is the source for the creation of the mapof graphs. In other terms, by parametrizing the dimensions of the map of graphson the topographic map, we are then able to place the sound sources over itssurface. The market area is square-shaped, but the market stands are asymmet-rically placed in it. In fact, stands are placed along two conjunct sides, whilethe opposite corner is substantially free and deputed to pedestrian passage. Insum, market stands are located in the north-west half of the square cut by thediagonal. Unlike the pedestrian south-east corner, the north and west sides arecharacterized by the presence of motor vehicles. Yet, the two sides present somedifferences, as the north one borders an ordinary street (typically with car traf-fic), while the west one is occupied by the market load area. Also, busses andtrams pass through the same area, but not cars. The analysis revealed a specifickeynote sound in certain border regions that invades all the space: the noise ofmotor vehicles and carriages. As already suggested during the interviews, in theopinion of the customers the arrival of the streetcar number 4 is the unique soundsource that can be heard throughout the whole soundscape, acquiring specific

Simulating the soundscape through an analysis/resynthesis methodology 19
4
5
1
2 3 3
3
Fig. 10. Map of a portion of Porta Palazzo market: numbers and lines indicate soundzones identified during the annotation phase.
nuances in each zone (i.e. due to reverberation and to low frequency distanceattenuation). Hearing this sound object makes one think immediately of PortaPalazzo market.Following the devised methodology, we then proceeded to the identification andclassification of sound objects. The procedure was based on two steps. In bothcases, we devised a soundscape survey sheet helping for collecting information,even some that will probably not be used for implementation. The chart (see Fig.11) allows to describe each sound object through different fields: a figurative label(name), the market area to which it belongs (Geographical Reference), degreeof complexity (Structure), relevant feature of the sound object (Cause of rele-vance), repetition rate (Probability), intensity (expressed in musical form, e.g.pp, ff etc), duration (Length), an assessment of distance of the source (Recorddistance), the sequencing behavior (Generative structure). In order to define theintensity level for the sound object, we used a five-step scale, based on musicaldynamics (p, pp,m, f, ff). Intensity evaluation was performed in relation to theoverall soundscape, as we first assigned the ff events (the loudest) and the ppevents (the faintest); then, we grouped all the sound objects showing intensitysimilarity; finally, we assigned each group an intensity. A rough approximationbetween qualitative categories and sound pressure is the following:
– ff (fortissimo): -3dB– f (forte) = -12dB– m (medio) = -21dB– p (piano) = -30dB– pp (pianissimo) = -39dB

20 Simulating the soundscape through an analysis/resynthesis methodology
!"#$%&!%'%(("&)*#+,-&).,,$&/010
2#"3&45%3,6&*/$7'&48/$,/97$-6&:7,';<&$.,&7/:"#3%$7"/9&%#,&#,'%$,;&$"&$.,&=,/,#%'&9"*/;&">?,@$A&)$%#$7/=&:#"3&4B,/=$.6&$.,&7/:"&%#,&#,'%$,;&$"&$.,&9C,@7:7@&#,@"#;7/=&":&9"*/;&3%$,#7%'
!"#$ %$&'(")*
+,"-.
/$0$($1,$
23(4,34("-.
2+#)-$.56$137.
2256$13.
228&($7.93#
8"4:$.&0.($-$6"1,$;.
<*=.>+>.=&4.1&3+,$.+3.":.".41+3.
0(&#.3*$.:3($"#?
@1>$A+,"-B2$#"13+,B@,&1+,
C(&D"D+-+3=.
!.&0.
"))"(+3+&1B*
&(."))B>"=
@13$1:+3= E$1'3*.
F:G
/$,&(>
H+:3"1,$
%$1$("3+6$.23(4,34($.
@0.$A3$(1"-.($-"3+&1:*+).I+3*.
&3*$(.:&41>:.J.1&3$.
($,&(>+1'.&0.:&41>.#"3$(+"-
!*#,&D%#E,$&F"/,
G$3"9C.,#,&
H
IG&3%C&
J7$.&
/*3>,#&
#,:,#,/@,&
79&/,,;,;K&
G$3 &L+,#%''&>%@E=#"*/;&
8@"/&":&3%#E,$&%@$7+7$-A&&),/9,&":&
@'"9,;&%3>7,/$&I$#%/97$&J%-9&%#,&$.7/&
%/;&#%#,K<&C*#,&C,;,9$#7%/&%#,%<
!,#+%97+,&E,-/"$,&3%;,&:#"3&9."*$9&
":&$.,&3,#@.%/$9A&2#,/,$7@<&;79%##%/=,;&
7/9C,@$,;&73C%@$&9"*/;9A
1&$73,9&C,#&;%-9
M%@.&;*#7/=&N&
."*#9&IJ.,/&
=,"=#%C.7@%'&("/,&
@#"J,;&>-&3%#E,$&
@'7,/$9KA&G$&/""/A
!!&
!
D
K
22
&
AAA AAA O"/$7/*"*9'-A
P,'%$7"/9.7C&73C%@$&,+,/$9&
=,/,#%$7+,&#%$,A
L3/7;7#,@$7"/%'&37@#"C."/,&
*9,;&:"#&#,@"#;7/=
Q%'%/@,&,3C$7,; G''&3%#E,$&
9$%/;9&J7$.&
"';&9$-',&
>%'%/@,
))M+,/$ L';&9$-',&9$%/;&)"*/;3%#E&8/;,R7@%'&
":&"';&>%'%/@,&)-3>"'7@&":&@"33,#@,
RRR&I.K !& 1 H&3 ),S*,/@7/=&#,'%$7"/9.7C&J7$.&
!%C,#<&!'%9$7@&9.""$<&O"7/9A
).""$&=*/&37@A
Q*91 N )73C',&M+,/$ 8/;,R7@%'&":&>*9<&)-3>"'7@&":&9"@7%'&
3">7'7$-A&
RRRRRRRRRRRRRR
RRRRRR&I.K
2&7/&.79&
F"/,A
D&8/&>"#;,#&
F"/,
!!&3*::',;&
7/&:%#&("/,
T1<UV W,#-&2%#&IUX&
3,$,#&%CC#"RK
B"/=&9"*/;&J7$.&%3C'7$*;,&
,/+,'"C,&":&:%#&>*9&C%997/=&>-A&
D%$,#7%'&P,::,#,;&$"&!<&3*::',;&
7/&:%#&("/,A&Y,'7+,#-&$#*@E&
%@$7+7$-&7/&>%@E=#"*/;A
).""$&=*/&37@A
Q*9N&I2*#$.,#&
9"*/;&3%$,#7%'K
N )73C',&M+,/$ 8/;,R7@%'&":&>*9<&)-3>"'7@&":&9"@7%'&
3">7'7$-A&
RRRRRRRRRRRRRR
RRRRRR&I.K
Z.,&9%3, U<[T 2%#&INX&3,$,#&
%CC#"RK
)"*/;&D%$,#7%'&J7$.&!&
7/$,/97$-A&Z"&>,&*9,;&7/&>"#;,#&
F"/,&":&F"/,&NA&).""$&=*/A
Z#%3&1 N )73C',&M+,/$ 8/;,R7@%'&":&Z#%3<&)-3>"'7@&":&9"@7%'&
3">7'7$-A&)C,@7:7@&8@"/7@&":&!"#$%&
!%'%(("&D%#E,$C'%@,&I:#"3&&7/$,#+7,JKA&
RRRRRRRRR&I.K 22&7/&.79&
F"/,A
2&8/&>"#;,#&
F"/,
!&3*::',;&7/&
:%#&("/,
1\AX\ D,;7*3&
;79$%/@,&I1H&
3,$,#&%CC#"RK
)"*/;&D%$,#7%'&J7$.&22&
7/$,/97$-A&Z"&>,&*9,;&7/&F"/,&NA
)."$=*/&37@A
Fig. 11. Chart for sound object annotation.
In relation to the recording distance, we need to notice that, because of manylogistic issues, it was difficult to estimate the recording distance (as an example,it may not be possible to ask workers to produce sound object when we were inneed of a second evaluation).The aforementioned interviews occurred while performing the first absentmindedexploration of the place. In this way, by comparing interviewer’s perception ofthe soundscape and by practicing an informal listening, it has been easy to in-dividuate and annotate the most common sound objects: the sound of plasticshoppers (acting like a Murray Schafer’s keynote sound), the shouts of the mer-chants, the pervasive noises of vehicles. Then, a second, more analytical, stephas been performed. Preliminary data were refined by deeply investigating themarket place, that is, not only relying on auditory perception, but including vi-sual/spatial clues. In this way, starting from the identification of the sources (e.g.a mechanical device), it has been possible to identify some sound objects withinlarger sound objects. The result of the two-step analysis is a complete soundobject list. More, during the second step, each sound object was associated to asource and thus received a location in the space. At this stage, it became possibleto individuate sound zones, in particular the analysis of the soundscape has ledto five independent zones formed by distinctive elements. In Figure 10 all thezones were assigned an identifying index. Not surprisingly, sound zones respectthe main topographic features of the market area, as discussed above. Zones 1and 2 are characterized by the sounds of motor vehicles. Zone 1 is mainly char-acterized by a sound atmosphere made up of little delivery trucks, hand-cartsand gathering of packing boxes from stands. It is the only street accessible by

Simulating the soundscape through an analysis/resynthesis methodology 21
any vehicles as bus, trams, cars and motorbike. Instead, in the zone 2 there aretwo important sound features: the load area of big delivery trucks and the streetdedicated to public transport, with rail system allowing streetcar passage. Boththe zones present sounds related to bread, mint and spice hawkers. Zone 3 is adiffused area showing a mixup of sounds related to market and to street/parkingareas. This feature has required to aptly adjust the radius of sound sources todescribe its fuzzy sonic boundaries. In addition, some emissions related to thedaily process of assembling/disassembling stands are present. Zone 4 is formedby different and rare stands; it presents a less prominent sound density becausethe passage area is bigger, so the sound of walking costumers, hand-cart dis-tribution, empty box collecting process, are louder than other sound objects.More, many atypical stands are positioned in this zone, making its atmosphereunique. The motor sound is almost imperceptible, with the exception of somevery loud source (as streetcar 4). Zone 5 presents only vegetable and fruit stands:transit ways are thin and rare, and only walking people can pass through. Theshouts of the merchants reach the highest intensity and mask all the pollutionsound coming from the other zones, while the many sound signals (activitiesand voices) make the soundscape particularly frenetic, a disarranged composi-tion of sound objects making it a “pure” example of market soundscape. Aftersuch an analysis of sound objects in relation to space, we took into account iter-ated sequences of sound objects, to be modeled during the generation phase bysound subjects. In particular, five typical stand sounds have been analyzed andhave revealed complex rhythmical patterns. As an example, “shopping” showeda particular sequence of events: plastic rustle, paper rustle, clinking coins, cashopening, clinking coins, cash closing. The stands of the anchovy sellers provedto be very different from all other stands: they included sounds of metal cans,of anchovies being beaten over wood plates, of olives thrown in oil, of noisyold scales. These analytic steps drove field recordings, with the aim of creatingfor each sound object the proper sound materials. All recordings were at mono,44.100 Hz sampling rate, carried out through a DAT recorder. Many differentrecordings related to the same sound object were stored, so that the complexityof the original soundscape would not be lost. In order to minimize backgroundnoise, sound objects have been recorded with Super-cardioid highly directionalmicrophones. Super-cardioids are especially suitable for picking up quiet signalsin noisy or acoustically live environments, as they discriminate against soundnot emanating from the main pick-up direction. More, some omnidirectionalrecordings were carried out for each sound zone, to be used both as material foratmosphere and as references for evaluating the simulation. The data collectedduring the analysis and recording phases were processed in order to be insertedinto a database. The creation of sound materials proved to be a particularlycomplex task, as the recorded environment of the market was very noisy. Testswith noise reduction techniques were unsatisfactory, as a lot of signal was re-moved together with noise. As a consequence, the Acoustic discretization errorwas very high, because a relevant difference between sound objects (as identifiedby classification and analysis) and the resulting sound materials emerged. Af-

22 Simulating the soundscape through an analysis/resynthesis methodology
ter some unsatisfactory recording tests, we substantially solved the problem byusing, in the recording phase, very high directional microphones, thus ensuringa high “presence” of sound in relation to background. Acousmatic listening ofthe recorded sounds allowed to identify a large quantity of unexpected soundobjects, thus reducing the Semiotic discretization error. In some cases, this hasled to the realization of other recording sessions in the market. More, acousmaticlistening has allowed to perform data reduction. That is, different sound objects,originally identified during the analysis phase mainly with indexical strategies,have proven a substantial identity in terms of sonic features, and can then berepresented by the same sound material. The generation phase uses informationinto the database to generate sequences of sound objects. To do so, it must alsoinclude the definition of graph structures representing different sound objectsand their temporal organization (events, atmospheres, sound subjects). Graphshave proven to be capable of expressing very different behaviors, thus allowing tomodel a variety of relations among sound objects. As an example, the butcher’sknife beating the meat generates a single sound object repeated with a specificpattern, which can be expressed by a graph made of a single vertex with a loop-ing edge. Payment procedures have revealed a chain of many different soundobjects: there is a specific pattern of sound objects, involving the rustle of thewrapping paper and the shopper, the tinkling of coins, the different noises of thecash register marking the many phases of the action. In this case, a much morecomplex graph is needed.Figure 12 shows the graph structure of a sub-part of zone 2. Edges define thesequencing rules between a possible atmosphere (labelled “XAtmo...”, a fourminute recording) of that specific sub-part, and nine indexical sound events.The atmosphere describes the almost quiet state of that area, generated by thecontinuous walking of costumers and the activity of some mint hawkers. Thesound events describe activities by different vehicles. The number of repetitionsof a sound object (i.e bus, tram, delivery truck, motorbike) is proportional to itsstatistical relevance: there are four tram objects, then two for bus and trucks,and only one for motorbike. No car was noticed here. The graph is cyclic, thusgenerating potentially infinite tracks. In this case, each possible path is designedto have the same duration of the atmosphere. So the time duration of edgeconnection Edurxy between vertices are set according to the following rule:
EdurAtm2 + Edur23 + ... + EdurxAtm= V durAtm
In this way a long, looping background is continuously varied by the superposi-tion of different other sound objects. By only using nine objects it has beenpossible to represent a complex soundscape. Figure 13 depicts the graph ofa sound subject. The graph represents the behavior of a delivery truck. Thedelivery trucks arrive at that zone, unload the products, and leave back. Byconnecting three “core” objects 1b, 1c, 5 and nine sound events, it allows thesimulation of several instances of the truck. Here the sound subject reveals itssub-zone nature. The topological structure of the graph includes a start event(1) and an end event (10). The core objects are almost quiet recordings. As an

Simulating the soundscape through an analysis/resynthesis methodology 23
Street Atmosphere
3'51''.17
Tram211.57s
Bus24.73s
Bus131.46s
Tram119.09s
Tram316.86s
Tram416.98s
50
40
100Truck131.33s
Truck228.94s Moto1
5.03s25
60
30
115
30
30
90
30
50
65
20
Fig. 12. Graph sequencing rules for a sub-part of zone 2.
1B17.17s
1C13.88s
1 Start6.98s
10 End13.46s
6.5
6
63.09s
44.24s
87.29s 7
0.33s
34.92s
21.46s9
3.74s
5
3
5
5
8
56.27s
3
3
7
0.2
106
6
5
4
4.5
15/20/120/460/530
4
13
Fig. 13. Graph sequencing rules of the delivery truck sound subject.
24 Simulating the soundscape through an analysis/resynthesis methodology
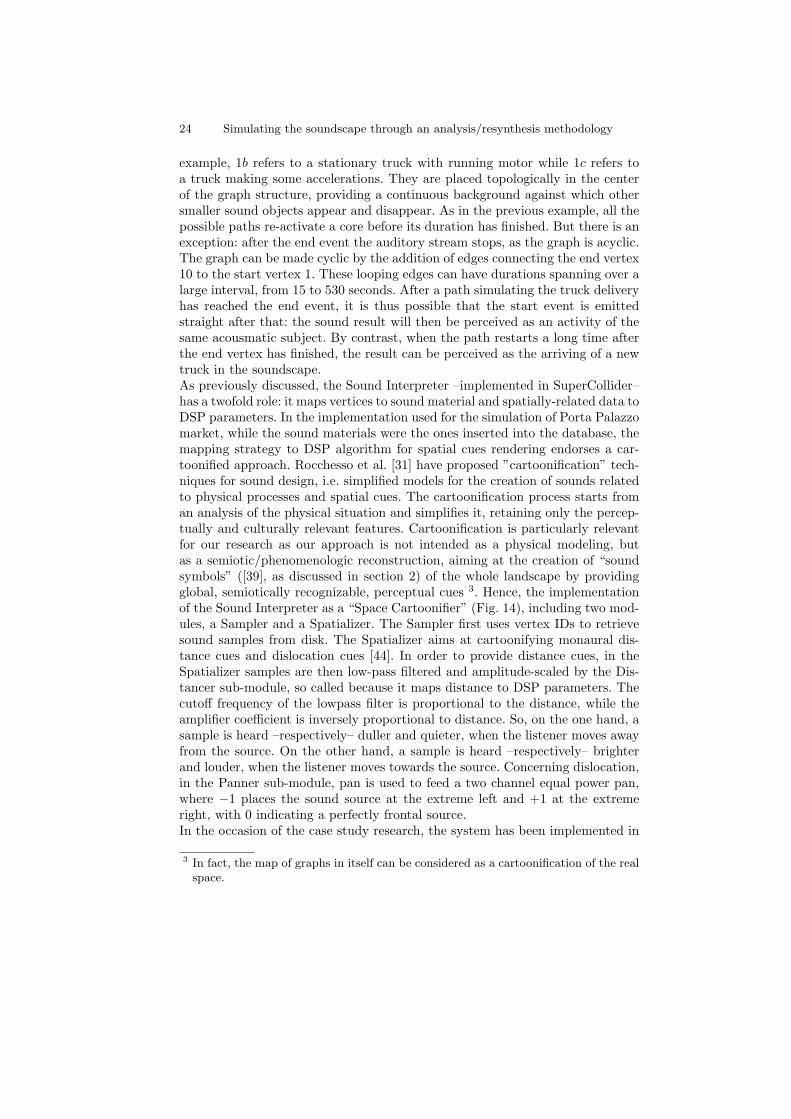
example, 1b refers to a stationary truck with running motor while 1c refers toa truck making some accelerations. They are placed topologically in the centerof the graph structure, providing a continuous background against which othersmaller sound objects appear and disappear. As in the previous example, all thepossible paths re-activate a core before its duration has finished. But there is anexception: after the end event the auditory stream stops, as the graph is acyclic.The graph can be made cyclic by the addition of edges connecting the end vertex10 to the start vertex 1. These looping edges can have durations spanning over alarge interval, from 15 to 530 seconds. After a path simulating the truck deliveryhas reached the end event, it is thus possible that the start event is emittedstraight after that: the sound result will then be perceived as an activity of thesame acousmatic subject. By contrast, when the path restarts a long time afterthe end vertex has finished, the result can be perceived as the arriving of a newtruck in the soundscape.As previously discussed, the Sound Interpreter –implemented in SuperCollider–has a twofold role: it maps vertices to sound material and spatially-related data toDSP parameters. In the implementation used for the simulation of Porta Palazzomarket, while the sound materials were the ones inserted into the database, themapping strategy to DSP algorithm for spatial cues rendering endorses a car-toonified approach. Rocchesso et al. [31] have proposed ”cartoonification” tech-niques for sound design, i.e. simplified models for the creation of sounds relatedto physical processes and spatial cues. The cartoonification process starts froman analysis of the physical situation and simplifies it, retaining only the percep-tually and culturally relevant features. Cartoonification is particularly relevantfor our research as our approach is not intended as a physical modeling, butas a semiotic/phenomenologic reconstruction, aiming at the creation of “soundsymbols” ([39], as discussed in section 2) of the whole landscape by providingglobal, semiotically recognizable, perceptual cues 3. Hence, the implementationof the Sound Interpreter as a “Space Cartoonifier” (Fig. 14), including two mod-ules, a Sampler and a Spatializer. The Sampler first uses vertex IDs to retrievesound samples from disk. The Spatializer aims at cartoonifying monaural dis-tance cues and dislocation cues [44]. In order to provide distance cues, in theSpatializer samples are then low-pass filtered and amplitude-scaled by the Dis-tancer sub-module, so called because it maps distance to DSP parameters. Thecutoff frequency of the lowpass filter is proportional to the distance, while theamplifier coefficient is inversely proportional to distance. So, on the one hand, asample is heard –respectively– duller and quieter, when the listener moves awayfrom the source. On the other hand, a sample is heard –respectively– brighterand louder, when the listener moves towards the source. Concerning dislocation,in the Panner sub-module, pan is used to feed a two channel equal power pan,where −1 places the sound source at the extreme left and +1 at the extremeright, with 0 indicating a perfectly frontal source.In the occasion of the case study research, the system has been implemented in
3 In fact, the map of graphs in itself can be considered as a cartoonification of the realspace.

Simulating the soundscape through an analysis/resynthesis methodology 25
sampleson HD
vxID: files
LowPass Filter X
cutoffFreq ~ dist ~ 1/dist
amplifier
Sampler
DistancerX
X
lateral pan
1-lateral pan
Panner
Left
Right
Spatializer
Fig. 14. Structure of a “Space Cartoonifier”.
the audio programming language SuperCollider ([45], see Fig. 15), which featuresa high-level, object-oriented, interactive language together with a real-time, ef-ficient audio server. The SuperCollider language summarizes aspects that arecommon to other general and audio-specific programming languages (e.g. re-spectively Smalltalk and Csound), but at the same time allows to generate pro-grammatically complex GUIs. The application includes both GUIs and script-ing capabilities (see Fig. 15). Graph structures are described textually (with adot language formalism, [46]) and displayed graphically. Both the activation ofvertices and the interactive exploration process can be visualized in real time.The Open Sound Control (OSC, [47]) interface, natively implemented in Super-Collider, allows for a seamless network integration with other applications. Asa typical example, the GeoGraphy application can be connected to a virtualreality engine, in order to allow an audio-visual integration of an architectonic-urbanistic space. We carried out a preliminary evaluation, and we are planning
SuperCollider Control Window
Actant Control Window
Map of Graphs GUI
SupeCollider Server Window
Fig. 15. A screenshot from the application. Here the graph editor is shown, with agraph width edge/vertex durations (background), the Actant Control Window andother SuperCollider-related GUIs for real-time control.

26 Simulating the soundscape through an analysis/resynthesis methodology
to include both experts (sound designers, soundscape researchers) and occa-sional listeners. These preliminary listening tests have given promising results.Users reported about the exploration through the interface and the navigationof the market by referring a situation that seemed slightly different from the liveexperience. Reportedly, a prominent feature lies in the generative nature of thesystem: even if based on a discrete set of sound materials, the use of graph-basedsequencing avoids the feeling of artificiality typical of sound sample looping, asthe soundscape is in continuous transformation. For what concerns the actualinteraction design, improvements are required. At the moment, navigation ismade possible by using the keyboard. Users have reported difficulties in manag-ing their orientation in the space. A smoother controlling interface is needed toensure an easier exploration of the soundscape, so that users can entirely focuson soundscape.
9 Conclusions and future work
The notion of soundscape is increasingly relevant not only in contemporary cul-ture, but also in the world of sound-related studies. Still, a rigorous definitionof the concept is lacking. By providing such a formal definition, it is possible topropose a generative model for the simulation of (not only real) soundscapes.GeoGraphy provides a theoretical framework for the modeling of soundscape interms of both temporal information describing sound time patterns (via the ver-tex/edge labeling) and spatial information encoding the site/observer relation(via vertex positioning). The proposed system is able to generate soundscapesfrom original sound materials but without relying on straightforward loops. Thishelps in preserving the typical “sound mood” of the original space: at the sametime, the resulting soundscape is not fixed, but undergoes a continuous varia-tion thanks to the graph dynamics, due to probabilistic connections. The SoundInterpreter allows to create different soundscapes from the same set of soundobjects by defining specific mapping strategies to different libraries. GeoGraphyimplementation in SuperCollider can operate interactively in real time and it canbe integrated in other multimedia applications. A major drawback of the methodis the manual, time consuming generation of multigraphs. We are planning toextend the system so to include the automatic generation of graphs starting frominformation stored in the database or from sound-related semantic repertoires(see [48]). The database itself can probably include not only sound materials cre-ated from direct recording but also samples from available sound libraries. Aninteresting perspective is to investigate user-generated, online databases such asFreesound4: in this case, the graph generation process can be governed by socialtagging.
4 http://www.freesound.org/

Simulating the soundscape through an analysis/resynthesis methodology 27
References
1. Schirosa, M., Valle, A., Lombardo, V.: Un modello per la generazione dinamicadi paesaggi sonori. In Rocchesso, D., Orvieto, A., Vidolin, A., eds.: Atti del XVIIColloquio di Informatica Musicale, Venezia (15–17 Ottobre 2008) 35–41
2. Valle, A., Lombardo, V., Schirosa, M.: A graph-based system for the dynamicgeneration of soundscapes. In Aramaki, M., Kronland-Martinet, R., Ystad, S.,Jensen, K., eds.: Proceedings of the 15th International Conference on AuditoryDisplay (ICAD2009), Copenhagen, Denmark (18—21 May 2009)
3. Valle, A., Lombardo, V., Schirosa, M.: A framework for soundscape analysis andre-synthesis. In Gouyon, F., Barbosa, A., Serra, X., eds.: Proceedings of the SMC2009 - 6th Sound and Music Computing Conference, Porto (23-25 July 2009) 13–18
4. Valle, A., Lombardo, V.: A two-level method to control granular synthesis. InBernardini, N., Giomi, F., Giosmin, N., eds.: XIV CIM 2003. Computer Music:Past adn Future. Firenze 8-10 May 2003. Proceedings, Firenze (2003) 136–140
5. Valle, A.: Geography: a real-time, graph-based composition environment. In: NIME208: Proceedings. (2008) 253–256
6. Murray Schafer, R.: The Tuning of the World. Knopf, New York (1977)7. Burtner, M.: Ecoacoustic and shamanic technologies for multimedia composition
and performance. Organised Sound 10(1) (2005) 3–198. Fontana, F., Rocchesso, D., Ottaviani, L.: A structural approach to distance ren-
dering in personal auditory displays. In: Proceedings of the International Confer-ence on Multimodal Interfaces (ICMI 2002), Pittsburgh, PA, USA, 14-16 October2002, Pittsburgh, PA (2002)
9. McGregor, I., Crerar, A., Benyon, D., Macaulay, C.: Sounfields and soundscapes:Reifying auditory communities. In: Proceedings of the 2002 International Confer-ence on Auditory Display, Kyoto, Japan, July 2-5, 2002, Kyoto (2002)
10. Rubin, B.U.: Audible information design in the new york city subway system: Acase study. In: Proceedings of the International Conference on Auditory Display’98, Glasgow (1998)
11. Droumeva, M., Wakkary, R.: The role of participatory workshops in investigatingnarrative and sound ecologies in the design of an ambient intelligence audio display.In: Proceedings of the 12 th International Conference on Auditory Display, London(2006)
12. Friberg, J., Gardenfors, D.: Audio games: New perspectives on game audio. In:Proceedings of the 2004 ACM SIGCHI International Conference on Advances incomputer entertainment technology, New York, ACM Press (2004) 148–154
13. Serafin, S.: Sound design to enhance presence in photorealistic virtual reality. In:Proceedings of the 2004 International Conference on Auditory Display, Sidney,Australia, July 6-9, 2004, Sydney (2004)
14. Hermann, T., Meinicke, P., Ritter, H.: Principal curve sonification. In: Proceedingsof International Conference on Auditory Display, 2000. (2000)
15. Butz, A., Jung, R.: Seamless user notification in ambient soundscapes. In: IUI’05: Proceedings of the 10th international conference on Intelligent user interfaces,New York, NY, ACM Press (2005)
16. Kilander, F., Lonnqvist, P.: A whisper in the woods - an ambient soundscape forperipheral awareness of remote processes. In: Proceedings of the 2002 InternationalConference on Auditory Display, Kyoto, Japan, July 2-5, 2002, Tokyo (2002)
17. VV.AA.: The tech issue ...to be continued. Soundscape 3(1) (July 2002)18. VV.AA.: Acoustic design. Soundscape 5(1) (2004)

28 Simulating the soundscape through an analysis/resynthesis methodology
19. Westerkamp, H.: Linking soundscape composition and acoustic ecology. OrganisedSound 7(1) (2002)
20. Mauney, B.S., Walker, B.N.: Designing systems for the creation and evaluation ofdynamic peripheral soundscapes: a usability study. In: Proceedings of the HumanFactors and Ergonomics Society 48th Annual Meeting-2004, New Orleans (2004)
21. Truax, B.: Acoustic Communication. Greenwood, Westport, CT (1984)22. Misra, A., Cook, P.R., Wang, G.: Musical Tapestry: Re-composing Natural Sounds.
In: Proceedings of the International Computer Music Conference (ICMC). (2006)23. LaBelle, B.: Background noise: perspectives on sound art. Continuum, New York–
London (2006)24. Mayr, A., ed.: Musica e suoni dell’ambiente. CLUEB, Bologna (2001)25. Murch, W.: In the blink of an eye. 2nd edn. Silman-James Press, Los Angeles
(2001)26. Agostini, L.: Creare Paesaggi Sonori. Lulu.com (2007)27. Augoyard, J.F., Torgue, H.: Repertorio degli effetti sonori. Lim, Lucca (2003)28. Amphoux, P.: L’identite sonore des villes europeennes, Guide methodologique a
l’usage des gestionnaires de la ville, des techniciens du son et des chercheurs ensciences sociales. publication IREC, EPF–Cresson, Lausanne–Grenoble (1993)
29. VV.AA.: Resume de l’etude de conception et d’amenagement du paysage sonore dusecteur de la Sucrerie - St. Cosmes. Technical report, Acirene–atelier de traitementculturel et esthetique de l’environnement sonore (2007)
30. Truax, B.: Models and strategies for acoustic design. In Karlsson, H., ed.: Hor upp!Stockholm, Hey Listen! - Papers presented at the conference on acoustic ecology,Stockholm (1998)
31. Rocchesso, D., Fontana, F., eds.: The Sounding Object. Edizioni di Mondo Es-tremo, Firenze (2003)
32. Chion, M.: L’audiovision. Son et image au cinema. Nathan, Paris (1990)33. Schaeffer, P.: Traite des objets musicaux. Seuil, Paris (1966)34. Chion, M.: Guide des objets sonores. Pierre Schaeffer et la recherche musicale.
Buchet/Castel-INA, Paris (1983)35. Lombardo, V., Valle, A.: Audio e multimedia. 3a edn. Apogeo, Milano (2008)36. Handel, S.: Listening. An Introduction to the Perception of Auditory Events. The
MIT Press, Cambridge, Mass. (1989)37. Bregman, A.: Auditory Scene Analysis. The Perceptual Organization of Sound.
The MIT Press, Cambridge, Mass. and London (1990)38. Bohme, G.: Atmosfere acustiche. Un contributo all’estetica ecologica. In: Ecologia
della musica: Saggi sul paesaggio sonoro. Donzelli (2004)39. Wishart, T.: Sound Symbols and Landscapes. In: The Language of Electroacoustic
Music. MacMillan, London (1986) 41–6040. Warusfel, O., Eckel, G.: LISTEN-Augmenting everyday environments through
interactive soundscapes. Virtual Reality for Public Consumption, IEEE VirtualReality 2004 Workshop, Chicago IL 27 (2004)
41. Roads, C.: The computer music tutorial. The MIT Press, Cambridge, Mass. (1996)42. Lerdahl, F., Jackendoff, R.: A Generative Theory of Tonal Music. The MIT Press,
Cambridge, Mass. and London (1983)43. Studio di Ingegneria ed Urbanistica Vittorio Cappato: 50 centesimi al kilo: La
riqualificazione del mercato di Porta Palazzo dal progetto al cantiere. Technicalreport, Comune di Torino, Torino (2006)
44. Fontana, F., Rocchesso, D.: Synthesis of distance cues: modeling anda validation.In: The Sounding Object. Edizioni di Mondo Estremo, Firenze (2003) 205–220

Simulating the soundscape through an analysis/resynthesis methodology 29
45. Wilson, S., Cottle, D., Collins, N., eds.: The SuperCollider Book. The MIT Press,Cambridge, Mass. (2008)
46. Gansner, E., Koutsofios, E., North, S.: Drawing graphs with dot. (2006)47. Wright, M., Freed, A., Momeni, A.: Opensound control: State of the art 2003.
In Thibault, F., ed.: Proceedings of the 2003 Conference on New Interfaces forMusical Expression (NIME-03). (2003)
48. Cano, P., Fabig, L., Gouyon, F., Koppenberger, M., Loscos, A., Barbosa, A.: Semi-automatic ambiance generation. In: Proceedings of the International Conferenceof Digital Audio Effeccts (DAFx’04). (2004) 1–4