shrinkage and heat penetration during the roasting of lamb...
TRANSCRIPT

------
~~ 11111 111125I 0 Q~ 1I111~~ 10 28 25
~~ 11111~1 C~ 111132 g~ 1136 ~ 11 - bull
11C_ ~I~j 1- Ilu_I
g~ I 0 L bull1 1 11
111 L ~~ 11111 18 -shy1111118
11111125 1111114 1111116 11111125 1I1111~ 11111middot6
MICROCOPY RESOLUTION TEST CHART MICflOCOPY RESOLUTION 1[SI CHART N41iONAL BliHiAU cf lANUM(j 1 A
~~~~~~~~~~~~~~ ~_ll~W)~J~
Technical Bulletin No 440 ~ = August 1934
UNITED STATES DEPARTMENT OF AGRICULTURE
WASHINGTON DC
SHRINKAGE AND HEAT PENETRATION DURING THE ROASTING OF LAMB AND MUTTON
AS INFLUENCED BY CARCASS GRADE RIPENING PERIOD AND COOK-
ING METHODl By Lucy M ALEXANDER associate specialist in foods Foods and Nutrition Division
Bureau of Home Economics and NANCY GRISWOLD CLARKI junior home economics specialist Animal Husbandry Divigion Bureau of Am~nal Industry 2
CONTENTS
Page PnlleIntroduction __ ________________________________ 1 Shrinkage and rate of lJent penetration ns in-Review of Iiterature___________________________ 2 fluenced by the method of cooklng bullbull _ ______ 15 Experimentnl procedure_______________________ 3 Oven-temperature varlations_ ______ bullbull____ 15
History of samples_________________________ 3 Meatmiddottemperature variations___ bullbullbullbull____ bullbullbull 20 Roasting methods_________________________ 4 Results oC experime is on cooking method 21 Determination of cooking losses____________ 5 Estimlting shrinkage ~ (l cooking time of lambPlnn oC experiments____________________ _ 6 nnd mutton on the basis oC experlmentel
Experimentnl error in determination oC shrinkshy results ____bullbullbullbullbullbullbull____ ______bullbull__bullbull ___ ______ 22 age nnd cooking time________________________ 7 Summary nnd conclusions ________bullbull ______ 23
Llternture cited __ bull __________________________ 21iShrinknge nnd rate oC heat penetration as inshyfluenced by period oC ripemng of the meaL__ 9 Statement of cooperation ___ bullbull _________________ 26
Shrinkage nnd rate oC heat penetration as inshyfluenced by grade oC carcass__________________ 11
INTRODUCTION
To the meat producer as well as to the consumel the cooking ualities of the different market grades are important With lamb
nd mutton as with other meats the thickness of the fat covering on carcass is one of the chief points in determining grade The grower ~
~ of course tries to put the right degree of finish on his lambs so theywill be neither too fat nor too thin Grade is a matter oj dollars and Q cents to him when he figures up his production costs and sells his lambs LampJBut even for the grower the economil importance of grade does not (l)end there He needs to know for instance how much weight his very
fat lamb loses in cooking and how much time is required to roast very small thin lamb For in the long run such points make an imshy
M pression on consumer demand and react on market prices ~ij See Statement oC CooJCrntlon p 26
Prepared in consultatIOn with other members oC the US Department oC Agriculture pUblication commiddot mittee oC the cooperntive ment investigations O G Hauklns (cbalrman) L B Burk Pnul E floweR C McPhee D A Spencer and K F Wnrner Acknowledgment is made to Elizabeth A Engstromand Meda K Ontes Cor laboratory and statistical assistance and to Lillian M Grigg nnd Esther M Lyerly for statistical assistnnce
67507deg-34-1
2 TECHNICAL BULLETIN 440 U S DEPT OF AGRICULTURE
As for consumers themselves the value of such information to them is obvious All classes-from hotel and Mstaurant keepers to dietishytians in institutions to homemakers buying food lor their own famishylies-need definite facts on the selection and cooking of meats Information that relates the finish of the raw cut to shrinknge of the cooked meat and time in the oven is part of the scientific basis of such a guide
To distributors of dressed meat and also to institutional managers who buy in large quantities and store in their own coolers the effect of ripening or aging on cooking qualititJs of meat is a matter of interest It is of course well known that ripening meat for seeral dnys makes it more tender That ripening influences cookin~ shrinkage and the speed of cooking is not so well known but it IS also of economic importance in the handling of meat
To research workers jn meat cookery knowledge of the influence of finish and ripening 0) thrinkage and speed of cooking is essen tial because these factors are inseparable from the meat itself lTnless research workers know how the character of meat affects its shrinkage and the rate of heat penetration they cannot judge the merits of different methods of cooking and make sound recommendations to homemakers institutional cooks and manufacturers of cooking equipment The fact thot 750 legs of lamb roasted by one standard method showed a range in shrinkage from 7 to 25 percent of the weight of the raw meat and in cooking time from 25 to 58 minutes per pound is striking proof of the difference made by the character of the meat itself
This bulletin represents an initial attempt to supply much-needed information on the factors that influence shrinkage and rate of heat penetmtion during roasting It presents data on 7 different methods of roasting 1185 legs of lamb and mutton ranging in grade from Choice to Cull and in I1pening period from 2 to 24 days after slaughter Included also are chemical analyses Ot 30 le~s of lamb from Choice to Cull grade carcasses contributed by the AnImal Husbandry Division of the Bureau of Animal Industry Without attempting refined correlation methods these data were used as a basis for estimating what shrinkage may reasonably be expected and how much time to allow for roastingleg of lamb or mutton of a given grade and a certain ripening period when using a particular method
The meat for these experiments was obtained through the cooperashytive meat investigations3 a national pruject which affords a unique opportunity to study a large number of samples from animals of known hIstory grown slaughtered chilled and stored under controlled conshyditions A large proportion of the meat samples was cooked by one standard method for palatability tests in connection with production e-periments and addItional meat samples were used for the studies of cooking method
REVIEW OF LITERATURE
Although research in meat cookery has been under way in the United States for more than 30 years a review of the literature disshycloses no information on the shrinkage of lamb and mutton roasted
bull UNITED STATE5 DPARTMENT OF AORICULTUR BUREAU OF ANIMAL INDUSTRY A STUDY O~ TnE FACTORS wmcII INFLUENCE TOE OUAITY AND rALATABlLlTY OF IIEAT 76 pp Ulus J027 [MlllIto graphed1
SHRINKAGE DURING ROAsTING OF LAMB 3
by con1urolled methods up to 1931 when Weber Loeffel and Peters (7) 4
published data on the shrinkage and cookin~ time of 66 legs of lamb all roasted by the standard method used ill the cooperative meat investigations5
These authors reported high con-elation between carcass grade and fat content as indicated by analysis of the wholesa~e cut commonly refen-ed to as the rack The lamb carcasses of ChOIce grade showed on the average 44 percent fat in the rack of Good grade 355 percent of Medium 305 percent of Common 28 percent There WitS howshyever j considerable variation within each grade the data showing raIges of 15 percent in any grade and 30 percent in the Medium grade
The cooking data reported by Weber and his associates show a range from 589 to 941 percent in evaporation losses with most of the values falling between 8 and 9 percent Drippings losses ranged from 303 to 783 percent and cooking time from 27 to 33 minutes per pound These investigators concluded that while losses by evaporashytion bear no definite relation to the fatness of lamb drippings losses are directly related to fatness-the fatter legs shrinking most-and that the cooking time i)er pound is slightly less for the fatter legs Unfortunately they did not publish data on the shrinkage and cooking time of lamb of stated levels of fatness or of grade desigI1ation
EXPERIMENTAL PROCEDURE
HISTORY OF SAMPLES
With the exception of nine pails of lamb le~s purchased in Washingshyton DC markets all the samples discussed ill this bulletin came from animals raised at Federal agricultural experiment stations or at the State agricultural experiment stations of Indiana Maryland Mississhysippi New Mexico New York (Cornell) Tennessee and West Virshy
g~~~ every animal raised in the experiment stations there was a record kept of breed sex age and feeding raiiion In all the 1167 legs of lamb and mutton of known history that were cooked represent 11 breeds As to sex there were rams wethers and ewes The lambs varied in age from 4 to 12 months Nineteen difierent feeding rations were used
After the animals were fJlaughtered the carcasses were graded in accordance with the standards established by the Bureau of Agri cultural Economics (1) In a total of 938 lamb carcasses there were 213 of Choice grade 463 of Good 171 of Medium 41 of Common 22 of Cull and 28 of unrecorded grade The nine mutton carcasses were distributed by grades as follows Choice 2 Good 3 Medium 3 Common 1
The legs of lamb and mutton were removed from the carcass where they jojned the loin orJust forward of the external angle of the ilium They were then sawe apart trimmed and shaped up as if for the retail market The fell was not removed
The period of ripening the meat after slaughter r~Iged from 2 to 24 days but most of it was a~ed from 4 to 9 days Wide varilttion in ripening period was unaVOIdable in cases where as many as 100 or
bull Italic numbers in parentheses refer to Literaturo CIted p 25 bull UNITED STATES DEIARTHEN~ or AGltlCULTUnE DunEAU OF I1mlE ECONOMICS AND BUREAU OF
ANIMAL INDUSTRY METHODS or COOKING AND TESTING KEAT FOit PALATABILITY 36 pp ilIus 1933 [MimOOi1upbed)
i f 4 TECHNICAL RULLETIN 440 U S DEPT OF AGRICULTURE
more lambs were slaughtered at a time and a leg from each sot aside for palatability tests because the capacity of the cooking and judgshying laboratory was limited to eight legs a day A special study of the effects of varying the period of ripening was made on paired legs from the same carcass in which one leg was cooked shortly after slaughter and the other leg held back for longer ripening
ROASTING METHODS
All the legs of lamb and mutton were roasted by one of the following Beven methods differing from each other in oven temperatures and in the stage of doneness to which the meat was cooked as shown by a roast-meat thermometer
Roasting method 1 By far the greatest number of samples was toosted by the standard laboratory method adopted for leg of lamb in connection with the cooperative meat investigations since the meat was cooktld for palatability tests as part of production experishyments According to this method here designated as methocll the leg of lamb or mutton was prepared fol the oven without salt pepper or flour Each leg was weighed and then laid with the cut-flesh and pelvic-bone side up and the skin side down on a wire rack in a weighed roasting pan A roast-meat thermometer was inserted to the center of the thickest portion of each leg and kept there throughout the cookshying to show when the desired stage of doneness was Imiddoteached The leg prepared in this way was seared fol 20 minutes at an average oven temperature of 265 0 C after which tle cooking was continued at 125deg until the meat thermometer registered 76deg when the leg was removed from the oven and weighed The meat was roasted entirely without a lid and without water added to the pan The slow finish at 125deg yields It uniformly cooked product deemed especially desirshyable for jUdging
The other methods of roasting held in most cases to be better adapted to household conditions were based on method 1 but with the exception of method 7 varied from it in the use of higher oven temshyperatures or higher meat temperatures resulting respectively either in faster cookiug or more thoroughly cooked meat At 76deg Clamb is between medium and well done and the juice is pink Lamb is well done at 83deg and is probably preferred this way by most people
Roasting method 2 The meat was seared for 20 minutes at 265deg C as in method 1 but finished at 150deg to 76deg internal temperature
Roasting method 3 The meat was seared as in method 1 but finshyished at 175deg C to 76deg internal temperature
Roasting method 4 The meat was roasted at 175deg C without searing to 76deg internal temperature
Roasting method 5 The meat was either seared as in method 1 or for 35 minutes at 250deg C and finished at 125deg to 8~ltJ imernal temperature
Roasting method 6 The meat was seored as In method 5 but finished at 175deg C to 83deg internal temperature
Roasting method 7 The meat was roasted at 125deg C without searing to 76deg internal temperature
For 011 e~periments the ovens were gas heated indirect in action ventilated equipped with glass doors and temperature regulators Portable thermometers in the same relative position in the several
bull
5 SHRINKAGJil DU1IING ROASTING OF LAMB
ovens registered the oven temperatures which were read through the glass doors
The rate of heat penetration was determined by the number of minutes per pound reguITed in cooking Total time in minutes includes thfl searing penod The number of minutes per pound was calculated by dividing the total time by the weight in pounds of the uncooked leg
DETERMINATION OF COOKING LOSSr~
In these investigations shrinkagfl is defined as loss of weight during cooking The shrinkage of each leg was determined as total loss of weight and alSOl as two fractions of the total namely the panshydrippings loss and the 103s due to evaporation of water Total shrinkshyage IS the difference between the weight of the leg before cooking and immediately on removal from the oven Drippings loss is the weight of the mixture of fat and juice which cooks out of meat and collects in the r9asting pan Loss of weight due to the evaporation of water is the difference between total loss of weight and the weight of the drippings Unless otherwise indicated the shrinkage of each leg was calculated as percentage of the weight of the raw leg trimmed with the fell left on and including bone
While loss of weight of meat during cooking has value as such and can be discussed without reference to its fractions it is frequeuroiltly desirable to know what constituents of the meat went into the makeshyup of the loss of weight and how the original composition of the meat was modified The only way to do this with precision is by chemical analysis of the meat raw and cooked and of the pan drippings Forshytunately considerable work of this type was done by Grindley and Mojonnier (3) and more recently by McCance and Shipp (4) and while not on roast leg of lamb the outstanding results on cooking losses are applicable to any kind of roasted meat On the basis of principles established through chemical analysis it is possible to digcuss the evaporation and drippings fractions of the loss of weight as approishymations to losses of the chief constituents of meat during roasting
McCance and Shipp distinguish between shrink and loss of weight They define shrink as reduction in volume brought about by the action of heat on meat proteins According to these authors the Joss of weight of flesh (beef and fish) during roasting is made up of water fat protein and salts The loss of weight due to evaporation accounts for nearly all of the water lost during roasting in dry air that is in an uncovered pan in a ventilated oven The rest of the water is lost by dripping into the roasting pan The pan drippin~s contain also fat salts and protein but the loss of salts and protem is a small proportion of the loss of weight when flesh is roasted in dry air according to the results of chemical analysis Most of the loss of weight is therefore due to loss of water and of fat
On comparing the cooking losses obtained by the writers methods with those determined by chemical analysis it appears that the evaporation fraction of the loss of wei~ht is less than the true water loss but is a reasonably good approxImation to it Pan drippings usually are mainly melted fat but it is probabJe that the composition of the drippings varies considerably hence this fraction of the loss of weight has no definition in terms of exact amounts of fat water protein and salts Althou~h exactness cannot be claimed for losses of meat constituents determmed as evaporated water and as pan dripshy
TEC~CAL BULLETIN 440UBDEPT OF AGRICULTURE
pings the writers believe that when applied to mea~ as it is cooked by practical methods these rough estimates of the water and fat loss have more value than loss of weight alone as a guide to the changes in volume nutritive value and palatability brought abolt by roasting
The reduction in volume of meat on cooking is of considerable importance because it affects the appearance of the cooked cut and the number of servings obtainable from it According to McOance and Shipp loss of weight during cooking is a close measure of reduction in volume only for very lean meat for which the loss ito mostly water The ordinary roast of course contains fat as well as lean and as is well known loses water and also melted fat during cooking - The presence of fat complicates the relationship between loss of weight Bnd reduction in volume Although the volume of servable meat in a roast may not be reduced appreciably by the melting out of a conshysiderable portion of the fat it may be affeeted noticeably by the loss of water In order then to form a picture of volume changes estishymates of fat and water fractions of the loss of weight are needed even if close relati9nships are not to be expected
For studying changes in nutritive value through cooking losses insofar as this is possible estimates of water and fat fractions of the loss of weight though rough obviously have merit Water loss does not represent loss of nutritive value but it does affect the concenshytration of constjfuents left in the cooked meat III this connection attention is called tu the limitations of indirect determination of the food value of a piece of cooked meat since Grindley and Mojonnier (3) and also McOance and Shipp (4) state that little is known d the portion of the cooking losses contributed by skin and bone Pan drippugs made into gravies and sauces do not represent a loss of nutrients Nevertheless under sorile circumstances it is desirable to know how much of the loss of weight went into pan drippings This is particularly true when the drippin~s contain more fat than can be used Under these conditions there IS a loss of nutritive value At the same time it is scarcely fair to attribute this waste to cooking because not all this fat would have been eaten even if it had been retained by the roast Under any conditions excessively fat meat is wasty
The palatability of a piece of cooked meat depends to some extent on its juiciness Whereas loss of weight in itself may have little meanshying as a guide to juiciness in determination of the palatability of meats the evaporation fraction serves as an indicator of the quantity of juice as at present judged by organoleptic tests
PLAN OF EXPERIMENTS
When planning experiments to show the effect of grade of carcass period of ripening and method of cooking on shrinkage and cooking time everything possible was done to reduce the number of variables In the studies of the influence of carcass grade the same cooking method was used on the same cut (the leg) from carcasses of diflerent grades ripened to approximately the same extent To show the inshyfluence of ripening or of cooking method the meat samples were as nearly uniform as possible that is wherever possible paired legs from the same carcass were used the left legs being treated one way and the right legs another While such methods are tedious it is believed that they furnish the most information with the least
7 SHRINKAGE DURING ROASTING OF LAMB
effort and that for comparing methods of cooking or otherwise handshyling meat a small number of pairs is worth more than a much larger number of unrelated cuts Preliminary to the tests on carcass grade1
ripening period and cooking method 93 pairs of legs of lamb were cooked by methoa 1 to see how closely results on shrinkage and cooking time could be duplicated for the same meat of the 5ame ripening period cooked by the sarna method
Summing up the order and arrangement of experiments were as follows
1 Determination of allowance for errol in data on shrinkage and cooking time as revealed by 93 pairs of lamb legs cooked by method 1
2 Determination of the effect on shrinkage and cooking time of ripening 60 left legs of lamb 2 to 6 days and the 60 corresponding right legs 12 to 21 days all cooked by method 1
3 Determination of the effect of carcass grade 011 shrinkage and cooking time-first for a large quantity of lamb grading from Choice to Cull cooked by method 1 then for small groups of lamb of a range of grades cooked by methods 2 3 4 5 and 6 and fmally for mutton of severaJ gmdes cooked by methods 1 2 and 3
4 Determination of the effect of cooking method on shrinkage and cooking time using as far as possible pl1irs of legs of lamb and mutton for comparison of other methods with method 1
EXPERIMENTAL ERROR IN DETERliINATION OF SHRINKAGE AND COOKING TIME
In order to decide from experimental data whether shrinkage 8ld
cooking time really are influenced by carcass grade by ripening period or by method of cooking it is necessary first to determine what conshystitutes a significant difference in results Of course every determinashytion of shrinkage and cooking time is subject to some errur It is therefore well to know how great this experimental error may be because unloss diflerences between averages exceed their error they cannot be regarded as significant
For a measure of errol in the data the diflcrence between duplicate determinations of shrinkage and cooking time was used To make the duplicate determinations corresponding lefG find right legs of lamb from the same carcass were cooked on the same day Theoretically the right and left of each matched pair of lamb legs cooked on the same day by the same method should yield identical results Where results are not identical the discrepancies are here regarded as due to errol in the experiment The study was conducted as follows
The paired legs from 93 lamb carcasses were selected for the test For each of 2 consecutive yea)s the lamb was cooked by method 1 over a period extending from 5 to 18 days after slaughter Data on shrinkage and cooking time w~re obtamed separately for the left legs and for the rights After cooking the lamb legs were jud~ed for palatability Analysis of the data on palatability has been published by Spencer (5)
For each of the 93 pairs the difference between the left and the right leg was calculated on weight before cooking shrinkage during cooking and cooking time and the diflerences averaged For the 93 left le~s and the corresponding rights the weights before cooking the shrinKage during cooking and the cooking time were averaged
--
TECHNICAL ~ULLETIN 440 U S DEPl OF AGRICULTURE8
For each itemtte difference between the averages was calculated and thestandard error of the difference worked out according to the
formula OM= J-1 by the method which Fisher (2 pp 112-114)
quotes from 1 Student The standard deviation 0 is that of the series of differencos between corresponding left and right legs calcushylated in the usual way as the root-mean-square of the dcnations from the average of the series and n is the number of samples used 93 The data are presented in table 1
TABLE l-Comparison of determinations of shrinkage and cooking time on corresponding left and right legs of lamb each pair ripened the same period and all cooked by the same method (method 1 seared 20 mimttes at 265deg C fini8hed at 125deg to 76deg internal temperature)
-Shrlnkn~e during rQostinl( Oooklng time
WeightNumber nnd clemiddot 01 tinmiddot
scription 01 snmples cooked PerleI( l~nporntlon Drippings Totnl TOlnl pound
Gramamp Grams P~rcrnt Grambull Percent Gramamp IPercent 1muteR Minutc93 leCt ____bull_______ bull 24411 211 E6 112 45 321 131 170 315 93 right _ 2438 211 86 114 46 170 316 DlfIer~nee +11 0 0 -2 -1 ~~ I ~i 0 -1 Standard (levlntion plusmn631 plusmn112 plusmn175 plusmn246 1067 plusmn573 1230 plusmn197 plusmn3J8 Standard error 166 143 plusmn18 plusmn26 110 plusmn60 i-25 plusmn21 1-42
According to Fishel two averages are not significantly different unless the diflerence between thrm is at least twice its standard error In no case were the averages of the 93 pairs of duplicate determinations significantly diflerent However according to the values found for standard errors in this study the averages of duplicate determinations of shrinkage and cooking time mnde on 93 pairs of legs of lamb could vary by chance nlone up to 036 percent evap01l1tion 020 percent drippings loss 050 percent total shrinkage and 084 minutes per pOlmd cooking time These values are held to be significant differences )etween two averages each of which is based on 93 samples
Since 93 is an unusually large number of samples in experiments on cooking method the standard errors for 20 and for 10 were calculated by dividing the standard deviations as found for the 93 by the square root of 19 and of 9 respectively Following are the standard errors calculated for averages of 20 samples Weight of uncooked leg plusmn 145 grams weight lost by evapgtratioIl plusmn 95 grams plusmn 040 percent weight lost by pan drippings plusmn 57 grams plusmn 022 percent total loss of weight plusmn131 grams plusmn055 percent cooking time plusmn45 minutes plusmn 091 minutes ]Jer pound For averages based on lO samples the calculated standard errors are as follows Weight of uncooked leg plusmn 210 grams weight lost by evaporation plusmn 138 grams plusmn 058 pershycent weight lost by pan drippings plusmn 82 grams plusmn 032 percent total loss of weight plusmn 191 grams plusmn 080 percent cooking time total plusmn 66 minutes plusmn 133 minutes per potmd Allowance up to twice these standard errors should be made for experimental error when comparing averages based on 20 or 10 samples respectively
In generalizin~ from the results the writers realize that if data were available on an mfinite number of groups of the composition of those studied differences between duplicate determinations of shrinkage and
SHRINKAGE DURING ROASTING OF LAMB 9
cooking time could not be expec ted to be exactly the same as those found in this experiment At the same time these measures of experishymental error are believed to be reasonable They are useful throughshyout this bulletin as checks on the significance of differences to be ascribed to carcass grade ripening or method of cooking Such checks are of course particularly helpful in judging the significance of results when averages are the onl y data reported as frequently happens
The experimental error as estimated may seem large Much of the variation in shrinkage and cooking time between left and right legs was due to the manner in which they were shaped up as retail cuts for if the fat covering over the inside round was stripped off more closely from one leg than the other there was a greater ddference in the shrinkage and cooking time than when both were trimmed off to about the same extent Slower cooking and increased shrinlmge are direct results of excessive trimming Apparently other factors also are involved in the differences between data from corresponding left and right legs cooked on the same day by the same method
It is emphasized that this study covers but one method of roasting pairs of legs of lamb Whether allowances for experimental error would need to be as large with other cooking methods cannot be stated but since the low oven temperature of 1250 O exaggerates the role of factors in the meat itself that retard heat penetration smaller experishymental error might be expected if higher oyen temperatures were used
SHRINKAGE AND RATE OF HEAT PENETRATION AS INFLUENCED BY PERIOD OF RIPENING OF THE MEAT
During the course of the study to determine experimental error in the data on shrinkage and cooking time it became apparent that the length of time lamb legs are ripened after slaughter aflects the cooking losses and the rate of heat penetration Therefore lest differences due to ripening be erroneously attributed to carcass grade or to cooking method a special study was made of this
Sixty pairs of lamb legs were chosen and the lefts cooked within 2 to 6 days after slaughter while the corresponding rights were held from 8 to 18 days longer All the legs were cooked by method 1 already described The cooked meat was judged for palatability and the effect of ripening on the tendernes~ was reported by Warner and Alexander (6)
The data on shrinkage and cooking time for the corresponding left and right legs were handled as described on page 7 and the results are shown in table 2
67507deg-34-2
---------
-----------------------
----------
10 TECHNICAL BULLETIN 440 U S DEPl OF AGRICULTURE
TABLE 2-Effect of ripening on shrinkage and cooking time of pairs of leg8 of lamb averaged for lefls and rights ripened for different periods and all cooked by the 8ame method (method 1 8eared 20 minute8 at 2650 0 fini8hed at 1250
to 76deg internal temperature)
Shrinkage during ronstlng Tnterml Weight oCNumber nnd drscription oC Agn~ Cookinghctwe~n uncookedsnmples period timetests leg Evnpornmiddot Drip
Totnltlon pings
DRV DRI13 Grams Gram~ OR1II3 Oram MinUeuros3 lettbullbullbull__ _____bull___ bull___bullbull middot1 S 1027 102 60 20t tOO3 rlght_____ bullbull_bullbullbullbullbull___bullbull_bullbull 12 __ - 1871 164 78 2112 154
3 leCtbullbull _ __bullbullbullbull _bullbullbullbullbullbullbull __ _ 3 0 2420 270 150 420 20B 3 rlght___bullbullbullbull__bullbullbullbullbullbullbullbullbull 12 - _---- - 2271 115 102 276 184
8lett__ bullbullbullbull__ 3 10 2370 2M 143 406 2078 rlgl1tbullbullbull_______ bullbullbullbull__ _ 13 -- -- 2363 200 132 341 193
SlcCt _____bullbullbullbullbullbullbull_bullbullbullbull 4 10 2114 220 U3 332 181 8 rlght __bullbullbullbull__bullbullbull__bullbullbullbullbullbull__ 14 __ - - 2UOli 203 108 311 181
6 10 lRRO 178 57 201 100~ ~T~k==== 16 --_ _- - J800 100 81 240 1~2
8 leCtbullbullbullbull______ 2 17 2338 2gt6 144 Int 1018 rlgl1L_______ _bullbull_bullbull _bullbull 19 2122 lfi2 1I7 2nO 151- ------ 8 leIL__ bullbull ___ bull __bullbullbullbullbull__ 3 17 22IiO 217 117 3a4 180 8 rlghL__ ____ bullbullbullbull 20 - -- 2024 174 III 268 156 1Ilolt______bullbull__bull ______bull 4 17 2025 1117 III 287 173 II rlght __ bullbull__ __ __ bullbullbull 21 _- - 1832 137 82 218 140
3 lott___bull _______ bullbullbull __ bullbull 3 18 2124 251 134 385 1933 rIghtbullbullbull_____________ 21 --_ -- 2222 151i 126 2BI 160
Averago ~IO lect) bull ____bullbullbullbull 4 13 ~171 22ll 1t5 338 184 Avernge 60 right) 17 --- - 2042 169 101 270 102
Dltlerencobullbull___ bullbullbull _bullbull ____ --- -- +129 +54 +14 +(l~ +22 Stnndard rrror oC d[(lorence __ 1134 I~3 IJ t 172 125~
Testing the significance of the differences between the nverllges of 60 left und 60 right legs the value t (2) was calculated for each factor by dividing the difference by the respective standard error Since in every case t exceeded 2576 and since for samples larger than 30 only one vnlue in a hundred will exceed 2576 by chance the differences between the averages are clearly significant
On comparing the results in table 2 with those in table 1 it can safely be stated that longer ripening-made the differences and that lamb lost less in weight during roasting and took less time to cook as the ripening increll1sed However since the meat lost weight all the time it was in cold storage there was less to cook the longer the ripening continued This fact has to be considered in showing the effect of ripening on shrinkage as percentage of raw weight and on cooking time as minutes per pound
To show the effect of so many days additional ripening as for example the average interval of 13 days in table 2 on the percentage of shrinkage and on the number of minutes per pound required to cook the lamb the base should be the raw weight of the corresponding paired legs when the first set was cooked The right legs were not weighed at the time the lefts were cooked However table 1 shows that left and right legs of lamb did not differ sitgIificantly in raw weight when the same ripening was given to roth lO for an approxishymation of the effect of 13 days additional ripening as reIlectcd in percentage of shrinkage during cooking the average IRW weight of 60
11 SHRINKAGE DURING ROASTING OF LAMB
left lega ripened 4 days namely 2171 grams was taken as the base bull for the 60 rights also) and the following results were obtained Evaposhy
ration loss 103 and 78 percent drippings loss 53 and 47 percent total loss 156 and 124 percent Similarly) the coocring time as minutes per pound was reduced from 38 to 34 by the extra 13 days of ripening given to the right legs
While tIns method of calculating brings out most forcefully that increased ripening reduces cooking shrinkage and cooking time pershycentage of sluinkage and cooking time in minutes pel pound are usually figured on the basis of the raw wei~ht of a piece of meat at the time it is cooked Comparing the relatIve sluinkage and rate of heat penetration of 60 left legs of lamb lipened 4 days and 60 corshyresponding right legs ripened 17 days on the basis of the raw weight of each group at the time it was cooked respectively 2171 and 2042 grams the following values were found EvaporatIOn loss 103 and 82 percent drippings loss) 53 and 50 percent total loss 156 and 131 percent cooking time 38 and 36 minutes per pound This method of calculation also showed that as lamb was ripened longer it shrank relatively less during roasting and cooked faster in proportion to its weight
The figures also showed a greater reduction ill the evaporation loss during roasting than in the drippings loss as lipening progressed Tlns is reasonable because the meat dlied out in storage and its water content became lower When cooked the 60 legs of lamb ripened 4 days weighed on the average 1833 grams and the correspondmg 60 ripened 17 days weighed 1772 grams The difference between the roasts when cooked 61 grams was less than before cooking whlch was 129 grams
SHRINKAGE AND RATE OF HEAT PENETRATION AS INFLUENCED BY GRADE OF CARCASS
For detailed studies on the influence of carcass grade on shrinkage and cooking time the writers chose from production experiments a sample of 749 legs of lamb including 168 of Choice 389 of Good 142 of Medium 32 of Common and 18 of Cull grade From the statistical standpoint larger samples of Common and Cull grades would be preferable but the production experiments yielded only a smail proshyportion of lambs in these lower grades
Included in thls sample of 749 are 32 left legs from the 93 pairs in table I 13 lefts from the 60 pairs in table 2 8 lefts from the pairs cited below and 696 lefts not discussed elsewhere in thls bulletin
The ripening period fOl the 749 lega ranged from 2 to 24 days after slaughter with from one-half to two-thhds of the legs ripened from 4 to 9 days and only one-seventh beyond 15 days When avera~ed for the Choice Good Medium Common and Cull grades the riperung periods were respectively 9 10 11 10 and 10 days
All 749 legs were cooked by method 1 already described Data on sluinkage and cooking time averaged for the five different grades are given in table 3 The standard errors were calculated by the formula
(1M = ~ The standard deviation (I inthls table is the square root -yn-l
of the sum of the squared deviations from the meap divided by the number of legs cooked n
12 TECHNICAL BULLETIN 440 U S DEPT OF AGRICULTURE
TABLE a-The effect of carca8S grade on 8hrinkage and cooking time of legs of lamb when roasted to specified internal temperatures
METHOD 1 OVEN 2650 O FOR 20 MINUTES 1250 FOR FINISH MEAT 760
~
Shrinkage during roasting Cookingwel~htofOarcass grade Samples time per uneoo ed leg poundEvaporation Drippings
Oholce________________________________ Number Grams Ptrcent Percent Minutes Good __________________________________ 168 2 489124 9 911014 631011 34310 n Medlum_______________________________ 389 2 250In 8 891 09 531 07 3411 17 Common ______________________________ 142 1805132 1 89l 14 371 11 3461 n Cull _________bull________________________ 32 1 498l53 2 031 20 231 18 373l 72
18 11171580 1021 44 121 09 40011 38
MErHOD 2 OVEN 2650 C FOR 20 MINUTES 1500 FOE FINISH MEAT 760
Cholce __ ------------ __________________ 1 285 nOGood______bullbull_____________bull__ bull_________ 10812288 8312 1 92 03 n6Common____________ bull_____ bull_____ bull___ _ 1412 II 4 28 319 ~ I
METHOD 3 OVEN 2650 C FOR 20 MlNUTES 1750 FOR FINISH MEAT 760
Cholce_____ bullbullbull __ ___ _________________ _ 2 2556 108 71 202 2 2230 112 74 221
Good _______________________ bullbull ______ __ M edlum_ _____________ ____ bull___ bull____ bull 3 1640 118 41 254Common ____ bullbull ______________________ __Cull__________________________________ _ I 902 112 16 312
3 1027 118 13 264
METHOD 4 OVEN CONSTANT A 1750 C MEAT 760
Cholce______________________________ __ Good______________________________bull __ _ 13815 2295 67 273 Medlnm_______bull____________ __ bull______ _ 5 2236 145 65 289
7 1701 136 57 294CommOll_ bull __________ bull ___ bullbull _ ____ bullbullbull __ 4 1100 27 325 4 945 93 20 344
Cull bullbull __ bullbull_____________ _____________ 136
METHOD 5 OVEN 2650 C FOR 20 MINUTES 1250 FOR FINISH MEAT 830
Cholcebullbull____ -- -- -- -bullbullbull_---- __ --- __ -- --I 307 604Good_____ bull_____ bull _ ____ bull __ bull __ bull______ bull__ 1921 80122050 1 1amp8 77 644~I METHOD 6 OVEN 2650 C FOR 20 MINUTES 1750 FOR FINISH MEAT 830
349 2691871 822ggg~~- ~ 2097 1 200 72 261
Additional tests of the influence of carcass grade on shrinkage and cooking time werc made on smaller groups of both lamb and mutton using other methods of cooking The lamb legs of different carcass grades cooked by method 2 were ripened for 4 to 5 days Those cooked by mcthod 3 were ripened respectively forChoicetIUough Cull grades 8 8 9 7 and 7 days Of the 25 legs of lamb cooked by method 46 were purchased at a Washington DC market and thell ripenin~ periods were not known but for the remaining 19 the ripenshying penods averaged as follows 4 Choice grade 8 days 3 Good 8 5 Medium 9 3 Common 7 4 Cull r 8 Of the iamb legs cooked by methods 5 and 6 those of Choice grade were ripened 8 days and of Good grade 7 days Data are shown in table 3
_________________________________
SHRINKAGE DURING ROASTING OF LAMB 13 Table 4 presents the data for mutton of different grades cooked by
methods 1 2 and 3 Of those cooked by method 1 ripening periods averaged 7 dllys for the Ohoice grade 7 for Good 5 for Medium and 5 for Common Mutton legs cooked by method 2 were ripened 45 4 and 5 days respectively for Choice Good Medium and Common grades RIpening periods for mutton legs cookeltl by method 3 avershyaged 9 days for ChOice grade 8 for Good and 6 for Medium
TABLE 4-The effect of carcass grade on shrinkage and cooking time of legs of mutton when roasted to specified internal temperatures
METHOD 1 OVEN 265deg0 FOR 20 MINUTES 125deg FOR FINISH MEAT 70deg OL __
Shrinkage during roasting WelghtoC Cooking
Carcass grade Samples uncooked time por log Evaporation Drippings pound
Cholco________________________________ Number Grams Percent Percent Minutes Oood__________________________________ 2 108 61 3023484Medlum_______________________________ 3 3146 102 40 270 Oommon _____________________ bull________ 3 2716 130 31 327
1 2060 142 4 344
METHOD 2 OVEN 265deg C FOR 20 MINUTES 150middot FOR FINISn MEA 76deg
II 282OoodOholce ___ -----_-- __ ----_--_-- --_-- -- ___I 3 5371 81 I 25032middot12 140152 I 47Medlum______________________________ _ 201)1 144 27 261Common _____________________________ _ 2816 20 U 10 271
METnOD 3 OVEN 205deg C FOR 20 MINUTl~S 175deg FOR FINISH MEAT 76deg
~I 256 180
3 ib5 190Oholce__ ----- _--- ------- _____________1Oood _________________________________ _ 1481 071 Medlum____________________________ _ 2873 152 35 D 9
3028 1 47
The significance of differences between the gmdes in thc first section of table 3 was determined by the method of Fisher (2p 108) To comshypare any two means the standard errors were first sqUl1red to obtain the variances In making use of the proposition that thc variance of the difference of two independent variates is equal to the surn of their varishyances the two variances were added Thcn extmcting the square root of this sum the standard error of the differences between the means was obtained and from this t calculated as usual For significant results t should be at least 2 In the other experiments reported in tables 3 and 4 the number of samples iri each grade was very small so the standard errors of the means were not calculated Instead the data for the different grades were examined to see if they seemed to show the same trend as the larger samples and then the differences between grades were roughly checked by comparing them with the allowances made for experimental error of 10 samples as determined on page 8
With few exceptions the data in tabcs 3 and 4 show the same genshyeral trend in the relation of carcass gmde of lamb and mutton to shrinkage and cooking time independent of the method of cooking
Drippings loss in percentage WitS definitely reinted to cnrcnss grade Choice grnde 111mb nnd mutton lost the most itS drippings and as the carcass grade became poorer the drippin~s loss decreltsed In table 3 method 1 where there are mltny sltmples III each gmde the decline in drippings loss was from 1 to 16 percent from grnde to grade below Choice These differences are significant but the slighb differshyences between drippings losses of Choice Itnd Good gmde lltmb when cooked by methods 3 4 and 5 Itre not in themselvessignificanb
14 TECHNICAL BUllLETIN 440Ud DEPT OF AGRICULTURE
Shrinkage due to evaporation loss was not consistently related to carcass grade In table 3 method 1 the data show ~bat Ohoice Good Medium and Common grade lamb did not differ significantly in evapomtion loss but that Cull grade lamb lost slightly more The next largest sample W13 the 25 legs of lamb roasted by method 4 The data for this comparison of Vades indicate no significant differshyence in evaporation loss of ChOIce Good Medium and Common grade lamb Here a~ain Cull grade lamb differed from the other grades but this time It lost less than they did by evaporation
The rateof heat penetration was influenced by the carcass grade where tJdcn grade was reasonably well represented According to the (taLa in table 3 there was no signific~nt difference in the number of minutes per pound required to roast Choice Good and Medium grade lamb by method 1 but Common and Cull grade lamb took longer to cook in proportion to the weight The same result is suggested by the data on 25 legs roasted by method 4 In the other grade comshyparisons in tables 3 and 4 results are not considered significant because of the smaH number of samples
Since tle same method of cooking was used in each group of carcass grade comparisons shown in tables 3 and 4 and since the ripening periods were kept much tho same on the average1 the causes of variashytion in shrinkage and cooking time associated With carcass grade are not to be sought in cooking method or in ripening According to Weber and his associates en the fatness of lamb determines the fat loss on cooking Of course the legs that were cooked could not be analyzed for fat content The corresponding uncooked legs were not analyzed either However there was recorded at the time of cooking a visual estimate of the relative fatness of each leg of lamb and mutton These judgments of finish were made by the writers following the system started in 1927 by D A Spencer of the Animal Husbandry Division of the Bureau of Animal Industry On the basis of appearshyance the legs of lamb ranged in fatness from an extremely large amount to none visible and were graded in five classes When the finish grades of the legs were compared with the official grades for the carcasses for 924 lambs a sample which included many of those disshycussed here the coefficient of linear correlation was +078 plusmn 0009 indicating that the visible fat on the leg was closely related to the carcass grade of lamb
Data on the fat and water 00ntent 01 a small number of lamb legs from Choice Good Medium Common and Cull ~rade carcasses have been contributed by the Animal Husbandry DiVIsion of the Bureau of Animd Industry and are summarized in table 5
TABLE 5-TVater and fat content of lamb legs of Choice Good Medium Common and Cull grades determined by chemical analysis and expressed as percent of weight as p1lrchased
Wat~r content Fat content Carcass grade Samples 1-----------1middot-------
Average Range Average Range----------------1---Number Percent Percent Percent PercentChoico_______________________________________ _
7 51 8 486-548 182 152-214 Medlum_______________________________bullbull_____ _ Good_________________________________________ _
9 537 498-575 147 llH75 7 544 492-585 116 102-134Common____bullbullbull ____________bull_______ bull__________ 2 539 529-549 82 81- 84CulL___bull ____ bull________________________________ bull 5 552 52 0-58 1 47 14- 74
--------------------------------shy
15 SHRINKAGE DURING ROASTING OF LAMB
According to these data the fat content of leg of lamb as purchased varies directly with the carcass gmde The higher the grade the more fat there is in tmiddothe leg The water content of leg of lamb as purchased varies less consistently with carcass grade but from these data appears to be ~reater for Cull lamb than for Choice
On cOlhpanng drippings and evaporation loss of leg of lamb of the different carcass grades as shown in table 3 respectively with the fat and water content as shown in table 5 it appears that composition determines what the character and relative amount of the shrinkage will be other things such as ripening and cooking method being equal
The range in water and fat content of lamb llg in table 5 indicates considerable variation within grades consequently it is to be expected that shrinkage also will vary within grades A good deal of variation existed in each grade as shown by the standard er~or of the means of the large samples (table 3) Averages based on a small number of samples therefore cannot be expected to be the same as if a large number 11au been used
It is unsatisfactory to attempt to explain the rate of heat penetrashytion by the chemical composition of meat The weight of a leg of lamb as well as the fat find water content undoubtedly influences the numshyber of minutes per pound required to cook it There appears to be a considerable range in fat content and in weight over which these factors do not influence the rate or heat penetration as for example in
Choice Good and Medium grades However with a sharp decrease in fat content and in weigl1t such as found in either Common or Cull lamb the speed of cooking declines
As far as it is possible to make comparisons the results are in general accord with those reported by Weber Loeffel and Peters (7)
SHRINKAGE AND RATE OF HEAT PENETRATION AS INFLUENCED BY THE METHOD OF COOKING
Seven methods of roasting lamb and mutton were employed including five different oven temperatures and two meat temperashytures or stages of doneness These methods have already been deshyscribed (p 4) In comparative tests methods 2 to 7 were always checked against method 1 since it is the one by which the largest number of samples were cooked Wherever pOSSIble both legs from the same carcass were used the leg from one side cooked in one way and the corresponding leg in another on the same day This arrangeshyment keeps the composition of the meat essentially the same for each comparison of two methods of cooking and so reduces the number of variables in an experiment
OVENmiddotTJoMPERATURE VARIATIONS
As already stated for method 1 lamb or mutton was seared for 20 minutes at an average oven temperature of 265deg C then the cooking continued very slowly at 125deg until the thermometer inserted in the meat registered 76deg From the 749 legs of lamb roasted by this method and sUlmnarizeu in table 3 the 18 Cull grade legs were omitted as not representative of the lamb ordinarily found on the market Tills leaves 731 of Choice through Common grade ripened for an average-of 10 days Shrinkage data and cool~ing t~e were averaged for these 731 samples and are presented graphically ill figures 1 and 2
16 TECHNICAL BULLETIN 440 U S DEPl OF AGRICULTURE
group A Data for three other groups of legs of lamb cooked by this method are also shown in figures 1 and 2 B 0 and D These groups contain respectively 20 8 and 21 legs of lamb in part the mates of samples reported in table 3 Table 6 contains data on another group
METHOD OF i ICOOKING LAMB COOKED TO 76 middotcJ
731 SINGLE LEGS JMETHOD I A WI~~~~-r-~OVEN 26~ t 20 MIN
F~ISH ~i~ii~i===_a -OVEN 26~ middotc 20MIN 6 125 middotC FOR FINISH
20 PAIRS OF LEGS
OVtN 265 middotC 20MIN 6METHOD 2 ~iiiiF~--i- 150 middotC FOR FINISH
LAMB COOKED TO 83 middotC
METHOD 5 OVEN 265 middotc 20 MIN 125 middotC FOR FINISH
o 5 10 15 bull 20 25 30 SHRINKAGE (PERCENT)
_ TOTAl LOSS ~ EVAPORATION lOSS ~ DRIPPINGS LOSS
FIGURE I-Avernge sllrinklige oC scverallots oC lamb legs during rOllSting as alTected by variations in oven temperalture and in cooking to dllTerent stages oC doneness The losses are expressed as percent oC the weight oC the uncooked cut
of legs of lamb cooked by method 1 Since the pairs of legs were cooked to compare different oven temperatures they are discussed in detail below
Nine left legs of mutton were cooked by method 1 as reported in table 4 The ripening period ranged from 4 to 9 days averaging 6 When the figures for shrinka~e and cooking time were averaged the following results were obtarned Evaporation loss 117 percent
17 SHRINKAGE DURING ROASTING OF LAMB
drippings loss 38 percent total loss 154 percent minutes per pound 306 Method 2 employs the same searing and the same meat temperature
as illethod 1 but for the oven temperature uses 1500 C for the finish The two methods were compared on pairs of le~s of lamb and mutton to show the effect on shrinkage and cooking tune when the finishing oven temperature was raised from 1250 to 150deg Twenty pairs of legs of lamb and four pairs of legs of mutton were cooked by these two methods Four pairs of the lamb legs came from graded carcasses (table 3) The remaining 16 pairs were from ungraded carcasses
METHOD OF COOKING I LAMB COOKED TO 76 middotc
METHOD I 731 SINGLE LEGl I OVEN 265 c 20 MIN A 12SC FOR FINISH
METHOD I I I I
OVEN 265 middotC 20 INB 125degC FOR FINISH
20 PAIRS OF LEGS METHOD 2 I OVEN 265dege 20 MIN B 150 middotc FOR FINISH I IMETHOD I ovrN 265 middotC 20 MIN C125 C FOR FINiSH
8 PAIRS OF LEGS METHOD 3 CI OVEN 265 c 20 MIN 175C FOR FINISH IMETHOD I J OVEN 265 C 20MIND125 aC FOR FINISH
21 PAIRS OF LEGS METHOD 4 I OVENt75 c CONSTANT D
LAJ COOKED TO 83middotCj 2~ SINGLE LEGS I IMETHOD 5
OVEW265C20MIN E -shy125C fOR FINISH
METHOD 5 I I I I I OVEN 26SmiddotC 20 MINF125 aC FOR FINISH
10 PAIRS OF LEGSMETHOD 6 OVEN 265 Cbullbull 20 IN 175degC FOR FINISH
FI
J I I o 10 20 30 40 50 60
COOKING TIME (MINUTES PER POUND)
FIOURE 2-A verago time required (or heat to penetrate Inmb legs ronsted by vnrious mothods nnd to various degrees of donencss rho cooking time is expressed us minutes per pound of the uncooked cut
but finish grades assigned in the cooking laboratory indicated that all were of a moderampte to a very high degree of fatness except 1 pair which probably would have been graded Common The ripening period ranged from 4 to 9 days and averaged 7 Shrinkage and cooking time of the 20 pairs of legs were averaged for the two methods of cookshying und are shown graphically in figures 1 and 2 as groups Band B f
bull
Of the four pairs of mutton legs the left legs cooked by method 1 are reported with five others in the first section of table 4 and their mates cooked by method 2 appear in the second section of the table The ripening period ranged from 4 to 5 days Following are the averages respectively for the four pairs of legs of mutton cooked by
18 TECHNICAL BULLETIN 440 U S DEPT OF AGRICULTURE
methods 1 and 2 Evaporation loss 134 and 161 percent drippings loss 36 aItd 41 percent total loss 169 and 203 percent minutes per pound 328 and 268
According to method 3 lamb and mutton were seared the same as in method 1 and cooked to the same stage 76deg C but the fInishing oven temperature was 175deg instead of 125deg Eleven pairs of lamb legs and five pairs of mutton legs were cooked by these two methods to show the effect on shrinkage and cooking time of raising the oven temperature from 125deg to 175lt) for the finish after searing Table 3 repo)ts data on the 11 legs of lamb cooked by method 3 Omitting the 3 pairs of Cull grade samples the remaining 8 pfLirs averaged 8 days ripening Shrinkage and cooking time for the 8 pairs cooked respectively by methods 1 and 3 are shown graphically in figures 1 and 2 groups 0 and 0 The 3 pairs of Cull grade lamb legs were ripened 7 days on the avemge SlUinkgge and cooking time for these 3 pairs of Cull grade legs cooked by methods 1 and 3 averaged respecshytively as follows Evaporation loss 113 and 118 percent drippings loss 07 and 13 percent total loss 120 and 131 percent minutes per pound 494 and 264
Of the five pairs of legs of mutton the right legs cooked by method 3 were reported in the third section of table 4 and the lefts cooked by method 1 included in the first section of the same table The ripening period averaged 7 days The shrinkage and cooking time for the five pairs of mutton legs cooked by methods 1 and 3 averaged respecshytively as follows Evaporation loss 104 and 152 percent drippings loss 39 and 46 percent total loss 143 and 198 percent minutes per pound 289 and 195
Method 4 employed a constant moderate oven temperature 175deg C without searing and the lamb was cooked to 76deg internal temperashyture Twenty-five pairs of legs of lamb were used to compare method 4 with method 1 Table 3 contains data on the 25 legs that were cooked by method 4 When the 4 pairs of Cull grade Iamb legs were omitted the ripening period of the remaining 21 pairs averaged 8 days so far as information is available (p 12) The data for shrinkage and cooking time were averaged for the 21 left leg ooked by method 1 and for their mates cooked by method 4 and are shown gll1phically in figures 1 and 2 as groups D and D When the four puirsof Cull grade lamb legs ripened 8 days were averaged to show shrinkage and cooking time for the two methods of roasting the following results were obtained respectively for method 1 and method 4 Evaporation loss 106 and 93 percent drippings loss 18 and 20 percent total loss 124 and 113 percent minutes pel pound 434 and 344
Prior to the adoption of the standard laboratory method for palatashybility tests lamb was cooked well done to 83deg C (method 5) By this method the legs were seared either for 35 minutes at 250deg or for 20 minutes at 265deg Since the two Iilearing methods did not appear to affect the shrinkage differently no distinction is made here After searing the finishing oven temperature was 125deg Twenty-three single legs of lamb were corlwd by this method Eleven legs were from carcasses graded Choice Good Medium find Common The remaining 12 were not graded The ripening period for 21 of the 23 legs langed from 3 to 10 dRYS averaging 7 The shrinkage and cookshying time were averaged for the 23 legs and the lCsults are shown
------------
SHRINKAGE DURING ROASTING OF LAMB 19
graphically in figures 1 and 2 as group E The 10 single legs of lamb cooked by method 5 for which shrinkage and cooking time are shown graphically in figures land 2 group F are included in the group of 23 and are discussed in detail below
According to method 6 lamb was seared the same as by method 5 and cooked to the same stage 83deg 0 but the finishing oyen temperashyture was 175deg Ten pairs of legs of lamb were roasted by methods 5 and 6 to show the effect on shrinkage and on cooking time caused by raising tha oven temperature for the finish from 125deg to 175deg for wellshydone lamb Eight pairs were from carcasses graded Ohoice and Good (table 3) and were ripened for an average of 8 days The remaining two pairs were from ungraded carcasses of unknon ripening period The data for sluinkage and cooking time of the 10 pairs were averaged for the two methods of cooking nnd are shown graphically in figures 1 and 2 as ~roups Fend F
Accordrng to method 7 lamb was cooked the same as in method 1 except that it was not seared Ten pairs of legs of lamb were roasted by methods 1 and 7 to show the effect of searing on sluinkage and cooking time Eight pairs were from Good grade carcasses and ripened for an average of 8 days The remaining two pairs were from carcasses graded Medium but since they were purchased at a market their ripening period was not known The data for shrinkage and cooking time of the 10 pairs were averaged for the two methods of cooking and fire shown in table 6
TABLE 6-Effect of searing on shrinkage and cookinr ii7lle of paired lamb leg8when roasted to 76deg C internallemperalllre
Shriukage during ronsting CookingNumher nnd Weight 01Roasting method and oven timedescription uncookedtemperature per01 sllmples leg gvaporlmiddot prlp Total poundtlon ptngs
Gram Percent Percent Percent [nult8Method I 2650 C lor scaring 1250 lor 10 leltbullbullbullbullbull 2058 108 40 157 303
finishingMethod 7 1250 C cntire timo bullbullbullbullbullbullbullbullbull 10 right bullbullbullbullbull 2OJI 34 118 447841 Dlffcrence -3~ +24 +15 +30 -54 Standllrd error of the dIlTerence _ 118 0 144 127 163 11 77
Before discussing the effect of varying the oven temperature attenshytion is called to the data for the four groups of lamb legs in figures 1 and 2 designated as A B 0 and D and the seared group in table 6 Although all were cooked by method 1 they show discrepancies in sluinkage and also in cooking time as minutes per pound If the groups Band D and the seared group in table 6 had been ripened 10 days on the average instead of 7 or 8 it is believed that the shrinkage and cooking time would have been nearer to the values shown for group A The shrinkage of group a was unaccountably low for lamb ripened 8 days
To show the effect of varying the oven temperature on the shrinkshyage and cooking time of lamb and mutton the means of the paired samples in groups Band B a and 0 D and D and F and pi also for the two groups each of Oull grade lamb and of mutton of several
20 TECHNICAL BULLETIN 440 U B DEPT OF AGRICULTURE
grades and for the seared and unseared groups in table 6 were tested for significant differences as described on page 7 In addition the differ~nces between means were further checked by comparing them with allowances for experimental tlrror (p 8)
Results showed that for lamb and mutton of Choice through Comshymon grade when cooked to an internal temperature of 76deg C the higher oven temperatures employed in methods 2 aud 3 caused greater shrinkage than method 1 and cooked the meat more quickly
On comparing method 4 with method 1 (groups D and D) lamb of Choice through Common grade roasted at a constant moderate oven temperature 175deg C shrank more than when it was first seared at 265deg and then finished at 125deg This finding is significant The data in table 6 show that searing itself not only does not decrel1se the shrinkage of roasts as was once thought but actually increases it with the drippings loss increased proportionately more than the evaporation loss In the case of method 1 and method 4 however a method that included searing caused If1SS shrinkage than a constant temperature roasting method The data in groups D and D suggest that method 4 gave higher average temperature than method 1 From these results it appears that in roasting meat shrinkage is affected more by average oven temperature than by initial searing
Cull grade lamb again proved different from the higher grades tIllS time in response to variations in oven temperature during roasting Whereas Choice Good Medium and Common grade lamb when cooked to 76deg C internal temperature shrank more as the oven temperature was raised from 125deg to 175deg Cull lamb treated similarly did not shrink significantly more at the higher temperatures It appears that the time in the oven had some effect on the shrinkage smce Cull lamb took proportionately much longer to cook at 125deg than at hlgher oven temperatures
For lamb of Choice and Good grades cooked to 83deg C raising the oven temperature from 125deg to 175deg for the finish after searing did not increase the shrinkage significantly according to the comparison of methods 5 and 6 in groups F and F figure 1 Thls is a different result from the comparison of methods 1 and 3 although in the two experiments the same oven temperatures were contrasted The findshying with respect to lamb cooked to 83deg is significant because it is contrary to the general belief that a low oven temperature always holds down the shrinkage of meat That the long time required to cook lamb well done in a very slow oven decidedly affected the shrinkage is clear from the data in groups J and F figure 2
MEAT TEMPERATURE VARIATIONS
Method 5 and method 1 differ only in the stage to whlch lamb is cooked respectively 83deg and 76deg C Although there were no pairs of legs of lamb cooked by these two methods there were several groups containing unrelated samples namely groups A B 0 or D for method 1 and E or F for method 5
Similarly the shrinlmge and cooking time of group 0 cooked by method 3 can be compared with those of the unrelated group F cooked by method 6 figures 1 and 2 These two methods also differ only in the stage to which lamb is cooked respectively 83deg C for method 6 and 76deg for method 3
21 SHRINKAGE DURING ROASTING OF LAMB
Statistical treftment is not necessary to show the obvious enects 011 shrinkagp8nd cooking time brought about by varying the stage of dbneness or internal meilt temperature For the two groups 0 and F however the cooIng time was compared br Fishers method (2~ pp114-118) The difference between the mean) was further checked by comparison with allowances made for experimental error (p 8)
According to the results lamb roasted well done 83deg 0 shralk much more thanllnb roasted only to the medium-tcwell-done stage 76deg The increase in the shrinkage associated with raising the meat temperature from 76) to 83deg was almost 100 percent when the low oven temperature of 125deg was used for finishing after searing as in methods 1 and 5 Figure 2 shows that the cooking time was also greatly increased in fac~ in many individual cases it was doubled These groups as already noted were made up of unpaired legs of lamb so they differed in composition hence the difference in shrinkage and cooking time cannot be ascribed entirely to method of cooking In addition there were some cases where the grade composition was not known This probable dissimilarity makes it impossible to esti mate how much of the difference might be attributed to grade but it is believed to be relatively small
Similarly an allowance should be made for the effect of the comshyposition of the meat on the shrinkage and cooking time for lamb cooked to 83deg O and only to 76deg when the oven temperature was moderate or 175deg for the finish after searing as in methods 6 and 3 In this lase the data for lamb cooked to 83deg showed a 60 percent increased shrinkage over lamb cooked to 76deg With the higher oven temperatures used in methods 6 and 3 little longer time is required to raise the meat temperature from 76deg to 83deg In groups 0 and F of figure 2 the difference between the means is insignificant but since the groups were small and the legs were not paired the results are not conclusive for cooking time
RESULTS OF EXPERIMENTS ON COOKING METHOD
Summing up these experiments on the effect of method of cooking on the shrinkage of lamb and mutton the results show that the oven temperature the stage of ltloneness and the length of time required to bring the meat to any plrticular stage of doneness all combined to influence the shrinkage during roasting The lower the oven temshyperature the longer was the time required to cook the meat to a parshyticular stage of doneness as would be expected The more thoroughly the meat was cooked the longer was the time required as would also be expected Low oven temperatures held down shrinkage except when the time required was excessively long in proportion to the weight of the roast The lower the oven temperature the less was the shrinkage of lamb cooked medium to weH done 76deg 0 except for the small lean legs of Cull grade lamb They required proportionately much longer time to cook in a very slow oven (125deg after searing) than in a moderate oven (175deg after searing) and showed no significant difference in shrinkage Also for lamb cooked well done (83deg) shrinkshyage was not significantly different at these same oven temperatures because 1 hour per pound was required when 125deg was used as the finish after seaimg whereas only half as long was needed when seared roasts were finished at 175deg
22 TECHNICAL BULLETIN 440 U S DEPT OF AGRICULTURE
ESTIMATING SHRINKAGE AND COOKING TIME OF LAMB AND MUTTON ON THE BASIS OF EXPERIMENTAL REBULTS
Of special interest to meat producers and to those consumers who are looking for pointers on selection is the shrinkage expected of the different grades of lamb According to infOlmntion from the Division of Livestock Ments and Wool of the Burenu of Agriculturul Ecoshynomics the bulk of the market supply of lnmb reaches the consumer 7 to 10 dnys after slaughter and consi8ts of Oholce middotGood and Medium grades with the greatest number falling in the lower third of the Good grade
he datn in table 3 indicate thnt 101 HiS logs of Ohoice grade lamb ripened for an average of 9 days prepnred for roasting with the fell on and without seasoning and roasted by method 1 in 95 percent of trifls the average total loss of weight would full between 15 and IG percent Similarly for 389 Good grade lamb legs ripened for an average of 10 days the ~talloss of weight would be about 14 percent and for 142 legs of Medmm grade lamb aged 11 days on the aVCIftge from 12 to 13 percent It is roughly estimllted for lamb of Common and Oull grades when ripened for an average of 10 days and cooked by method 1 that the total loss of weight will fall between 11 and 12 percent
The time required to cook Ohoice Good and Medium grude lamb legs by method 1 is estimated to Itverage 34 to 35 minutes per pound but varies considerably for individunllegs It is exceedingly difficult to predict cooking time for low-grade lamb when this method of cookshying is llsed but 40 to 45 minutes per pound is reasonable
There were so few legs of Inmb in each of the seyernl carcass grades when other methods of cooking were used as appenrs in table 3 that estimates by grades are not nttemptcd
Having shown that ripening has It definite effect on shrinkage and cooking time the writers ofler here estimates of slllinkage and cooking time based or averages of five groups of legs of lamb cooked by metbod 1 at different periods of ripening The ripening periods averaged 4 8 10 11 and 17 days respectively for GO samples (tllble 2) 51 (from groups B 0 and D figs 1 and 2 and the seared group in table 6) 731 (table 3 and group A figs 1 and 2) 93 (table 1) and 60 (table 2) From the datil it is estimated thnt for 60 legs of lamb lllcluding 29 Ohoice grade 2G Good 3 IV[edium and 2 Common ripened 4 days and cooked by method 1 shrinknge may be expected in 95 percent of trials to vary from 15 to 16 percent Similarly for 511egs of lamb ravging in grade from Ohoice to Common nvernging between Good and Medium and ripened 8 days the shrinkage is estimnted at 14 to 15 percent for 731 legs of lamb ranging in grade from Choice to Common (table 3) averaging Good grade and ripened for an ayershyage of 10 days at 14 percent for 03 legs of lamb made up of 21 of Choice 50 of Good 2i of Medium and 1 of Oommon grode ripened for an average of 11 days at 13 percent and for 60 Jegs of Iamb mainly Ohoice to Good as already noted ripened for an avernge of 17 duys at 13 percent
Oooking time as minutes per pound is estimated for groups of tho composition of the aboye respectively at 38 to 39 37 to 39 34 to 35 31 to 32 and 35 to 37 rhe estimntcs for lamb ripened 11 and 17 days are not believed to be typical Iowever they serve well to call attention to the fact thnt although longer ripening makes lamb cook
SHRINKAGE DURING ROASTING OF LAMB 23
faster thergt3 are other ~actors involved also and it is not possible to make close estimates for individullllegs on the basis of a certain numshyber of days of ripening In fact so far no satisfactory bnsis has been found for close estimates of cookin~ time for individual legs of lamb roasted by method 1 Because Hns is so method 1 is difficult even for the laboratory and is not recommended for household use Howshyever since it is the method by which the largest number of samples has been cooked it is the basis for estimating the shrinkage and cookshying time for the other methods With the exception of methods 5 fLnd 7 the others are held to be more practical
For the general market supply of leg of lamb roasted by methods 2 3 4 5 6 and 7 estimates of shrinkage and cooking time are very rough because they are based on small samples respectively groups B 0 D E and F in figures land 2 and the nnsealed group in table 6 WIlen method 2 is used the shrillkage is predicted to ran~e beshytween 15 and 18 percent and the cooking tirne from 25 to 27 mmutes pel pound on the average
For leg of lamb roasted by method 3 shrinkage is estimated at 17 to 20 percent and cooking time at 23 to 24 minutes per pound Howshyever since the shrinkage figures are based on only eight pairs which showed rather low cooking losses they ure believed to be smaller than should OCCUI in the long run The estimnted cooking tin1e on the other hnllcl is believed to be too high bull
For Imnb roasted by method 4 shrinknge is estimated at 17 to 20 percent and cooking time at 24 to 26 minutes pel IJOlllld on the avershyage Incidentnliy as between methods 3 ttnd 4 if meat of the same composition were used the seming in method 3 would be expected to increase shrinkage 3 to 5 pltlccnt and to decrease the cooking time about 5 minutes per pound
For leg of lamb cooked well done 83deg C by methods 5 uno 6 shrinkage is estimated at 25 to 30 percent whetlltll the finishing tempemtme nIter searing is 125deg 01 175deg Cooking time is estinmted at 1 hour pCI pound for metbod 5 und hulf nn hour pel pound for method 6
For leg of 111mb roasted by method 7 shrinkage is estimated at 10 to 11 percent and cooking time at 39 to 41 minutes pel pound
rho number of mutton samples was too small to provide a reliable busis for predicting shrinkage and cooking time but as far as cun be judged from the data leg of mutton will shrink somewhat more than leg of lamb of the same gmde and cook more quickly in proportion to its weight This is contrary to a general belief that larger pieces of meat shrink proportionately less than do small ones but is in accord with the belief that very large cuts cook faster in proportion to their weight
SUMMARY AND CONCLUSIONS
The influence of carcass grade period of ripening and method of cooking 011 the shrinkage (loss of weight) and rate of heat penetrashytion during roasting was determined in a series of e~-perinlents on 1185 legs of 111mb and mutton including Choice Good Medium Commoll and Cull gmdes ripening periods of from 2 to 24 days after slaugllter nnd seven diflerent cooking methods Studies on cooking method included variations in oven temperature and variashy
24 TECHNICAL BULLETIN 440 U 8 DEPT OF AGRICULTURE
tions in the stage of doneness to which lamb was cooked as detershymined by a roast-meat thermometer Oven temperature was raised from 125deg C to 175deg for the finish after 20 minutes searing at 265deg and the effects on shrinkage and cooking time compared and conshys~~nt-temperature roasting at 125deg and at 175deg was compared with the sear at 265deg plus finish at 125deg Also the lamb was cooked to two stages 76deg medium to well done and 83deg well done
A preliminarv study was made to determine what is a significant difference in shrinkage and cooking-time data for averages of 10 20 and 93 legs of lamb roasted by the standard laboratory method used forynlatability tests in the cooperative meat inv8stigations
The hIgher the ~rade of lamb and mutton the greater was the shrinkage due mamly to the rendering out of more fat into the drippings from the better finished high-grade meat Since pan dripshypings are usually made into ~ravies and sauces they do not necesshysarily represent a loss of nutntive value Although drippings someshytimes contain more fat than can be used tIllS excess fat should not be looked upon as cooking waste becl1use it probably would not have been eaten even if it had been retained by the roast Whereas dripshypings loss decreased with grade the water lost by evaporation during roasting did not follow grade consistently CholCe Good and Medishyum legs of lamb cooked more rapidly in proportion to their w3ght than lamb of Common and Cull grades
Increasing the length of the ripening period after slaughter deshycreased the cqoking shrinkage and shortened the time required to roast leg of lamb As the ripening period of lamb increased beyond 2 days after slaughter the cookinamp shrinkage became smaller and the rate of heat penetration more rapId The decrease in loss of weight in tlie oven is of special interest because it offsets to some extent the loss of weight in the cooler during storage No studies were made on fuel consumption in relation to ripening but of course with faster heat penetration there would be less fuel required per pound of meat cooked
Among the studies on oven-temperature variations as influencing shrinkage the comparisons of the constant low and constant modershyate temperature methods with a method that includes an initial sear and a slow finish are of special interest The average oven temperashyture for the combination of 2650 C for 20 minutes searing and 125deg for finishing was higher than 125deg the constant low temperature used There was it difference of 4 percent in the shrinkage of lamb le~s roasted by these two methods and the smaller loss was associated WIth the lower average cooking temperature That is to say the unseared legs shrank less In contrast the average oven temperashyture for the combination of 265deg for 20 minutes searing aud 121)deg for finislling was lower than 175deg the constant moderate temperature used Again there was a difference of 4 percent in the shrinkage of lamb legs roasted by the two methods and the smaller loss was associated with the lower average cooking tem~erature which howshyever in this case included an initial sear TIlls time the unseared legs shrank more TIllS goes to show that searing in itself does not reduce shrinkage as was once thought but actually makes a roast lose more weight though the lxtra loss is mainly fat The signifishycance of these results lies in the fact that it is the average oven temshy
25
i ~ j
SHRINKAGE DURING ROASTING OF LAMB
perature which has more influence on shrinkage than does the initial sear
As a whole the studies show that the lower the oven temperature the smaller was the shrinkage of leg Of lamb cooked to the mediumshyto-well-done stage (76deg C) At the lowest oven temperature used constant 125deg the shrinkage averaged 12 percent and the cooking time 45 minutes per pound When lamb l~gs were first seared and then finished at different oven temperatures at the lowest finishing temperatur3 125deg tho meat shrank 13 percent while at th~ highest 175deg the shrinkage averaged 17 percent The cooking time ranged from an avernge of 36 to un average of 24 minutes per pound respectively
In contrast when leg of lamb was cooked well done (83deg C) by these same oven temperatures 125deg and 175deg following searing the shrinkage was not significantly different averaging 27 percent The cooking time averaged 60 minutes per pound by the former method and 25 by the latter Without doubt the time influenced the shrinkage
These tests on the influence of cooking method showed that the stage to which leg of lamb was cooked made more difference on the shrinkage than the oven temperature that was chosen The results bring out an important point in meat cookery with respect to controlling shrinkage The stage of doneness to which meat is cooked in roasting may make more difference on the shrinkage than the specific oven temperature used This is a good argument for the use of a roast-meat thermometer in addition to an oven thermometer because the meat thermometer shows when the desired stage of doneness is reached and prevents overcooking and excessive shrinkage
On the basis of experimental data estimates of shrinkage and cooking time were worked out to apply to lamb and mutton as the consumer is likely to find it on the market when cooked by the methods described in this bulletin
LITERATURE CITED
(1) DAVIS W C and BURGESS J A 1927 MARKET CLASSES AND GRADES OF DRESSED LAMB AND MUTTON
US Dept Agr Bull 1470 48 pp illus (2) FISHER R A
1932 STATISTICAL METHODS FOR RESEARCH WORKERS Ed 4 rewritten and en 307 pp illus Ediuburgh and London
(3) GRINDLEY H S and MOJONNIER T 1904 EXPERIMENTS ON LOSSES IN COOKING MEAT 1900-1903 US
Dept Agr Off Expt Stas Bull 141 95 pp (4) MCCANCE R A and SHIPP H L
1933 THE CHEMISTRY OF FIESHFOODS AND THEIR LOSSES ON COOKING [Gt Brit] Med Research Council Spec Rept Ser 187146 pp illus
(5) SPENCER D A 1929 JUDGING COOKED MEAT Amer Soc Anim Prod Proc 1928
119-121 (6) WARNERK F and ALEXANDER L M
1932 LAMB BECOMES MORE TENDER WHEN RIPENED BY PERIOD OF STORAGE US Dept Agr Yearbook ]932 260-263 illus
(7) WEBER A D LOEFFEL W J and PETERS M 1931 LENGTH OFFEEDINO PERIOD AND fLANE OF NUTRITION AS FACTORS
IN LAMB IEEDING Nebr Agr Expt Sta Bull 262 39 pp illUB
i
26 TECHNICAL BULIETIN 440 U B DEPT OF AGRICULTURE
STATEMENT OF COOPERATION
The data reported in thi3 bulletin were obtained from experiments conducted by thE) Bur6~us of Animal Industry Agricultural Ecoshynomics and Home Economics of tl1e United States Department of Agriculture and agricultural experiment stations of the following States Indiana Maryland Mississippi New Mexico New York Tennessee and West Virginia
Responsibility for the various phases of the work was as follows Administration For the Department of Agriculture E W Sheets
and O G Hankins Bureau of Animal Industry O V Whalin Bureau of Agricultural Economics and Louise Stanley Bureau of Home Economics For the Indiana (Purdue University) Agriculshytural Experiment Station J H Skinner and F G King For the Marylana Agricultural Experiment Station DeVoe Meade and B E Carmichael For the Mississippi Agricultural Experiment Station G S Templeton and D S Buchanan For the New Mexico Agricultural Experiment Station Fabian Garcia For the New York Agricultural Experiment Station F B Morrison For the Tennessee Agricultural Experiment Station O A Mooers For the West Virginia Agricultural Experiment Station E A Livesay
Production For the Department of AOriculture Bureau of Animal Industry D A Spencer O G Potts V L Simmons W A Denecke J M Oooper John A Stoehr Stanley L Slnith James O Grandshystaff For Indiana (Purdue University) Agricultullll Experiment Station Olaude Harper For the Maryland Agricultural Experiment Station W E Hunt For the Mississippi AgricultulIll Experiment Station H H Leveck For the New Mexico Agricultural Experishyment Station J L Lantow For the New York (Cornell University) Agricultural Experiment Station R B Hinman For the Tenshynessee Agricultural Experiment Station Moses Jacob For the VYest Virginia Agricultural Experiment Station Chilres V Wilson
Grading carcasses For the Department of Agriculture L B Burk and M T Foster Bureau of Agricultural Economics A T Edinger Bureaus of Agricultuml Economics and Animal Industry B F BlI1ndon O G Potts V L Simmons D A Spencer and K F Warner Burenu of Animal Industry For the Indiana (Purdue University) Agricultural Experiment Station Olaude Harper For the Maryland Agricultural Experiment Station W E Hunt For the Nmv York (Oornell University) Agricultural Experiment Stashytion O D Schutt
Ohemical analysis Paul E Howe and N R Ellis Bureau of Animal Industry
Oooking tests Lucy M Alexander Bureau of Home Economics Nancy Griswold Olarkl Bureau of Animal Industry
ORGANIZATION OF THE UNITED STATES DEPARTMENT OF AGRICULTURE WHEN THIS PUBLICATION WAS LAST PRINTED
Secretary 0 Agriculture___________________ Under Secretary ________ ________________ Assistant Secretary _______________________ Dlrector 0 Extension Work _______________ Director 0 PersonneL ____________________ Director 0 Tnormation___________________ Director 0 Finance ______________________ Solicitor________________________________
Agricultural Adjustment Administration_ _ _ _ Bureau 0 Agricultural Economics __________ Bureau 0 Agricult1lral Engineering ________ Bureau 0 Animal Industry _______________ Bureau 0 Biological Survey _______________ Bureau 0 Ohemistry and Soils _____________ Office of Oooperative Extension Work ________ Bureau 0 Dairy Industrll _________________ Bnreau 0 Entomology and Plant Quarantine_ Office 0 EX1Jeriment Stations ______________ Food and Dr1tg Administration____________ Fores Service ___________________________ Grain Futures Administration _____________ Bureau 0 Home Econommiddotics _______________ Library ________________________________ Bureau 0 Plant Industry _________________ Bureau 0 Public Road~__________________ Weather Bureau _________________________
HENRY A WALLACE
REXFORD G TUGWELL
M L WILSON
C W WARBURTON
W W STOCKBFRG0R
M S EISENIIOWER W A JUMP SETH THOMAS
CHESTER C DAVIS Administrator NIlS A OLSEN Ohie S H MCCRORYOhie JOlIN R MomER Ohie J N DARLING Ohie H G KNIGHT Ohie C n SMITH Ohie O E REED Ohie LEE A STHONG OTtie JAMES T bullbullJARDINE Ohie WALTER G CAlIUBELL Ohie FERDINAND A SILCOX Ohie J W T DUYEL Ohie LOUISE STANLEY Ohie CIAfUBEL R BAitNETT Librarian KNOWLES A RYERSON Ohie THOMAS H MACDoNALD Ohie WILLIS R GUEGO Ohie
TlliH bulletin is n joint contribution from
Bureau 0 Home Economics _______________ LOUISE STANJEY Ohic Foods and Nutrition Division ______ ____ LOUISE STANLEY Acting in Oharge
Bureau 0 Animallnrlutry_______________ JOHN R MOHLER Ohie Animal Husbandry Division __________ E W SHEETS Ohic
27
u~ 5 GOVERNMENT PRINTING OfFICE1934
For sale by the Superintendent 01 Docwnents Washington DC bull bull bullbull bullbullbullbullbull Price 5 ~nts
t
r-_=~_ _ --- ---~---
I
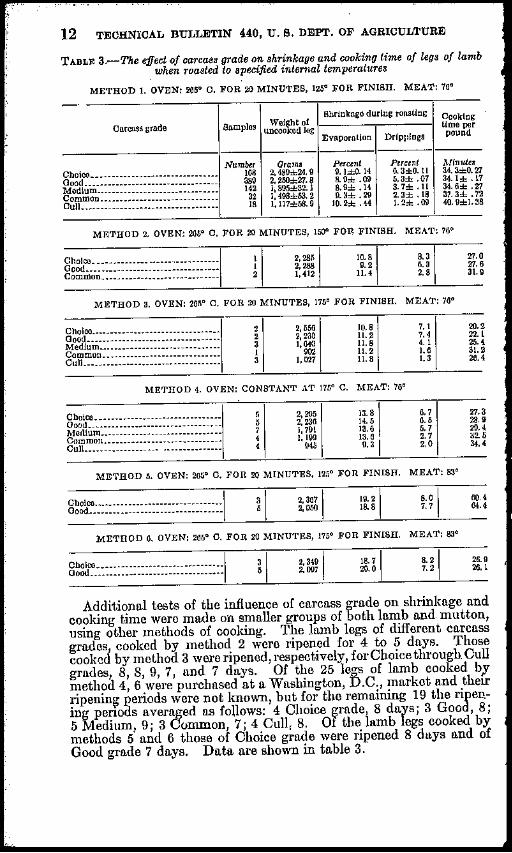
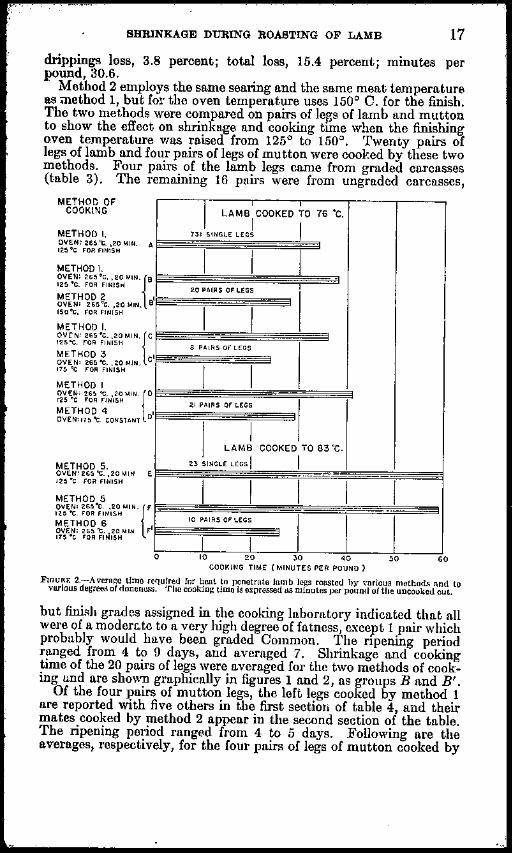

t
r-_=~_ _ --- ---~---
I